Vol.0 (2020) No.0, 000–000
22institutetext: School of Physics and Astronomy, Sun Yat-Sen University Zhuhai Campus, Tangjia, Zhuhai, 519082, China; zhangyong5@mail.sysu.edu.cn
33institutetext: Yunnan Observatories, Chinese Academy of Sciences, Kunming 650216, China
Discovery of Extended Structures around Two Evolved Planetary Nebulae M 2-55 and Abell 2
Abstract
We report a multi-wavelength study of two evolved planetary nebulae (PNs) M 2-55 and Abell 2. Deep optical narrow-band images ([O III], H, and [N II]) of M 2-55 reveal two pairs of bipolar lobes and a new faint arc-like structure. This arc-shaped filament around M 2-55 appears a well-defined boundary from southwest to southeast, strongly suggesting that this nebula is in interaction with its surrounding interstellar medium. From the imaging data of Wide-field Infrared Survey Explorer (WISE) all-sky survey, we discovered extensive mid-infrared halos around these PNs, which are approximately twice larger than their main nebulae seen in the visible. We also present a mid-resolution optical spectrum of M 2-55, which shows that it is a high-excitation evolved PN with a low electron density of 250 cm-3. Furthermore, we investigate the properties of these nebulae from their spectral energy distributions (SEDs) by means of archival data.
keywords:
infrared: ISM – ISM: structure – planetary nebulae: individual (M 2-55 and Abell 2) – stars: AGB and post-AGB1 Introduction
As descendants of asymptotic giant branch (AGB) stars, planetary nebulae (PNs) are important objects to understand galactic abundance distribution and the ending of stellar evolution of low- and intermediate-mass stars. When infrared (IR) technique was first developed, the PN NGC 7027 was found to have a strong excess in the IR, far above the continuum level expected from thermal free-free emission (Gillett et al. 1967). This excess was soon identified as due to thermal dust emission. From the fact that PNs are descendants of AGB stars, Kwok (1982) predicted that the remaining circumstellar dust envelope from AGB stars should be commonly detectable in PNs. The prediction were confirmed by the Infrared Astronomical Satellite (IRAS) observations, where over 1000 PNs were detected (Pottasch et al. 1984). The relative contributions from the stellar, nebular free-bound (f-b) and free-free (f-f) components, and dust continuum emissions in PNs have been analyzed by many researchers such as Zhang & Kwok (1991) and Hsia et al. (2014).
The faint structures around PNs in the visible have been studied in several surveys (e.g. Stanghellini et al. 1993; Corradi et al. 2003; Cohen et al. 2011). Comparing to the observations at optical wavelengths, IR observations are less likely to be affected by the interstellar extinction. Thus it is highly desirable to observe faint structures around PNs in the IR. Moreover, unlike IR emissions, optical emissions are dominated by ionized gas. Therefore, a comparison study between IR and optical images allow us to better understand the processes of dust and gas components. Recent IR surveys have revealed new structures surrounding PNs (Ramos-Larios & Phillips 2009; Zhang et al. 2012a, b), these results suggest that PNs may reveal different morphologies in the optical and IR. The Wide-field Infrared Survey Explorer (WISE) survey covers entire sky area and its sensitivity is 100 times higher than IRAS (Wright et al. 2010). Thus, this survey provides a useful tool for us to resolve PNs with higher sensitivities (Benjamin et al. 2003; Churchwell et al. 2009) and detect weak emissions from extended structures of known PNs.
Evolved PNs represent the last stage of the dispersion of stellar material into the interstellar medium (ISM). Gurzadyan (1969) first suggested that the interaction between PN and the ISM can decelerate the nebula. The observational evidence of PN-ISM interaction was later reported by Jacoby (1981). The signs of PN-ISM interactions have been found to be common among evolved PNs (Borkowski et al. 1990). To search and investigate the nebula/ISM boundary of evolved PNs can provide significant clue to study the mass-loss history of these objects and the matter enhancement in the galaxy.
The PNs M 2-55 (PN G116.2+08.5, IRAS 23296+7005) and Abell 2 (PN G122.1-04.9, IRAS 00426+5741) were first discovered and identified as evolved PNs by R. Minkowski in 1947 and Abell (1955) according to their low surface brightnesses and large angular diameters (Abell 1966). Based on early imaging studies, these objects have been classified as an irregular PN (Felli & Perinotto 1979) for M 2-55 and an elliptical nebula (Hua 1988) for Abell 2, respectively. Although their angular sizes (60) are relatively larger than most PNs ( 10–30), they are rarely paid attention in the past thirty years. After a keyword search in the astrophysics data system (ADS) for these objects, only four records are found in the literature. The distance determination of PNs has long been a difficult problem. Recently, trigonometric parallex data release (DR) of Gaia mission has induced an investigation of reliable distances for many PNs (Bailer-Jones et al. 2018), allowing us to evaluate the distances of these two PNs with a higher accuracy.
In this paper, we present the results of a multi-wavelength investigation for PNs M 2-55 and Abell 2 based on optical and mid-infrared (MIR) images taken from Lulin One-meter Telescope and WISE all-sky survey, respectively, aiming to investigate the natures of the two PNs and their PN-ISM interactions. In 2, we describe the observations and data reductions. The results of imaging and spectroscopic observations in the optical and MIR are presented in 3. An analysis of the properties of the sources by analyzing their spectral energy distributions (SEDs) are presented in 4. A discussion and conclusion are summarized in 5 and 6.
2 Observations and data reduction
| Object | Observation Date | Filter | Seeing | Exposures | ||
|---|---|---|---|---|---|---|
| (Å ) | (Å ) | (arcsec) | (s) | |||
| M 2-55 | 2018 Nov. 04 | H | 6563 | 30 | 2.1 | 60020 |
| 2018 Nov. 05 | H | 6563 | 30 | 1.7 | 180011 | |
| 2018 Nov. 07 | [O III] | 5007 | 30 | 2.3 | 18004 | |
| 2018 Nov. 07 | [N II] | 6584 | 10 | 2.6 | 18007 | |
| Abell 2 | 2018 Nov. 05 | H | 6563 | 30 | 1.8 | 18007 |
| 2018 Nov. 06 | H | 6563 | 30 | 1.9 | 18005 | |
| 2018 Nov. 06 | [O III] | 5007 | 30 | 2.2 | 18005 | |
| 2019 Oct. 13 | [O III] | 5007 | 30 | 1.8 | 18005 | |
| 2019 Oct. 16 | [N II] | 6584 | 10 | 1.4 | 18004 | |
| 2019 Nov. 16 | [N II] | 6584 | 10 | 1.3 | 18006 |
2.1 LOT Narrow-band Imaging
Narrow-band Images of these nebulae were obtained from the Lulin One-meter Telescope (LOT) on the Lulin Observatory of National Central University (NCU) on the nights of 2018 November 4 – 2019 November 16. The Lulin Compact Imager (LCI) Sophia 2048B camera with a 2048 2048 CCD was used. The CCD camera has a field of view (FOV) of 13.213.2 with an angular resolution of 0.39. These PNs were observed with three narrow-band filters: [O III] ( = 5009 Å, = 30 Å), H ( = 6563 Å, = 30 Å), and [N II] ( = 6584 Å, = 10 Å). The total exposures were ranged from 7,200 to 31,800 s for each filter of the deep observations. We process all imaging data using the IRAF software package. Dark-current correction, bias subtraction, and flat-field calibration were performed. A summary of these observations is given in Table 1. The reduced [OIII], H, and [NII] images of these nebulae are shown in Figures 1 and 2, respectively.
2.2 YFOSC Optical Spectra
The spectra of M 2-55 were obtained on the nights of December 02 – 03, 2018, with Lijiang 2.4 m telescope of the Yunnan Astronomy Observatories of China. The Yunnan Faint Object Spectrograph and Camera (YFOSC) instrument and a E2V 20484608 CCD were used. The spectral dispersion of the spectra is 1.7 Å pixel-1. The seeing conditions varied from 1.7 and 2.3 during the observing runs. The wavelength coverage of spectroscopic observations is between 3600 and 7700 Å. The aperture size of a slit is 5 1.8 and it was set through the central region of this nebula oriented toward the N-S direction. The exposures were ranged from 1800 to 11700 s and then the signal-to-noise (S/N) ratios of 75 for main nebula were produced.
The data were reduced by a standard procedure using the NOAO IRAF V2.16 software package, including background subtraction, flat-fielding, and debiasing. For flux calibration, three KPNO standard stars each night were observed. To improve the S/N ratio, the final spectrum of this nebula was produced using the spectra with individual exposures. The journal of spectroscopic observations is given in Table 2.
Gaussian line profile fitting is used for measuring the fluxes of line emissions of this object. The uncertainties of line fluxes are derived from the continuum noise level. If we consider the flux errors of the measurements, the characteristic uncertainties of line emissions are about 5 - 37.
| Object | Observation Date | Wavelength | Dispersion | Width of Slit | Integration Time |
|---|---|---|---|---|---|
| ( Å) | ( Å pix-1) | (arcsec) | (s) | ||
| M 2-55 | 2018 Dec 02 | 3600 - 7400 | 1.7 | 1.8 | 18002 |
| 2018 Dec 03 | 3600 - 7400 | 1.7 | 1.8 | 27003 |
2.3 WISE Infrared Observations
MIR images of these PNs were taken from the WISE all-sky survey. The WISE mission has imaged all sky with four bands at 3.4, 4.6, 12, and 22 m (W1–W4). The angular resolutions of the images for these four bands are 6.1, 6.4, 6.5, and 12, respectively. The data used in this paper were retrieved from the NASA/IPAC Infrared Science Archive (IRSA) 111http://irsa.ipac.caltech.edu/frontpage/..
We performed the aperture photometric measurements for these nebulae using the method described in Hsia & Zhang (2014). The fluxes measured from the WISE images of these PNs have calibrated using the color correction presented in Wright et al. (2010). To estimate the flux uncertainties, the standard deviations of systematic errors and all flux measurements are adopted. The estimated flux errors of the measurements in four bands for all objects are about 8 for W1, 9 for W2, 7 for W3, and 8 for W4 channels, respectively.
3 Results
3.1 Optical Morphology
3.1.1 Multipolar Planetary Nebula – M 2-55
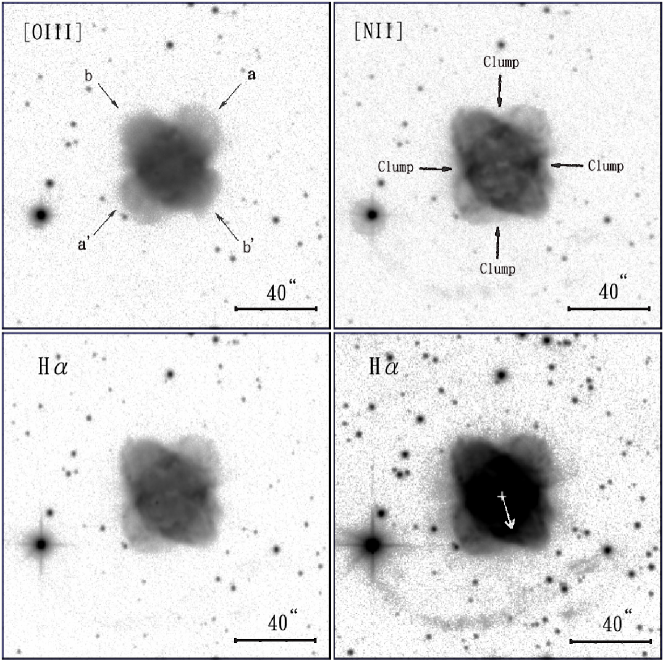
The PN of M 2-55 is originally classified as a B-class nebula with symmetrical structures (Sabbadin & Perinotto 1981). Our LOT narrow-band images (H, [O III], and [N II]) of the nebula (Figure 1) clearly show that this object is a multipolar PN with a size of 67.6, which is larger than the size of 39 measured from the optical image reported by Acker et al. (1992). The appearance of M 2-55 is similar to that of the young PN M 1-30 (see Figure 1 of Hsia et al. 2014) and can be related to the quadrupolar PN (Manchado et al. 1996). The main structure of this PN consists two bipolar lobes (labeled as and ) and they are intersecting approximately at the central region of this object as shown in the H and [N II] images (Figure 1).
From Figure 1, we can see that the edges of two bipolar lobes are sharp and they are prominent in the H and [N II] images. The central region of this nebula is mainly dominated by [O III] emission, while the lobes are more obscure in the [O III] image compared to those seen in the H and [N II] images. Several clumpy regions can be seen within the main nebula. These regions may be due to the projection of two interlaced lobes. We note that some ray-shaped structures and radial filaments pointing toward outer regions can be seen in the deep H image. They may be the result of shadows of the clumpy region in the main nebula. These features can be also seen in other nebulae such as NGC 40, NGC 3242, NGC 3918, NGC 7009, NGC 7026, and NGC 7662 (Corradi et al. 2004). The position angles (PAs) of two pairs of lobes ( and ) are measured to be PA = 1463∘ and 423∘. We measured the sizes of two lobes by fitting the shapes of these features to deep H image. Two pairs of bipolar lobes have approximately the same extent. The angular sizes of two bipolar lobes are measured to be 67.236.6 and 65.534.3 for lobes and , respectively.
Adopting a distance of 691 pc for M 2-55 (Bailer-Jones et al. 2018), the extent size is 0.23 pc for lobe , where is the inclination angle. The expansion velocity is assumed to be 20.3 km s-1 with [O III] emission (Weinberger 1989), the derived kinematic age of this nebula is about 5500 yr. This estimation is in good agreement with earlier suggestion that M 2-55 is an evolved PN (Satiō et al. 1999).
3.1.2 Arc-like Structure Discovered around M 2-55
The filamentary appearance of the halo as an observational evidence can provide that the nebula interacts with high-density ISM (Dgani & Soker 1998; Ali et al. 2012). As a PN with low density moving through its surrounding ISM, the leading region of the halo is compressed and then the arc-like/bow-shock structure forms (Ali et al. 2012).
A new arc-like filament extending to 61 from the central star of this nebula can be seen in our deep H image (see Figure 1). The filamentary feature has not been detected in previous optical images. This arc shows a well-defined boundary from SW to SE, indicating that it may be a bow-shocked structure. The existence of this arc-shaped structure may suggest the PN-ISM interaction (Ramos-Larios et al. 2018; Wareing et al. 2007), which is supported by the proper motion direction of M 2-55 with PA = 192∘ (Roeser et al. 2010). The surface brightness (SB) profile of this filamentary feature with H emission is shown in Figure 3. We made this profile from the average of the intervals between PA = 155∘ and PA = 185∘, after removing all field stars. From Figure 3, the peak surface brightness of arc-shaped structure (at the distance of 61 from the central star) is 610-2 times fainter than that of main nebula, and the feature is significantly brighter than normal AGB halo (with a SB 10-3 times fainter than main shell; Corradi et al. 2003). Adopting a distance of 691 pc (Bailer-Jones et al. 2018) and assuming a typical expansion velocity of 13.7 km s-1 for this faint structure (Gussie & Taylor 1994), the observed size of this extended structure leads to a dynamical age of 15,000 yr. This suggests that the arc-like feature can be an important event of its AGB mass-loss history.

3.1.3 Double-shell Planetary Nebula – Abell 2
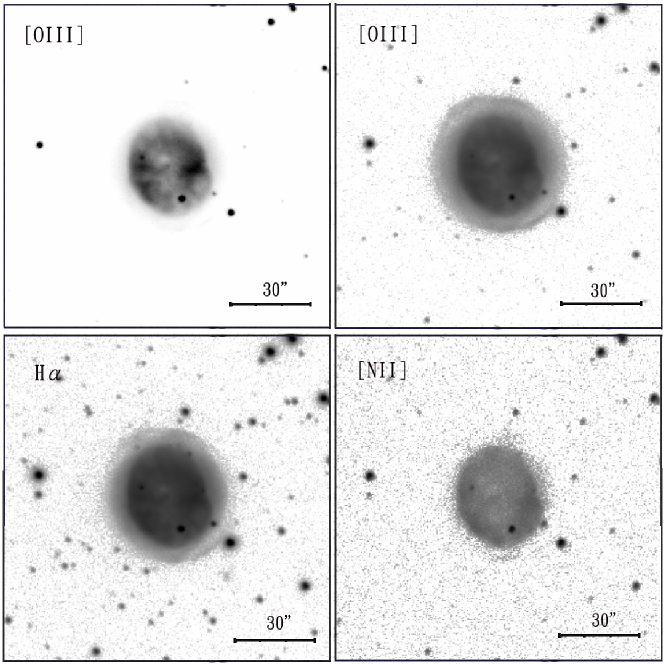
As can be seen in our narrow-band imaging, some structural features of PN Abell 2 show slightly different appearances depends on observed bands (Figure 2). A close inspection of Figure 2 shows that two concentric elliptical shells (a brighter inner shell and a diffuse outer shell) are located in the main nebula. The limb-brightening inner shell has a size of 37.431.2 and it is surrounded by a diffuse outer shell with a diameter of 52.347.6, which is larger than previously reported size of 3535 (Hua 1988). The major axes of these shells are oriented along PA = 33∘. From Figure 2, we can see that the inner elliptical shell with a clear boundary is prominent in H, [O III], and [N II] emissions, whereas the outer shell is undetectable in [N II]. These results suggest that the inner shell of this nebula is relatively lower excitation and outer diffuse shell farther away is relatively higher excitation, which is unusual among common PNs (Guerrero et al. 2018). Inside the inner shell of this nebula, a few small structural components can be seen in the [O III] and H images. The origin and formation of these structures are still unclear. It is possible that these features are produced from ionized non-uniform dense clumps. For this PN, the averaged value of nebular minor and major axial lengths as its size was adopted. At a distance of 2.82 kpc (Bailer-Jones et al. 2018), the average nebular size of this source is 0.68 pc, we obtained the dynamical age of 9,800 yr. Assuming an expansion velocity of the nebula is 34 km s-1 (Acker et al. 1992). This suggests that this nebula is indeed an old PN (Abell 1966; Hua 1988).
3.2 Extended Dust Halos around M 2-55 and Abell 2
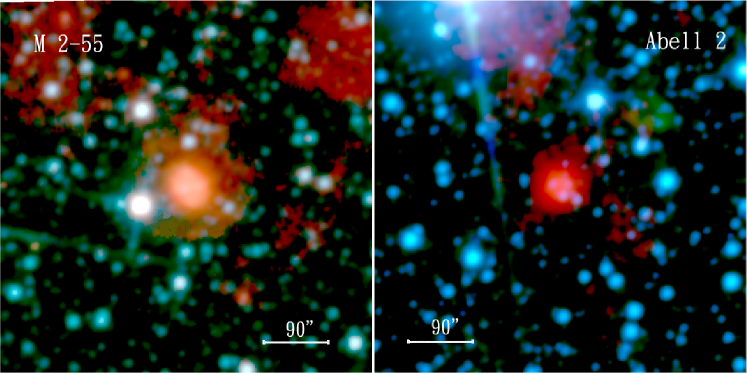
To study the dust distributions and their properties of PNs M 2-55 and Abell 2, we have analyzed the MIR images of these nebulae retrieved from the WISE all-sky survey archive. The extended halos with IR emission surrounding the objects can clearly be seen in Figure 4. The MIR images show that the colors of the field stars are bluer than those of the nebulae, which suggests that they are dusty. The halos are detectable at WISE 12 and 22 m bands, and they are brighter in the 22 m images compared to the 12 m images for these nebulae. Assuming that their emission peaks at 22 m, we infer that IR fluxes emitted from the halos of these PNs are mainly dominated by dust components with a temperature of 130 K. From Figure 4, we also note that PN M 2-55 shows lower IR surface brightness compared to PN Abell 2. In the WISE 12 and 22 m images, the central parts of these nebulae show prominent IR emissions, probably suggesting a large number of dust located in the central regions of these PNs although the emissions of [Ne V] 24.3 m and [O IV] 25.89 m may partly contribute to the fluxes of 22 m band emissions (Chu et al. 2009).
The WISE color composite image of M 2-55 (left panel of Figure 4) clearly shows that this PN has a slightly elliptical central nebula and an extended outer halo. The morphology of this nebula in the IR is different from that observed in the LOT optical narrow-band images. In this image, the central nebula is the brightest feature of this object, whereas the outer halo is 210-2 fainter. The southern part of the halo exhibits a well-defined boundary (with a size of 166), in contrast to a diffuse structure seen in the northern part of the halo. Such morphology gives an indication that this source is moving roughly toward the south direction and probably shows the PN-ISM interaction (Ramos-Larios & Phillips 2009; Zhang et al. 2012b). For Abell 2, the optical and MIR morphologies of this object are similar. Our MIR image (right panel of Figure 4) shows an almost round halo with an angular diameter of 92. The central elliptical-shaped nebula is prominent in all WISE IR images. No evidence of related extended structure is found outside the halo of this object.
3.3 Spectral Properties of M 2-55
In order to understand the spatial distributions of extended arc-shaped structure with H emission around PN M 2-55 (see Figure 1), we have carried out spectroscopic observations. However, the faint filamentary feature is undetectable in our spectroscopic observations due to its low surface brightness compared to main shells of this PN (see Section 3.1.2). Nevertheless, the properties of the main nebula can still be studied from our spectra.
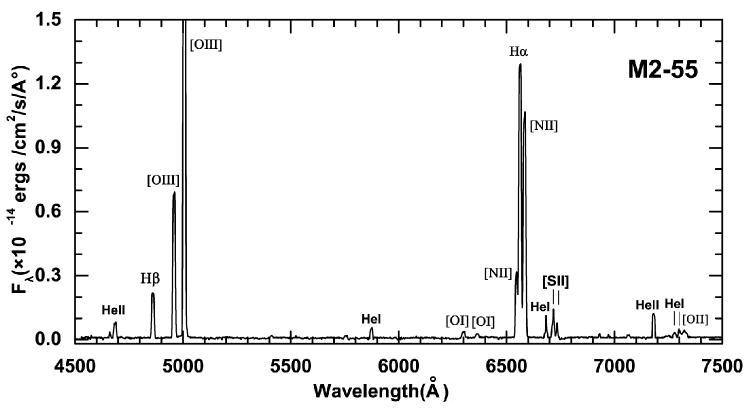
The YFOSC spectrum of PN M 2-55 is shown in Figure 5. From Figure 5, we can see that a number of emission lines are typical in PN spectra. Among the prominent emission lines detected are H at 4861 Å, H at 6563 Å, [O III] at 4959, 5007 Å, [N II] at 6548, 6584 Å, and [S II] at 6717, 6731 Å. Some weak emission features such as He I 5876, 6678, 7281, 7298, He II 4686, 7178, [O I] 6300, 6364, and [O II] 7320 can also be seen. The N(He)/N(H) and log N/O ratios (Peimbert & Torres-Peimbert 1983) suggest that the nebula is a type I PN (Peimbert & Torres-Peimbert 1983, 1987), which is believed to originate from massive progenitor star (Calvet & Peimbert 1983; Kingsburgh & Barlow 1994). The H/H flux ratio measured from M 2-55 is 5.950.48. Given the theoretical values at Te =104 K and ne = 102 cm-3 (Hummer & Storey 1987), the extinction value of c = 1.130.13 is derived by comparing the observed H/H ratio and using the reddening law with a RV = 3.1 (Howarth 1983). This extinction is in good agreement with the earlier reported value of c = 1.24 (Kaler et al. 1990).
| Identification | ||||
|---|---|---|---|---|
| Ion | Observed Fluxa | Dereddened Fluxa | ||
| (Å ) | (Å ) | |||
| 4685.54 | 4685.68 | He II | 4.41 (16.5) | 11.39 (16.5) |
| 4860.74 | 4861.33 | H | 16.81 (5.4) | 37.78 (5.4) |
| 4958.45 | 4958.91 | [O III] | 44.45 (13.8) | 96.30 (13.8) |
| 5006.31 | 5006.84 | [O III] | 137.91 (7.8) | 289.80 (7.9) |
| 5874.36 | 5875.66 | He I | 2.35 (13.6) | 3.10 (13.7) |
| 6300.03 | 6300.34 | [O I] | 2.20 (18.5) | 2.43 (18.5) |
| 6364.57 | 6363.78 | [O I] | 1.11 (36.7) | 1.19 (36.7) |
| 6547.04 | 6548.10 | [N II] | 17.24 (13.9) | 17.34 (13.9) |
| 6562.34 | 6562.77 | H | 100.00 (3.2) | 100.00 (3.2) |
| 6582.81 | 6583.50 | [N II] | 56.56 (4.7) | 56.12 (4.7) |
| 6679.13 | 6678.16 | He I | 2.76 (5.4) | 2.64 (5.4) |
| 6716.07 | 6716.44 | [S II] | 4.60 (3.7) | 4.35 (3.7) |
| 6730.39 | 6730.82 | [S II] | 3.73 (7.6) | 3.51 (7.6) |
| 7178.15 | 7177.50 | He II | 6.39 (5.0) | 5.17 (5.0) |
| 7280.68 | 7281.35 | He I | 1.22 (11.1) | 0.96 (11.1) |
| 7299.17 | 7298.04 | He I | 1.59 (8.9) | 1.24 (8.9) |
| 7321.46 | 7319.99 | [O II] | 3.07 (7.1) | 2.38 (7.1) |
0.86[a] The normalized emission fluxes (H = 100). The brackets represent the flux uncertain errors with percentage.
The measured emission fluxes are given in Table 3. Columns 1 - 3 list the observed emission wavelengths and line identifications. The normalized measured and dereddened fluxes (H = 100) of this object are listed in Columns 4 and 5. The observed integrated H flux measured from this PN is 3.7310-14 erg cm-2 s-1. From Table 3, the line ratios of [O III] 5007/4959 and [N II] 6584/6548 of this nebula are 3.0 and 3.2, respectively, which are consistent with the theoretical values suggested by Storey & Zeippen (2000). Adopting an electron temperature of = 10,200 K (Peimbert & Torres-Peimbert 1987) for this nebula and using the [S II] 6731/6717 line ratio, the electron density = cm-3 was derived. This value is in good agreement with the earlier results of 460 cm-3 (Peimbert & Torres-Peimbert 1987) and 512 cm-3 (Phillips 1998). The slight difference stems from different diaphragm sizes and slit positions. The emission ratio of log([O III] 5007+4959/HeII 4686) is an useful probe to determine the excitation class of a PN (Gurzadyan 1988). For this object, the value of log([O III] 5007+4959/HeII 4686) ratio is about 1.53, which indicates that this nebula is a high-excitation class PN. Moreover, the H/[O III] 5007 flux ratio of M 2-55 is 0.35, which is smaller than that of normal young PNs (1.5; Sahai & Trauger 1998), suggesting that this object is evolved.
4 Spectral Energy Distribution
To understand the properties of the ionized gas, photospheric, and dust components of these objects, the SEDs for PNs M 2-55 and Abell 2 were constructed (Figures 6 and 7). In the IR, the Infrared Space Observatory (ISO) Long Wavelength Spectrometer (LWS) spectrum was used. For photometric measurements, the near-ultraviolet (NUV) and optical B, V, i, z, and y photometry of these objects are obtained from Shaw & Kaler (1985), Martin et al. (2005), Zacharias et al. (2005), and Chambers et al. (2016). J, H, and Ks band photometric data are taken from Two Micron All Sky Survey (2MASS) database. In the MIR, we used the data from AKARI and IRAS Source catalogs. In addition, the photometric data of these PNs measured form WISE MIR images are also added. A summary of these data used is given in Table 4.
| M 2-55 | Abell 2 | ||||
| Filters | Flux/Flux density | Reference | Flux/Flux density | Reference | |
| Central star and nebula | |||||
| Galex NUV (mag) | … | … | 17.590.04 | Martin et al. (2005) | |
| B (mag) | 17.43 | Zacharias et al. (2005) | 16.070.30 | Shaw & Kaler (1985) | |
| V (mag) | … | … | 15.850.20 | Shaw & Kaler (1985) | |
| Pan-Starrs i (mag) | 16.360.01 | Chambers et al. (2016) | … | … | |
| Pan-Starrs z (mag) | 16.010.01 | Chambers et al. (2016) | … | … | |
| Pan-Starrs y (mag) | 15.750.01 | Chambers et al. (2016) | … | … | |
| Dusta | |||||
| 2MASS J (mag) | 14.570.04 | Cutri et al. (2003) | … | … | |
| 2MASS H (mag) | 13.750.05 | Cutri et al. (2003) | … | … | |
| 2MASS Ks (mag) | 13.560.05 | Cutri et al. (2003) | … | … | |
| WISE 3.4 m (mag) | 11.430.03 | this study | 12.920.02 | this study | |
| WISE 4.6 m (mag) | 10.130.02 | this study | 12.340.03 | this study | |
| WISE 12 m (mag) | 6.830.02 | this study | 8.350.04 | this study | |
| WISE 22 m (mag) | 3.750.03 | this study | 5.050.03 | this study | |
| IRAS 12 mb (Jy) | 0.49: | Tajitsu & Tamura (1998) | 0.11: | Tajitsu & Tamura (1998) | |
| IRAS 25 m (Jy) | 0.800.07 | Tajitsu & Tamura (1998) | 0.140.02 | Tajitsu & Tamura (1998) | |
| IRAS 60 m (Jy) | 3.550.28 | Tajitsu & Tamura (1998) | 0.650.13 | Tajitsu & Tamura (1998) | |
| IRAS 100 mb (Jy) | 4.990.40 | Tajitsu & Tamura (1998) | 7.77: | Tajitsu & Tamura (1998) | |
| AKARI 65 m (Jy) | 1.85: | Yamamura et al. (2010) | … | … | |
| AKARI 90 m (Jy) | 3.760.16 | Yamamura et al. (2010) | 0.670.08 | Yamamura et al. (2010) | |
| AKARI 140 m (Jy) | 3.580.63 | Yamamura et al. (2010) | 0.01: | Yamamura et al. (2010) | |
| AKARI 160 m (Jy) | 1.76: | Yamamura et al. (2010) | 0.33: | Yamamura et al. (2010) | |
| Free-free emission | |||||
| 5 GHz (mJy) | 19 | Siódmiak & Tylenda (2001) | 2.3 | Stanghellini et al. (2008) | |
| 4.85 GHz (mJy) | 284 | Gregory et al. (1996) | … | … | |
| 1.4 GHz (mJy) | 26.6 | Siódmiak & Tylenda (2001) | 7.60.6 | Condon et al. (1998) | |
| 1.4 GHz (mJy) | … | … | 9.41.1 | Condon & Kaplan (1998) | |
0.86[a] The colons represent the uncertain flux measurement. [b] Some IRAS 12 and 100 m fluxes are upper limit detections.
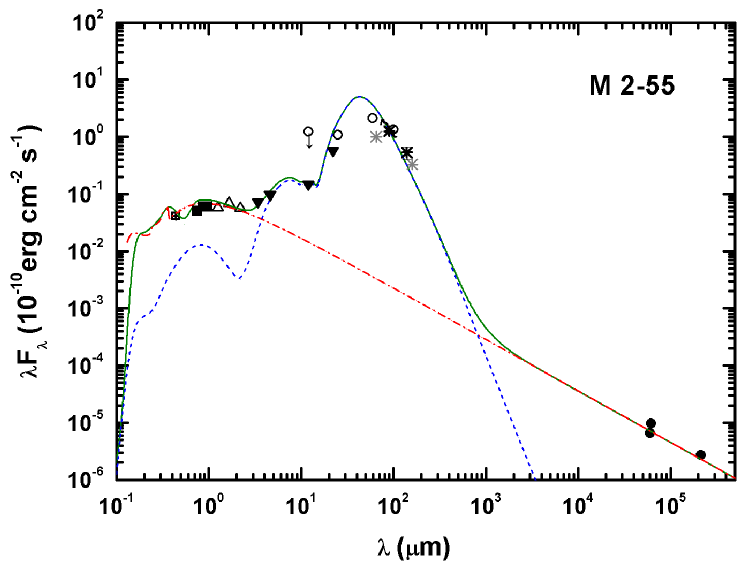
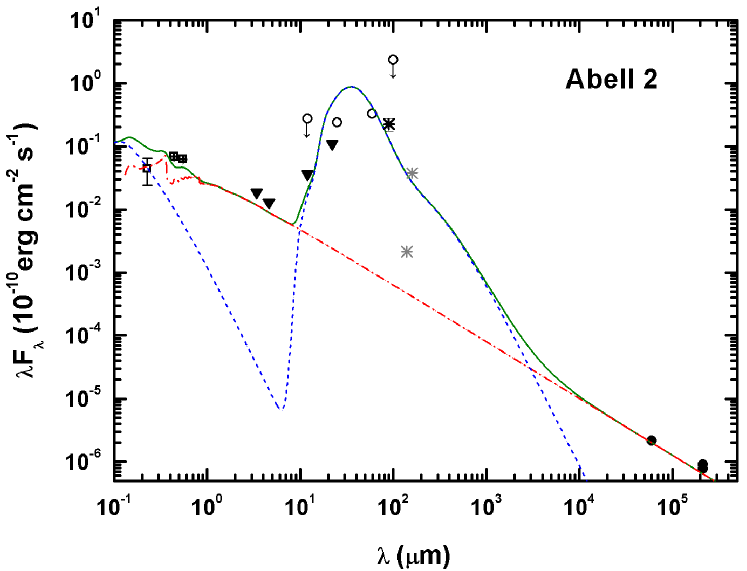
The preliminary impression of the SEDs (Figures 6 and 7) is that most of the fluxes from these PNs are mainly dominated in the IR. Assuming that the dust emission can be represented by a single blackbody (BB). The peak fluxes of these SEDs are 8.510-10 erg cm-2 s-1 and 110-10 erg cm-2 s-1 for M 2-55 and Abell 2, and the total fluxes emitted from the objects are approximately 1.210-9 erg cm-2 s-1 for M 2-55 and 1.410-10 erg cm-2 s-1 for Abell 2. Adopting their distances of 691 pc and 2.82 kpc for M 2-55 and Abell 2 (Bailer-Jones et al. 2018), the total luminosity of these nebulae are about 18 and 35 L for M 2-55 and Abell 2, respectively. From Figures 6 and 7, we note that the IR SED of each PN can not be fitted by a single BB, thus these derived values are just the minima.
We fitted the emerging fluxes of these objects by a two-component model including the reddened photospheric emission (emitted from the central star and gaseous emission) and dust continuum using the same expressions described in Hsia et al. (2019). The mid- to far-infrared component of the SED is not fitted by a single dust component. We have tried to fit the observed SED by a radiation transfer model using the software code DUSTY (Ivezic, Nenkova, & Elitzur 1999). For the fitting, we assumed the standard MRN distribution of grain sizes (Mathis, Rumpl, & Nordsieck 1977) with a dust temperature on inner shell boundary of 90 K and a density distribution of R-2 for each object, where R is the distance to the central star. In order to arrive at the best fitting, the optical thicknesses of the shells at 0.55 m were adopted to be = 3 and = 0.6 for M 2-55 and Abell 2. The dust grains are assumed to be the mixings of silicates and graphite, which can give the approximations to the dust continua. The separated contributions from different components of these PNs can be clearly seen in Figures 6 and 7. For the SED fittings, our best estimate for the central star temperatures are 80,000 K for M 2-55 and 78,000 K for Abell 2, which are in good agreement with previously results of 85,000 K (Kaler & Jacoby 1989) and 75,0004,000 K (Shaw & Kaler 1985) for M 2-55 and Abell 2. With the adopted distances of 691 pc for M 2-55 and 2.82 kpc for Abell 2 (Bailer-Jones et al. 2018), the derived total luminosity of the objects are about 35 and 50 L for M 2-55 and Abell 2, respectively, which are higher than our earlier estimates because parts of UV radiation emitted from the central stars are not counted into total observed fluxes. The higher central star temperatures and low luminosities of these PNs indicate that they are on the cooling paths of their evolutions in the Hertzsprung-Russell (H-R) diagram. Using the formulas presented in Hsia et al. (2010), we can derive the mass of dust component () and the mass of ionized gas () of PN M 2-55. Assuming the emissivity of dust particles of , where , = 1, and = 1 m. The assumed density of dust grain of =1 g cm-3 and the adopted distance of 691 pc, we obtain 4.01 10-4 M and 1.1 10-2 M for the masses of the dust component () and ionized gas (), respectively. The / ratio of M 2-55 is 0.04, significantly higher than the dust-to-gas ratios of typical PNs (10-2-10-3, Stasińska & Szczerba 1999). This probably suggests that a mass of gas in this evolved PN is in neutral form.
5 Discussion
5.1 M 2-55
According to Tweedy & Kwitter (1996) and Dgani & Soker (1998), the interacting PNs show three distinct features of the interactions with their surrounding ISM; (i) the outer regions around the PNs are asymmetric; (ii) brightness enhancements seen in the outer regions of these PNs accompanied by the drops in the ionization levels; (iii) the presences of fragments in the halos and/or arc-shaped filaments. Dgani & Soker (1998) suggested that the striped appearances of interacting PNs may be the result of Rayleigh-Taylor (RT) instabilities, resulting in fragmentations at the halos of the PNs. The optical-infrared morphology of PN M 2-55 as seen in Figures 1 and 4 is composed of an arc-like structure with brightness enhancement on its edge from SW to SE (see Section 3.1.2) and an asymmetric infrared halo (see Section 3.2). Such features have been detected in other nebulae such as NGC 6751 (Clark et al. 2010), NGC 6894 (Soker & Zucker 1997), NGC 7293 (Zhang et al. 2012b), HW 4, S176, and S188 (Tweedy & Kwitter 1996), and have been attributed to the interactions between the AGB winds and the ISM. No evidence of other two distinct characteristics of PN-ISM interactions can be seen in this object. We conclude that the presence of arc-shaped structure seen around PN M 2-55 is caused by the compression from the motion of this nebula through its surrounding ISM.
Wilkin (1996) found that the arc-shaped structure depends on relative velocities and densities between slow AGB wind and surrounding ISM, the presence of the feature can be used to determine the properties of AGB wind of the PN and its surrounding ISM. We note that the appearance of this new discovered arc filament is similar to that of brightening structure as the first stage of PN-ISM interaction in the simulations of Wareing et al. (2007), probably suggesting that the PN is not affected by the ISM interaction. If the central star of the planetary nebula (CSPN) moves slowly through the ISM (i.e. 50 km s-1; Burton 1988), this interaction can keep up entire lifetime of the nebula and other PN-ISM interactions will never be observed (Wareing et al. 2007). In the case of PN M 2-55, the radial velocity of this object is 22.6 km s-1 (Acker et al. 1992), hence we infer that the arc-shaped structure around this PN may be observed for a long time.
Although M 2-55 has been known to present two pairs of bipolar lobes (Sabbadin & Perinotto 1981), previous images did not reveal internal details of this nebula. Figure 1 shows that the nebular structures are point symmetric about the center, and the two pairs of lobes have approximately the same extent, indicating that they were ejected during a short period. This PN also reveals a large central cavity, differing from young bipolar PNs which usually exhibit a narrow waist (see, e.g. Manchado et al. 1996; Kwok & Su 2005). Presumably, the central cavity was created by the increasing thermal pressure with PN evolution. The clumpy structures in Figure 1 might be the debris of the torus that have collimated the outflows. A hypothesis of PN evolutionary transition from bipolar (lobe-dominant) to elliptical (cavity-dominant) has been suggested by Huarte-Espinosa et al. (2012) and Hsia et al. (2014). The appearance of PN M 2-55 suggests that it is in an evolutionary stage between the lobe-dominant phase and the cavity-dominant phase.
5.2 Abell 2
According to the evolutionary tracks presented in Blöcker (1995), the temperature and luminosity of the central star of Abell 2 indicate that it has a mass of 0.605 M. This is normal among PNs (Stasińska et al. 1997). Soker (1997) classified Abell 2 as an elliptical PN, which might result from axisymmetric mass loss of its progenitor interacted with a substellar companion during common envelope phase. This scenario also predicts the existence of a spherical halo surrounding elliptical nebula (Soker 1997), which is confirmed by our observation of Abell 2 (see Section 3.2).
The hydrodynamical models presented by Gawryszczak et al. (2002) suggest that PNs with binary cores will evolve from bipolar to elliptical shapes. Therefore, elliptical PNs can be produced in wide binary systems and most evolved PNs appear spherical or elliptical morphologies. This arises the possibility that there is a companion in the nucleus of Abell 2. Although our observations could not identify whether a companion exists in this PN, new spectroscopic observation is required to reveal the nature of the nucleus in Abell 2.
The double-shell structure of Abell 2 can be explained in terms of radiation-hydrodynamics simulations (Schönberner et al. 2014). Similar to the PN double-shell HuBi 1 (Guerrero et al. 2018), the inner and outer shells of Abell 2 appears to have an opposite ionization structure to those of typical PNs. Guerrero et al. (2018) suggested that the anomalous excitations are related the Wolf-Rayet central star of the PN. In this case, the nucleus of the nebula may experience a born-again event produced by a thermal pulsation at the ending of AGB stage, during the post-AGB phase (Blöcker 2001), or on the cooling stage of white dwarf evolution (Schönberner 1979). The shocks produced by the ejecta excite the inner shell, resulting in an inverted ionization structure as seen in Abell 2.
It is instructive to investigate the evolution of SEDs form young to old PNs. The SED of a young PN IRAS 21282+5050 (hereafter referred to as IRAS 21282) has been presented by Hsia et al. (2019), whether a strong IR excess due to thermal emission of dust components has been revealed. In IRAS 21282, the dust envelope is optically thick with an optical depth of = 5.5 at 0.55 m, and has a high temperature of 250 K. It is clear that the evolved PN Abell 2 exhibits a lower optical depth and a lower temperature. Therefore, the infrared colors can reflect the evolutionary stage of PNs.
6 Conclusions
Recent narrow-band imaging studies have provided an effective tool for us to understand the ionized gaseous environments around evolved PNs. Although more than one hundred extended, faint PNs have been studied via these advanced observational tools (Tweedy & Kwitter 1996; Corradi et al. 2003; Ali et al. 2012), the nature and properties of these nebulae are still unclear. In this paper, we present a visible and MIR study of two evolved PNs (M 2-55 and Abell 2). Our deep optical narrow-band images of PN M 2-55 reveal two pairs of bipolar lobes and a new arc-like structure. The arc-shaped structure seen around this object appears a well-defined boundary from SW to SE, furnishing a strong evidence for an interaction of the expanding nebula of this PN with its surrounding ISM. The [O III] and H images of PN Abell 2 reveal inner and outer elliptical shells in the main nebula, whereas the inner shell of this PN can be only seen in the [N II] image. This suggests that the nucleus of this PN experienced a born-again event. We have studied the nebular properties of PN M 2-55 by the mid-resolution spectrum. The spectral analysis of this object shows that the nebula is an evolved PN with a high excitation class and a low electron density of 250 cm-3.
From the MIR images of WISE all-sky survey data release, these PNs presented in our study are found to show prominent infrared features. Obvious MIR emissions detected in the central parts of these objects suggest that a mass of dust are located in their central regions. The SEDs of these PNs are constructed from extensive archival data. We successfully fitted the observed fluxes by a two-component model including the reddened photospheric emission and dust continuum. These PNs might have thick dusty envelopes because most of the fluxes from the objects emitted by dust components.
Interacting PN is thought to be the result of dynamical interaction between slow AGB wind (halo) and its surrounding ISM. The presence of arc-shaped/bow-shock structure suggests that PN-ISM interaction may be very common. M 2-55 and Abell 2 can serve as an astrophysical laboratory to study the dynamical processes of the interactions between PNs and ISM in the space.
Acknowledgements.
We would like to thank the anonymous referee for his/her helpful comments that improved the manuscript. This publication has made use of data collected at Lulin Observatory, partly supported by MoST grant 108-2112-M-008-001. We acknowledge the support of the staff of the Lijiang 2.4m telescope. Funding for the telescope has been provided by Chinese Academy of Sciences and the People’s Government of Yunnan Province. Financial support for this work is supported by the grants from The Science and Technology Development Fund, Macau SAR (file no: 061/2017/A2 and 0007/2019/A) and the Faculty Research Grants of Macau University of Science and Technology (project code: FRG-19-004-SSI). X. L. is supported by National Science Foundation of China (NSFC, grant U1731122). Y. Z thanks NSFC (NO. 11973099) for financial support.References
- Abell (1955) Abell, G. O. 1955, PASP, 67, 258
- Abell (1966) Abell, G. O. 1966, ApJ, 144, 259
- Acker et al. (1992) Acker, A., Ochsenbein, F., Stenholm, B., et al. 1992, Strasbourg-ESO Catalog of Galactic Planetary Nebulae, Parts I and II (Garching: European Southern Observatory)
- Ali et al. (2012) Ali, A., Sabin, L., Snaid, S., & Basurah, H. M. 2012, A&A, 541, A98
- Bailer-Jones et al. (2018) Bailer-Jones, C. A. L., Rybizki, J., Fouesneau, M., et al. 2018, AJ, 156, 58
- Benjamin et al. (2003) Benjamin, R. A., Churchwell, E., Babler, B. L., et al. 2003, PASP, 115, 953
- Blöcker (1995) Blöcker, T., 1995, A&A, 299, 755
- Blöcker (2001) Blöcker, T., 2001, Ap&SS, 275, 1
- Borkowski et al. (1990) Borkowski, K. J., Sarazin, C. L., & Soker, N. 1990, ApJ, 360, 173
- Burton (1988) Burton, W. B., 1988, in Galactic and Extragalactic Radio Astronomy, ed. K. Kellermann & G. L. Verschuur (New York: Springer), 295
- Calvet & Peimbert (1983) Calvet, N., & Peimbert, M. 1983, Rev. Mexicana Astron. Astrofis., 5, 319
- Chambers et al. (2016) Chambers, K. C., Magnier, E. A., Metcalfe, N., et al. 2016, arXiv e-prints, arXiv:1612.05560
- Chu et al. (2009) Chu, Y. -H., Gruendl, R. A., Guerrero, M. A., et al. 2009, AJ, 138, 691
- Churchwell et al. (2009) Churchwell, E., Babler, B. L., Meade, M. R., et al. 2009, PASP, 121, 213
- Clark et al. (2010) Clark, D. M., García-Díaz, Ma. T., López, J. A., et al. 2010, ApJ, 722, 1260
- Condon et al. (1998) Condon, J. J., Cotton, W. D., Greisen, E. W., et al. 1998, AJ, 115, 1693
- Condon & Kaplan (1998) Condon, J. J., & Kaplan, D. L. 1998, ApJS, 117, 361
- Cohen et al. (2011) Cohen, M., Parker, Q. A., Green, A. J., et al. 2011, MNRAS, 413, 514
- Corradi et al. (2003) Corradi, R. L. M., Schönberner, D., Steffen, M., et al. 2003, MNRAS, 340, 417
- Corradi et al. (2004) Corradi, R. L. M., Sánchez-Blázquez, P., Mellema, G., et al. 2004, A&A, 417, 637
- Cutri et al. (2003) Cutri, R. M., Skrutskie, M. F., van DyK, S., et al. 2003, VizieR Online Data Catalog, II/246
- Dgani & Soker (1998) Dgani, R., & Soker, N. 1998, ApJ, 495, 337
- Felli & Perinotto (1979) Felli, M., & Perinotto, M. 1979, A&A, 76, 69
- Gawryszczak et al. (2002) Gawryszczak, A. J., Mikołajewska, J., & Różyczka, M. 2002, A&A, 385, 205
- Gillett et al. (1967) Gillett, F. C., Low, F. J., & Stein, W. A. 1967, ApJ, 149, L97
- Gregory et al. (1996) Gregory, P. C., Scott, W. K., Douglas, K., & Condon, J. J. 1996, ApJS, 103, 427
- Guerrero et al. (2018) Guerrero, M. A., Fang, X., Miller Bertolami, M. M., et al. 2018, Nature Astronomy, 2, 784
- Gurzadyan (1969) Gurzadyan, G. A. 1969, Planetary Nebulae (New York: Gordon & Breach)
- Gurzadyan (1988) Gurzadyan, G. A. 1988, Ap&SS, 149, 343
- Gussie & Taylor (1994) Gussie, G. T., & Taylor, A. R. 1994, PASP, 106, 500
- Howarth (1983) Howarith, I. D. 1983, MNRAS, 203, 301
- Hsia et al. (2010) Hsia, C. -H., Kwok, S., Zhang, Y., et al. 2010, ApJ, 725, 173
- Hsia et al. (2014) Hsia, C. -H., Chau, W., Zhang, Y., & Kwok, S. 2014, ApJ, 787, 25
- Hsia & Zhang (2014) Hsia, C. -H., & Zhang, Y. 2014, A&A, 563A, 63
- Hsia et al. (2019) Hsia, C. -H., Zhang, Y., Kwok, S., & Chau, W. 2019, Ap&SS, 364, 32
- Hua (1988) Hua, C. T. 1988, A&A, 193, 273
- Huarte-Espinosa et al. (2012) Huarte-Espinosa, M., Frank, A., Balick, B., et al. 2012, MNRAS, 424, 2055
- Hummer & Storey (1987) Hummer, D. G., & Storey, P. J. 1987, MNRAS, 224, 801
- Ivezic, Nenkova, & Elitzur (1999) Ivezic , Z., Nenkova, M., & Elitzur M. 1999, DUSTY user manual, University of Kentucky internal report
- Jacoby (1981) Jacoby, G. H. 1981, AJ, 244, 903
- Kaler & Jacoby (1989) Kaler, J. B., & Jacoby, G. H. 1989, ApJ, 345, 871
- Kaler et al. (1990) Kaler, J. B., Shaw, R. A., & Kwitter, K. B. 1990, ApJ, 359, 392
- Kingsburgh & Barlow (1994) Kingsburgh R. L., & Barlow M. J. 1994, MNRAS, 271, 257
- Kwok (1982) Kwok, S. 1982, ApJ, 258, 280
- Kwok & Su (2005) Kwok, S., & Su, K. Y. L. 2005, ApJ, 635, 49
- Manchado et al. (1996) Manchado, A., Stanghellini, L., & Guerrero, M. A. 1996, ApJ, 466, 95
- Martin et al. (2005) Martin, D. C., Fanson, J., Schiminovich, D., et al. 2005, ApJ, 619, L1
- Mathis, Rumpl, & Nordsieck (1977) Mathis, J. S., Rumpl, W., & Nordsieck, K. H. 1977, ApJ, 217, 425
- Peimbert & Torres-Peimbert (1983) Peimbert M. & Torres-Peimbert S. 1983, IAU Symp. 103, Reidel, Dordrecht, 233
- Peimbert & Torres-Peimbert (1987) Peimbert M. & Torres-Peimbert S. 1987, Rev. Mexicana Astron. Astrofis., 14, 540
- Phillips (1998) Phillips, J. P. 1998, A&A, 340, 527
- Pottasch et al. (1984) Pottasch, S. R., Baud, B., Beintema, D., et al. 1984, A&A, 138, 10
- Ramos-Larios & Phillips (2009) Ramos-Larios, G., & Phillips, J. P. 2009, MNRAS, 400, 575
- Ramos-Larios et al. (2018) Ramos-Larios, G., Guerrero, M. A., Nigoche-Netro, A. et al. 2018, MNRAS, 475, 932
- Roeser et al. (2010) Roeser, S., Demleitner, M., & Schilback, E. 2010, AJ, 139, 2440
- Sabbadin & Perinotto (1981) Sabbadin, F., & Perinotto, M. 1981, A&A, 94, 25
- Sahai & Trauger (1998) Sahai, R., & Trauger, J. T. 1998, AJ, 116, 1357
- Satiō et al. (1999) Satiō, M., Iwata, I., Okumura, S., Mori, A., & Yamashita, T. 1999, PASP, 115, 673
- Schönberner (1979) Schönberner, D., 1979, A&A, 79, 108
- Schönberner et al. (2014) Schönberner, D., Jacob, R., Lehmann, H., et al. 2014, Astron. Nachr., 335, 378
- Shaw & Kaler (1985) Shaw, R. A., & Kaler, J. B. 1985, ApJ, 295, 537
- Siódmiak & Tylenda (2001) Siódmiak, N., & Tylenda, R. 2001, A&A, 373, 1032
- Soker (1997) Soker, N., 1997, ApJS, 112, 487
- Soker & Zucker (1997) Soker, N., & Zucker, D. B. 1997, MNRAS, 289, 665
- Stanghellini et al. (1993) Stanghellini, L., Corradi, R. L. M., & Schwarz, H. E. 1993, A&A, 279, 521
- Stanghellini et al. (2008) Stanghellini, L., Shaw, R. A., & Villaver, E. 2008, ApJ, 689, 194
- Stasińska et al. (1997) Stasińska, G., Górny, S. K. & Tylenda, R., 1997, A&A, 327, 736
- Stasińska & Szczerba (1999) Stasińska, G., & Szczerba, R. 1999, A&A, 352, 297
- Storey & Zeippen (2000) Storey, P. J. & Zeippen, C. J. 2000, MNRAS, 312, 813
- Tajitsu & Tamura (1998) Tajitsu, A., & Tamura, S. 1998, AJ, 115, 1989
- Tweedy & Kwitter (1996) Tweedy, R. W., & Kwitter, K. B. 1996, ApJS, 107, 255
- Wareing et al. (2007) Wareing, C. J., Zijlstra, A. A., & O’brien, T. J. 2007, MNRAS, 382, 1233
- Weinberger (1989) Weinberger, R. 1989, A&AS, 78, 301
- Wilkin (1996) Wilkin, F. P. 1996, ApJ, 459, L31
- Wright et al. (2010) Wright, E. L., Eisenhardt, P. R. M., Mainzer, A. K., et al. 2010, AJ, 140, 1868
- Yamamura et al. (2010) Yamamura, I., Makiuti, S., Ikeda, N., et al. 2010, VizieR Online Data Catalog, 2298, 0
- Zacharias et al. (2005) Zacharias, N., Monet, D. G., Levine, S. E., et al. 2005, VizieR Online Data Catalog, 1297, 0
- Zhang & Kwok (1991) Zhang, C. Y., & Kwok, S. 1991, A&A, 250, 179
- Zhang et al. (2012a) Zhang, Y., Hsia, C. -H., & Kwok, S. 2012a, ApJ, 745, 59
- Zhang et al. (2012b) Zhang, Y., Hsia, C. -H., & Kwok, S. 2012b, ApJ, 755, 53