Thermal charge carrier driven noise in transmissive semiconductor optics
Abstract
Several sources of noise limit the sensitivity of current gravitational wave detectors. Currently, dominant noise sources include quantum noise and thermal Brownian noise, but future detectors will also be limited by other thermal noise channels. In this paper we study a thermal noise source which is caused by spatial charge carrier density variations in semiconductor materials. We provide an analytical model for the understanding of charge carrier fluctuations under the presence of screening effects and show that charge carrier noise will not be a limiting noise source for third generation gravitational wave detectors.
I Introduction
Gravitational wave detection (GWD) GW_2016 ; GW_2016b is an exciting and growing field in the realm of high-precision metrology. For the first detection of a gravitational wave, complex infrastructure was built taking huge care to reduce all of the possible noise sources. In particular the fascinating accuracy of a displacement measurement of a macroscopic test mass is demonstrated on a level of about m aLIGO2013 ; aLIGO2014 ; aLIGO2015 ; aLIGO2015b ; aVirgo2015 ; aVirgo2018 .
A third generation of gravitational wave detectors is planned in order to access gravitational waves as a new channel of information into the universe addressing fundamental questions such as the nature of dark matter, the inner structure of black holes and the origin of the universe itself Etscience . For third generation gravitational wave detectors (Einstein Telescope in Europe or Voyager and Cosmic Explorer in USA) the use of crystalline materials is considered 3Gen2018 . Third generation gravitational wave detectors are severely limited by thermal noise. Therefore there is a high probability they will be run at cryogenic temperatures. At these temperatures crystalline materials have superior mechanical quality factors compared to conventional amorphous materials thus being less susceptible to thermal Brownian noise nawrodt2011 ; martin2010 ; martin2008 ; nawrodt2008 ; martin2014 ; nawrodt2007 . Therefore, semiconductors such silicon are considered as possible substrate materials. This class of materials is potentially susceptible to novel noise channels.
In this paper we study thermal carrier noise in semiconductor materials. Similary to thermochemical noise benthem2009 which is caused by the diffusion of optical impurities this source of noise originates from the thermal motion of free charge carriers in the transmissive optical elements. The Brownian motion of charge carriers leads to spatial variations of the free carrier density thus creating local fluctuations of the refractive index. These fluctuations will be probed by any beam of light transmitted through the optical element. Below we refer to this noise as thermal charge carrier refractive (TCCR) noise. For free charge carriers screening effects have to be considered which distinguishes TCCR noise from thermochemical noise. A quantitative analysis of TCCR noise is presented taking into account Debye screening which depresses TCCR noise.
II Problem statement
Earthbound gravitational wave detectors consist of a large scale Michelson interferometer with Fabry-Perot (FP) cavities in the arms for signal enhancement bookSaulson . An incoming gravitational wave with the strain displaces the end mirrors of the FP cavities by a length of :
| (1) |
In order to measure the variation of the gravitational metric the displacement of the end mirrors is probed with a laser beam. The displacement of the end mirrors causes a phase shift between the interferometer arms which is enhanced by the FP-cavities and read out via interference of laser light of the two arm cavities.
In this paper we investigate transmissive optics made of semiconductor materials which is particularly important for third generation gravitational wave detectors such as the Einstein telescope. In semiconductor optics such as silicon ETdesign free charge carriers are present. These charge carriers move thermally akin to Brownian motion thus creating local charge carrier density fluctuations . As stated by Soref et al. soref1987 the refractive index is dependent on the charge carrier concentration as an effect of the free carrier dispersion:
| (2) |
with the laser frequency, the refractive index of the semiconductor, the elementary charge and the effective mass of majority charge carriers. That is why the local charge carrier fluctuations cause fluctuations of the refractive index . These fluctuations are probed by any laser beam propagating through the optical element.
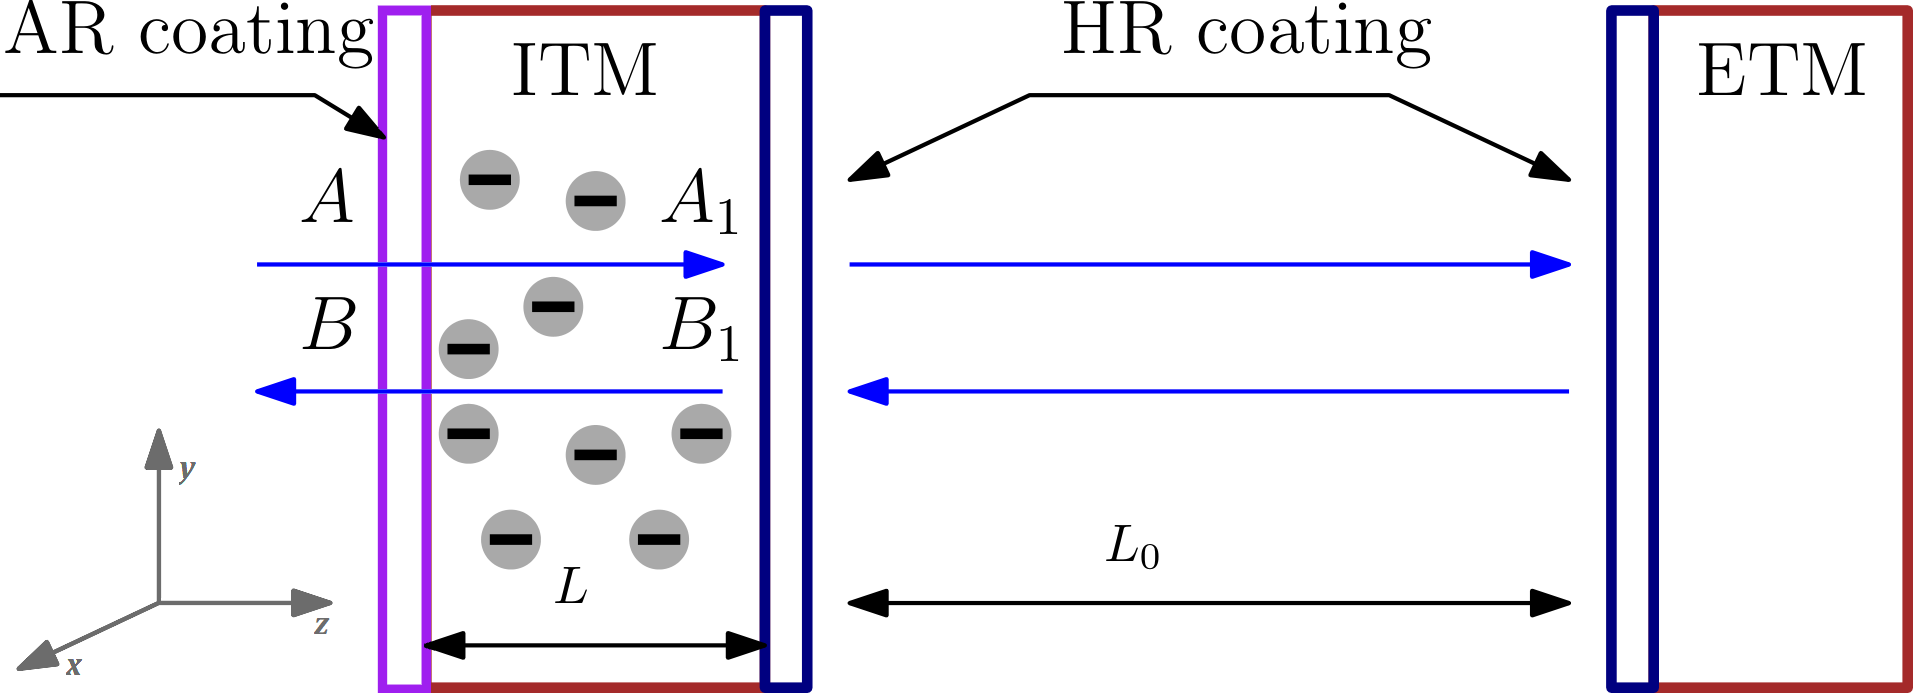
When a Gaussian laser beam propagates a distance along the -axis inside of e.g. the input mirror (test mass) of a FP cavity (see Fig. 1), it reads out the information on the variation of the refractive index inside the input test mass weighted by the light intensity distribution in the cross section. Hence, the optical path length of the laser beam is shifted by a value of :
| (3) | ||||
| (6) |
where is the length of the mirror substrate, is the Gaussian radius of the light beam (referring to the length where the amplitude falls off by ), are the transversal coordinates and is an integration over the volume of the input test mass. In the measurement we cannot distinguish between a fluctuation of the optical path length caused by noise or a length shift of the mirror caused by a gravitational wave. In this way carrier density fluctuations inside transmissive semiconductor optics contribute to the measured strain as :
We call this noise thermal charge carrier refractive (TCCR) noise. In order to quantify TCCR noise we have to model the carrier density fluctuations under consideration of screening effects that occur for free charge carriers (section II.2). Furthermore we have to understand how a change in the optical path length is related to the strain caused by the gravitational wave (section II.1) and combine both to get an expression for the amplitude of TCCR noise (section II.3). Finally we use this to explicitly compute the TCCR noise of ET input test masses (section III).
II.1 Coupling of noise induced changes in the path length and the measured strain
For simplicity reasons we consider a Michelson configuration with interferometer arms perpendicular to each other. To establish our model for TCCR noise we examine a Fabry-Perot (FP) cavity with mirrors as free test masses as shown in Fig. 1. TCCR noise in the input test mass disturbs the optical path length by a value of . From input-output relations we can see that the reflected amplitude (see notations on Fig. 1) contains an additional fluctuation term in the frequency domain:
| (7) |
where is a spectral frequency, is the amplitude relaxation rate of the FP cavity, is the round trip time (usually ) and and are the amplitude transmittance and reflectance of the input test masses (, we assume ). The two terms in the first equation of (7) describe the perturbation created in the incident wave (after circulation inside the cavity) and the directly reflected one respectively. Effectively the cavity acts as a low pass Lorentz filter.
The fluctuation term should be compared with the signal term produced by the displacement ( is the perturbation of the metric caused by the gravitational wave):
| (8) |
In gravitational wave detectors of the third generation there are FP cavities in the east and north arms, the light from them interfere on a 50/50 beam splitter. Thus, the signal (8) of the gravitational wave is increased by a factor of :
| (9) |
On the other hand there are fluctuations and in the input test masses of the north and east arm cavities. As follows:
| (10) |
Note that the fluctuations and do not depend on each other and have equal power spectral densities. The power spectral density of is equal to the power spectral density of (or ). Comparing (7) and (8) by taking into account (9) and (10) one can find that the variation of the gravitational metric and the optical path fluctuations are related as:
| (11) |
with the Finesse of the Fabry-Perot cavity.
II.2 Thermal charge carrier density fluctuations
As suggested by the fluctuation-dissipation theorem we have to understand the dissipation mechanism (in our case that is diffusion) to describe fluctuations of charge carriers. For this reason we derive a diffusion equation including screening effects. We expect Debye screening to suppress diffusion processes thus reducing the fluctutations in the optical elements. Because of the residual doping in the large test mass substrates required for GW detection a majority charge carrier is present Degallaix_2014 . Without loss of generality we assume electrons to be the majority charge carriers. We start with the continuity equation for the carrier concentration Jackson :
| (12) |
where is the current density described by Jackson :
| (13) | ||||
| (14) |
Here is the diffusion coefficient, the carrier mobility, the carrier charge, is the Boltzmann constant and the temperature. The last term in (13), which is proportional to a small electric field , is introduced to account for Debye screening. The carrier concentration can be described as a sum of a large constant and a small fluctuating part :
| (15) |
with the electrical resistivity . The screening electric field is given by the Poisson equation Jackson :
| (16) |
Here with the refractive index and is the vacuum permittivity. After substituting (13) into (12) whilst using (15) we get:
| (17) |
Since is a small deviation from thermal equilibrium (i.e. a fluctuation) we have neglected any quadratic term of . Finally we get a diffusion equation utilizing (16):
| (18) |
Here is the Laplace operator and is the Debye length. Compared to conventional diffusion equations there is an additional term, , which is a direct consequence of screening effects under the assumption of only having small deviations from thermal equilibrium .
Next we want to include fluctuations. In the frame of Langevin approach vanVliet1980 ; braginsky1999 we introduce the Langevin forces into the right part of (18):
| (19) |
These Langevin forces cause the Brownian movement of the charge carriers. They are uncorrelated representing white Gaussian noise:
| (20) | ||||
The correlators of the fluctuation forces and the constant should be chosen to fulfil the equation:
| (21) |
which corresponds to the well known requirement (of a Poisson process) that the variation of the particle number in a volume is equal to the mean particle number: LL5 . From (21) one can find:
| (22) |
Now we can calculate the auto-correlation function of density fluctuations:
| (23) | ||||
From that the double-sided power spectral density (PSD) can be found using the Wiener-Khinchin theorem chintchin1934 :
| (24) | ||||
II.3 Variations of the optical path length
Now that we know the spectral noise density of charge carrier fluctuation (LABEL:etaeta3) and how a shift of the optical change of path length relates to the gravitational strain (11) we can combine these two results with the readout of the Gaussian beam (3) to get the measurable TCCR noise in a gravitational wave detector. The readout of the Gaussian beam, equation (3), can be rewritten as:
| (25) |
where and are Fourier transforms of and respectively. To get the PSD of we calculate the auto-correlation function of :
| (26) | ||||
Using (20) we can express the correlator as:
| (27) |
and substituting into (26) and using the Wiener-Khinchin theorem and the normalisation (22) we write down the double-sided PSD :
| (28) |
With the results of section II.1 we can rewrite (28) in terms of the GW metric using (11):
| (29) |
In the usual case, when the Debye length is much smaller than the physical dimensions of the systems, i.e. the Gaussian radius and the length of the substrate (see table 2), this expression can be simplified:
| (30) | ||||
| (31) |
where is the Maxwell relaxation time. Here we used the normalisation:
| (32) |
The PSD can be converted into the amplitude spectral density (ASD):
| (33) |
Note that formula (29) for the spectral noise density is valid for frequencies smaller than the inverse diffusion time because the equation of motion (17) does not account for retardation effects. The diffusion time is either determined by the Maxwell rexalation time or the electron lifetime whatever is smaller Forster . In silicon which is an indirect semiconductor the diffusion time is given by the Maxwell relaxation time (31) which is around s for pure silicon at room temperature. The limiting frequency is therefore around Hz which is much larger than the frequency range of third generation gravitational wave detectors of to Hz ETdesign .
III Computation of TCCR noise
To quantify the magnitude of TCCR noise we are going to use the low-frequency interferometer of the Einstein telescope ETdesign as an example for a cryogenically operated third generation gravitational wave detector where the use of crystalline substrate materials is considered. Since we are examining transmissive TCCR noise the HR and AR coatings do not contribute significantly because of their small thickness. In amorphous coatings TCCR noise is even further reduced due to the low amount of free charge carriers.
| parameter | symbol | value |
|---|---|---|
| finesse of FP cavity | ||
| mirror thickness | m | |
| Gaussian radius | m | |
| laser wavelength | nm | |
| arm length | m | |
| refractive index Si nsi | ||
| effective electron mass Si | ||
| electron rest mass | kg | |
| Boltzmann constant | ||
| vaccum permittivity |
TCCR noise is dependent on the diffusion coefficient and the Debye length (see table 2 for numerical values of and ). This is why it is indirectly also a function of temperature and doping density . At this time large high-purity silicon samples can be produced with the magnetically assisted Czochralski technique with a resistivity of up to kcm. To account for production difficulties we are looking at n-type silicon with a worse resistivity of kcm which corresponds to a doping density of around , which is equivalent to a resistivity of kcm at room temperature Degallaix_2014 . In order to calculate the mean carrier density as a function of the doping density a model for semiconductors with no compensation (no acceptors) has been used Grundmann :
| (34) |
Here is the donor degeneracy, is the donor concentration, is the energy gap between donor level and the conduction band and is the conduction band edge density:
| (35) |
with the effective density-of-states mass of the conduction band electrons. As dopants we considered shallow phosphorous donors which have a degeneracy of and an energy gap of meV.
Additionally, we want to be able to model the diffusion coefficient . For this we used the Einstein-Smoluchowski equation in order to replace the diffusion coefficient with the well investigated charge carrier mobility Grundmann :
| (36) |
A more precise expression for can be obtained from taking into account the carrier band curvature. In our case though, the Fermi level is several deep within the band gap. Thus, the deviations from the Einstein-Smoluchowski equation are negligibly small. The mobility data for modeling has been obtained from Jacoboni et al. jacoboni1977 and Li et al. li1977 .
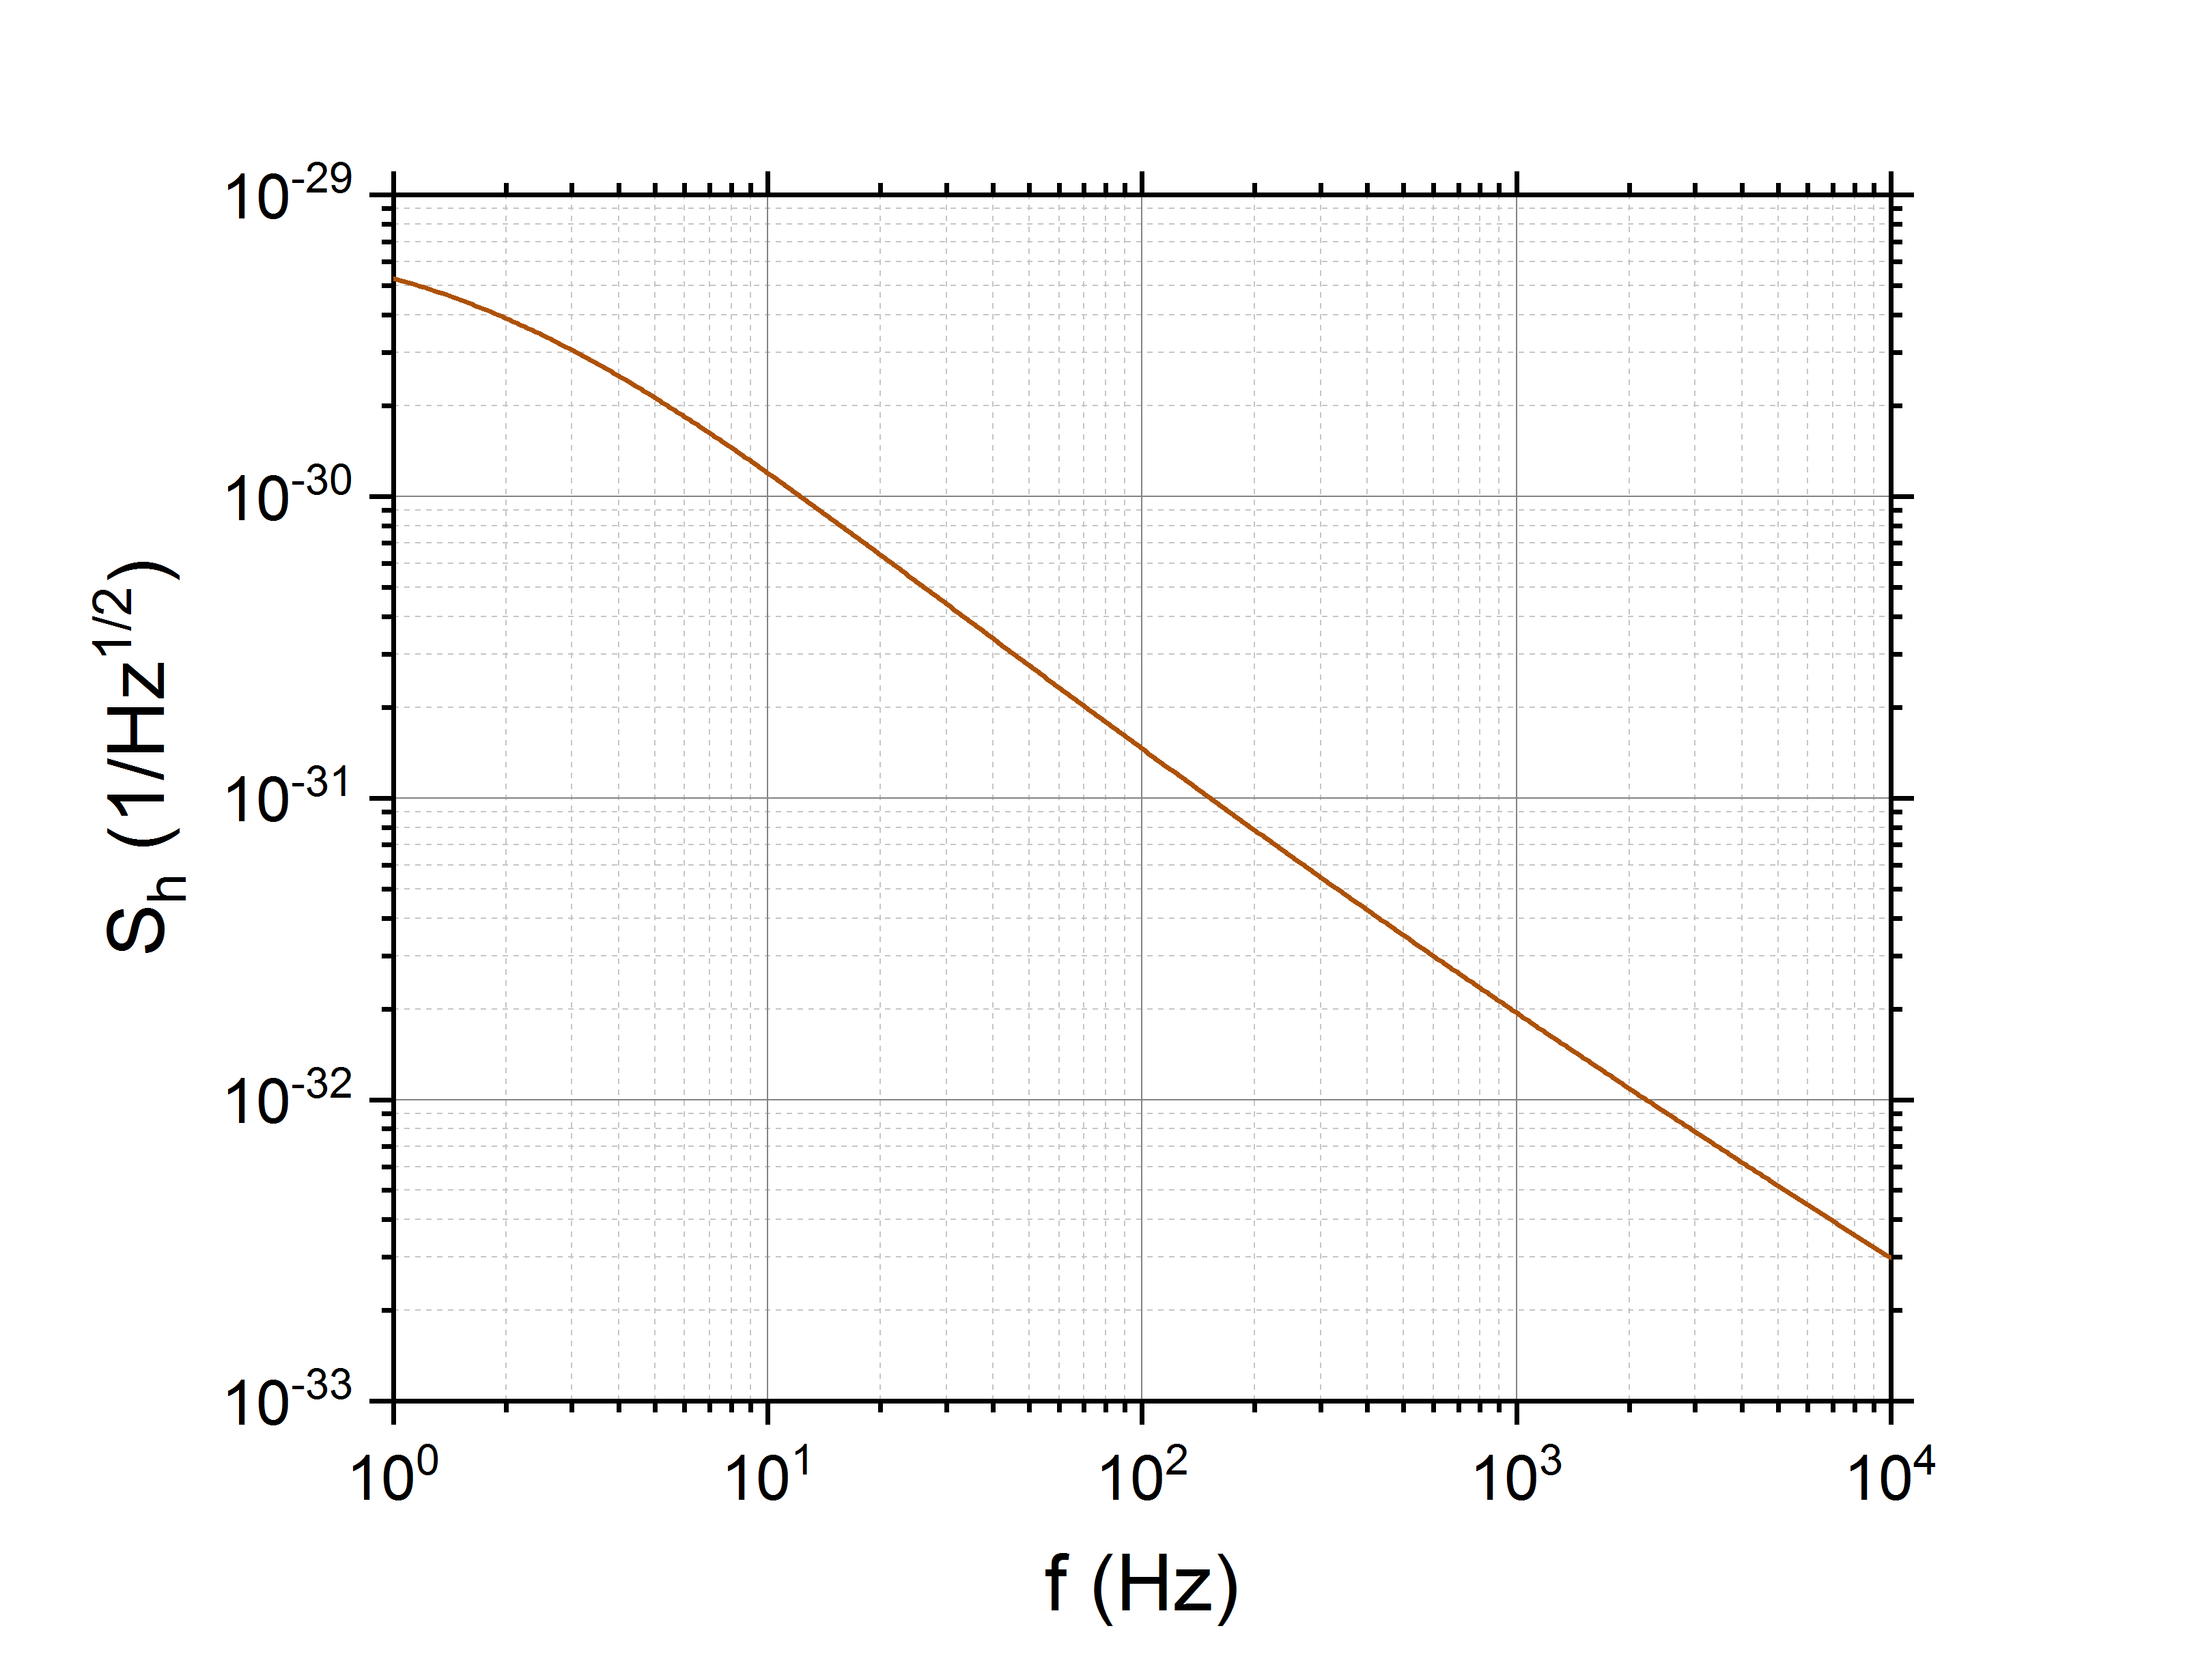
In Fig. 2 we have plotted the ASD of TCCR noise of the ET input test masses at its operation temperature of K for pure Si, using the parameters shown in table 1 and 2. All numerical calculations shown have been performed with Mathematica 11.3 mathematica113 . We can see that the ASD of TCCR noise at K reaches in Si. This noise amplitude is well below the sensitivity goal of the ET telescope of . Therefore we can come to the important conclusion that TCCR noise is not a limiting noise source for the ET telescope and third generation gravitational wave detection in general.
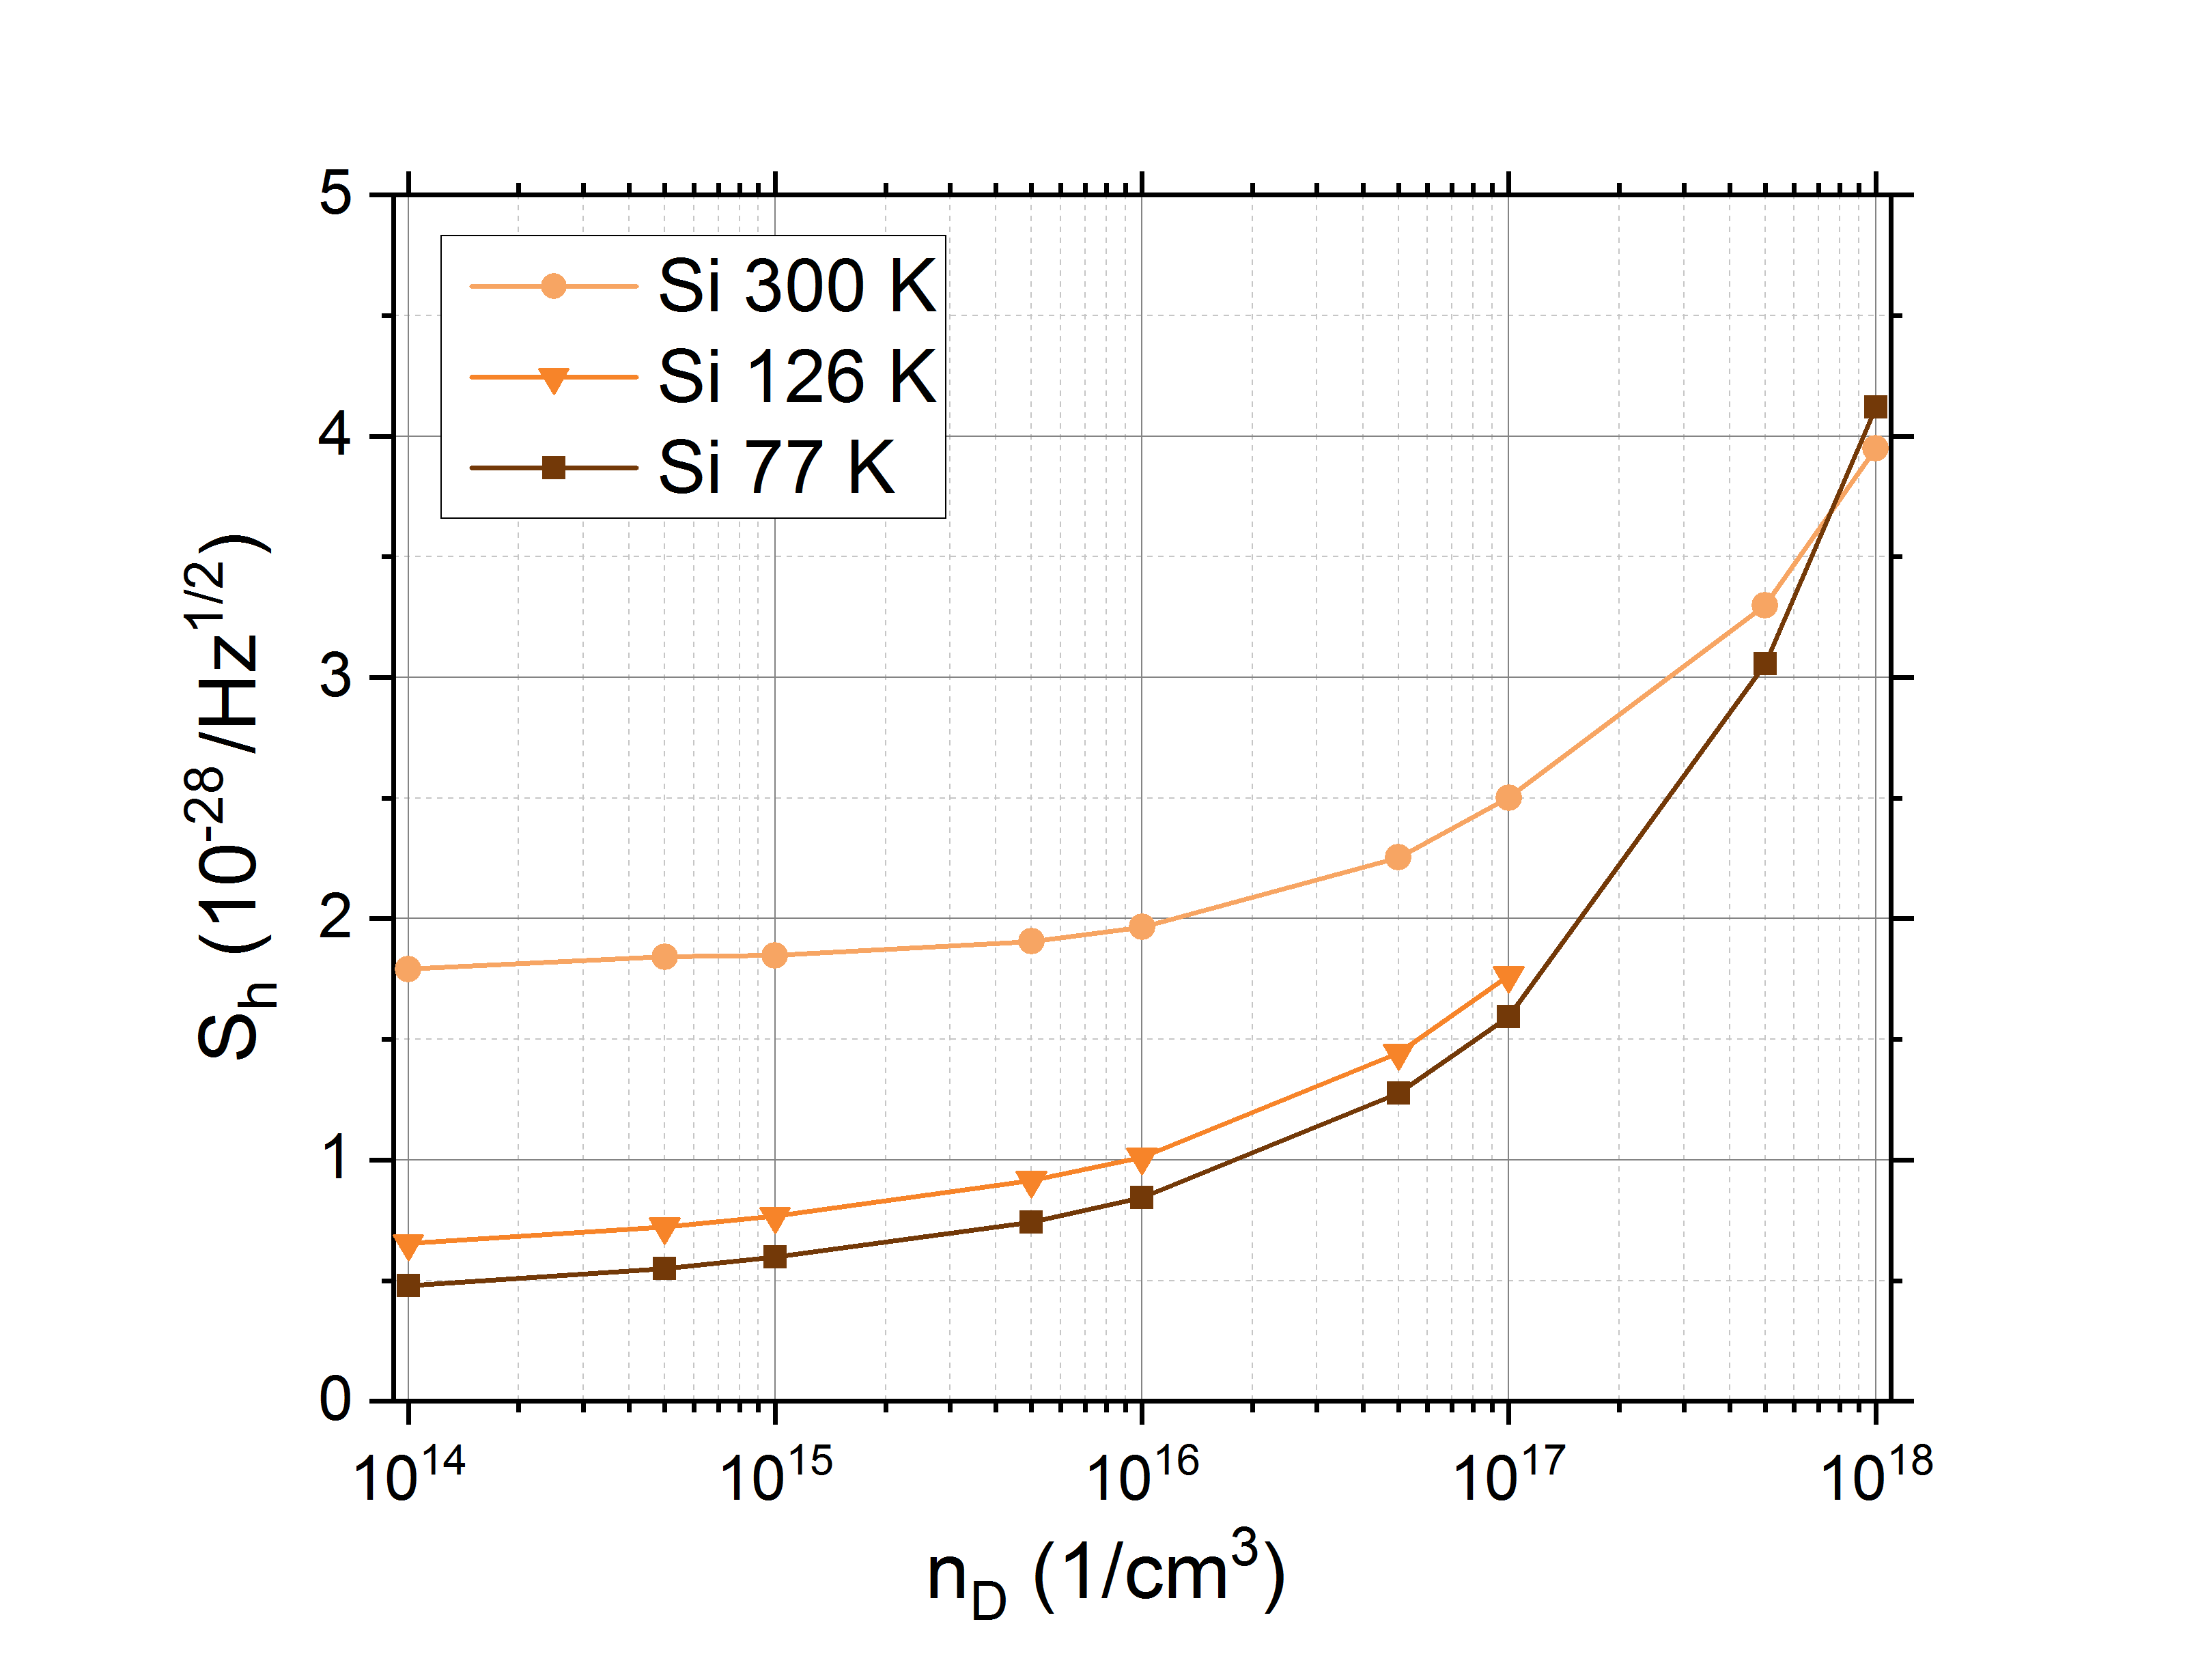
Like all thermal noise sources TCCR noise scales with temperature, additionally it also increases with the doping concentration. In Fig. 3 we are showing the ASD of TCCR noise in dependence of the doping density for different temperatures. Because of the temperature range shown ( K to K) the Debye length of Si (see table 2) is small enough to use the approximation given by formula (30) thus obtaining a frequency independent ASD up to at least Hz.
The doping dependence can be explained in the following way: An increase in the doping concentration increases the mean carrier concentration and decreases the Debye length . These effects compensate each other as can be seen in equation (30). Furthermore in doped silicon ( ) an increase in the doping density also decreases the charge carrier mobility li1977 and the diffusion coefficient respectively (see table 2) thus increasing the TCCR noise amplitude. Overall even for room temperature (compared to cryogenic operation) and high doping densities TCCR noise stays below the sensitivity targets of third generation wave detectors. Calculations with other III-V semiconductors with a smaller band gap (such as gallium arsenide) have shown that the TCCR noise amplitude does not increase significantly.
IV Conclusion
We show a detailed analysis of thermal charge carrier refractive (TCCR) noise in metals and semiconductors from first principles especially taking into account screening effects. We show that Debye screening practically blocks diffusion processes, hence dramatically reducing TCCR noise. We apply our approach to the input masses of the Einstein telescope and show that TCCR noise is not a limiting noise source. Furthermore it can be seen that TCCR noise does not increase significantly at room temperature (compared to cryogenic operation) and high levels of doping of the material. For instance for silicon input test masses of ET at room temperature and a rather high doping density of the TCCR noise amplitude is three orders of magnitude below the design sensitivity. Before this paper the driver for ultra-pure silicon has been optical absorption and TCCR noise. With our derivation we show that TCCR noise is not a limiting noise source for substrate materials of third generation gravitational wave detectors. Nevertheless there is still a need for ultra-pure substrate materials due to limits set by the optical absorption winkler1991 Degallaix_2014 .
Acknowledgements.
S.V. acknowledges support from Russian Foundation of Basic Research (Grant No. 19-29-11003) and from the TAPIR GIFT MSU Support of California Institute of Technology. S.K. and F.B. acknowledge support by the German Research Foundation (DFG) under Germany’s Excellence Strategy EXC-2123 QuantumFrontiers - 390837967. This document has LIGO number LIGO-P2000048.References
- [1] B. P. Abbott et al. Observation of Gravitational Waves from a Binary Black Hole Merger. Phys. Rev. Lett., 116:061102, Feb 2016.
- [2] B. P. Abbott et al, (LIGO Scientific Collaboration and Virgo Collaboration). GW151226: Observation of Gravitational Waves from a 22-Solar-Mass Binary Black Hole Coalescence. Phys. Rev. Lett., 116:241103, 2016.
- [3] LVC-Collaboration. Prospects for Observing and Localizing Gravitational-Wave Transients with Advanced LIGO and Advanced Virgo. arXiv, 1304.0670, 2013.
- [4] S. Dwyer K. L. Dooley, T. Akutsu and P. Puppo. Status of advanced ground-based laser interferometers for gravitational-wave detection. arXiv, 1411.6068, 2014.
- [5] J. Aasi and B. P. Abbott et al. Advanced LIGO. Classical and Quantum Gravity, 32:074001, 2015.
- [6] J. Abadie et al. Advanced LIGO. Classical and Quantum Gravity, 32:074001, 2015.
- [7] F. Acernese et al, (Virgo Collaboration). Advanced Virgo: a 2nd generation interferometric gravitational wave detector. Classical and Quantum Gravity, 32:024001, 2015.
- [8] F. Acernese et al (Virgo Collaboration). Calibration of Advanced Virgo and Reconstruction of the Gravitational Wave Signal h(t) during the Observing Run O2. arXiv, 1807.03275, 2018.
- [9] B. Sathyaprakash. Corrigendum: Scientific objectives of einstein telescope. Classical and Quantum Gravity, 30(7):079501, mar 2013.
- [10] S. Wills. Gravitational WavesThe Road Ahead . Optics and Photonics News, page 44–52, May 2018.
- [11] S. Rowan et al R. Nawrodt. Challenges in thermal noise for 3rd generation of gravitational wave detectors. Gen. Relativ. Grav., 43:593–622, 2011.
- [12] I. W. Martin et al. Effect of heat treatment on mechanical dissipation in ta2o5 coatings. Classical and Quantum Gravity, 27(22):225020, oct 2010.
- [13] I. Martin et al. Measurements of a low-temperature mechanical dissipation peak in a single layer of Ta2O5 doped with TiO2. Class. Quantum Grav., 25:055005, 2008.
- [14] A. Zimmer et all R. Nawrodt. High mechanical Q-factor measurements on silicon bulk samples. J. Phys.: Conf. Ser., 122:012008, 2008.
- [15] K. Craig et al I. W. Martin, R. Nawrodt. Low temperature mechanical dissipation of an ion-beam sputtered silica film. Classical and Quantum Gravity, 31(3):035019, jan 2014.
- [16] R. Nawrodt et al. High mechanical q-factor measurements on calcium fluoride at cryogenic temperatures. The European Physical Journal - Applied Physics, 38(1):53–59, 2007.
- [17] B. Benthem and Y. Levin. Thermorefractive and thermochemical noise in the beamsplitter of the geo600 gravitational-wave interferometer. Phys. Rev. D, 80:062004, Sep 2009.
- [18] P. R. Saulson. Fundamentals of Interferometric Gravitational Wave Detectors. World Scientific, Singapore, 1994.
- [19] M. Abernathy et al. ET conceptual design study document. 2011.
- [20] R. A. Soref and B. R. Bennett. Electrooptical Effects in Silicon. IEEE Journal of Quantum Electronics, QE-23:123–129, 1987.
- [21] J. Degallaix et al. Measurement of the optical absorption of bulk silicon at cryogenic temperature and the implication for the Einstein Telescope. Classical and Quantum Gravity, 31(18):185010, aug 2014.
- [22] J. D. Jackson. Klassische Elektrodynamik. De Gruyter, 1998.
- [23] A. van der Ziel K. M. van Vliet and R. R. Schmidt. Temperature-fluctuation noise of thin films supported by a substrate. J. Appl. Phys., 51(6):2947, 1980.
- [24] M. L. Gorodetsky V. B. Braginsky and S. P. Vyatchanin. Thermodynamical fluctuations and photo-thermal shot noise in gravitational wave antennae. Phys. Lett. A, 264:1–10, 1999.
- [25] L. L. Landau and E. M. Lifshitz. Theoretical Physics: Statistical Physics. vol.5. Butterworth-Heinemann, 1980.
- [26] A. Chintchin. Korrelationstheorie der stationären stochastischen prozesse. Mathematische Annalen, 109, 1934.
- [27] D. Forster. Hydrodynamic Fluctuations, Broken Symmetry, and Correlation Functions. CRC Press, 1975.
- [28] C. Schinke et al. Uncertainty analysis for the coefficient of band-to-band absorption of crystalline silicon. AIP Advances, 5(6):67168, 2015.
- [29] M. Grundmann. The Physics of semiconductors. Springer, 2016.
- [30] C Jacoboni et al. A review of some charge transport properties of silicon. Solid State Electronics, 20:77–89, February 1977.
- [31] Sheng S. Li and W. Robert Thurber. The dopant density and temperature dependence of electron mobility and resistivity in n-type silicon. Solid-State Electronics, 20(7):609–616, 1977.
- [32] Wolfram Research, Inc. Mathematica, Version 11.3.
- [33] A. Rüdiger W. Winkler, K. Danzmann and R. Schilling. Heating by optical absorption and the performance of interferometric gravitational-wave detectors. Phys. Rev. A, 44:7022–7036, Dec 1991.
| Silicon | ||||
| [1/] | [/Vs] | [/s] | [m] | |
| [30] | ||||
| [31] | ||||
| [31] | ||||
| [31] | ||||
| [31] | ||||
| [31] | ||||
| [31] | ||||
| [31] | ||||
| [31] | ||||
| [31] | ||||
| [31] | ||||
| [31] | ||||
| [31] | ||||
| [31] | ||||
| [31] | ||||
| [31] | ||||
| [31] | ||||
| [31] | ||||
| [31] | ||||