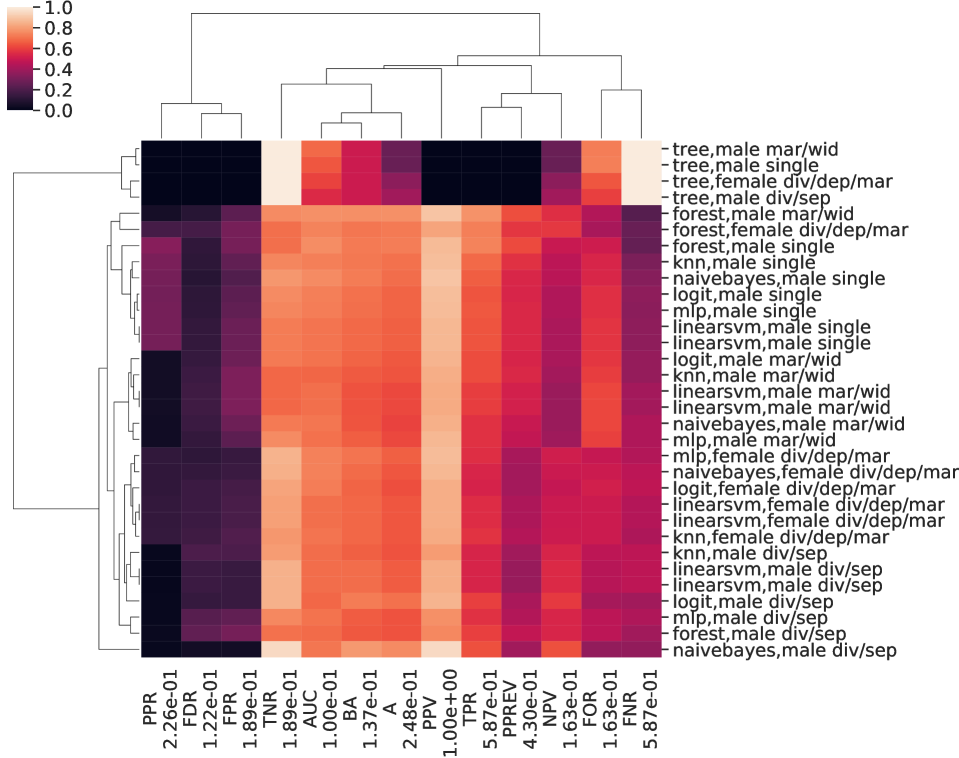
Figure 1: The matrix and the resulting hierarchical clustering for the metrics (columns), and the groups, ML models (lines) for dataset Statlog and protected feature . The metrics are presented along with the corresponding variances.
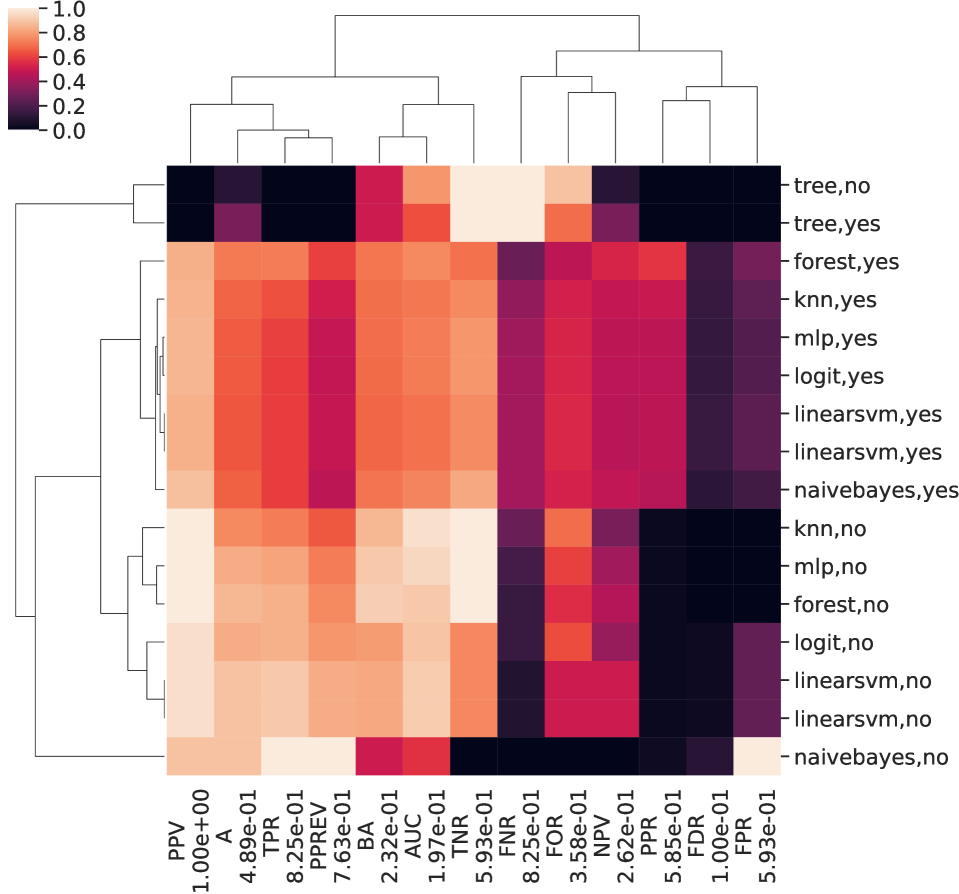
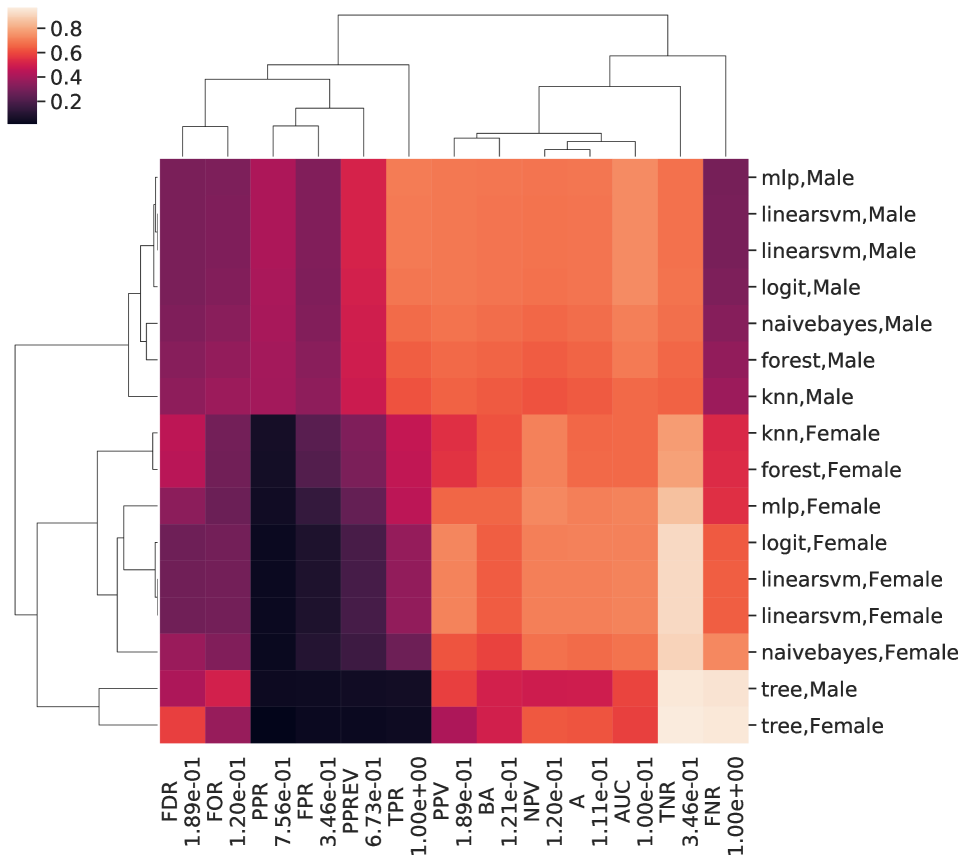
Figure 2: The matrix and the resulting hierarchical clustering for the metrics (columns), and the groups, ML models (lines) for dataset Statlog and protected feature . The metrics are presented along with the corresponding variances.
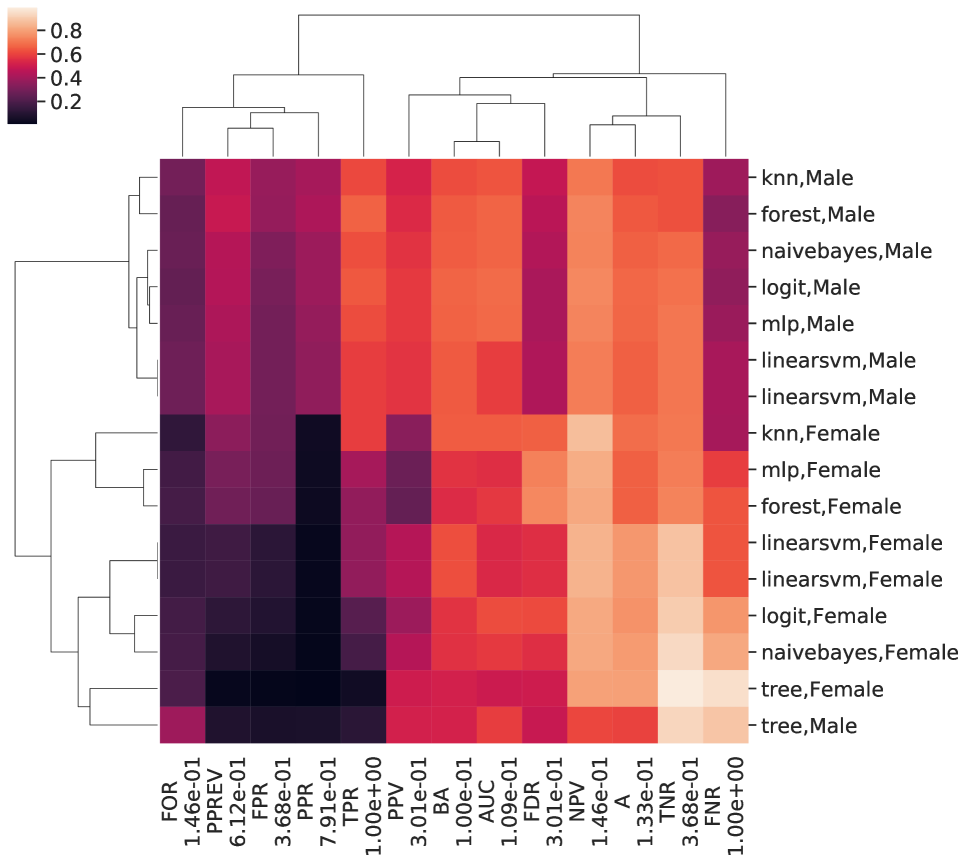
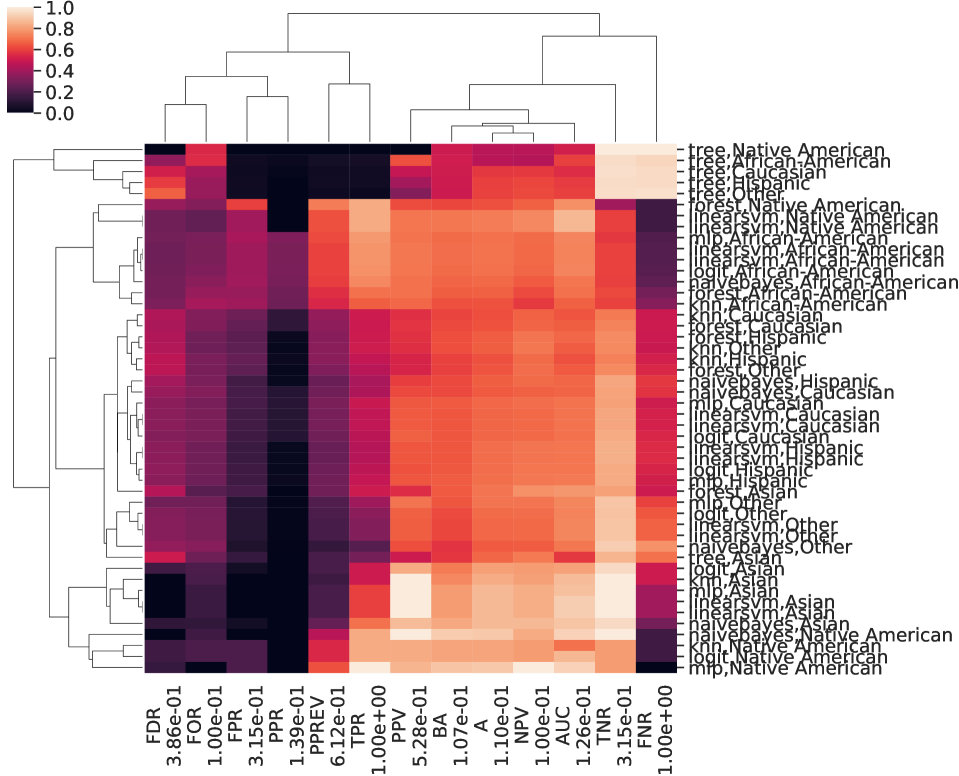
Figure 3: The matrix and the resulting hierarchical clustering for the metrics (columns), and the groups, ML models (lines) for dataset YouthCAT and protected feature . The metrics are presented along with the corresponding variances.
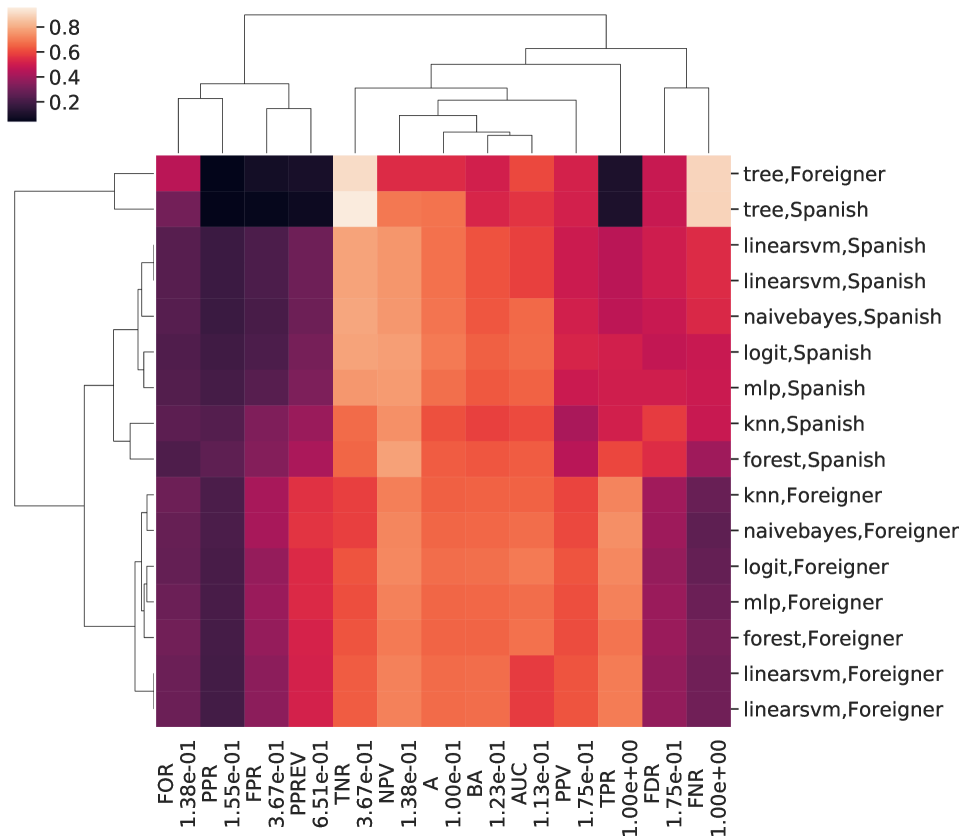
Figure 4: The matrix and the resulting hierarchical clustering for the metrics (columns), and the groups, ML models (lines) for dataset YouthCAT and protected feature . The metrics are presented along with the corresponding variances.
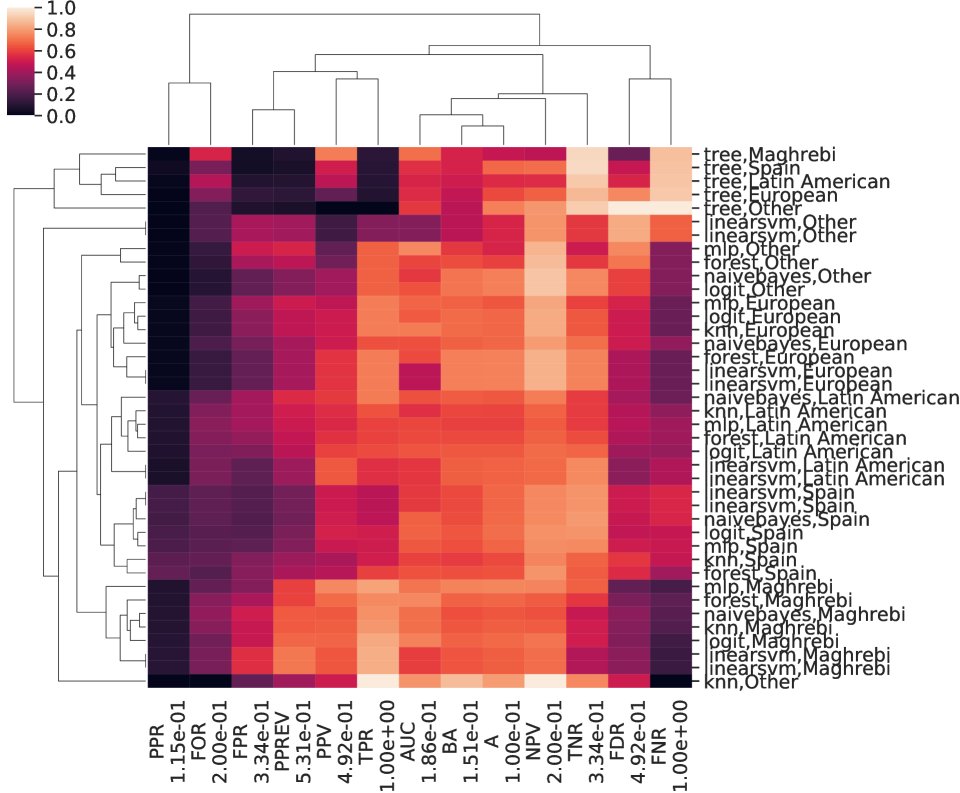
Figure 5: The matrix and the resulting hierarchical clustering for the metrics (columns), and the groups, ML models (lines) for dataset YouthCAT and protected feature . The metrics are presented along with the corresponding variances.
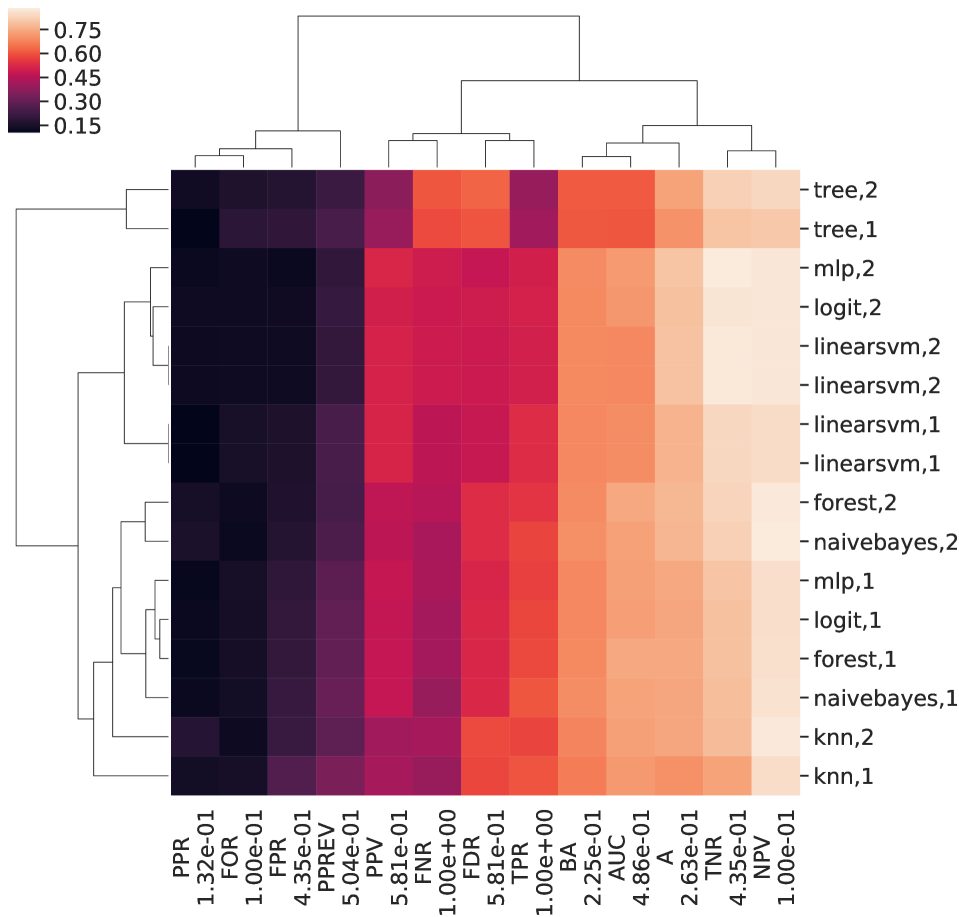
Figure 6: The matrix and the resulting hierarchical clustering for the metrics (columns), and the groups, ML models (lines) for dataset COMPAS and protected feature . The metrics are presented along with the corresponding variances.
Figure 7: The matrix and the resulting hierarchical clustering for the metrics (columns), and the groups, ML models (lines) for dataset COMPAS and protected feature . The metrics are presented along with the corresponding variances.
Figure 8: The matrix and the resulting hierarchical clustering for the metrics (columns), and the groups, ML models (lines) for dataset YouthCAT and protected feature . The metrics are presented along with the corresponding variances.