Is this GitHub Project Maintained? Measuring the Level of Maintenance Activity of Open-Source Projects
Abstract
Context: GitHub hosts an impressive number of high-quality OSS projects. However, selecting “the right tool for the job” is a challenging task, because we do not have precise information about those high-quality projects. Objective: In this paper, we propose a data-driven approach to measure the level of maintenance activity of GitHub projects. Our goal is to alert users about the risks of using unmaintained projects and possibly motivate other developers to assume the maintenance of such projects. Method: We train machine learning models to define a metric to express the level of maintenance activity of GitHub projects. Next, we analyze the historical evolution of 2,927 active projects in the time frame of one year. Results: From 2,927 active projects, 16% become unmaintained in the interval of one year. We also found that Objective-C projects tend to have lower maintenance activity than projects implemented in other languages. Finally, software tools—such as compilers and editors—have the highest maintenance activity over time. Conclusions: A metric about the level of maintenance activity of GitHub projects can help developers to select open source projects.
keywords:
Unmaintained Projects, GitHub, Open Source SoftwareIntroduction
Open source projects have an increasing relevance in modern software development [17], powering applications in practically every domain. Today, over 80% of the software produced is composed by open source code and this trend is growing.111https://www.linuxfoundation.org/blog/chaoss-project-creates-tools-to-analyze-software-development-and-measure-open-source-community-health In a recent investigation conducted by Sonatype222https://www.sonatype.com/2019ssc, they report that downloads of npm packages reached 10 billion per week and 21,448 new open source components are releases per day. For this reason, open source code can be viewed as the backbone of the digital infrastructure that runs our society [17]. Furthermore, the emergence of world-wide code sharing platforms—such as GitHub—is contributing to transform open source development in a competitive market. Indeed, in a recent survey with maintainers, we found that the most common reason for the failure of open source projects is the appearance of a stronger competitor in GitHub [12].
However, GitHub does not include objective data about project’s maintenance activity. Users can access historical data about commits or repository popularity metrics, like number of stars, forks, and watchers. However, based on the values of theses metrics, they should judge by themselves whether a project is under maintenance or not (and therefore whether it is worth to use it). In order to help on this decision, in this paper we propose and evaluate a machine learning approach to measure the level of maintenance activity of GitHub projects. Our goal is to provide a simple and effective metric to alert users about the risks of depending on a given GitHub project. This information can also contribute to attract new maintainers to a project. For example, users of libraries facing the risks of discontinuation can be motivated to assume their maintenance.
Previous work in this area relies on the last commit activity to classify projects as unmaintained or in a similar status. For example, Khondhu et al. [24] use an one-year inactivity threshold to classify dormant projects on SourceForge. The same threshold is used in works by Mens et al. [37], Izquierdo et al. [22], and in our previous work about the motivations for the failure of open source projects [12]. However, in this paper, we do not rely on such thresholds when investigating unmaintained projects due to three reasons. First, because setting a threshold to characterize unmaintained projects is not trivial. For example, in the mentioned works, this decision is arbitrary and it is not empirically validated. Second, our intention is to detect unmaintained projects as soon as possible; preferably, without having to wait for one year of inactivity (or another threshold). Third, our definition of unmaintained projects does not require a complete absence of commits during a given period; instead, a project is considered unmaintained even when sporadic and few commits happen in a time interval. Stated otherwise, in our view, unmaintained projects do not necessarily need to be dead, deprecated, or archived.
In our previous conference paper [14], we proposed a machine learning model to identify unmaintained GitHub projects, using as features standard metrics provided by GitHub, e.g., number of commits, forks, issues, and pull requests. Then, we validated the proposed model with the principal developers of 129 projects, achieving a precision of 80%. Particularly, in this previous work, we provided answers to three research questions:
RQ1: What is the precision of the proposed machine learning model according to GitHub developers? The intention was to check precision in the field, by collecting to the feedback provided by the principal developers of popular GitHub projects.
RQ2: What is the recall of the proposed machine learning model when identifying unmaintained projects? Recall is more difficult to compute in the field, because it requires the identification of all unmaintained projects in GitHub. To circumvent this problem, we compute recall considering only projects that declare in their README they are not under maintenance.
RQ3: How early does the proposed machine learning model identify unmaintained projects? As mentioned, the proposed model does not depend on an inactivity interval to classify a project as unmaintained. Therefore, in this third question, we investigate how early we are able to identify unmaintained projects, e.g., without having to wait for a full year of commit inactivity.
The present work extends our previous conference paper in four key directions. First, we updated our dataset and computed new data points for each feature using data from 2018. Second, we provide answers for two novel research questions:
RQ4: How long does a GitHub project survive before become unmaintained? The goal is to investigate the survival probability over time of the projects classified as unmaintained by the proposed machine learning model. Moreover, we analyze the survival probability of these projects under different perspectives (e.g., organizational or individual account, programming language, and application domain).
RQ5: How often unmaintained projects follow best OSS contribution practices? We investigate whether projects classified as unmaintained follow a set of best open source contribution practices, recommended by GitHub, such as presence of contributing guidelines, presence of project’s license and use of a continuous integration service.
Third, to provide a historical perspective on the valves of the proposed Level of Maintenance Activity (LMA), we use as baseline the projects classified as active in November 2017 and compute new values in the time frame of one year (2018). Fourth, we implemented a public Chrome extension to inform the maintenance level of a GitHub project.
This paper is organized as follows. In Section 2, we present and evaluate a machine learning model to identify unmaintained projects. Section 3 validates this model with GitHub developers and projects that are documented as deprecated. In Section 4, we assess the characteristics of projects classified as unmaintained by our model. Section 5 defines and discusses the Level of Maintenance Activity (LMA) metric. Section 6 lists threats to validity and Section 7 discusses related work. Section 8 concludes the paper and outlines further work.
Machine Learning Model
In this section, we describe our machine learning approach to identify projects that are no longer under maintenance.
Experimental Design
Dataset. We start with a dataset containing the top-10,000 most starred projects on GitHub (in November, 2017). Stars—GitHub’s equivalent for likes in other social networks—is a common proxy for the popularity of GitHub projects [48, 7]. Then, we follow three strategies to discard projects from this initial selection. First, we remove 2,810 repositories that have less than two years from the first to the last commit (because we need historical data to compute the features used by the prediction models). Second, we remove 331 projects with null size, measured in lines of code (typically, these projects are implemented in non-programming languages, like CSS, HTML, etc). Finally, we remove 74 non-software projects, which are identified by searching for the following topics: books and awesome-lists. We end up with a list of 6,785 projects.
Next, we define two subsets of systems: active and unmaintained. The active (or under maintenance) group is composed by 754 projects that have at least one release in the last month, including well-known projects, like facebook/react, d3/d3, and nodejs/node. Thus, we assume that these projects are active (under maintenance). By contrast, the unmaintained group is composed by 248 projects, including 104 projects that were explicitly declared by their principal developers as unmaintained in our previous work [12] and 144 archived projects. Archiving is a feature provided by GitHub that allows developers to explicitly move their projects to a read-only state. In this state, users cannot create issues, pull requests, or comments, but can still fork or star the projects.
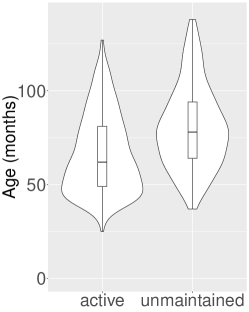
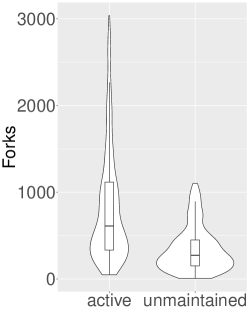
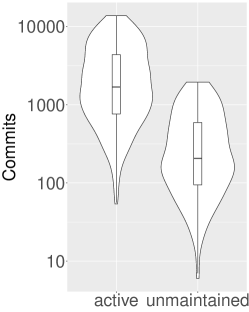

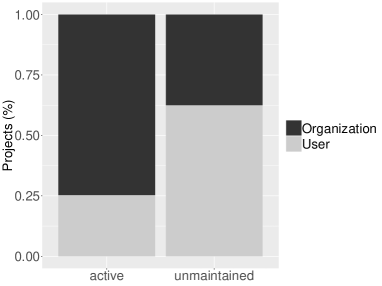
Figure 1 shows violin plots with the distribution of age (in months), number of forks, number of commits, and number of stars of the selected repositories. We provide plots for the 754 active projects and for the 248 unmaintained projects. As we can check, unmaintained projects are older than the active ones (78 vs 62 months, median measures); but they have less forks (299 vs 735), less commits (241 vs 2,136), and less stars (1,714 vs 4,078). In our dataset, active projects are composed by 74% of organizational projects and 26% of user projects. By contrast, unmaintained projects consists of 37% and 63% of organizational and user projects, respectively (Figure 2).
Features. Our hypothesis is that a machine learning classifier can identify unmaintained projects by considering features about (1) projects, including number of forks, issues, pull requests, and commits; (2) contributors, including number of new and distinct contributors (the rationale is that maintenance activity might increase by attracting new developers); (3) project owners, including number of projects he/she owns and total number of commits in GitHub (the rationale is that maintenance might be affected when project owners have many projects on GitHub). In total, we consider 13 features, as described in Table 1. The feature values are collected using GitHub’s official API. However, they do not refer to the whole history of a project, but only to the last months, counting from the last commit; moreover, we collect each feature in intervals of months. The goal is to derive temporal series of feature values, which can be used by a machine learning algorithm to infer trends in the project evolution, e.g., an increasing number of opened issues or a decreasing number of commits. Figure 3 illustrates the feature collection process assuming that is 24 months and that is 3 months. In this case, for each feature, we collect 8 data points, i.e., feature values.
| Dimension | Feature | Description |
| Project | Forks | Number of forks created by developers |
| Open issues | Number of issues opened by developers | |
| Closed issues | Number of issues closed by developers | |
| Open pull requests | Number of pull requests opened by the developers | |
| Closed pull requests | Number of pull requests closed by the developers | |
| Merged pull requests | Number of pull requests merged by the developers | |
| Commits | Number of commits performed by developers | |
| Max days without commits | Maximum number of consecutive days without commits | |
| Max contributions by developer | Number of commits of the developer with most commits | |
| Contributor | New contributors | Number of contributors who made their first commit |
| Distinct contributors | Number of distinct contributors that committed | |
| Owner | Projects created by the owner | Number of projects created by a given owner |
| Number of commits of the owner | Number of commits performed by a given owner |
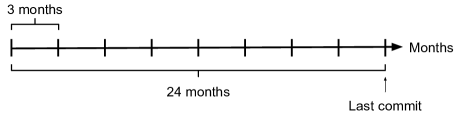
We experiment with different combinations of and ; each one is called a scenario, in this paper. Table 2 describes the total number of data points extracted for each scenario. This number ranges from 13 data points (scenario with features extracted in a single interval of 6 months) to 104 data points (scenario with features extracted in intervals of 3 months during 24 months, as in Figure 3).
| Scenario | 1 | 2 | 3 | 4 | 5 | 6 | 7 | 8 | 9 | 10 |
|---|---|---|---|---|---|---|---|---|---|---|
| Length | 6 | 6 | 12 | 12 | 12 | 18 | 18 | 24 | 24 | 24 |
| Intervals | 3 | 6 | 3 | 6 | 12 | 3 | 6 | 3 | 6 | 12 |
| Data points | 26 | 13 | 52 | 26 | 13 | 78 | 39 | 104 | 52 | 26 |
Correlation Analysis. As usual in machine learning experiments, we remove correlated features, following the process described by Bao
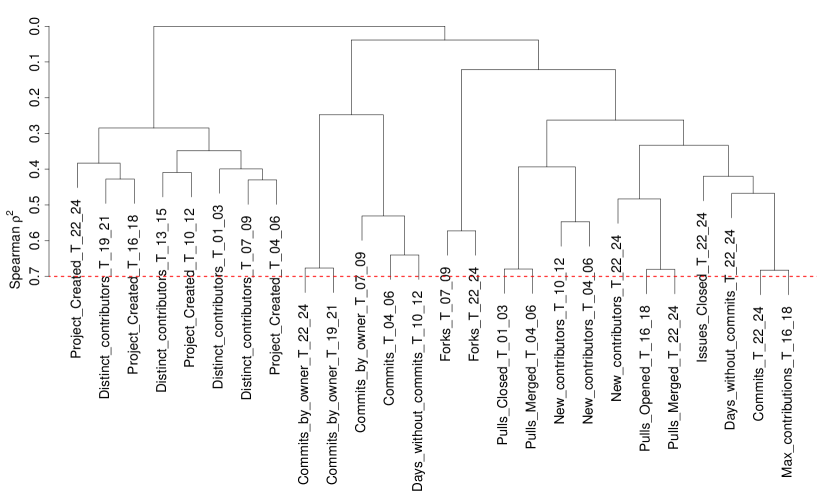
et al. [3]. To this purpose, we use a clustering analysis—as implemented in a R package named Hmisc333http://cran.r-project.org/web/packages/Hmisc/index.html—to derive a hierarchical clustering of correlations among data points (extracted for the features in each scenario). For sub-hierarchies with correlations larger than 0.7, we select only one data point for inclusion in the respective machine learning model, as common in other works [3, 53].
For example, Figure 4 shows the final hierarchical clustering for the scenario with 24 months, considering a 3-month interval (scenario 8). The analysis in this scenario checks correlations among 104 data points (13 features 8 data points per feature). As a result, 78 data points are removed due to correlations with other points and therefore do not appear in the dendogram presented in Figure 4. Finally, Table 3 shows the total number and percentage of data points removed in each scenario, after correlation analysis. As we can see, the percentage of removed points is relevant, ranging from 43% (scenario 7) to 75% (scenario 8).
| Scenario | 1 | 2 | 3 | 4 | 5 | 6 | 7 | 8 | 9 | 10 |
|---|---|---|---|---|---|---|---|---|---|---|
| # | 17 | 6 | 38 | 18 | 7 | 56 | 17 | 78 | 34 | 19 |
| % | 65 | 46 | 73 | 69 | 54 | 72 | 43 | 75 | 65 | 73 |
Machine Learning Classifier.
We use the data points extracted in each scenario to train and test models for predicting whether a project is unmaintained. In other words, we train and test ten machine learning models, one for each scenario. After that, we select the best model/scenario to continue with the paper. Particularly, we use the Random Forest algorithm [8] to train the models because it has several advantages, such as robustness to noise and outliers [53]. In addition, it is adopted in many other software engineering works [38, 41, 43, 21]. We compare the result of Random Forest with two baselines: baseline #1 (all projects are predicted as unmaintained) and baseline #2 (random predictions). We use the Random Forest implementation provided by randomForest’s R package444https://cran.r-project.org/web/packages/randomForest/ and 5-fold stratified cross validation to evaluate the models effectiveness. In 5-fold cross validation, we randomly divide the dataset into five folds, where four folds are used to train a classifier and the remaining fold is used to test its performance. Specifically, stratified cross validation is a variant, where each fold has approximately the same proportion of each class [8]. We perform 100 rounds of experiments and report average results.
Evaluation Metrics. When evaluating the projects in the test fold, each project has four possible outcomes: (1) it is truly classified as unmaintained (True Positive); (2) it is classified as unmaintained but it is actually an active project (False Positive); (3) it is classified as an active project but it is actually an unmaintained one (False Negative); and (4) it is truly classified as an active project (True Negative). Considering these possible outcomes, we use six metrics to evaluate the performance of a classifier: precision, recall, F-measure, accuracy, AUC (Area Under Curve), and Kappa, which are commonly adopted in machine learning studies [53, 52, 16, 26, 30]. Precision and recall measure the correctness and completeness of the classifier, respectively. F-measure is the harmonic mean of precision and recall. Accuracy measures how many projects are classified correctly over the total number of projects. AUC refers to the area under the Receiver Operating Characteristic (ROC) curve. Finally, kappa evaluates the relationship between the observed accuracy and the expected one [44], which is particularly relevant in imbalanced datasets, as the dataset used to train the machine learning models (754 active projects vs 248 unmaintained ones).
| Metrics | 0.5 Year | 1 Year | 1.5 Years | 2 Years | ||||||
|---|---|---|---|---|---|---|---|---|---|---|
| 3 mos | 6 mos | 3 mos | 6 mos | 12 mos | 3 mos | 6 mos | 3 mos | 6 mos | 12 mos | |
| Accuracy | 0.90 | 0.91 | 0.91 | 0.90 | 0.89 | 0.91 | 0.90 | 0.92 | 0.91 | 0.90 |
| Precision | 0.83 | 0.87 | 0.87 | 0.84 | 0.82 | 0.86 | 0.83 | 0.86 | 0.85 | 0.83 |
| Recall | 0.78 | 0.74 | 0.77 | 0.75 | 0.72 | 0.78 | 0.76 | 0.81 | 0.79 | 0.73 |
| F-measure | 0.80 | 0.79 | 0.81 | 0.79 | 0.77 | 0.82 | 0.79 | 0.83 | 0.82 | 0.78 |
| Kappa | 0.74 | 0.74 | 0.76 | 0.73 | 0.70 | 0.76 | 0.73 | 0.78 | 0.76 | 0.71 |
| AUC | 0.86 | 0.85 | 0.86 | 0.85 | 0.83 | 0.87 | 0.85 | 0.88 | 0.87 | 0.84 |
Experimental Results
Table 4 shows the results for each scenario. As we can see, Random Forest has the best results (in bold) when the features are collected during 2 years, in intervals of 3 months. In this scenario, precision is 86% and recall is 81%, leading to a F-measure of 83%. Kappa is 0.78—usually, kappa values greater than 0.60 are considered quite representative [27]. Finally, AUC is 0.88, which is an excellent result in the Software Engineering domain [30, 51, 53]. Table 5 compares the results of the best scenario/model with baseline #1 (all projects are predicted as unmaintained) and baseline #2 (random predictions). Despite the baseline under comparison, there are major differences in all evaluation metrics. For example, F-measure is 0.37 (baseline #1) and 0.30 (baseline #2), against 0.83 (proposed model).
| Metrics | Model | Baseline #1 | Baseline #2 |
|---|---|---|---|
| Accuracy | 0.92 | 0.22 | 0.49 |
| Precision | 0.86 | 0.22 | 0.22 |
| Recall | 0.81 | 1.00 | 0.48 |
| F-measure | 0.83 | 0.37 | 0.30 |
| Kappa | 0.78 | 0.00 | 0.01 |
| AUC | 0.88 | 0.50 | 0.49 |
Random Forest produces a measure of the importance of the predictor features. Table 6 shows the top-5 most important features by Mean Decrease Accuracy (MDA), for the best model. Essentially, MDA measures the increase in prediction error (or reduction in prediction accuracy) after randomly shifting the feature values [10, 34]. As we can see, the most important feature is the number of commits in the last time interval (i.e., the interval delimited by months 22-24, ), followed by the maximal number of days without commits in the same interval and in the interval . As also presented in Table 6, the first four features are related to commits; the first feature non-related with commits is the number of issues closed in the first time interval ().
| Feature | Period | MDA |
|---|---|---|
| Commits | T22,24 | 38.5 |
| Max days without commits | T22,24 | 28.6 |
| Max days without commits | T10,12 | 21.9 |
| Max contributions by developer | T16,18 | 21.1 |
| Closed issues | T1,3 | 18.0 |
Empirical Validation
In this section, we validate the proposed machine learning model by means of a survey with the owners of projects classified as unmaintained and also with a set of deprecated GitHub projects.
Overall, our goal is to strengthen the confidence on the practical value of the model proposed in this work. Particularly, in this section we provide answers to first three research questions about this model:
RQ1: What is the precision according to GitHub developers?
RQ2: What is the recall when identifying deprecated projects?
RQ3: How early does the model identify unmaintained projects?
Methodology
RQ1: To answer RQ1, we conduct a survey with GitHub developers. To select the participants, we first apply the proposed machine learning model in all projects from our dataset that were not used in the model’s construction, totaling 5,783 projects (6,785 1,002 projects). Then, we select 2,856 projects classified as unmaintained by the proposed model. From this sample, we remove 264 projects whose developers were recently contacted in our previous surveys [12, 13]. We make this decision to not bother again these developers, with new e-mails and questions. Finally, we remove 2,270 projects whose owners do not have a public e-mail address on GitHub. As a result, we obtain a list of 323 survey participants (2,856 2,270 264). However, before e-mailing these participants, the first author inspected the main page of each project on GitHub, to check whether it includes mentions to the project status, in terms of maintenance. We found 21 projects whose documentation states they are no longer maintained, by means of messages like this one:
This project is deprecated. It will not receive any future updates or bug fixes. If you are using it, please migrate to another solution.
Therefore, we do not send mails to the project owners, in such cases; and automatically consider these 21 projects as unmaintained.
Survey Period:
The survey was performed in the first two weeks of May, 2018. It is important to highlight that the machine learning model was constructed using data collected on November, 2017. Therefore, the unmaintained predictions evaluated in the survey refer to this date. We wait five months to ask the developers about the status of their projects because it usually takes some time until developers actually accept the unmaintained condition of their projects. In other words, this section is based on predictions performed and available on November, 2017. However, these predictions are validated five months later, on May, 2018.
Survey Pilot and Questions: Initially, we perform a pilot survey with 75 projects ( 25%), randomly selected among the remaining 302 projects (323 21 projects). We e-mail the principal developers of these projects with a single open question, asking them to confirm (or not) if their projects are unmaintained. We received 23 answers, which corresponds to a response ratio of 30.6%. Then, two authors of this paper analyzed together the received answers to derive a list of recurrent themes. As a result, the following three common maintainability status were identified:555Project names are omitted, to preserve the respondent’s anonymity; survey participants are identified by means of labels, in the format Pxx, where xx is an integer.
-
1.
My project is under maintenance and new features are under implementation (6 answers): As an example, we can mention the following answer:
[Project-Name] is still maintained. I maintain the infrastructure side of the project myself (e.g., make sure it’s compatible with the latest Ruby version, coordinate PRs and issues, mailing list, etc.) while community provides features that are still missing. One such big feature is being developed as we speak and will be the highlight of the next release. (P57)
-
2.
My project is finished and I only plan to fix important bugs (13 answers): As an example, we mention the following answers:
It’s just complete, at least for now. I still fix bugs on the rare occasion they are reported. (P10)
I view it as basically “done”. I don’t think it needs any new features for the foreseeable future, and I don’t see any changes as urgent unless someone discovers a major security vulnerability or something. I will probably continue to make changes to it a couple times per year, but mostly bug fixes. (P68)
-
3.
My project is deprecated and I do not plan to implement new features or fix bugs (4 answers): As an example, we can mention the following answer:
The project is unmaintained and I’ll archive it. (P74)
After the pilot study, we proceed with the survey, by e-mailing the remaining 227 projects. However, instead of asking an open question—as in the pilot—we provide an objective question to the survey participants, about the maintainability status of their projects. In this objective question, we ask the participants to select one (out of three) status identified in the pilot study, plus an other option. This fourth option also includes a text form for the participants detailing their answers, if desired. Essentially, we change to an objective question format to make answering the survey easier, but without limiting the respondents’ freedom to provide a different answer from the listed ones. In this final survey, we received 89 answers, representing a response ratio of 39.2%. When considering both phases (pilot and final survey), we sent 302 e-mails, received 112 answers, representing an overall response ratio of 37.1%. After adding the 21 projects that document their maintainability status, this empirical validation is based on 133 projects.
RQ2: To answer this second question, we construct a ground truth with projects that are no longer being maintained. First, we build a script to download the README (the main page of GitHub’s projects) and search for a list of sentences that are commonly used to declare the unmaintained state of GitHub projects. This list is reused from our previous work [12], where we study the motivations for the failure of open source projects. It includes 32 sentences; in Table 7, we show a partial list, with 15 sentences.
| no longer under development, no longer supported or updated, |
| deprecation notice, dead project, deprecated, unmaintained, |
| no longer being actively maintained, not maintained anymore, |
| not under active development, no longer supported, |
| is not supported, is not more supported, no longer supported, |
| no new features should be expected, isn’t maintained anymore |
We searched (in May, 2018) for these sentences in the README of 5,783 projects, which represent all 6,785 projects selected for this work minus 1,002 projects used in Section 2. In 451 READMEs (7.8%) we found the mentioned sentences. Then, the first author of this paper carefully inspected each README, to confirm the sentences indeed refer to the project’s status, in terms of maintenance. In the case of 112 projects ( 25%), he confirmed this fact. Therefore, these projects are considered as a ground truth for this investigation. Usually, the unconfirmed cases refer to the deprecation of specific elements, e.g., methods or classes.
RQ3: To answer this third research question, we rely on projects whose unmaintained status, as predicted by the proposed model, is confirmed by the participants of the survey conducted in RQ1. Then, we compute the number of days between November 30, 2018 (when the machine learning model proposed in this paper was built) and the last commit of the mentioned projects. For projects where this interval is less than one year, the proposed model is better than the strategy adopted in previous work [24, 37, 22, 12], which requires one year of commit inactivity to identify unmaintained projects.
Results
RQ1: Precision according to GitHub developers
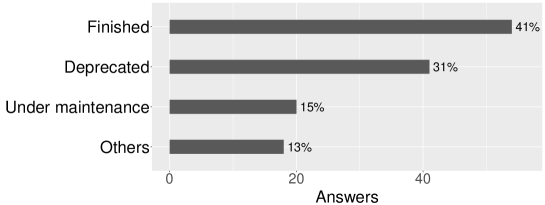
Before presenting the precision results, Figure 5 shows the survey results, including answers retrieved from the project’s documentation, answers received in the pilot and answers received in the final survey. As we can see, the most common status, with 54 answers (41%) refers to finished projects, i.e., cases where maintainers see their projects as feature-completed and only plan to resume the maintenance work if relevant bugs are reported.666In our previous work [12], we also identified finished or completed open source projects. However, we argued these projects do not contradict Lehman’s Laws about software evolution [29], because they usually deal with a very stable or controlled environment (whereas Lehman’s Laws focus on E-type systems, where E stands for evolutionary). We also received 41 answers (31%) mentioning the projects are deprecated and no further maintenance is planned, including the implementation of new features and bug fixes. Finally, we received 18 answers in the other option. In this case, four participants did not describe their answer or provide unclear answers; furthermore, one participant mentioned his project is in a limbo state:
The status of [Project-Name] fits into a special category. Some of the tools it’s based on are either deprecated or not powerful enough for the goal of the project. This is part of the reason what’s keeping the project from being “done”. I would call this status limbo. (P24)
Seven participants answered their projects are stalled, as in this answer:
It is under going a rewrite… but has been stalled based on my own priorities (P33)
To compute precision, we consider as true positive answers related to the following status: finished (54 answers), deprecated (41 answers), stalled (7 answers), and limbo (1 answer). The remaining answers are interpreted as false positives, including answers mentioning that new features are being implemented (20 answers) and the answers associated to the fourth option (other option), but without including a description or with an unclear description (4 answers). By following this criteria, we received 103 true positive answers and 26 false positive ones, resulting in a precision of 80%.777This computation of precision assumes that finished projects are unmaintained. However, we recognize that the risks of using finished projects might be lower than the ones faced when using deprecated or stalled projects.
By validating the proposed model with 129 GitHub developers, we achieve a precision of 80%, which is a result very close to the one obtained when building the model (86%). \endMakeFramed
RQ2: Recall considering deprecated projects
The proposed machine learning model classifies 108 (out of 112) projects of the constructed ground truth as unmaintained, which represents a recall of 96%. This value is significantly greater than the one computed when testing the model in Section 2. Probably, this difference is explained by the fact that only projects that are completely unmaintained expose this situation in their READMEs. Therefore, it is easier to detect and identify this condition.
By validating the proposed model with projects that declare themselves as unmaintained, we achieve a recall of 96%. \endMakeFramed
RQ3: How early can we detect unmaintained projects?
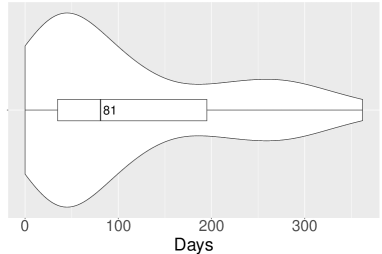
77 (out of 103) projects classified as true positives by the surveyed developers have commits after November, 2016. Therefore, these projects would not be classified as unmaintained using the strategy followed in the literature, which requires one year of commit inactivity. In other words, in November, 2017, the proposed model classified 77 projects as unmaintained, despite the existence of recent commits, with less than one year. Figure 6 shows a violin plot with the age of such commits, considering the date of November, 2017. The first, second, and third quartiles are 35, 81, and 195. Interestingly, for two projects the last commit occurred exactly on November, 30, 2018. Despite this fact, the proposed model classified these projects as unmaintained in the same date. If we relied on the standard threshold of one year without commits, these projects would have had to wait one year to receive this classification.
75% of the studied projects are classified as unmaintained despite having recent commits, performed in the last year. \endMakeFramed
Characteristics of Unmaintained Projects
In this section, we assess the characteristics of 2,856 projects classified as unmaintained by the proposed model. Although this model is not fully accurate, it showed a precision of 86% in a dataset containing 754 active and 248 unmaintained projects (Section 2.2). Moreover, it achieved a precision of 80%, when validated with the developers of 129 GitHub projects (Section 3.2). Therefore, this high precision measures—in different contexts—stimulated us to rely on the model to shed light on the characteristics of a large sample of unmaintained GitHub projects.
Particularly, we provide answers to two research questions:
RQ4: How long does a GitHub project survive before become unmaintained? The goal is to provide quantitative data about the lifetime of GitHub projects.
RQ5: How often unmaintained projects follow best OSS contribution practices? With this question, the goal is to check whether common contribution practices contribute to extend the lifetime of GitHub projects.
| Maintenance Practice | Description |
|---|---|
| License | Presence of project’s license (e.g., Apache, GNU, MIT) |
| Home Page | Availability of a dedicated homepage in a non-GitHub-based domain |
| Continuous Integration | Use of a continuous integration service (i.e., we check whether the projects use Travis CI, which is the most popular CI service on GitHub [20]) |
| Contributing Guidelines | Presence of contributing guidelines to help external developers make meaningful and useful contributions to the project |
| Issue Template | Presence of an issue template (to instruct developers to write issues according to the repository’s guidelines) |
| Code of Conduct | Presence of a code of conduct, establishing expectations for behavior of the project’s participants [55] |
| Pull Request Template | Presence of a pull request template, which is a document to help developers to submit pull requests according to the repositories guidelines |
| Support File | Presence of a support file to direct contributors to specific support guidelines, such as community forums, FAQ documents, or support channels |
| First-timers-only issues | Presence of labels recommending issues to newcomers (e.g., help wanted or good-first-issue) |
Methodology
RQ4: To answer this fourth research question, we apply a survival analysis algorithm on 2,856 projects classified as unmaintained by our model. Survival analysis is a well-known technique, which is used for example on medical sciences to compute the probability of patients to stay alive for a certain number of days [15]. Moreover, survival analysis was successfully used in several software engineering studies [35], [56], [47], [31]. In this work, we use survival analysis considering the lifetime of GitHub projects. In other words, we analyze the survival probability of a project over time. To determine the lifetime of a GitHub project, we compute the time difference between the first and last commit dates. Then, we use the Kaplan-Meier [23] non-parametric approximation to compute the survival curve, witch is the most widely used curve for estimating survival probabilities.
RQ5: To answer this last research question, we investigate whether projects classified as unmaintained follow (or not) a set of best open source contribution practices, which are recommended by GitHub.888https://opensource.guide The rationale of this study is to compare the adoption of these practices between active and unmaintained projects. For each project, we collect the practices described in Table 8.999Seven of these contribution practices are explicitly recommended at: https://help.github.com/articles/helping-people-contribute-to-your-project
Results
RQ4: How long does a GitHub project survive before become unmaintained?
Figure 7 shows the survival plot of 2,856 unmaintained projects, as classified by our model. As we only studied projects with at least 24 months, the survival curve is constant during this initial time frame. By inspecting Figure 7, we observe that the likelihood of an unmaintained project surviving for more than 50 months is close to 50%. However, after 84 months (seven years) it declines to less than 10%. In other words, 50% of the unmaintained projects considered in this study moved to this state after 50 months ( 4 years) and only 10% remained active for more than 7 years.

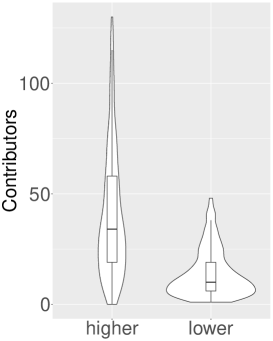
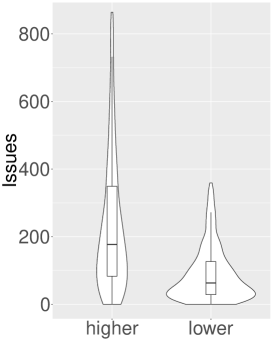
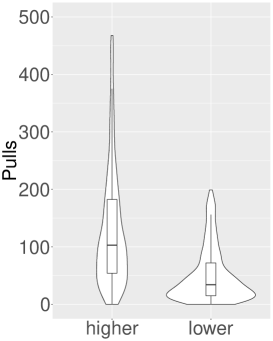
Next, we investigate the characteristics of the projects with lower and higher survivability among the 2,856 unmaintained projects. The projects with lower survival probabilities are those in the first quartile, i.e., the lowest 25% projects. In contrast, the projects with higher survival probabilities are those in the fourth quartile, i.e., the highest 25% projects.
Figure 8 shows the distribution of the projects by (a) contributors, (b) issues, and (c) pull requests. As we can see, there is an important difference between the projects with higher and lower survivability on GitHub, in terms of total number of contributors, issues, and pull requests. These features seem to have an effect on the survivability of open source projects. Therefore, we reinforce the importance of always attract new contributors to GitHub projects. However, it is also important to consider that association does not imply causation. For example, by just attracting a high number of issues or pull requests, a project does not necessarily will have long survival.
Comparing the groups of projects with lower and higher survivability, we found a small effect size for continuous integration, followed by the adoption of contributing guidelines. For example, for projects with lower survivability, the percentage of projects following these practices are 38% and 15%, respectively. For the projects with higher survivability, the same values are 59% and 23%, respectively.
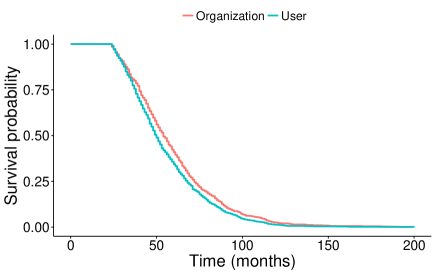
We also generate specific survival plots for three projects features: account type, programming language, and application domain. Figure 9a shows the survival plots for projects owned by organizations and individual users. As we can see, projects maintained by organizations have slightly greater survival probabilities than projects whose owner is an individual GitHub user. For example, after four years, the survival probabilities are 53% and 60%, for user and organization-owned projects, respectively. The distributions are statistically different, according to the one-tailed variant of the Mann-Whitney U test (p-value 0.05). However, we compute Cliff’s delta (or ) to show the effect size of this difference and we found a negligible effect size.
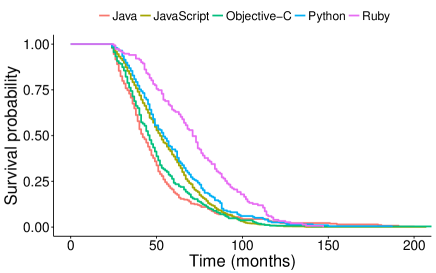
Figure 9b shows the survival probabilities for the top-5 programming languages with more projects in our set of unmaintained projects. By applying Kruskal-Wallis test to compare multiple samples, we found that these distributions are different (p-value 0.05). The greatest difference happens between projects implemented in Java and Ruby. Particularly, projects implemented in Ruby tend to have higher survival probabilities than in other languages. By contrast, Java projects show lower survival probabilities. For example, after four years, the survival probabilities are 38% and 79%, for Java and Ruby projects, respectively.
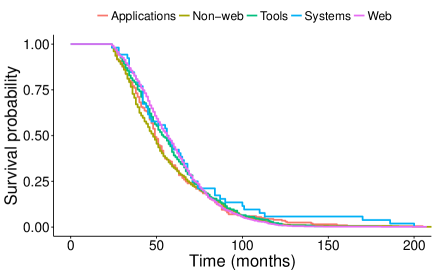
Finally, Figure 9c shows survival plots by application domain. To this propose, the first author of this paper manually classified the projects in five major application domains: Application software, Non-web libraries and frameworks, Software tools, System software, and Web libraries and frameworks. We reused these domains from a similar classification performed by Borges et al. [7, 48]. The same domains are used in others studies [12, 6]. By applying Kruskal-Wallis, the highest statistical difference occurs between Non-web and Web applications. For example, after four years, the survival probabilities are 50% and 63%, for Non-web and Web projects, respectively. Therefore, Web libraries tend to survive for more time than Non-web ones. Finally, we can also observe that Systems software have the highest survival probabilities. For example, after 8 years, the survival probabilities is twice than in other domains.
After characterizing the unmaintained projects, we found that there is a negligible difference on the survival probabilities of projects owned by individual and organizational accounts. Moreover, Ruby projects show higher probabilities of survival. Finally, Systems Software is the application domain with the highest survival probability. \endMakeFramed
RQ5: How often unmaintained projects follow best OSS contribution practices?
In this last RQ, we compare the adoption of a set of well-known contribution practices between active and unmaintained projects. First, we analyze the statistical significance of the difference in the usage of each practice between these groups of projects, by applying the Mann-Whitney test at p-value = 0.05. To show the effect size, we use Cliff’s delta. Following the guidelines of previous work [19, 54, 32], we interpret the effect size as small for , medium for , and large for .
Table 9 shows the percentage of projects following each practice, considering Active vs Unmaintained projects. We found a negligible effect size for all practices, with the exception of continuous integration, contributing guidelines, and first-timers-only issues, when the effect size is small.
| Maintenance Practice | Active | Unmaintained | Effect | |
|---|---|---|---|---|
| License | 0.83 | 0.73 | 0.10 | negligible |
| Home Page | 0.65 | 0.51 | 0.14 | negligible |
| Continuous Integration | 0.71 | 0.45 | 0.26 | small |
| Contributing Guidelines | 0.44 | 0.20 | 0.24 | small |
| Issue Template | 0.08 | 0.02 | 0.06 | negligible |
| Code of Conduct | 0.13 | 0.03 | 0.10 | negligible |
| Pull Request Template | 0.03 | 0.00 | 0.03 | negligible |
| Support File | 0.01 | 0.01 | 0.00 | negligible |
| First-timers-only issues | 0.53 | 0.31 | 0.22 | small |
There is a small effect size between active and unmaintained projects for continuous integration, followed by the adoption of contributing guidelines, and the presence of labels recommending issues to newcomers. In contrast, the remaining practices revealed a negligible effect or does not exist in statistical terms. \endMakeFramed
Level of Maintenance Activity
In this section, we define a metric to express the level of maintenance activity of GitHub projects, i.e., a metric that reveals how often a project is being maintained. The goal is to alert users about projects that although classified as active by the proposed model are indeed close to an unmaintained status.
Definition
The proposed machine learning model—generated by Random Forest—consists of multiple decision trees built randomly. Each tree in the ensemble determines a prediction to a target instance and the most voted class is considered as the final output. One possible prediction type of the Random Forest is the matrix of class probabilities. This matrix represents the proportion of the trees’ votes. For example, projects predicted as active have probability ranging from 0.5 to 1.0. If , the project is very similar to an unmaintained project; by contrast, means the project is actively maintained. Using these probabilities, we define the level of maintenance activity (LMA) of a GitHub project as follows:
This equation simply converts the probabilities computed by Random Forest to a range from 0 to 100; LMA equals to 0 means the project is very close to an unmaintained classification (since ); and LMA equals to 100 denotes a project that is actively maintained (since ). We do not calculate LMA for unmaintained projects, i. e., projects that received a random forest probability estimation lower than 0.5.
Results
Figure 10 shows the LMA values for each project predicted as active (2,927 projects, after excluding the projects used to train and test the proposed model, in Section 2). The first, second, and third quartiles are 48, 82, and 97, respectively. In other words, most studied projects are under constant maintenance (median 82). Indeed, 171 projects (5.8%) have a maximal LMA, equal to 100. This list includes well-known and popular projects such as twbs/bootstrap, meteor/meteor, rails/rails, webpack/webpack, and elastic/elasticsearch.
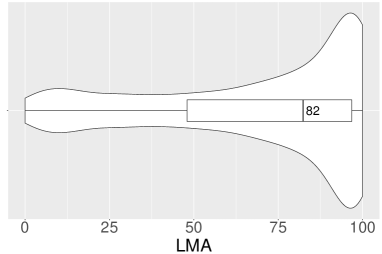
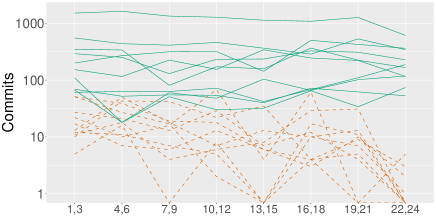
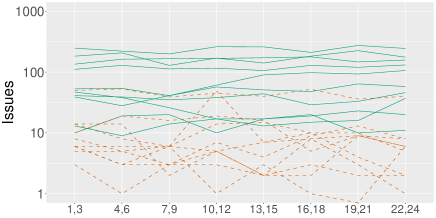
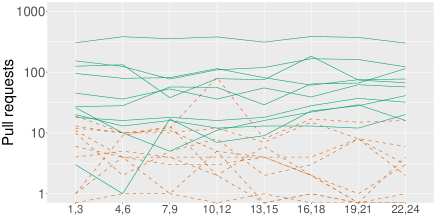
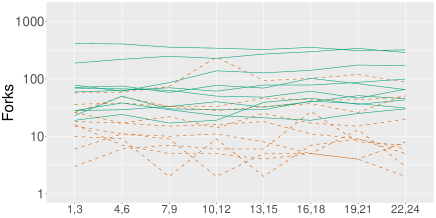
Figure 11 compares a random sample of 10 projects with LMA equals to 100 (actively maintained, therefore) with ten projects with the lowest LMA (0 LMA 0.4). These projects are compared using number of commits (Figure 11a), number of issues (Figure 11b), number of pull requests (Figure 11c), and number of forks (Figure 11d), in the last 24 months. Each line represents the project’s metric values. The figures reveal major differences among the projects, regarding these metrics. Usually, the projects with high LMA present high values for the four considered metrics (commits, issues, pull requests, and forks), when compared with projects with low LMA. In other words, the figures suggest that LMA plays an aggregator role of maintenance activity over time.
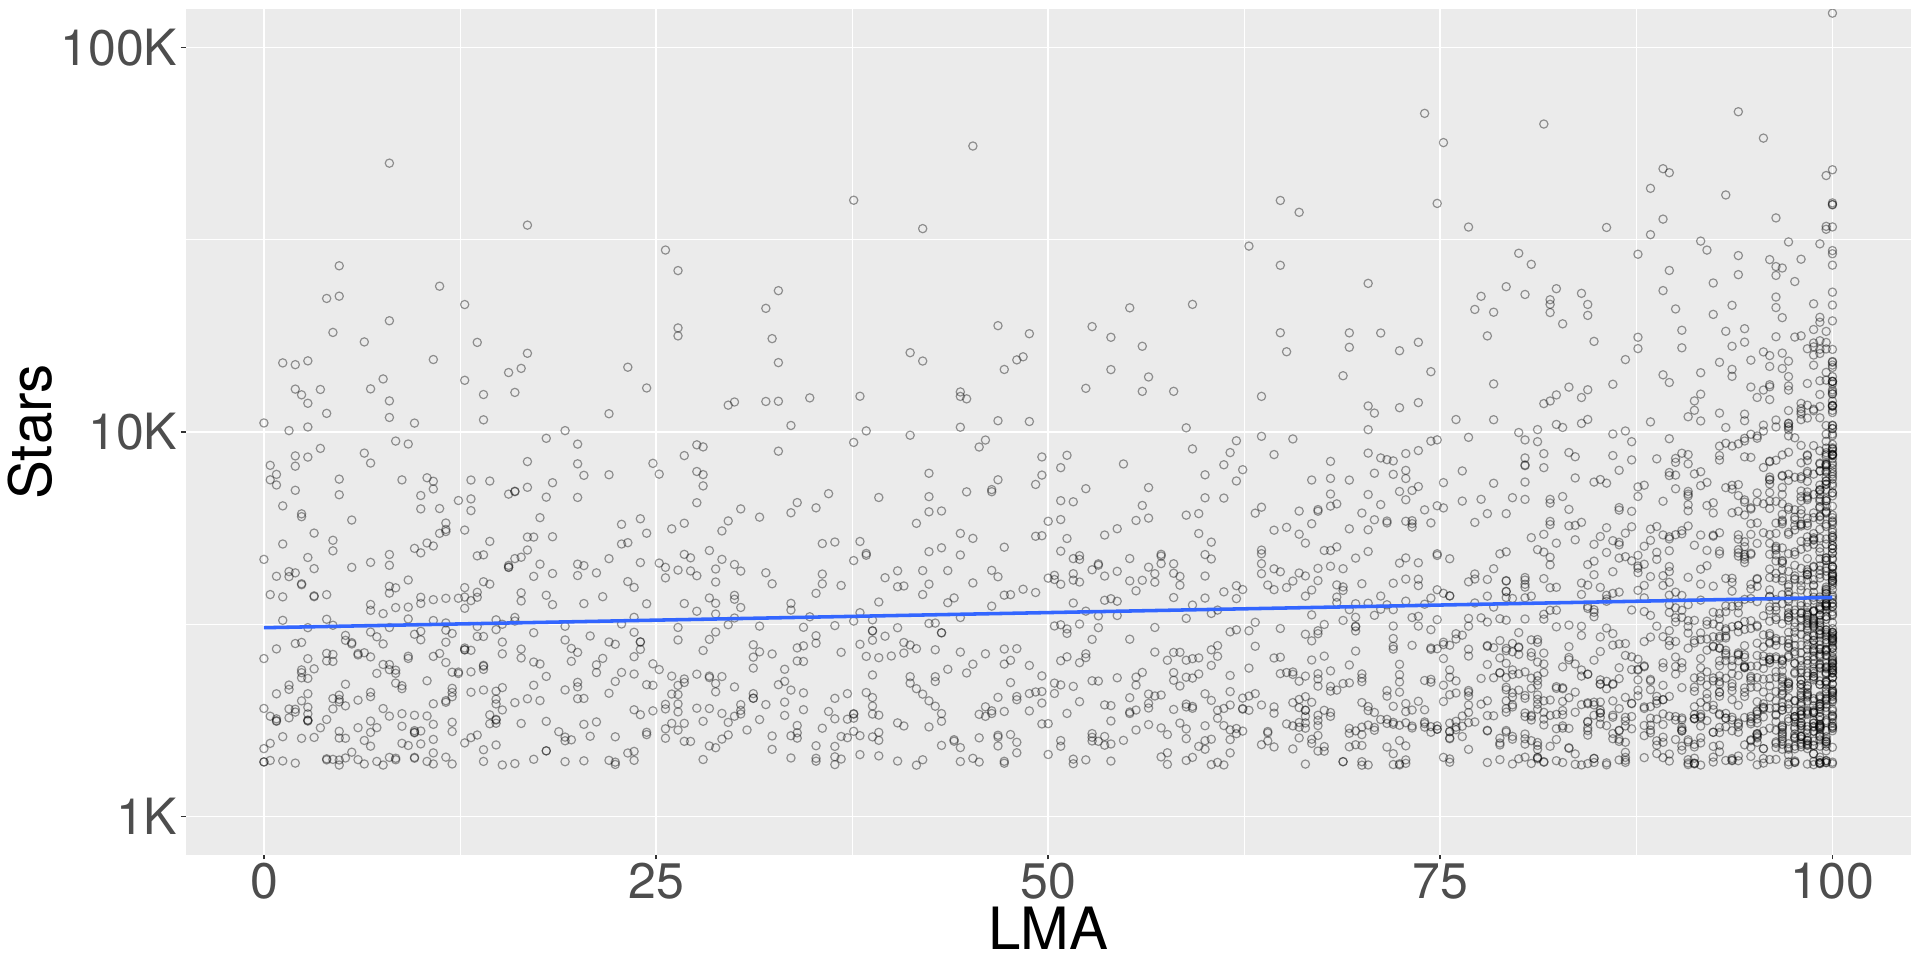
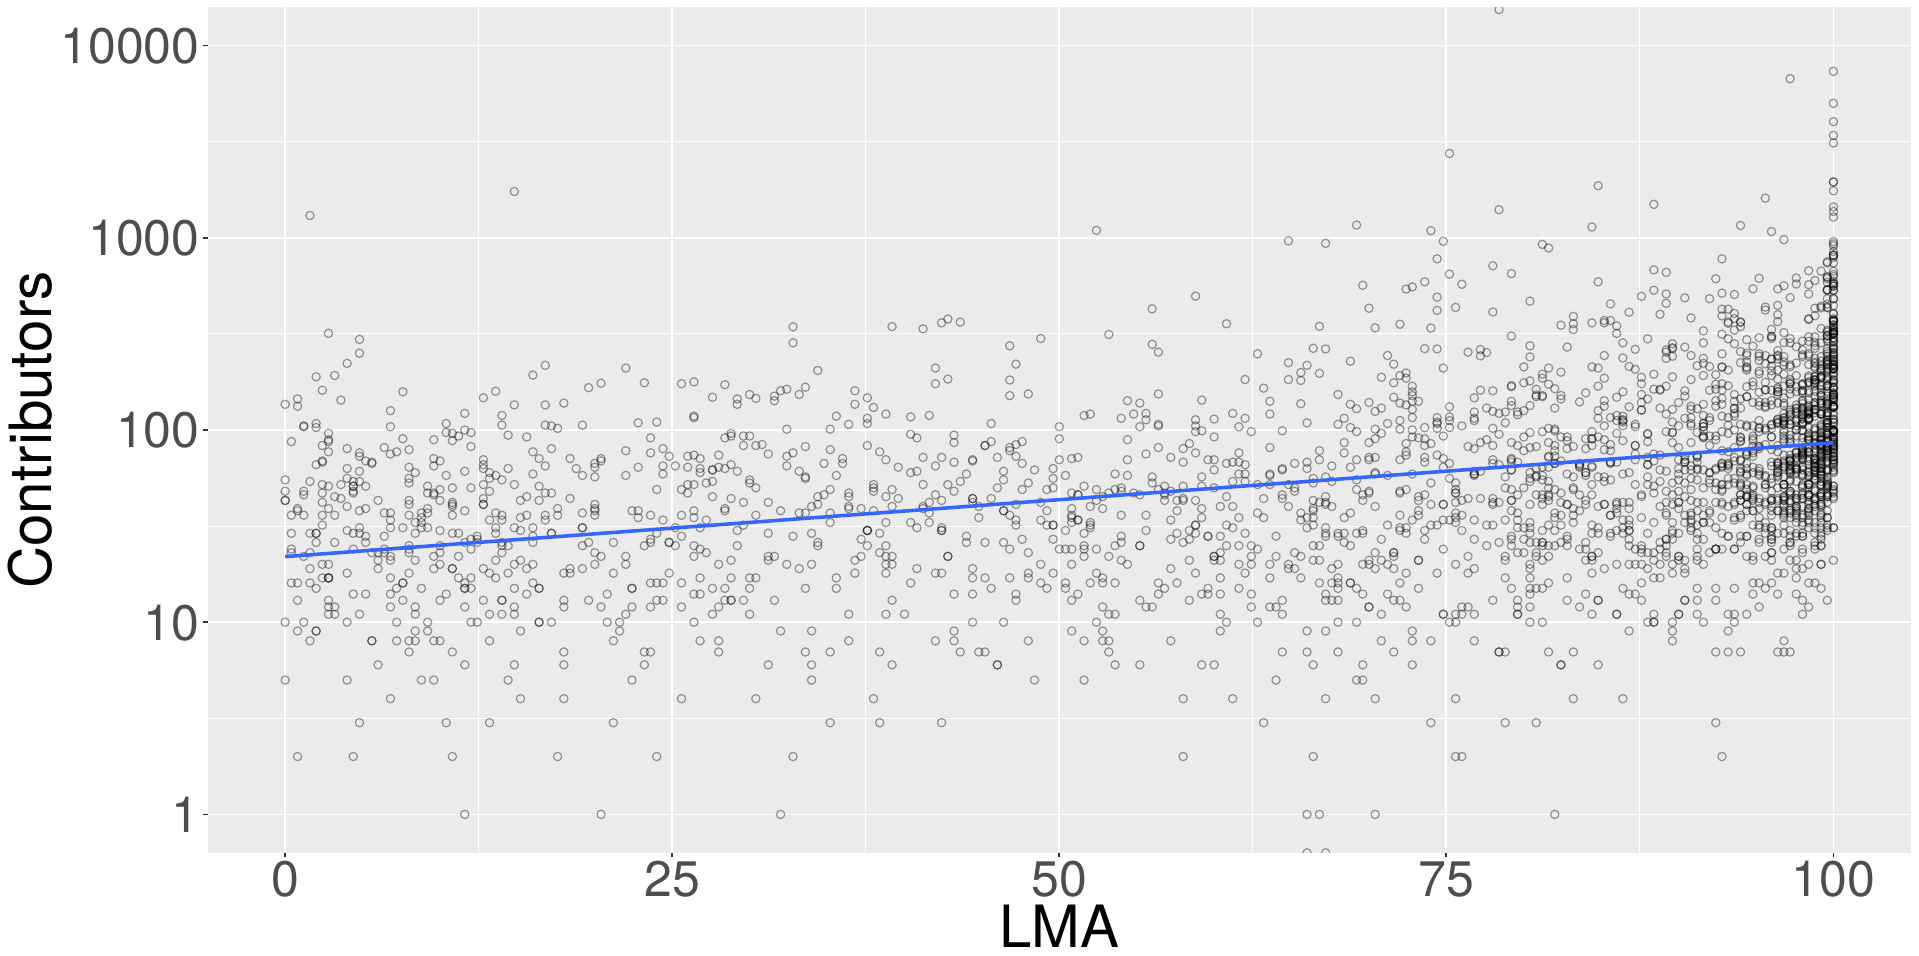
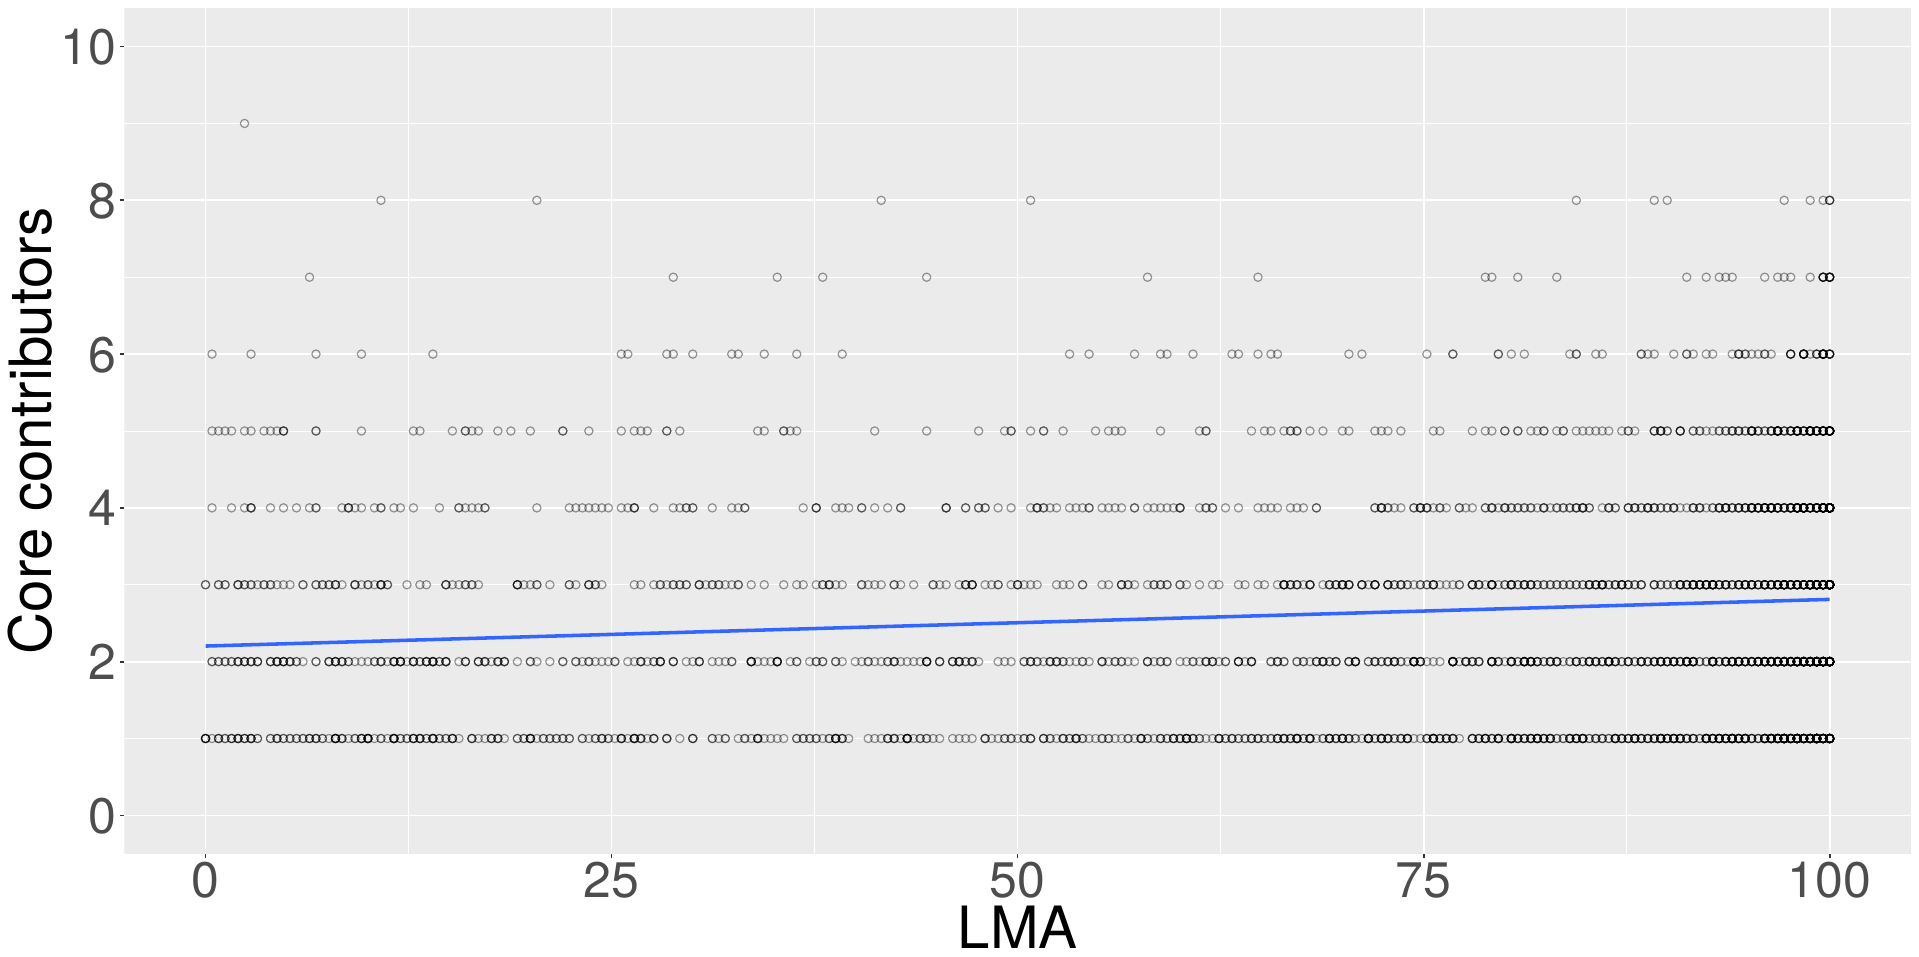
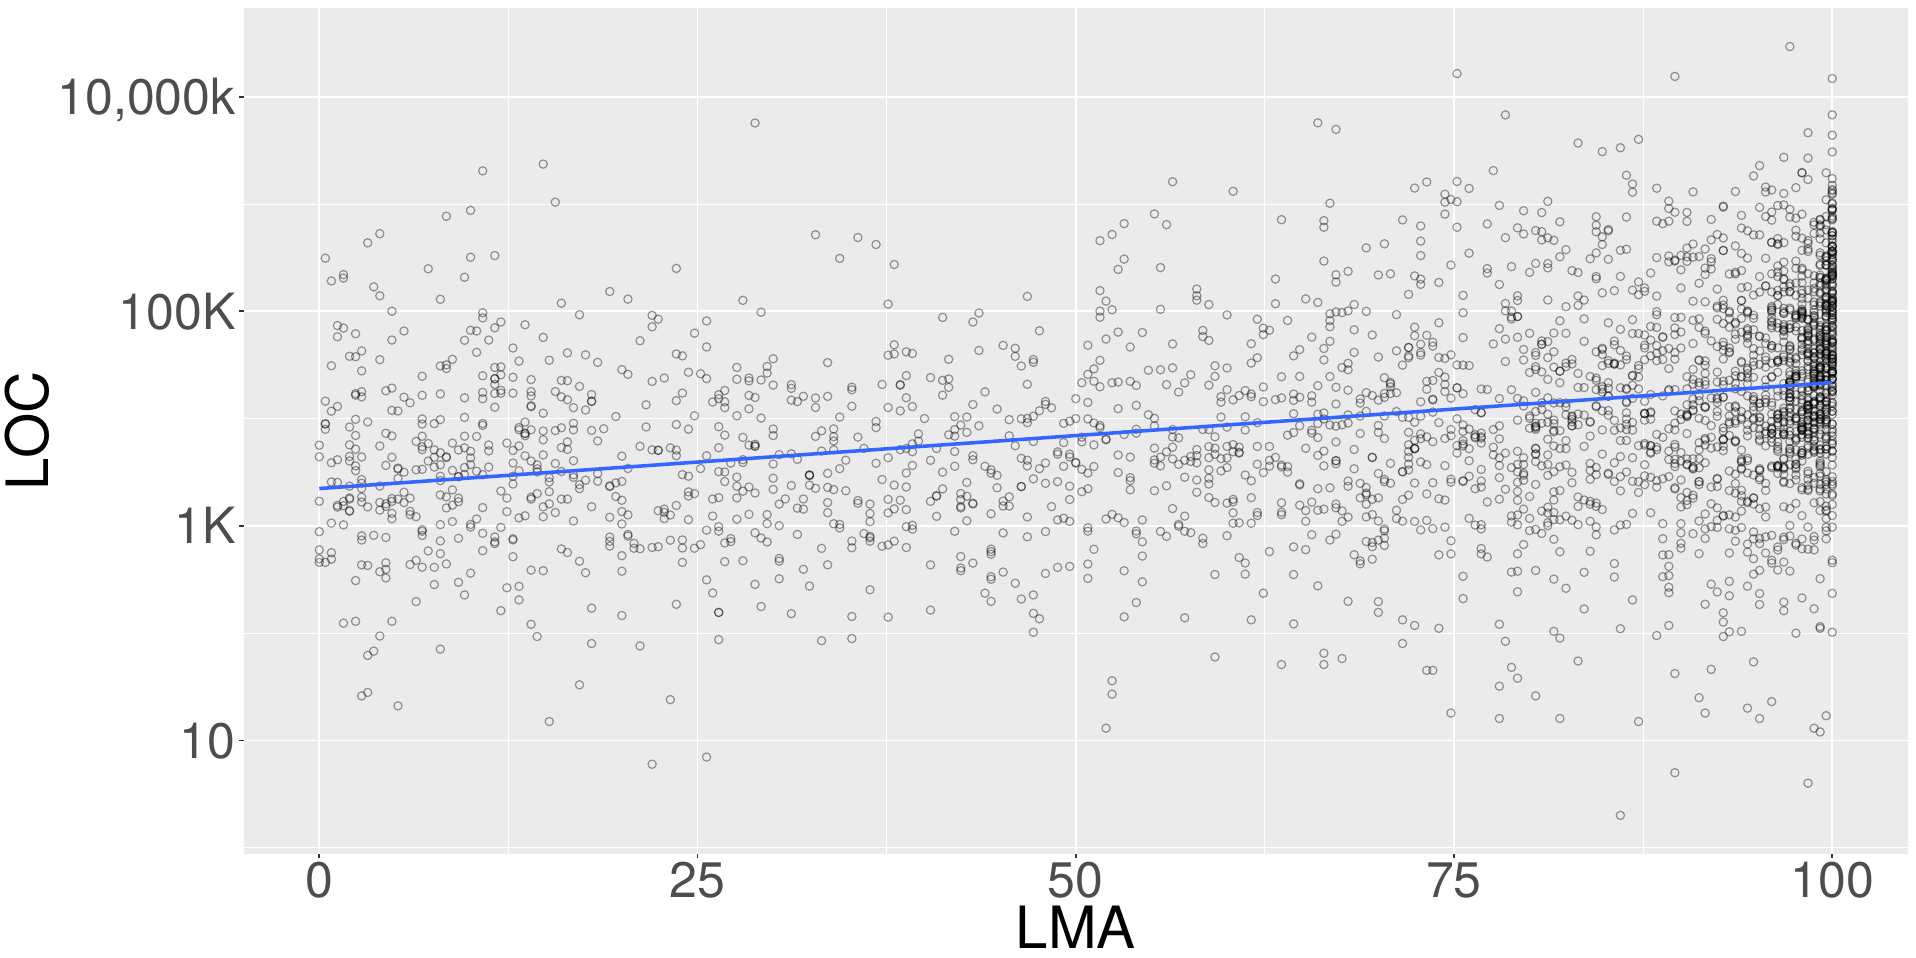
Figure 12 shows scatter plots correlating LMA and number of stars, contributors, core contributors, and size (in LOC) of projects classified as active. To identify core contributors, we use a common heuristic described in the literature: core contributors are the ones responsible together for at least 80% of the commits in a project [25, 39, 46]. To measure the size of the projects, in lines of code, we used the tool AlDanial/cloc101010https://github.com/AlDanial/cloc, considering only the programming languages in the TIOBE list.111111https://www.tiobe.com/tiobe-index We also compute Spearman’s rank correlation test for each figure. The correlation of stars and core contributors is very weak ( = 0.10 and = 0.15, respectively); with size, the correlation is weak ( = 0.38); and with contributors, it is moderate ( = 0.44); all p-values are less than 0.01. Therefore, it is common to have highly popular projects, by number of stars, presenting both low and high LMA values. For example, one project has 50,034 stars, but LMA = 8. A similar effect happens with size. For example, one project has 2 MLOC, but LMA = 10.8. The highest correlation is observed with contributors, i.e., projects with more contributors tend to have higher levels of maintenance activity.
Validation with False Negative Projects
In Section 3, we found four projects that although declared by their developers as unmaintained are predicted by the proposed machine learning model as active. Therefore, these projects are considered false negatives, when computing recall. Two of such projects have a very low LMA: nicklockwood/iRate (LMA = 2) and gorangajic/react-icons (LMA = 12). Therefore, although predicted as active, these projects are similar to projects classified as unmaintained, as suggested by their low LMA. A second project has an intermediate LMA value: spotify/HubFramework (LMA = 39.2). Finally, one project Homebrew/homebrew-php has a high LMA value (LMA = 99.2). However, this project was migrated to another repository, when facing continuous maintenance. In other words, in this case, the GitHub repository was deprecated, but not the project; therefore, Homebrew/homebrew-php is a false, false negative (or a true negative).
Historical Analysis
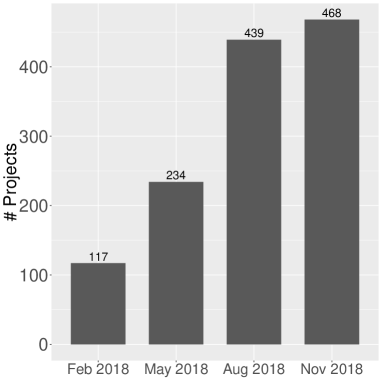
In this section, we analyze the historical evolution of 2,927 active projects, as classified by our model in November, 2017. To build a trend line, we compute new LMA values for these projects in November, 2018, i.e., after one year. Our goal is to study how often projects become unmaintained and whether the LMA values change significantly over time. Particularly, we compute LMA values in intervals of 3 months during the period of analysis, i.e., February 2018, May 2018, August 2018, and November 2018. We also evaluate LMA values under two perspectives: programming language and application domain. Figure 13 shows the total number of projects classified as unmaintained in each time interval. As we can see, the number of unmaintained projects is increasing over time, moving from 117 projects (4%) in February 2018 to 468 projects (16%) in November 2018.
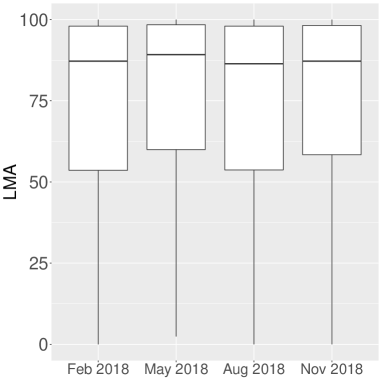
Figure 14 shows the distribution of the LMA values on each period. The median values are 87.2, 89.2, 86.4, and 87.2, respectively. By applying Kruskal-Wallis to compare multiple samples, we found that these distributions are statistically different, but the difference is negligible by Cliff’s delta. Although there is an increasing number of unmaintained projects, there is also a significant number of projects with maximal LMA values. In each interval, we found 215, 230, 208, and 197 projects with maximal LMA values, respectively. Some popular projects—such as rails/rails, matplotlib/matplotlib, and numpy/numpy—have maximal LMA in all considered time frames.
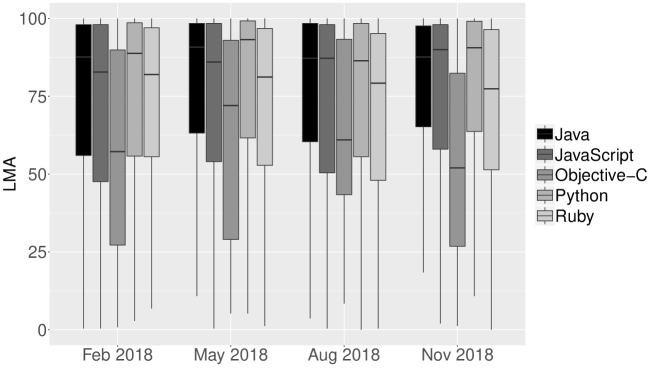
Figure 15 shows the LMA values by programming language over the studied 3-month time intervals. We consider only the top-5 languages by number of projects, which are JavaScript (700), Python (360), Java (259), Ruby (216), and Objective-C (179). For all languages, the LMA values remain stable throughout the studied intervals, with the exception of Objective-C. These projects increased their LMA values from 57.2 in February 2018 to 72.0 in May 2018, but then decreased to 61.0 in August 2018 and 52.0 in November 2018.
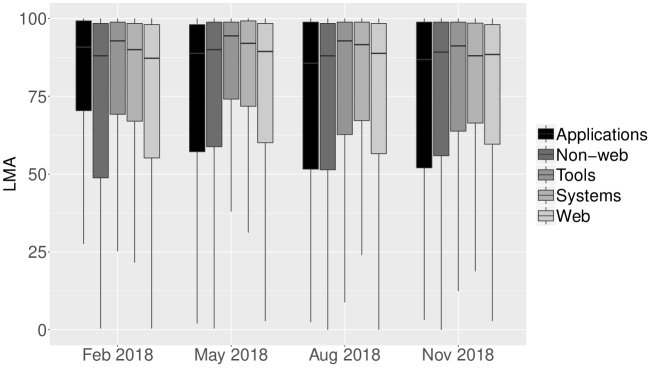
Finally, Figure 16 shows the historical LMA values by application domain. We use the same domains from the survival analysis (Section 4). We found no significant differences between the distributions in the analyzed time frames. However, Software Tools have higher LMA values in all considered time intervals, which median measures 92.8, 94.4, 92.8, and 91.2, respectively.
From 2,927 active projects in November 2017, 468 projects (16%) moved to an unmaintained state in the time interval of one year. We also found that Objective-C projects have lower LMA values than projects implemented in other programming languages. Finally, Software Tools have the highest LMA values over time. \endMakeFramed
Chrome Extension
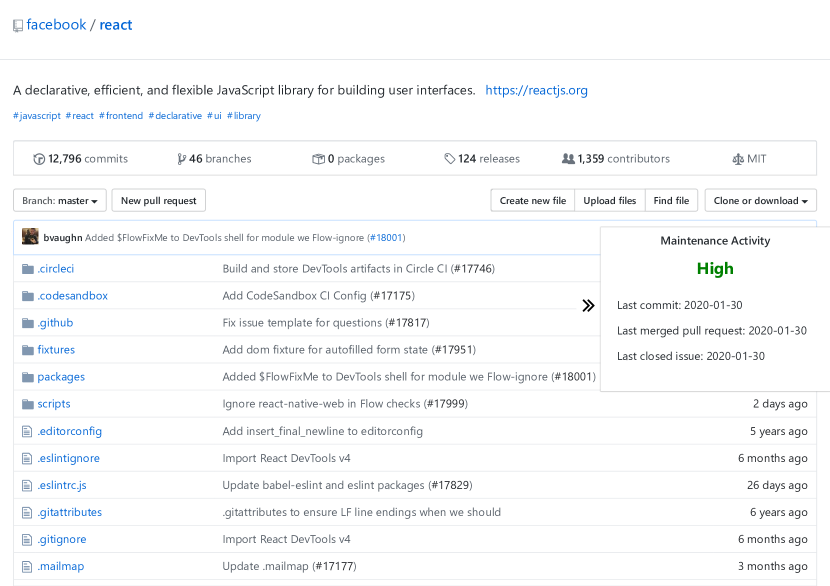
We implemented a Chrome extension called isMaintained to indicate whether a GitHub project is actively maintained or not. This extension is publicly available at the Chrome Store.121212https://chrome.google.com/webstore/search/ismaintained It only installs a small icon on the right side of a repository’s page. This icon’s color is used to inform the maintenance level of a project. The projects classified as unmaintained have a red icon. On the other hand, the level of maintenance activity for active projects can be high, fair, or borderline. The projects with LMA values in the fourth quartile of LMA values are labeled as high (green icon); projects in the second and third quartiles are labeled as fair (yellow icon); and projects in the first quartile are labeled as borderline (orange icon). Finally, the remaining repositories in our dataset (e.g., books, tutorials, awesome-lists, etc) receive a grey icon. Table 10 shows the levels of maintenance activity and their respectively color used to classify the projects.
Figure 17 shows an example of a GitHub page with the proposed Chrome extension enable. In this example, we show the level of activity for facebook/react with a green icon (high maintenance activity).
| Level of activity | Color | LMA Quartile |
|---|---|---|
| High | green | 4th |
| Fair | yellow | 2nd and 3rd |
| Borderline | orange | 1st |
| Unmaintained | red | - |
| Not analysed | grey | - |
Examples of reuse scenarios
In this section, we show two examples on how the proposed model can help developers to make the decision of selecting a library on GitHub. We described the two scenarios as follows:
First scenario: Suppose that a developer is searching for a communication library to implement a client/server application. In the end of his/her searching, the developer ends up with a list of the following libraries: zaphoyd/websocketpp, chriskohlhoff/asio, grpc/grpc, and scylladb/seastar. The level of maintenance activity (LMA) of these libraries are Fair, Fair, High, and High, respectively. All these projects are popular on GitHub, since they have more than 2K stars. Their main programming language is C++. Based on the results of our survival analysis, only 30% of the projects implemented in C++ survive more than 7 years. The age of these libraries are 8, 8, 5, and 6 years, respectively. By combining this information, we eliminate the projects zaphoyd/websocketpp and chriskohlhoff/asio due to their LMA values. Next, we realize that the survival probability of grpc/grpc is higher than the one of scylladb/seastar. Therefore, we consider that grpc/grpc might the better choice. However, we clarify this is solely a quantitative and data-driven analysis. Other factors—such as the features provided by each library—should be considered as well.
Second scenario: Suppose that a developer is looking for a JavaScript testing framework. He/she ends up with a list of the following frameworks: cypress-io/cypress, mochajs/mocha, jasmine/jasmine, and facebook/jest. All these projects are very popular on GitHub with at least 5K stars. Following our model results, we found that the level of maintenance activity (LMA) of these projects are Fair, Fair, High, and High, respectively. Based on the survival analysis results, we found that only 10% of the projects implemented in JavaScript survive more than 7 years. The age of these libraries are 5, 8, 11, and 5 years, respectively. By combining the two approaches, we remove the projects cypress-io/cypress and mochajs/mocha due to their lower LMA values. Therefore, we consider that facebook/jest might be an interesting choice, since it is a younger framework.
Threats to Validity
The threats to validity of this work are described as follows:
External Validity: Our work examines open source projects on GitHub. We recognize that there are popular projects in other platforms (e.g., Bitbucket, SourceForge, and GitLab) or projects that have their own version control installations. Thus, our findings may not generalize to other open source or commercial systems. A second threat relates to the features we have considered. By adding other features, we may improve the prediction of unmaintained projects; however, given our high prediction performance, we feel confident that our features are effective. Also, some of the features we use may not be available in other projects, however, most of our features are available in most code control repositories/ecosystems. In the future, we intend to investigate additional projects and consider more features.
Internal Validity: The first threat relates to the selection of the survey participants. We surveyed the project owner, in the case of repositories owned by individuals, or the developer with the highest number of commits, in the case of repositories owned by organizations. We believe the developers who replied to our survey are the most relevant given their level of activity in the project. It is also possible that most missing answers are from developers of unmaintained projects. As a second threat, the themes of the survey were defined and organized by the authors of the paper. As with any human activity, the derived themes may be subject to bias and different researchers might reach different observations. However, to mitigate this threat, a first choice of themes was conducted in parallel by the first two authors of this paper. Also, they attended several meetings during a whole week to improve the initial selected themes. A third threat relates to the parameters used to perform our experiment. We set the number of trees to 100 to train our classifier. To attenuate the bias of our results, we run 5-fold cross-validation and use the average performance for 100 rounds. A forth threat is related to how the accuracy of our machine learning approach was evaluated. We relied on developer replies about their projects to evaluate the performance of our machine learning classifier. In some cases, the developer replies (or developers who did not reply) may impact our results. That said, our survey had a response rate of 37.1%, which is very high for a software engineering study, giving us confidence in the reported performance results.
Construct Validity: A first threat relates to the definition of active projects. We consider as active projects those with at least one release in the last month (Section 2). We acknowledge a threat in the definition of the time frame. To mitigate this threat, the first paper’s author inspected each selected project to look for deprecated projects (21 projects declare they are no longer being maintained) and we conduct a survey with 112 developers to confirm our findings. A second threat is related to the projects we studied. Our dataset is composed of the most starred projects (and additional filtering). Although the starred projects may not be representative of all open source projects, we did carefully select such projects to ensure that our study is conducted on real (and not toy) projects.
Related Work
Machine Learning.
Recently, the application of machine learning in software engineering contexts has gained much attention. Several researchers have used machine learning to accurately predict defects (e.g. [41]), improve issue integration (e.g., [2]), enhance software maintenance (e.g., [18]), and examine developer turnover (e.g., [3]). For example, Gousios
et al. [18] investigate the use of machine learning to predict whether a pull request will be merged. They extract 12 features organized into three dimensions: pull request, project, and developer. They conduct their study using six algorithms (Logistic Regression, Naive Bayes, Decision Trees, AdaBoost with Decision Trees, and Random Forest). Bao
et al. [3] build a model to predict developer turnover, i.e., whether a developer will leave the company after a period of time. They collect several features based on developers monthly report from two companies. The authors evaluate the performance of five classifiers (KNN, Naive Bayes, SVM, Decision Trees, and Random Forest). In both studies, Random Forest outperforms the results of other algorithms. In another study, Martin
et al. [36] train a Bayesian model to support app developers on causal impact analysis of releases. They mine time-series data about Google Play app over a period of 12 months and survey developers of significant releases to check their results.
Tian
et al. [53] use Random Forest to predict whether an app will be high-rated. They extract 28 factors from eight dimensions, such as app size and library quality. Their findings show that external factors (e.g., number of promotional images) are the most influential factors. Our study also uses machine learning techniques, however, our main goal is to detect projects that are not going to be actively maintained. Moreover, our study extracts project, contributor and owner features that we input to the machine learning models.
Open source projects maintainability. In previous work [12], we survey maintainers of 104 failed open source projects to understand the rationale for such failures. Their findings revealed that projects fail due to reasons associated with project properties (e.g., low maintainability), project team (e.g., lack of time of the main contributor), and to environment reasons (e.g., project was usurped by a competitor). Later, we report results of a survey with 52 developers who recently became core contributors on popular GitHub projects [13]. Our results show the developer’s motivations to assume an important role in FLOSS projects (e.g., to improve the projects because they use them), the project characteristics (e.g., a friendly community), and the obstacles they faced (e.g., lack of time of the project leaders).
Also related is the work by Yamashita et al. [57], which adapts two population migration metrics in the context of open source projects. Their analysis enables the detection of projects that may become obsolete. Khondhu et al. [24] report that more than 10,000 projects are inactive on SourceForge. They use the maintainability index (MI) [40] to compare the maintainability between inactive projects and projects with different statuses (active and dormant). Their results reveal that the majority of inactive systems are abandoned with a similar or increased maintainability, when compared to their initial status. Nonetheless, there are critical concerns on using MI as a predictor of maintainability [5]. Eghbal [17] reports risks and challenges to maintain modern open source projects. She argues that open source plays a key role in the digital infrastructure of our society today. Opposed to physical infrastructure (e.g., bridges and roads), open source projects still lack a reliable and sustainable source of funding.
Liu
et al. [33] present a learning-to-rank model to recommend open source projects for developers. Rastogi et al. [45] investigate 70,000+ pull requests from 17 countries to model the relationship between the geographical location of developers and pull request acceptance decision. Steinmacher et al. [50] conducted surveys with quasi-contributors to understand their perceptions for pull-request non-acceptance. Their results show that non-acceptance discourage developers to submit new pull-requests. Barcomb
et al. [4] show five factors that affect retention of episodic volunteers in FLOSS communities. Other recent research on open source has focused on the organization of successful open source projects [39] and on how to attract and retain contributors [58, 49, 28, 42, 11].
Survival analysis. Survival analysis was first used in the medical domain and then applied to other domains including software engineering. For example, Maldonado et al. [35] use survival analysis to determine how long self-admitted technical debt lives in a project before it is actually removed. Lin et al. [31] applied survival analysis on five open source projects to understand the impact of several factors on developers leaving a project. Valiev et al. [56] use survival analysis on a large set of PyPI projects hosted on GitHub. Samoladas et al. [47] proposed a framework for assessing the survival probability of a FLOSS project and evaluate the benefits of adding more committers in a project. Businge et al. [9] investigate the survival of 467 third-party Eclipse plug-ins. Different from this works, we use survival analysis to reveal the survivability probability of a large scale of open source projects under different perspectives (e.g., organizational or individual account, programming language, and application domain).
Conclusion
In this paper, we proposed a machine learning model to identify unmaintained GitHub projects and to measure the level of maintenance activity (LMA) of active GitHub projects. By our definition, the unmaintained status includes three types of projects: finished projects, deprecated projects, and stalled projects. We validated the proposed model with the principal developers of 129 projects, achieving a precision of 80% (RQ1). Then, we used the model with 112 deprecated projects—as explicitly mentioned in their GitHub page. In this case, we achieved a recall of 96% (RQ2). We also showed that the proposed model can identify unmaintained projects early, without having to wait for one year of inactivity, as commonly proposed in the literature (RQ3). We assessed the survival probability of unmaintained projects under three perspectives: organizational or individual account, programming language, and application domain (RQ4). We found a negligible difference on the survival probabilities of projects owned by individual and organizational accounts. Moreover, Ruby projects have higher probabilities of survival. Regarding the analysis by application domain, we found that System Software is the domain with the highest survival probability. Finally, we investigate whether unmaintained projects follow (or not) a set of best open source contribution practices (RQ5). Our results show that the practices with the highest effect are continuous integration, followed by the adoption of contributing guidelines, and the presence of labels to recommend issues to newcomers.
Finally, we defined a metric, called Level of Maintenance Activity (LMA), to assess the risks of projects become unmaintained. We provided evidence on the applicability of this metric by investigating its usage in 2,927 projects classified as active in our dataset. We evaluate the LMA of these projects in the time frame of one year under two different perspectives: programming language and application domain. We found that 16% become unmaintained over this time. We also reported that Objective-C projects have lower LMA values than projects implemented in other languages. Software Tools have the highest LMA values over time. Finally, we implemented a public Chrome extension called isMaintained to show the level of maintenance activity of a GitHub project. This extension is publicly available at: https://chrome.google.com/webstore/search/ismaintained.
As future work, we intend to improve our Chrome extension to automatically mine and evaluate new GitHub projects and calculate their LMA every three months.
The dataset used in this paper is available at: https://zenodo.org/record/1313637.
Acknowledgments
Our research is supported by CAPES, FAPEMIG, and CNPq. We would also like to thank the 112 GitHub developers who kindly answered our survey.
References
- [1]
- Alencar da Costa et al. [2014] Daniel Alencar da Costa, Surafel Lemma Abebe, Shane McIntosh, Uirá Kulesza, and Ahmed E Hassan. 2014. An Empirical Study of Delays in the Integration of Addressed Issues. In International Conference on Software Maintenance and Evolution (ICSME). 281–290.
- Bao et al. [2017] Lingfeng Bao, Zhenchang Xing, Xin Xia, David Lo, and Shanping Li. 2017. Who will leave the company?: a large-scale industry study of developer turnover by mining monthly work report. In 14th International Conference on Mining Software Repositories (MSR). 170–181.
- Barcomb et al. [2019] Ann Barcomb, Klaas-Jan Stol, Dirk Riehle, and Brian Fitzgerald. 2019. Why do episodic volunteers stay in FLOSS communities?. In 41st International Conference on Software Engineering (ICSE). 1–12.
- Bijlsma et al. [2012] Dennis Bijlsma, Miguel Alexandre Ferreira, Bart Luijten, and Joost Visser. 2012. Faster issue resolution with higher technical quality of software. Software Quality Journal 20, 2 (2012), 265–285.
- Borges et al. [2016a] Hudson Borges, Andre Hora, and Marco Tulio Valente. 2016a. Predicting the Popularity of GitHub Repositories. In 12th International Conference on Predictive Models and Data Analytics in Software Engineering (PROMISE). 1–10.
- Borges et al. [2016b] Hudson Borges, Andre Hora, and Marco Tulio Valente. 2016b. Understanding the Factors that Impact the Popularity of GitHub Repositories. In 32nd IEEE International Conference on Software Maintenance and Evolution (ICSME). 334–344.
- Breiman [2001] Leo Breiman. 2001. Random forests. Machine learning 45, 1 (2001), 5–32.
- Businge et al. [2012] John Businge, Alexander Serebrenik, and Mark van den Brand. 2012. Survival of Eclipse third-party plug-ins. In 28th International Conference on Software Maintenance (ICSM). 368–377.
- Calle and Urrea [2010] Malu Luz Calle and Víctor Urrea. 2010. Letter to the editor: stability of random forest importance measures. Briefings in bioinformatics 12, 1 (2010), 86–89.
- Canfora et al. [2012] Gerardo Canfora, Massimiliano Di Penta, Rocco Oliveto, and Sebastiano Panichella. 2012. Who is going to mentor newcomers in open source projects?. In 20th International Symposium on the Foundations of Software Engineering (FSE). 44–54.
- Coelho and Valente [2017] Jailton Coelho and Marco Tulio Valente. 2017. Why Modern Open Source Projects Fail. In 11th Symposium on The Foundations of Software Engineering (FSE). 186–196.
- Coelho et al. [2018a] Jailton Coelho, Marco Tulio Valente, Luciana L. Silva, and Andre Hora. 2018a. Why We Engage in FLOSS: Answers from Core Developers. In 11th International Workshop on Cooperative and Human Aspects of Software Engineering (CHASE). 114–121.
- Coelho et al. [2018b] Jailton Coelho, Marco Tulio Valente, Luciana L. Silva, and Emad Shihab. 2018b. Identifying Unmaintained Projects in GitHub. In 12th International Symposium on Empirical Software Engineering and Measurement (ESEM). 1–10.
- Cox [2018] David Roxbee Cox. 2018. Analysis of survival data. Routledge.
- da Costa et al. [2014] Daniel Alencar da Costa, Surafel Lemma Abebe, Shane McIntosh, Uirá Kulesza, and Ahmed E. Hassan. 2014. An empirical study of delays in the integration of addressed issues. In 30th International Conference on Software Maintenance and Evolution (ICSME). 281–290.
- Eghbal [2016] Nadia Eghbal. 2016. Roads and Bridges: The Unseen Labor Behind Our Digital Infrastructure. Technical Report. Ford Foundation.
- Gousios et al. [2014] Georgios Gousios, Martin Pinzger, and Arie van Deursen. 2014. An exploratory study of the pull-based software development model. In 36th International Conference on Software Engineering (ICSE). 345–355.
- Grissom and Kim [2005] Robert J. Grissom and John J. Kim. 2005. Effect sizes for research: A broad practical approach. Lawrence Erlbaum.
- Hilton et al. [2016] Michael Hilton, Timothy Tunnell, Kai Huang, Darko Marinov, and Danny Dig. 2016. Usage, costs, and benefits of continuous integration in open-source projects. In 31st International Conference on Automated Software Engineering (ASE). 426–437.
- Hora et al. [2016] Andre Hora, Marco Tulio Valente, Romain Robbes, and Nicolas Anquetil. 2016. When Should Internal Interfaces be Promoted to Public?. In 24th International Symposium on the Foundations of Software Engineering (FSE). 280–291.
- Izquierdo et al. [2017] Javier Luis Cánovas Izquierdo, Valerio Cosentino, and Jordi Cabot. 2017. An Empirical Study on the Maturity of the Eclipse Modeling Ecosystem. In 20th International Conference on Model Driven Engineering Languages and Systems (MODELS). 292–302.
- Kaplan and Meier [1958] Edward L. Kaplan and Paul Meier. 1958. Nonparametric estimation from incomplete observations. Journal of the American statistical association 53, 282 (1958), 457–481.
- Khondhu et al. [2013] Jymit Khondhu, Andrea Capiluppi, and Klaas-Jan Stol. 2013. Is it all lost? A study of inactive open source projects. In 9th International Conference on Open Source Systems (OSS). 61–79.
- Koch and Schneider [2002] Stefan Koch and Georg Schneider. 2002. Effort, co-operation and co-ordination in an open source software project: GNOME. Information Systems Journal 12, 1 (2002), 27–42.
- Lamkanfi et al. [2010] Ahmed Lamkanfi, Serge Demeyer, Emanuel Giger, and Bart Goethals. 2010. Predicting the severity of a reported bug. In 7th IEEE Working Conference on Mining Software Repositories (MSR). 1–10.
- Landis and Koch [1977] J. Richard Landis and Gary G. Koch. 1977. The Measurement of Observer Agreement for Categorical Data. Biometrics 33, 1 (1977), 159–174.
- Lee et al. [2017] Amanda Lee, Jeffrey C. Carver, and Amiangshu Bosu. 2017. Understanding the Impressions, Motivations, and Barriers of One Time Code Contributors to FLOSS Projects: A Survey. In 39th International Conference on Software Engineering (ICSE). 1–11.
- Lehman [1980] Meir M. Lehman. 1980. Programs, life cycles, and laws of software evolution. IEEE 68, 9 (1980), 1060–1076.
- Lessmann et al. [2008] Stefan Lessmann, Bart Baesens, Christophe Mues, and Swantje Pietsch. 2008. Benchmarking classification models for software defect prediction: A proposed framework and novel findings. IEEE Transactions on Software Engineering 34, 4 (2008), 485–496.
- Lin et al. [2017] Bin Lin, Gregorio Robles, and Alexander Serebrenik. 2017. Developer turnover in global, industrial open source projects: Insights from applying survival analysis. In 12th International Conference on Global Software Engineering (ICGSE). 66–75.
- Linares-Vásquez et al. [2013] Mario Linares-Vásquez, Gabriele Bavota, Carlos Bernal-Cárdenas, Massimiliano Di Penta, Rocco Oliveto, and Denys Poshyvanyk. 2013. API change and fault proneness: a threat to the success of Android apps. In 9th International Symposium on the Foundations of Software Engineering (FSE). 477–487.
- Liu et al. [2018] Chao Liu, Dan Yang, Xiaohong Zhang, Baishakhi Ray, and Md Masudur Rahman. 2018. Recommending GitHub Projects for Developer Onboarding. IEEE Access 6, 1 (2018), 52082–52094.
- Louppe et al. [2013] Gilles Louppe, Louis Wehenkel, Antonio Sutera, and Pierre Geurts. 2013. Understanding variable importances in forests of randomized trees. In 26th Advances in Neural Information Processing Systems (NIPS). 431–439.
- Maldonado et al. [2017] Everton Maldonado, Rabe Abdalkareem, Emad Shihab, and Alexander Serebrenik. 2017. An empirical study on the removal of self-admitted technical debt. In 33rd International Conference on Software Maintenance and Evolution (ICSME). 238–248.
- Martin et al. [2016] William Martin, Federica Sarro, and Mark Harman. 2016. Causal impact analysis for app releases in google play. In 24th International Symposium on Foundations of Software Engineering (FSE). 435–446.
- Mens et al. [2014] Tom Mens, Mathieu Goeminne, Uzma Raja, and Alexander Serebrenik. 2014. Survivability of Software Projects in Gnome–A Replication Study. In 7th International Seminar Series on Advanced Techniques & Tools for Software Evolution (SATToSE). 79 – 82.
- Menzies et al. [2013] Tim Menzies, Andrew Butcher, David Cok, Andrian Marcus, Lucas Layman, Forrest Shull, Burak Turhan, and Thomas Zimmermann. 2013. Local versus global lessons for defect prediction and effort estimation. IEEE Transactions on software engineering 39, 6 (2013), 822–834.
- Mockus et al. [2002] Audris Mockus, Roy T. Fielding, and James D. Herbsleb. 2002. Two case studies of open source software development: Apache and Mozilla. ACM Transactions on Software Engineering and Methodology (TOSEM) 11, 3 (2002), 309–346.
- Oman and Hagemeister [1992] Paul Oman and Jack Hagemeister. 1992. Metrics for assessing a software system’s maintainability. In 8th International Conference on Software Maintenance (ICSM). 337–344.
- Peters et al. [2013] Fayola Peters, Tim Menzies, and Andrian Marcus. 2013. Better cross company defect prediction. In 10th Working Conference on Mining Software Repositories (MSR). 409–418.
- Pinto et al. [2016] Gustavo Pinto, Igor Steinmacher, and Marco A. Gerosa. 2016. More common than you think: An in-depth study of casual contributors. In 23th International Conference on Software Analysis, Evolution, and Reengineering (SANER). 112–123.
- Provost and Fawcett [2001] Foster Provost and Tom Fawcett. 2001. Robust classification for imprecise environments. Machine learning 42, 3 (2001), 203–231.
- Ramasubramanian and Singh [2017] Karthik Ramasubramanian and Abhishek Singh. 2017. Machine Learning Model Evaluation. Apress.
- Rastogi et al. [2018] Ayushi Rastogi, Nachiappan Nagappan, Georgios Gousios, and André van der Hoek. 2018. Relationship between geographical location and evaluation of developer contributions in GitHub. In 12th ACM/IEEE International Symposium on Empirical Software Engineering and Measurement (ESEM). 22.
- Robles et al. [2009] Gregorio Robles, Jesus M. Gonzalez-Barahona, and Israel Herraiz. 2009. Evolution of the core team of developers in libre software projects. In 6th International Working Conference on Mining Software Repositories (MSR). 167–170.
- Samoladas et al. [2010] Ioannis Samoladas, Lefteris Angelis, and Ioannis Stamelos. 2010. Survival analysis on the duration of open source projects. Information and Software Technology 52, 9 (2010), 902–922.
- Silva and Valente [2018] Hudson Silva and Marco Tulio Valente. 2018. What’s in a GitHub Star? Understanding Repository Starring Practices in a Social Coding Platform. Journal of Systems and Software 146 (2018), 112–129.
- Steinmacher et al. [2016] Igor Steinmacher, Tayana U. Conte, Christoph Treude, and Marco A. Gerosa. 2016. Overcoming open source project entry barriers with a portal for newcomers. In 38th International Conference on Software Engineering (ICSE). 273–284.
- Steinmacher et al. [2018] Igor Steinmacher, Gustavo Pinto, Igor Scaliante Wiese, and Marco Aurélio Gerosa. 2018. Almost there: A study on quasi-contributors in open-source software projects. In 40th International Conference on Software Engineering (ICSE). 256–266.
- Thung et al. [2012] Ferdian Thung, David Lo, and Lingxiao Jiang. 2012. Automatic defect categorization. In 19th Working Conference on Reverse Engineering (WCRE). 205–214.
- Tian et al. [2015a] Yuan Tian, David Lo, Xin Xia, and Chengnian Sun. 2015a. Automated prediction of bug report priority using multi-factor analysis. Empirical Software Engineering 20, 5 (2015), 1354–1383.
- Tian et al. [2015b] Yuan Tian, Meiyappan Nagappan, David Lo, and Ahmed E. Hassan. 2015b. What are the characteristics of high-rated apps? a case study on free Android applications. In 30th International Conference on Software Maintenance and Evolution (ICSME). 301–310.
- Tian et al. [2015c] Yuan Tian, Meiyappan Nagappan, David Lo, and Ahmed E. Hassan. 2015c. What are the characteristics of high-rated apps? a case study on free Android applications. In 31st International Conference on Software Maintenance and Evolution (ICSME). 301–310.
- Tourani et al. [2017] Parastou Tourani, Bram Adams, and Alexander Serebrenik. 2017. Code of Conduct in Open Source Projects. In 24th International Conference on Software Analysis, Evolution, and Reengineering (SANER). 24–33.
- Valiev et al. [2018] Marat Valiev, Bogdan Vasilescu, and James Herbsleb. 2018. Ecosystem-level determinants of sustained activity in open-source projects: a case study of the PyPI ecosystem. In 26th Symposium on the Foundations of Software Engineering (FSE). 644–655.
- Yamashita et al. [2014] Kazuhiro Yamashita, Shane McIntosh, Yasutaka Kamei, and Naoyasu Ubayashi. 2014. Magnet or sticky? an oss project-by-project typology. In 11th working conference on mining software repositories (MSR). 344–347.
- Zhou and Mockus [2015] Minghui Zhou and Audris Mockus. 2015. Who will stay in the floss community? modeling participant’s initial behavior. Transactions on Software Engineering 41, 1 (2015), 82–99.