On the origins of up-bending breaks in galaxy disks
Abstract
Using SPITZER 3.6m imaging, we investigate the physical and data-driven origins of up-bending (Type III) disk breaks. We apply a robust new break-finding algorithm to 175 low-inclination disk galaxies previously identified as containing Type III breaks, classify each galaxy by its outermost re-classified (via our new algorithm) break type, and compare the local environments of each resulting subgroup. Using three different measures of the local density of galaxies, we find that galaxies with extended outer spheroids (Type IIIs) occupy the highest density environments in our sample, while those with extended down-bending (Type II) disks and symmetric outskirts occupy the lowest density environments. Among outermost breaks, the most common origin of Type III breaks in our sample is methodological; the use of elliptical apertures to measure the radial profiles of asymmetric galaxies usually results in features akin to Type III breaks.
keywords:
galaxies: evolution, galaxies: photometry, galaxies: spiral, galaxies: structure1 Context
It has been known for some time that the surface brightness profiles of disk galaxies are only approximately exponential, insofar as most show at least one prominent and lasting change in slope at some radius (e.g., Freeman, 1970; Pohlen & Trujillo, 2006). As surface brightness profiles trace the radial distribution of stellar mass (modulo the mass-to-light ratio), these changes—or breaks—in slope seem closely tied to the evolution of their hosts. Precisely what aspects of disk galaxy evolution they illustrate, however, remains somewhat ambiguous.
Up-bending (or Type III; Pohlen & Trujillo, 2006) breaks specifically may have numerous origins, from accretion of dwarf companions (e.g., Younger et al., 2007) to star formation (e.g., Laine et al., 2016) to scattering by bars (e.g., Herpich et al., 2017). If so, simply identifying whether or not a galaxy hosts a Type III break, without additional distinctions, may not be physically illuminating. While past studies have identified several sub-classifications for Type III breaks (e.g., Pohlen & Trujillo, 2006; Erwin et al., 2008), which might be useful in making such distinctions, most avoid considering these sub-classifications as separate populations. On top of this, disk break studies suffer from a repeatability problem; only of galaxies show matching classifications across studies (Laine et al., 2016), leading to further ambiguity.
We have therefore devised a robust and nearly hands-off break-finding algorithm, which we applied to a sample of Type III break-host galaxies (as previously identified by Laine et al., 2014, 2016). We find that meaningful physical trends can be uncovered through careful classification of Type III breaks even with a small sample of galaxies.
2 Method
We designed our break-finding algorithm to minimize the need for decision making. One potential source of confusion in past studies is the need to differentiate between breaks, being lasting changes in slope, and smaller scale bumps or wiggles in the profile (see, e.g., the Appendix of Pohlen & Trujillo, 2006); therefore, we chose to make no such distinction. Instead, we measured the slope of the surface brightness profile as a function of radius in the manner detailed by Pohlen & Trujillo (2006), and applied a method called change-point analysis (Taylor, 2000) to determine each point where the slope changes.
We then classified each break in detail. We found that Type III breaks arise in three circumstances: where the isophotes become consecutively rounder with increasing radius (Type IIIs, denoted Type III-h by Pohlen & Trujillo, 2006); where the photometric apertures measuring the profile first encounter a ring, set of spiral arms, or other local light enhancement (Type IIId, denoted Type III-d by Pohlen & Trujillo, 2006); or where these photometric apertures encounter a region in which the disk is asymmetric, whether through a global asymmetry, tidal debris, or otherwise (Type IIIa). The latter should likely not be considered breaks, as the shape of the radial profile of an asymmetric galaxy is simply not reliable, yet aside from Type IIId these are the most numerous break type in our sample. Many galaxies in our sample also contained Type II (down-bending) breaks, hence depending on their origins we classified them as either Type IId (arising due to association with disklike features such as spiral arms) or IIa (arising due to asymmetry, akin to Type II-AB from Pohlen & Trujillo, 2006). Finally, in some cases we found no significant change points across the disk (Type I), and in a handful of cases we found that the disk profiles were better described using a higher Sérsic index model (Type 0).
To investigate the impact of environment on the formation of these various break types, we classified our sample galaxies by their outermost breaks, these being the most sensitive to environmental influences. We then compared populations of galaxies using three different environmental parameters: , the Dahari tidal parameter (Dahari, 1984); , the projected surface density of galaxies within the third-nearest neighbor distance (e.g., Cappellari et al., 2011); and , defined as but using the group radii given by Kourkchi & Tully (2017) in lieu of the third-nearest neighbor distance. We did these comparisons pair-wise, using the BEST method (Bayesian estimation supersedes the t test; Kruschke, 2013) to compare the mean values of each environmental parameter for each group of galaxies. For a full description of our methodology, see Watkins et al. (2019).
3 Results
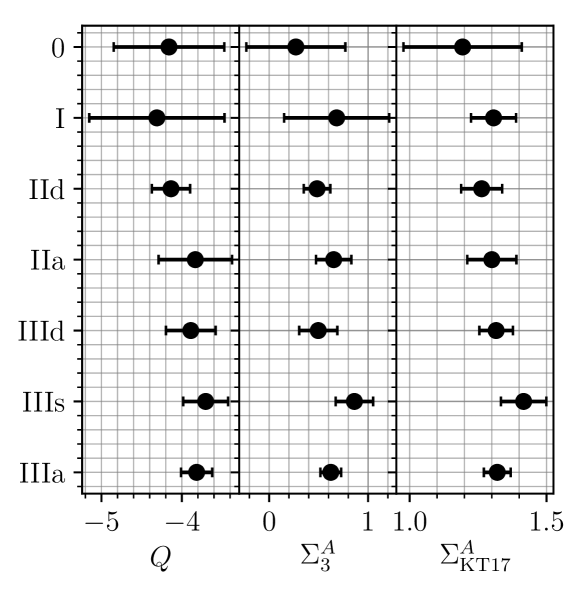
Our results are summarized in Fig. 1. Despite the fairly small number of galaxies in our sample, made even smaller through separation into seven sub-categories, we found robust trends between outermost break type and local environmental density. Specifically, galaxies with outer spheroids (Type IIIs) occupy the highest density environments, while those host to Type II breaks aligned with symmetric disk features (Type IId) occupy the lowest density environments, despite most such galaxies hosting Type III breaks at smaller radii. Also, asymmetric galaxies, regardless of break direction (those ending with Type IIa and IIIa breaks) occupy similarly dense environments, slightly lower in density than those of Type IIIs.
These trends paint a consistent physical portrait. Galaxies in high-density environments (e.g., compact groups or clusters) may more frequently suffer harrassment (Moore et al., 1996), leading to thermal excitation of their stellar populations, visible as an outer spheroid component. Galaxies in slightly lower density environments (e.g., loose groups) will be tidally disturbed, but less frequently and by more prolonged tidal interactions, leading to more prominent tidal tails and other signs of asymmetry (e.g., Barnes & Hernquist, 92). Finally, galaxies in the least dense environments will suffer little tidal interaction, leaving their structure to be dominated by secular processes such as the formation of symmetric spiral arms.
In total, then, our method is able to tease out intriguing physical trends from disk breaks for even a small population of galaxies. It will be of interest to apply such a method to a much larger sample, both to verify these trends and to possibly uncover subtler physical processes over a wider variety of environments. Because the break-finding routine requires so few assumptions, it can be easily automated, making it adaptable to large-scale surveys. Detailed classifications, while currently done by-eye, can also be automated to some extent given that properties such as asymmetry are quantifiable. This method therefore is quite promising for future studies of the radial mass distribution of disk galaxies.
References
- Barnes & Hernquist (92) Barnes, J.E., & Hernquist, L. 1992, ARA&A, 30, 705
- Cappellari et al. (2011) Cappellari, M., Emsellem, E., Krajnović,D. et al. 2011, MNRAS, 416, 1680
- Dahari (1984) Dahari, O. 1984, AJ, 89, 966
- Erwin et al. (2008) Erwin, P., Pohlen, M., & Beckman, J.E. 2012, AJ, 135, 20
- Freeman (1970) Freeman, K.C. 1970, ApJ, 160, 811
- Herpich et al. (2017) Herpich, J., Stinson, G.S., Rix, H.W., Martig, M., & Dutton, A.A. 2017, MNRAS, 470, 4941
- Kourkchi & Tully (2017) Kourkchi, E., & Tully, R.B. 2017, ApJ, 843, 16
- Kruschke (2013) Kruschke, J.K. 2013, J. Exp. Psychol., 142, 573
- Laine et al. (2014) Laine, J., Laurikainen, E., Salo, H., et al. 2014, MNRAS, 441, 1992
- Laine et al. (2016) Laine, J., Laurikainen, E., Salo, H. 2016, A&A, 596, 25
- Moore et al. (1996) Moore, B., Katz, N., Lake, G., Dressler, A., & Oemler, A. 1996, Nature, 379, 613
- Pohlen & Trujillo (2006) Pohlen, M., & Trujillo, I. 2006, A&A, 454, 759
- Taylor (2000) Taylor, W.A. 2000, https://variation.com/change-point-analysis-a-powerful-new-tool-for-detecting-changes/, Accessed 11 Mar 2019
- Watkins et al. (2019) Watkins, A.E., Laine, J., Comerón, S., Janz, J., & Salo, H. 2019, A&A, 625, 36
- Younger et al. (2007) Younger, J.D., Cox, T.J., Seth, A.C., & Hernquist, L. 2007, ApJ, 670, 269