Discovering Strategic Behaviors for Collaborative Content-Production in Social Networks
Abstract.
Some social networks provide explicit mechanisms to allocate social rewards such as reputation based on users’ actions, while the mechanism is more opaque in other networks. Nonetheless, there are always individuals who obtain greater rewards and reputation than their peers. An intuitive yet important question to ask is whether these successful users employ strategic behaviors to become influential. It might appear that the influencers ”have gamed the system.” However, it remains difficult to conclude the rationality of their actions due to factors like the combinatorial strategy space, inability to determine payoffs, and resource limitations faced by individuals. The challenging nature of this question has drawn attention from both the theory and data mining communities. Therefore, in this paper, we are motivated to investigate if resource-limited individuals discover strategic behaviors associated with high payoffs when producing collaborative/interactive content in social networks. We propose a novel framework of Dynamic Dual Attention Networks (DDAN) which models individuals’ content production strategies through a generative process, under the influence of social interactions involved in the process. Extensive experimental results illustrate the model’s effectiveness in user behavior modeling. We make three strong empirical findings: (1) Different strategies give rise to different social payoffs; (2) The best performing individuals exhibit stability in their preference over the discovered strategies, which indicates the emergence of strategic behavior; and (3) The stability of a user’s preference is correlated with high payoffs.
1. Introduction
This paper examines if individuals can successfully discover strategies with high payoffs in social networks. In seminal work, Simon (1972) introduced the idea of bounded rationality—that human beings use limited resources to make decisions. In more recent work, Gigerenzer et al. (Gigerenzer and Goldstein, 1996; Gigerenzer and Gaissmaier, 2011) argued that human beings used heuristics to make decisions whose quality matched that of rational agents. Online social networks typically have an explicit mechanism that allocates rewards (usually points) that vary with users’ behaviors; for example, the right answer on a community question-answer website like StackOverflow (https://www.stackoverflow.com) may earn the individual who posted the answer reputation points.
In some other networks, the mechanism is more opaque. For example, on Twitter, the inclusion of a celebrity’s twitter handle on your tweet causes your tweet to appear on their timeline, increasing your visibility. Perhaps over time, this improved visibility results in one having more followers, and that increased visibility may cause one to become an influencer—advertisers may reach out to market their products. In a different example, an assistant professor needs to decide where she should publish her current work. Should she submit the paper to a high prestige conference with a lower probability of acceptance or a lower-tier conference with a higher probability? The former strategy yields greater visibility, but with a lower acceptance rate. If the conference rejects her paper, she may need to wait out a year. Some individuals on websites with explicit mechanisms have many reputation points; others in networks such as Twitter, are influencers—did these individuals employ strategic behaviors to gain points or to become influential?
At first glance, it might appear that individuals who do well, “have gamed the system” as it were, and the rest have not figured out the mechanism. However, for games with opaque mechanisms, the strategy space is unclear; and for games with explicit mechanisms (e.g., StackOverflow), the payoffs for a particular action are still unknown. It is not straightforward to conclude that the winners of these social networks (e.g., influencers on Twitter) are rational in the classic sense (i.e., maximize expected utility) due to several reasons. The combinatorial strategy space (e.g., on StackOverflow, which question to answer, when, answer length, readability, etc.); the inability to determine the payoffs (e.g., reputation points) for any given strategy; and the fact that individuals do not have unlimited resources to determine their best response. Instead, the best we can conclude is that the best players are differentially rational—that is, when compared to their peers, they have a better understanding of the correlation between a strategy and its payoff.
The theoretical Computer Science community has paid attention to games of incomplete information (Hartline et al., 2015; Lykouris et al., 2016; Feng et al., 2018) with dynamic populations (as in behavior in online auctions). For example, a key result from Lykouris et al. (2016) is that when agents play repeated games with strategies that guarantee low-adaptive regret, high social welfare is ensured. One of the challenges with theoretical work is that it is unclear if, in practice, individuals can find successful strategies. Most existing social modeling tasks target on discovering people’s interests from textual contents on social media (Zhu et al., 2017; Bhattacharya et al., 2014; Li et al., 2008; Qiu et al., 2013) or tracing the propagation of social influence along social networks (Papagelis et al., 2011; Barbieri et al., 2013; Tang et al., 2009). A few do consider the latent strategies adopted by people in social networks; however, they either ignore contextual information (Dong et al., 2014), or do not further examine the impact of those strategies (Xu et al., 2012). Thus we are motivated to ask a simple question:
Can individuals with limited resources discover content production strategies with high payoffs in social networks?
To operationalize our question, we analyze the preference order over strategies. In particular, we ask two questions: first, does the preference order among strategies for authors stabilize over time, indicating the emergence of strategic behavior? Second, if the preference order is stable, does the preference order maximize utility? Notice that preference order stability does not imply high payoffs; the stability may arise due to other factors such as social norms.
We wish to answer this question through an analysis of empirical data from a social network. An empirical analysis is non-trivial: while we may observe a particular outcome (e.g., which paper to cite; which celebrity’s handle to mention; the topic of the message that we post on social media), as well as be able to compute the reward, we do not observe the strategic considerations underlying the action.
Our technical insight: to model the observed behavior as a generative process. That is, a strategic decision changes the posterior distribution over the action space. We assume that while the set of strategies is common to all, each individual adopts a mixed-strategy over the set of different strategies. In other words, the distribution over the set of strategies is private to each individual. To model individual behavior, we propose conceptualizing content production as a bipartite graph where the nodes include individuals and contents, and where content may have multiple authors. Thus, the strategy to produce a piece of content (e.g., author a paper in an academic social network, post blogs online) depends on the strategy distributions of its authors; and the co-authors may influence the strategy distribution of an author. We identify an elegant dual attention neural architecture motivated by Veličković et al. (2017) to model individual behavior. Then, we compare our results with a counterfactual condition: the inferred strategic behavior of an idealized expected-utility maximizer. We summarize our contributions as follows:
- Coupling authors and content::
-
We propose a novel Dynamic Dual Attention Network (DDAN) to jointly model the role of the authors in the determination of content production strategy, and how co-authoring content influences authors’ content production strategy. The DDAN helps discover the author’s strategy. In contrast, past works either focus on theoretical concepts (e.g., (Hartline et al., 2015; Lykouris et al., 2016)) or do not attempt to identify strategic behaviors from data. In the dynamic dual attention mechanism, the content strategy depends on the strategies of all of its authors. Conversely, the strategy of an author depends on her prior production strategy as well as the strategies of all the content that she played a role in producing at the current moment. Extensive experiments show that our framework models user behaviors well.
- Strong experimental findings::
-
We have strong qualitative findings. First, we show that different strategies result in different payoffs. Second, we show through rank correlation, that the authors with the top normalized utility exhibit stability in their preference orders. Furthermore, a majority of authors do not discover the correlation between strategies and payoffs. Third, we show that the stability of preference is correlated with high payoffs.
The significance of this work: to the best of our knowledge, this is the first attempt to identify strategic behaviors from empirical data formally. We organize the rest of the paper as follows. In the next section, we introduce the problem. In Section 3, we show how to model strategic behavior, including identifying our assumptions, and introducing our Dynamic Dual Attention Network formalism. In Section 4, we propose a model for rational behavior, to serve as an idealized baseline. Then, in Section 5, we present experiments on an academic dataset, including specification of the strategic space. Section 6 highlights the qualitative findings. Then, we discuss challenges and limitations in Section 7 followed by a discussion of related work in Section 8. We conclude in Section 9.
2. Problem Formulation
We first present an informal description before presenting the problem in detail.
2.1. Informal Problem Description
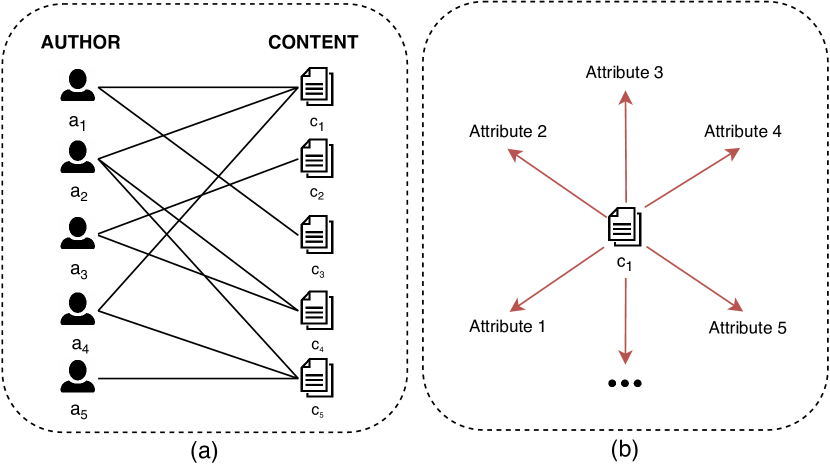
Consider a general scenario, where a set of individuals work together to author a piece of content . This content could be a blog post, an academic paper, or when a group attempts to answer a question on a community question-answer forum such as StackExchange. We can associate attributes with the created content , including venue of publication; time of publication; content topic; links to other entities including contents (e.g., citations to other academic papers, links to other blog posts) and authors (e.g., tweets can include mentions of other individuals on Twitter).
We can associate a time-varying utility to each content published at time , where we evaluate the utility after time units (i.e., at time ): academic papers receive citations; blog posts receive in-links; answers on a community question answer forum receive up or down votes (the forum will transform the votes to reputation points). In general, the relationship between a particular choice of attributes for the content (e.g., topic) and its utility is non-trivial to assess. Not only is the relationship non-deterministic, but also, the payoffs are distant.
Authors have to make decisions about content attributes, including, for example, the topic, the publication venue, links to other entities. We identify four challenges. First, the attribute cardinality is large. For example, for an author to identify a paper to cite, she needs to consider the entire set of past published papers. Instead, she may have private strategies, including picking papers that are highly cited, to bias her attribute selection. Second, the mapping between attribute choice and utility is non-deterministic, with a distant payoff. Third, while she can observe the choice of attributes (e.g., content topic), made by her peers, and their payoffs (e.g., citations), she cannot observe the strategic consideration behind that choice. Finally, authors are resource-limited (e.g., limited time, attention), limiting their ability to determine co-variation between their choices and payoffs. Thus, we can ask:
Are resource-limited individuals in social networks able to discover content-production strategies that yield high payoffs?
2.2. Data Model
Now, we develop the data model for the problem. Let denote the set of individuals who produce content on a social network, and let denote the set of content. Authors may either collaborate or work alone to author content . Thus, we can construct an undirected bipartite graph , where , , to compactly represent content production (Figure 1 (a)). Figure 1 (b) illustrates that each content may have multiple attributes.
The author picks the attribute values strategically. Let every author use the same strategy space , where . However, each author randomizes over the strategies independently. That is, for each author , we associate a probability distribution over the strategies, private to each individual, from which she draws her strategy to determine the attributes for . For example, if an author wishes to determine which papers to cite, her strategies could include picking papers uniformly at random from past papers, as well as picking papers based on citation count. More formally, each choice of strategy affects the posterior distribution of attribute values. When a group of authors collaborate, we assume that they negotiate and develop a consensus strategy. We use to represent ’s strategy distribution at time . We assume that the author’s past strategy and her co-authors’ strategy at time influence .
Assume that a content authored by at time receives a utility after time units. In general, at time , an author creates a set of content . Some content may have co-authors. Thus the total utility for author for authoring these contents at time , time units after publication, is:
| (1) |
where, is the attribution of author ’s role in creating content . Notice for each , the co-author group may be different. Each author has a private preference between a pair of strategies . We denote (or dominates ) if the probability of picking is greater than and if is indifferent between the two. We ask two questions:
First, does the preference order among strategies for authors stabilize over time, indicating the emergence of strategic behaviors? Second, if the preference order is stable, does the preference order maximize utility?
Notice that the emergence of stable preferences by itself does not imply that the author is maximizing utility, since social norms may cause preference stability. We will compare the strategic behaviors of social network participants against myopic rational agents that maximize expected utility.
| Notation | Description |
|---|---|
| Snapshot of the author-content graph at time | |
| Set of contents created by at time | |
| Set of authors with over 5 active contents at time | |
| Embedding vector of at time | |
| Field vector of at time | |
| Strategy distribution of at time | |
| ’s contribution to ’s strategy distribution | |
| Utility received by with over time units | |
| Normalized total utility received by with | |
| The global expected normalized utility for strategy |
3. Modeling Strategic Behavior
To identify strategic behavior for content production, we need to address two questions. First, how to determine the strategy distribution for content , jointly authored by a set of authors . Notice that each author has an individual strategy distribution . Second, we need to determine how the prior strategy distribution and the strategy distributions of the co-authors of influence the strategy distribution .
Next, we introduce key modeling assumptions followed by an elegant Dynamic Dual Attention Network (DDAN) to jointly solve both questions.
3.1. Assumptions
Now we discuss assumptions useful for developing our model.
- Strategy distributions::
-
We associate a strategy distribution with content produced at time . depends on the individual strategy distributions of the set of authors who jointly produce . In other words, the set of authors draw the strategy given to determine attributes for . Assume that an author participates in the production of a set of contents . We assume that two factors influence her strategy distribution : her prior strategy distribution ; the strategy distribution of her co-authors for each .
- Utility calculation::
-
Let be the utility accumulated by content after time units. Since each author contributes to a different extent to produce , we assume that the utility that flows back to is in proportion to her contribution. That is, the utility , where is the utility that flows back to after time units in proportion to her contribution . Notice that .
- Vertex representation::
-
We associate each content with a node embedding vector and each author at time with a node embedding vector (e.g., ESim (Shang et al., 2016)). We obtain a time-dependent embedding vector for an author, by treating the same author at different times as separate nodes when embedding the network.
- Network snapshots::
-
Since the graph grows over time, we divide the graph into snapshots. Specifically, we define the vertex set and the edge set for the graph to include the authors active at time , the contents created at time , and the links from the content created at time with their attributes. If an author appears for the first time in snapshot , we draw the prior strategy distributions from a flat Dirichlet distribution and use an all zero vector as the prior embedding .
3.2. Dynamic Dual Attention Networks
We propose a novel Dynamic Dual Attention Network (DDAN), inspired by the work on Graph Attention Networks by Veličković et al. (2017), to identify the strategy distributions for content and its authors. The DDAN elegantly addresses the two central dependencies: the strategy for the production of any content depends on the strategies of its authors, and an author’s prior strategy as well as her co-authors influence her current strategic behavior. We jointly optimize two attention mechanisms.
3.2.1. Determining the strategy for the production of a single content
The strategy distribution of a content created at time is affected by the strategy distribution of all its authors . To determine the contribution of a specific author towards , we feed the embedding vector of the content (i.e., ) and of the author at time (i.e., ) into a one-layer attention mechanism as follows:
| (2) | ||||
| (3) |
where is a shared linear transformation and is the weight vector in a one-layer feedforward neural network. Note that is the concatenation operator to concatenate two vectors and we use LeakyReLU for the nonlinearity . We use softmax normalization to ensure that the contributions of all the coauthors to a particular content sum to . Finally, note that since is ’s contribution to the determination of , we set .
Then the strategy distribution of content is the sum of its authors’ strategy distributions at time , weighted by each authors ’s contribution . We use to represent nonlinear activation. We use normalization to ensure that is a valid strategy distribution:
| (4) |
3.2.2. Determining an author’s strategy
An author’s strategy depends on the strategy adopted for each content she authors at time as well as her past strategy distribution . First, we examine the effect of the strategy for the production of content where she is a co-author in .
We apply an attention mechanism to learn content ’s contribution on author ’s strategy distribution as follows:
| (5) | ||||
| (6) |
We use a different attention mechanism to determine the contribution of ’s strategy distribution at time on her current strategy distribution:
| (7) |
Thus, ’s strategy distribution at time is the weighted sum of the strategy distribution for , and :
| (8) |
We use normalization to ensure that is a valid distribution.
In this section, we discussed modeling assumptions and showed how to determine the content production strategy as a function of the author strategies as well as how past author strategy and co-author strategies influence an author’s current strategy . Next, we show how to model a rational agent that maximizes expected utility.
4. A Model for Rational Behavior
Rational behavior is a useful baseline to understand better the behaviors that we discover in this paper. An author engaged in rational behavior would be able to evaluate the utilities of all strategies and be able to identify the optimal strategy. However, determining rational behavior is hard for several reasons. First, notice that while the actions (e.g., the paper that author cites; content topic) are observable, the strategies that result in the actions (e.g., pick highly cited papers to cite) are not observable. This means that any author with access to unlimited resources, who wishes to engage in rational play, will need to develop a model of user behavior that connects strategies to outcomes, fit the model, and then connect strategy distributions to payoffs. Unsurprisingly, we could develop several plausible rational models, and below, we discuss one such model that utilizes our DDAN framework.
First, we ask: given the utility at time of content co-authored by at time , what is the utility of author using strategies distribution ? We compute a normalized utility as follows:
| (9) |
The equation says that the normalized utility due to the distribution depends on the relative utility accruing due to participation in the creation of . We normalize this sum utilities by the number of content co-authored by at time and further normalized by the time elapsed , between content production and evaluation. In our model, to simplify analysis, we allocate the utility to the maximum likelihood strategy in .
A rational author would thus learn the global (i.e., over all authors) expected utility for each strategy . Using the expected value allows us to average out over unobserved confounds that may co-vary with utility (e.g., author institution; prior author reputation). Next, we present our experimental results.
5. Experiments
In this section, we discuss our datasets in Section 5.1, strategy spaces in Section 5.2, DDAN training in Section 5.3, experiment setting in Section 5.4, competing baselines in Section 5.5 and evaluation in Section 5.6. We used XSEDE (Towns et al., 2014) resources for computation and our implementations are publicly available 111https://github.com/CrowdDynamicsLab/Discovering˙Strategic˙Behaviors.
5.1. Datasets
We use the latest version of the DBLP academic dataset (Tang et al., 2008; Sinha et al., 2015). The goal with this dataset is to discover strategic behavior associated with two paper attributes: citations and publication venue. That is, what are the strategic considerations behind whom to cite, and where to publish? We set papers created during the years 1980–1999 as the background papers. We aim to examine the strategies adopted by authors starting from the year 2000 and use for to represent the status of the network corresponding to each year between and inclusive. Not every remaining paper in the dataset contains both citation and location information. We infer an author or paper’s citation or location strategies only if we can observe the corresponding citation or location edges. This corresponds to 97% of the papers.
5.2. Strategy Spaces
Now, we discuss four strategy spaces that alter the distributions of the attributes. As we discussed in Section 2.2, a bipartite graph represents the content production, connecting authors to the content that they help co-author. One can create using the attributes of each paper, additional graphs: an author-author citation graph , a paper-paper citation graph , a paper-location graph and an author-location graph . Since our DDAN is symmetric with respect to content and authors, in this section we will discuss strategic considerations for content (i.e. focus on explaining and ); similar arguments hold for authors. Thus, consider a paper that cites and is published at location . We need to identify strategic considerations that explain the directed edges and . We identify four aspects (see Table 2) based on popularity, similarity of field, familiarity and time recency. As a reminder, each strategy alters the posterior distributions of the attribute value, and does not deterministically set the attribute value. When picking papers to cite, authors may pick highly cited papers, from similar fields. They may also pick papers by authors whom they know (e.g. papers by past co-authors), and if the paper topic is in a newly emerging area of research, more recent papers.
| Aspect | Strategy |
|---|---|
| Popularity | , preferential attachment |
| , uniform attachment | |
| Field | , preferring similar fields |
| , preferring distinct fields | |
| Familiarity | , preferring familiar nodes |
| , preferring unfamiliar nodes | |
| Time | , preferring small time gaps |
| , choosing random time gaps |
5.2.1. Popularity
We use two strategies to explain the directed edge (and ) based on popularity. The first, is preferential attachment (i.e., strategy ), documented by Barabási and Albert (1999), where the probability of citing a past paper is proportional to its citations, as the strategy to pick highly cited papers (or publication venues; for example, authors may want to publish in journals with high impact factor). The second is to pick papers (or locations to publish at) uniformly at random (i.e., strategy ).
5.2.2. Field
We use LSA (Deerwester et al., 1990) to assign each content a 100-dimension field vector . Then an author’s field vector at time is the average of the field vectors of contents that he has created by time . A publication venue’s field vector at time is the average of the field vectors of contents published there by time . We perform normalization on all the field vectors. To support their arguments, authors are likely to cite thematically similar papers (i.e. topic homophily (McPherson et al., 2001; Kossinets and Watts, 2009)), or publish in venues with fields similar to the field of the paper. High-impact papers, on the other hand, often cite papers outside of their field (Uzzi et al., 2013). Thus, we may explain edge either with homophily (i.e., strategy ) or with choosing from different fields (i.e., strategy ), if the central theme of spans multiple fields. Thus, we can set the likelihood of edge based on strategy to be . The likelihood of choosing a paper from a field distinct from is just the complement of . We make similar arguments for explaining edge .
5.2.3. Familiarity
Some papers may preferentially cite other papers based on authorship; for example, self-citation is a well known strategy to boost the popular -index (Glänzel et al., 2006; Engqvist and Frommen, 2008). Thus, we can partition the set of papers published before time into two disjoint sets: one set that contains papers, each of which has one of the co-authors of as a co-author. The second set is the complementary set, containing papers whose authors do not include any of the co-authors of paper . We can make a parallel argument to partition the set of past publication venues. Thus in our first familiarity based strategy , a paper will cite another with a high probability if and with a low probability if . The converse is true for strategy .
5.2.4. Time
Paper citations also exhibit recency bias (Ghosh et al., 2011), and thus time is an important factor for explaining edge . Since content created at cannot occur at venues active prior to time , we do not include time as a strategic consideration for selecting venue, that is, to explain edge . To incorporate recency bias (i.e., strategy ), we do the following. Assume that the normalized time difference between the publications and is . Then, to model recency bias, we use a Beta distribution to alter the posterior probability of selecting papers to cite. That is, likelihood , where are parameters of the Beta distribution. To model recency, we set . In the complementary strategy (i.e., strategy ), we pick a paper uniformly at random with respect to time of publication.
5.2.5. Composite Strategies
Thus far, we discussed four different strategic considerations to explain edge : popularity, field, familiarity and time recency. We identify three strategic considerations to explain edge : popularity, field, familiarity. Thus the likelihood of the edge is a composite of each of the four strategies. Since each strategic consideration has two possibilities, we can enumerate composite strategies to explain edge . Correspondingly, we can enumerate composite strategies to explain edge . A composite citation strategy consists of a pure strategy under each of the four aspects (Popularity, Field, Familiarity, Time); a composite location strategy consists of a pure strategy under each of the first three aspects (Popularity, Field, Familiarity). For easy reference, we use a binary sequence to represent composite strategies w.r.t. pure strategies (e.g., citation strategy , location strategy ). Then the likelihood of forming an edge given a composite strategy is the product of the likelihoods of forming that edge given each of ’s constituent pure strategies. In this subsection, we explained the strategic considerations to help explain the formation of edges and . We can use the same strategies to help explain the formation of edges (i.e., author cites author ) and (i.e., author publishes in venue )
5.3. DDAN Training & Optimization
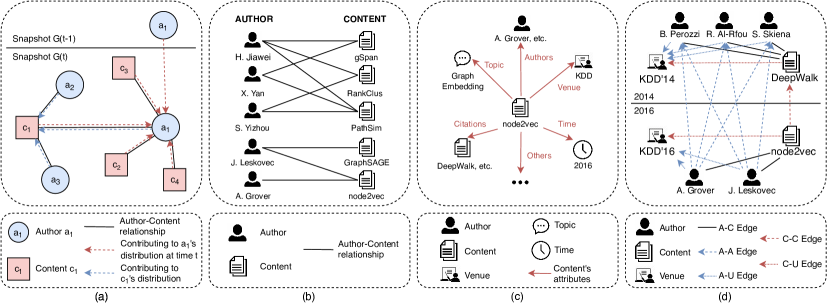
Now, we we discuss how to train and optimize the Dynamic Dual Attention Networks (DDAN). We first initialize and as generated by the flat Dirichlet distribution for content set and authors active at time . Then we train the attention networks to update and alternatively by using the current snapshot as the ground truth. The overall framework is illustrated in Figure 2. We need to explain four graphs using DDAN: an author-author citation graph , a paper-paper citation graph , a paper-location graph , and an author-location graph . As a concrete example, consider the graph . Then, at time , we need to minimize the negative log likelihood:
| (10) |
Where, is the probability of picking strategy given the distribution for content , and is the likelihood of edge given strategy . Thus Equation 10 states that we need to sum over all edges , the negative log of the likelihood of observing edge conditioned on strategy distribution . We can construct similar likelihood functions to explain graphs , and . The overall likelihood is just a sum of the constituent likelihoods. That is, . Once the DDAN converges in the current snapshot , we move on to the next snapshot until all the snapshots are covered.
5.4. Experiment Settings
To properly evaluate the strategy distributions identified by the proposed DDAN framework, we apply them to the task of link prediction. We model the link prediction problem as a recommendation problem which aims to rank node pairs in terms of the posterior probability of forming an edge between them. That is, the identified strategy distributions should best explain the observed network. We identify the set of authors with over five new contents in the current snapshot and partition each author’s contents for 5-fold cross validation. For each fold where , we hide the author-content edges between and as well as the edges between and attribute nodes and formed due to . The model is trained using the remaining network and aims to recover the hidden attribute edges. Since exhaustive computation over all node pairs is expensive, we utilize the information of ’s coauthors when creating . The authors cited by those co-authors and the venues where those coauthors have made publications by time constitute the negative testing sets and , respectively. We apply this process on the DBLP dataset with a five-year gap (i.e., we only look at snapshots corresponding to Year 2000, 2005, 2010, 2015, and 2018). We summarize these statistics in Table 3. We use Mean Average Precision (MAP) as the evaluation metric.
| Snapshot Year | |||
|---|---|---|---|
| 2000 | 3,145 | 31.48 | 1.34 |
| 2005 | 10,316 | 42.34 | 1.47 |
| 2010 | 18,062 | 57.11 | 1.50 |
| 2015 | 25,759 | 82.18 | 1.56 |
| 2018 | 9,192 | 109.64 | 1.41 |
5.5. Baselines
We want to point out that the problem of identifying authors’ strategy distributions can also be modeled by topic generative models. Therefore, we compare our DDAN framework against two different topic models (Yin and Wang, 2014; Wang and McCallum, 2006) and one traditional regression model (Hosmer Jr et al., 2013). For static models (Yin and Wang, 2014; Hosmer Jr et al., 2013), we apply the model to each testing snapshot separately. For dynamic models (Wang and McCallum, 2006) and DDAN, we first obtain the history information with the entire dataset, and then apply the model to the training sets in each testing snapshot.
-
(1)
Logistic Regression (LR) (Hosmer Jr et al., 2013): When applying the logistic regression model on each author individually, we treat the likelihood of forming an edge as the predictor and the ground truth as the response variable. The coefficients in the regression model are constrained to be non-negative and sum to 1 so that they can be interpreted as strategy distributions.
-
(2)
Dirichlet Multinomial Mixture Model (DMM) (Yin and Wang, 2014): Words become strategies and topics over words become distributions over strategies. Authors need to pick one strategy from their strategy distributions to form an edge. We set the number of topics to be the same as the number of strategies so that each topic is initialized with a maximum likelihood strategy. All the authors in each testing snapshot are trained together to detect their strategy distributions.
-
(3)
Topics Over Time (TOT) (Wang and McCallum, 2006): In comparison with DMM, TOT requires authors to first choose a topic from her distribution over topics in that snapshot and then pick a strategy from the chosen topic to form an edge. Meanwhile, each topic is also associated with a continuous distribution over time snapshots.
-
(4)
DDAN: The proposed framework which models individuals’ content production strategies under the influence of social interactions involved in the process.
| Year | Strategies | LR (Hosmer Jr et al., 2013) | DMM (Yin and Wang, 2014) | TOT (Wang and McCallum, 2006) | DDAN |
|---|---|---|---|---|---|
| 2000 | Citation | 0.72 | 0.72 | 0.73 | 0.74 |
| Publication | 0.71 | 0.70 | 0.73 | 0.75 | |
| 2005 | Citation | 0.69 | 0.69 | 0.70 | 0.71 |
| Publication | 0.69 | 0.69 | 0.72 | 0.73 | |
| 2010 | Citation | 0.67 | 0.67 | 0.68 | 0.69 |
| Publication | 0.71 | 0.71 | 0.73 | 0.74 | |
| 2015 | Citation | 0.67 | 0.67 | 0.68 | 0.69 |
| Publication | 0.72 | 0.72 | 0.74 | 0.75 | |
| 2018 | Citation | 0.67 | 0.67 | 0.68 | 0.69 |
| Publication | 0.76 | 0.75 | 0.77 | 0.78 |
5.6. Evaluation
Each model is tested using 5-fold cross-validation, and the average MAP scores are reported in Table 4. We can see that DDAN outperforms the rest for both strategies in all snapshots. LR performs slightly better than DMM since LR is trained on each author individually, while the training of DMM requires the entire set of active authors and may involve some noises. Meanwhile, dynamic models (DDAN, TOT) also give better results than static models (LR, DMM) since dynamic models consider the connection across snapshots. In general, unlike the baseline models (LR, DMM, TOT) which focus on authors’ information and ignore the social context, the proposed DDAN framework comprehensively models the interactions between authors and contents within the same snapshot, as well as the dependencies between the present and the past. Therefore, DDAN achieves the highest performance. In this section, we introduced four strategic considerations—popularity, field, familiarity, and time—to explain the existence of an edge in four different derived graphs from the DBLP dataset. We also covered DDAN training and reported experimental results comparing DDAN with state-of-the-art baselines. The goal of these baselines was to understand if DDAN modeled the observations well. Next, we present a qualitative analysis of our results.

6. Qualitative Analysis
Two questions in Section 2.2 motivated us: if the preference order amongst strategies stabilizes for individuals (thus indicating the emergence of strategic behavior) and if these stable preference orders are correlated with high utility. As a reminder, stable preference orders may not correlate to high payoffs—since individuals are resource-limited, they may lack the resources to discover the correlation between behavior and payoff. Instead, stability may arise due to other factors, including social norms. Let us examine each question in turn. In the analysis that follows, we use the same strategy spaces and payoffs introduced in the previous section: the authors in an academic social network make decisions on whom to cite, and where to publish. We used sixteen citation strategies and eight location strategies. Since we use the academic dataset, we use the number of citations as the content utility, that is, refers to the number of citations received over time units after publication. We assume for this analysis that citation strategies (i.e., which papers to cite) and location strategies (i.e., where to publish) are independent and contribute equally to the content utility .
6.1. Do strategies matter?
Let us first examine if there are any differences amongst the strategies . Consider Figure 3 (a)-(b). The two figures show the distribution of maximum likelihood utilities over the citation and location strategy space for the whole population. Observe that the utility curves in each sub-figure are distinct: each strategy distribution has a different mode, and some strategies have a higher payoff. Consider Figure 3 (b), the distribution of location strategies. It shows that location strategy 0, i.e., , has the maximum modal payoff (i.e., the distribution with the highest mode). This strategy says that the authors pick venues based on preferential attachment (that is, pick venues in proportion to their publication popularity), that are from similar fields as the author, and that are familiar (i.e., the author has published there earlier). In hindsight, this is intuitive—by publishing in popular venues, there is an increasing likelihood that their papers will be visible, with similar fields, there is an increasing chance that the paper is more likely to be accepted due to topical match, and if the author has published there previously, then the author understands the social norms in terms of how to write for that audience, again increasing the chance of acceptance. Figure 3 (a), the distribution of citation strategies offers similar insights. It shows that citation strategy 2, 4 and 15, i.e. , and , have the highest modal utilities. Let us examine strategy 4, i.e. , in detail; the insights for the other two follow a similar argument. says that authors cite papers based on preferential attachment (i.e., they cite highly cited papers), from similar fields (i.e., they cite papers similar to their own paper), pick papers that are not familiar (that is, they don’t cite their own papers), and pick most recent papers. This strategy of picking papers that are well cited in their own field makes sense—it is less likely that their paper will be rejected for inadequate references; that they don’t self-cite is also reasonable since excessive self-citation is frowned upon, and citing more recent papers implies that they have covered all the recent, relevant works in their area.
6.2. Emergence of Order
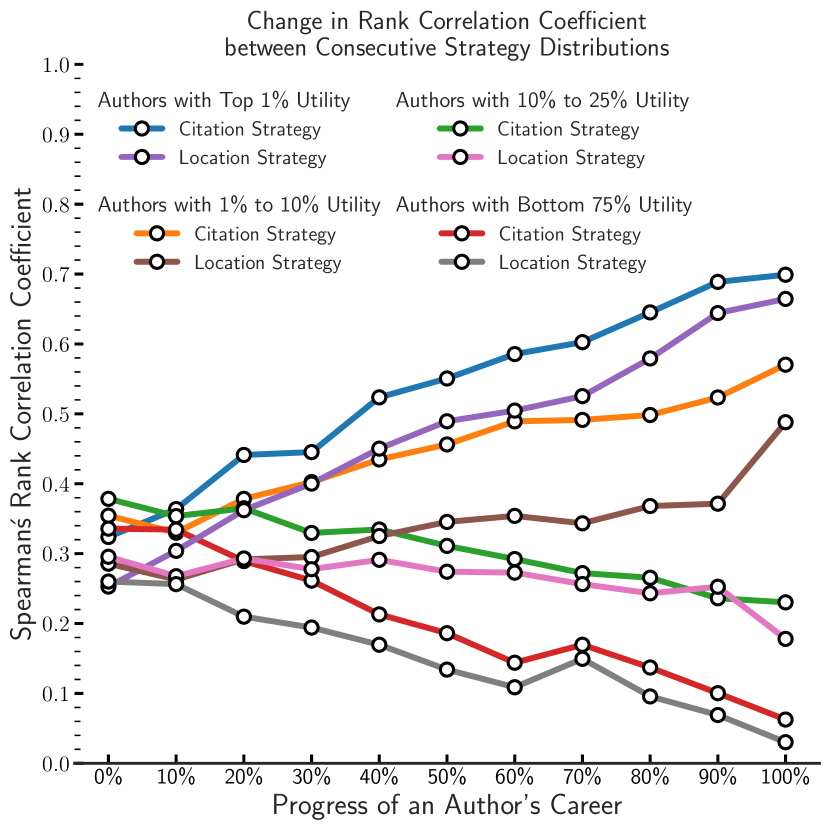
Having established that the strategies have different payoffs, let us examine if authors begin to converge on a preferential order over strategies. In our DDAN formulation, each author has a strategy distribution , for each time . We compute the preference order, by utilizing the likelihood of the strategy, for the citation and location strategies for each author. Then, we compute the Spearman rank correlation coefficient (Myers et al., 2013), to compute the correlation in preference order across consecutive publication years, for all authors with at least five publication years. Then, to aggregate across authors, we group rank correlation coefficients in relation to the author career length.
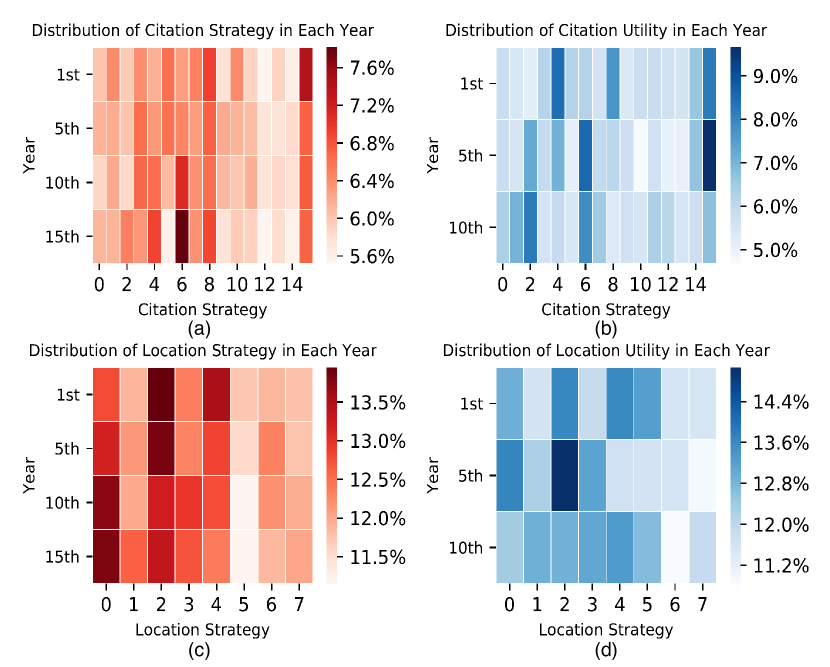
Figure 3 (c) shows the rank correlation curves. The curves show that the correlations increase for those authors with the normalized utility in the top , with the highest increases for those in the top . What the curves imply for the top is that this group quickly converge onto the citation and location strategy, while for the group in the top converge onto the citation strategy (but less quickly than do the top ), but takes a while for them to figure out where to publish. What is of note: authors in the bottom in terms of the normalized utility are less likely to be correlated in terms of their citation or location strategy. Figure 4 shows the strategy distributions for both citation and location strategy spaces, over time, for authors who have published in at least years (there are 23,238 of them). Notice that over time, for this group of authors, one can see that citation strategy 2, 4, 6 and 15, i.e., , , and , are beginning to stabilize and location strategy 0, i.e., , is stabilizing; notice that the corresponding utilities are also high; these plots indicate that for many of these authors, a preference order emerges. Notice in Figure 3 (a)-(b), we find somewhat surprisingly, that a small percentage of authors () have the normalized utility greater than the rational agent. This is reasonable because the rational agent computes the expected payoff of any strategy; there will be some authors for whom that a strategy works better than average. In other words, some authors appear better than the rational agent, because most authors never figure out the correct strategy, depressing the mean.
6.3. Stability and Payoffs
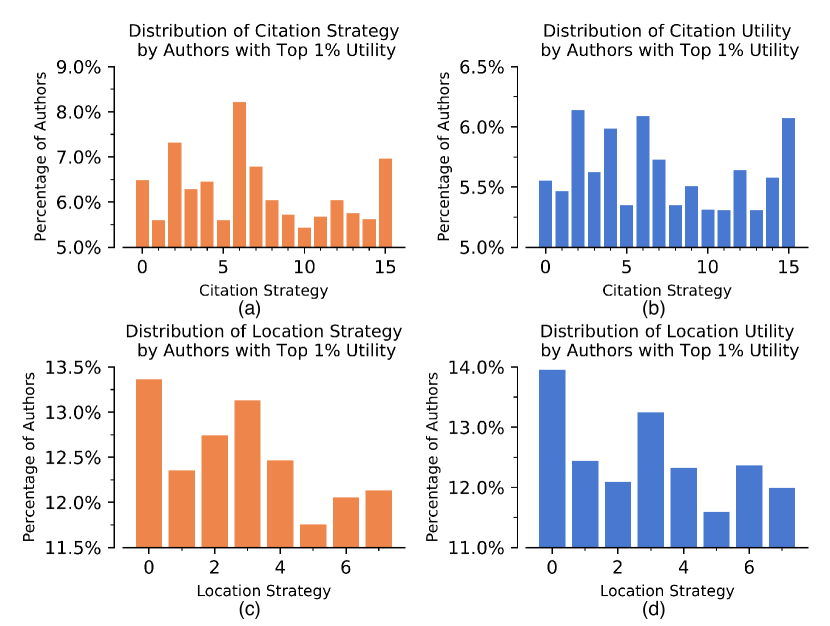
Having established the emergence of a stable preference order for some of the authors, it is natural to ask if this order is correlated with expected utilities. That is, do the preferences over strategies match the utilities that accrue from using them? We examine this issue in Figure 5. The plots show the marginal strategy distribution for the top of the authors in terms of their normalized utility, with the top-left sub-figure showing the marginal citation strategy distribution, and the top right sub-figure showing the corresponding utility distribution. Notice that again, citation strategy 2, 4, 6 and 15, i.e. , , and , have the highest utility values. While strategy 6 does not have the same high mode as strategy 2, 4 and 15 from Figure 3, those authors at the top derive more utility from it than most other authors. The main difference between strategy 4 and strategy 6: strategy 6, consistent with work by Uzzi et al. (2013) on publications with high-impact, emphasizes citing highly cited papers from different fields. At the same time, strategy 4 suggests that we pick highly cited papers from the same field. A similar pattern emerges for location strategy—strategy 0 being the strategy with the highest payoff for the top is consistent with the findings from Figure 3 (b). In this section, we qualitatively examined the questions that motivated this paper: the emergence of preference order, and the relationship between preference order and utility. In the case of the academic dataset, and for the citation and location strategy spaces, we observe the emergence of order. Interestingly, we see that preference order is stable only for the top of the individuals in our dataset. Furthermore, we find that the preferences of the top are correlated with utility.
7. Discussion
In this section, we discuss key ideas and limitations. Below we discuss critical comments: model generalizability, strategy space, and use of one social network dataset.
- Types of content-production:
-
: Our framework applies to content production scenarios with discrete strategy spaces. While the framework applies to the case when there is a mix of single-authored and collaboratively-authored documents, the proposed dual attention networks make the most sense in the case when the content has multiple authors, for example in venues such as academic citation networks and online forums such as Piazza.
- Generalization to other networks::
-
Each social network has a different strategy space (the set of possible actions, reward mechanism—mapping actions to utility), social norms, and the network structure (bipartite person and content graph). Thus, interpreting the results of our framework on each social network requires care. This paper discusses results only from the DBLP dataset. We do have results from StackExchange data, where we assumed that the participants collaborated in creating the set of answers, with user reputation as the payoff. The strategy space for StackExchange included, among others, what questions to answer, which users to follow.
Since this is the first paper on discovering strategic behaviors from networks, we felt that it was essential to perform a qualitative analysis of the discovered behaviors (Section 6), and not restrict ourselves to a link prediction task (Section 5.6, Table 4). It is the qualitative analysis that provides a more in-depth understanding (emergence of order; connections between order and payoffs) of behavior. We lacked space in the paper to describe the strategy space for StackExchange (different from DBLP) and perform a careful qualitative analysis of the StackExchange results. We plan to report these results in an extended ArXiv paper.
- Limitations::
-
We state two limitations here. First, for each social network, we require a specific set of strategies and a utility function. Identification of a complete strategy space may be non-trivial for some networks. Second, our rational model is myopic; instead, we could use an explore-exploit strategy in the vein of reinforcement learning literature.
8. Related Work
Our approach targets strategic behavior modeling in social networks via dual graph attention. We provide a brief overview of related past work.
Strategic Behavior Modeling in Social Networks. Social behavior modeling is connected to a wide range of past work: Papagelis et al. (2011) investigates how individual behavior is affected by those of her friends; Kohli et al. (2012) looks at how social relations affect players’ strategies in a resource allocation game. Others target specific scenarios: Xu et al. (2012) studies users’ posting behavior on Twitter; Irfan and Gordon (2018) includes behavioral context in its model of congressional voting; and more recent work models relation types (Sankar et al., 2019; Narang et al., 2019) and social influence (Sankar et al., 2020; Krishnan et al., 2019) in neural recommendation frameworks; Dong et al. (2014) discovers social strategies among mobile users. Some general frameworks are also proposed: Mueller-Frank (2013) formally characterizes rational learning in social networks. In contrast to past work, we examine if strategic behaviors emerge among social content producers to maximize social rewards.
Graph Attention Networks. With recent advancements in graph neural networks (Zhou et al., 2018; Wu et al., 2019a; Zhang et al., 2018) and attention mechanisms (Vaswani et al., 2017; Lee et al., 2018), GAT (Veličković et al., 2017) introduces the attention mechanism in network feature aggregation by implicitly prioritizing node neighbors. Several works attempt to extend GAT to dynamic versions: combining recurrent neural networks with GAT (Song et al., 2019); combined attention on structural neighborhood and temporal dynamics (Sankar et al., 2018) and node-aware attention for user interaction predictions in real-world dynamic graphs (Prasha Shresha and Volkova, 2019). Wu et al. (2019b) uses user-specific and dynamic context-aware attention weights for social recommendation. In contrast, our proposed DDAN framework extracts latent strategies via forward-backward dual attention to model the social interactions centered on content and authors.
9. Conclusion
In this paper, we investigated the question of whether resource-limited individuals were able to discover strategic behaviors associated with high payoffs when producing content in social networks. Empirical analysis is challenging since while we do observe the action, and the payoff, we do not observe the strategic considerations underlying the action. Our technical insight was to conceptualize the observed behavior as a generative process. That is, a strategic decision changes the posterior distribution over the action space. We assumed that while the set of strategies is common to all, each individual randomizes over the set of strategies. We proposed a novel framework of Dynamic Dual Attention Networks (DDAN) to model authors’ strategic behaviors when creating contents in social networks. We made three strong empirical findings: first, different strategies lead to different payoffs; second, the group of authors with the highest normalized utility exhibit stability in their preferential orders over strategies, which indicates the emergence of strategic behaviors; third, the stability of preference is related to high payoffs. While our technical insight is generalizable, adapting our framework to other social networks requires care: the strategy spaces of these networks may differ, and if the content-production is not collaborative, DDAN may not be the best approach.
References
- (1)
- Barabási and Albert (1999) Albert-László Barabási and Réka Albert. 1999. Emergence of scaling in random networks. science 286, 5439 (1999), 509–512.
- Barbieri et al. (2013) Nicola Barbieri, Francesco Bonchi, and Giuseppe Manco. 2013. Topic-aware social influence propagation models. Knowledge and information systems 37, 3 (2013), 555–584.
- Bhattacharya et al. (2014) Parantapa Bhattacharya, Muhammad Bilal Zafar, Niloy Ganguly, Saptarshi Ghosh, and Krishna P Gummadi. 2014. Inferring user interests in the twitter social network. In Proceedings of the 8th ACM Conference on Recommender systems. ACM, 357–360.
- Deerwester et al. (1990) Scott Deerwester, Susan T Dumais, George W Furnas, Thomas K Landauer, and Richard Harshman. 1990. Indexing by latent semantic analysis. Journal of the American society for information science 41, 6 (1990), 391–407.
- Dong et al. (2014) Yuxiao Dong, Yang Yang, Jie Tang, Yang Yang, and Nitesh V Chawla. 2014. Inferring user demographics and social strategies in mobile social networks. In Proceedings of the 20th ACM SIGKDD international conference on Knowledge discovery and data mining. ACM, 15–24.
- Engqvist and Frommen (2008) Leif Engqvist and Joachim G Frommen. 2008. The h-index and self-citations. Trends in ecology & evolution 23, 5 (2008), 250–252.
- Feng et al. (2018) Zhe Feng, Chara Podimata, and Vasilis Syrgkanis. 2018. Learning to bid without knowing your value. In Proceedings of the 2018 ACM Conference on Economics and Computation. ACM, 505–522.
- Ghosh et al. (2011) Rumi Ghosh, Tsung-Ting Kuo, Chun-Nan Hsu, Shou-De Lin, and Kristina Lerman. 2011. Time-aware ranking in dynamic citation networks. In 2011 IEEE 11th International Conference on Data Mining Workshops. IEEE, 373–380.
- Gigerenzer and Gaissmaier (2011) Gerd Gigerenzer and Wolfgang Gaissmaier. 2011. Heuristic decision making. Annual review of psychology 62 (2011), 451–482.
- Gigerenzer and Goldstein (1996) Gerd Gigerenzer and Daniel G Goldstein. 1996. Reasoning the fast and frugal way: models of bounded rationality. Psychological review 103, 4 (1996), 650.
- Glänzel et al. (2006) Wolfgang Glänzel, Koenraad Debackere, Bart Thijs, and András Schubert. 2006. A concise review on the role of author self-citations in information science, bibliometrics and science policy. Scientometrics 67, 2 (2006), 263–277.
- Hartline et al. (2015) Jason Hartline, Vasilis Syrgkanis, and Eva Tardos. 2015. No-regret learning in Bayesian games. In Advances in Neural Information Processing Systems. 3061–3069.
- Hosmer Jr et al. (2013) David W Hosmer Jr, Stanley Lemeshow, and Rodney X Sturdivant. 2013. Applied logistic regression. Vol. 398. John Wiley & Sons.
- Irfan and Gordon (2018) Mohammad T Irfan and Tucker Gordon. 2018. The Power of Context in Networks: Ideal Point Models with Social Interactions. In Proceedings of the 17th International Conference on Autonomous Agents and MultiAgent Systems. International Foundation for Autonomous Agents and Multiagent Systems, 910–918.
- Kohli et al. (2012) Pushmeet Kohli, Michael Kearns, Yoram Bachrach, Ralf Herbrich, David Stillwell, and Thore Graepel. 2012. Colonel Blotto on Facebook: the effect of social relations on strategic interaction. In Proceedings of the 4th Annual ACM Web Science Conference. ACM, 141–150.
- Kossinets and Watts (2009) Gueorgi Kossinets and Duncan J. Watts. 2009. Origins of Homophily in an Evolving Social Network. Amer. J. Sociology 115 (2009), 405–450. http://www.journals.uchicago.edu/doi/abs/10.1086/599247
- Krishnan et al. (2019) Adit Krishnan, Hari Cheruvu, Cheng Tao, and Hari Sundaram. 2019. A modular adversarial approach to social recommendation. In Proceedings of the 28th ACM International Conference on Information and Knowledge Management. 1753–1762.
- Lee et al. (2018) John Boaz Lee, Ryan A Rossi, Sungchul Kim, Nesreen K Ahmed, and Eunyee Koh. 2018. Attention models in graphs: A survey. arXiv preprint arXiv:1807.07984 (2018).
- Li et al. (2008) Xin Li, Lei Guo, and Yihong Eric Zhao. 2008. Tag-based social interest discovery. In Proceedings of the 17th international conference on World Wide Web. ACM, 675–684.
- Lykouris et al. (2016) Thodoris Lykouris, Vasilis Syrgkanis, and Éva Tardos. 2016. Learning and efficiency in games with dynamic population. In Proceedings of the twenty-seventh annual ACM-SIAM symposium on Discrete algorithms. Society for Industrial and Applied Mathematics, 120–129.
- McPherson et al. (2001) Miller McPherson, Lynn Smith-Lovin, and James M. Cook. 2001. Birds of a Feather: Homophily in Social Networks. Annual Review of Sociology 27 (2001), pp. 415–444. http://www.jstor.org/stable/2678628
- Mueller-Frank (2013) Manuel Mueller-Frank. 2013. A general framework for rational learning in social networks. Theoretical Economics 8, 1 (2013), 1–40.
- Myers et al. (2013) Jerome L Myers, Arnold D Well, and Robert F Lorch Jr. 2013. Research design and statistical analysis. Routledge.
- Narang et al. (2019) Kanika Narang, Chaoqi Yang, Adit Krishnan, Junting Wang, Hari Sundaram, and Carolyn Sutter. 2019. An Induced Multi-Relational Framework for Answer Selection in Community Question Answer Platforms. arXiv preprint arXiv:1911.06957 (2019).
- Papagelis et al. (2011) Manos Papagelis, Vanessa Murdock, and Roelof van Zwol. 2011. Individual behavior and social influence in online social systems. In Proceedings of the 22nd ACM conference on Hypertext and hypermedia. ACM, 241–250.
- Prasha Shresha and Volkova (2019) Dustin Arendt Prasha Shresha, Suraj Maharjan and Svitlana Volkova. 2019. Forecasting Social Interactions from Dynamic Graphs: A Case Study of Twitter, GitHub, and YouTube. In Proceedings of the 15th International Workshop on Mining and Learning with Graphs (MLG).
- Qiu et al. (2013) Minghui Qiu, Feida Zhu, and Jing Jiang. 2013. It is not just what we say, but how we say them: Lda-based behavior-topic model. In Proceedings of the 2013 SIAM international conference on data mining. SIAM, 794–802.
- Sankar et al. (2019) Aravind Sankar, Adit Krishnan, Zongjian He, and Carl Yang. 2019. Rase: Relationship aware social embedding. In 2019 International Joint Conference on Neural Networks (IJCNN). IEEE, 1–8.
- Sankar et al. (2018) Aravind Sankar, Yanhong Wu, Liang Gou, Wei Zhang, and Hao Yang. 2018. Dynamic Graph Representation Learning via Self-Attention Networks. arXiv preprint arXiv:1812.09430 (2018).
- Sankar et al. (2020) Aravind Sankar, Xinyang Zhang, Adit Krishnan, and Jiawei Han. 2020. Inf-VAE: A Variational Autoencoder Framework to Integrate Homophily and Influence in Diffusion Prediction. In Proceedings of the Thirteenth ACM International Conference on Web Search and Data Mining. 510–518.
- Shang et al. (2016) Jingbo Shang, Meng Qu, Jialu Liu, Lance M Kaplan, Jiawei Han, and Jian Peng. 2016. Meta-path guided embedding for similarity search in large-scale heterogeneous information networks. arXiv preprint arXiv:1610.09769 (2016).
- Simon (1972) Herbert A Simon. 1972. Theories of bounded rationality. Decision and organization 1, 1 (1972), 161–176.
- Sinha et al. (2015) Arnab Sinha, Zhihong Shen, Yang Song, Hao Ma, Darrin Eide, Bo-june Paul Hsu, and Kuansan Wang. 2015. An overview of microsoft academic service (mas) and applications. In Proceedings of the 24th international conference on world wide web. ACM, 243–246.
- Song et al. (2019) Weiping Song, Zhiping Xiao, Yifan Wang, Laurent Charlin, Ming Zhang, and Jian Tang. 2019. Session-based social recommendation via dynamic graph attention networks. In Proceedings of the Twelfth ACM International Conference on Web Search and Data Mining. ACM, 555–563.
- Tang et al. (2009) Jie Tang, Jimeng Sun, Chi Wang, and Zi Yang. 2009. Social influence analysis in large-scale networks. In Proceedings of the 15th ACM SIGKDD international conference on Knowledge discovery and data mining. ACM, 807–816.
- Tang et al. (2008) Jie Tang, Jing Zhang, Limin Yao, Juanzi Li, Li Zhang, and Zhong Su. 2008. ArnetMiner: Extraction and Mining of Academic Social Networks. In KDD’08. 990–998.
- Towns et al. (2014) J. Towns, T. Cockerill, M. Dahan, I. Foster, K. Gaither, A. Grimshaw, V. Hazlewood, S. Lathrop, D. Lifka, G. D. Peterson, R. Roskies, J. R. Scott, and N. Wilkins-Diehr. 2014. XSEDE: Accelerating Scientific Discovery. Computing in Science & Engineering 16, 5 (Sept.-Oct. 2014), 62–74. https://doi.org/10.1109/MCSE.2014.80
- Uzzi et al. (2013) Brian Uzzi, Satyam Mukherjee, Michael Stringer, and Ben Jones. 2013. Atypical combinations and scientific impact. Science 342, 6157 (2013), 468–472.
- Vaswani et al. (2017) Ashish Vaswani, Noam Shazeer, Niki Parmar, Jakob Uszkoreit, Llion Jones, Aidan N Gomez, Łukasz Kaiser, and Illia Polosukhin. 2017. Attention is all you need. In Advances in neural information processing systems. 5998–6008.
- Veličković et al. (2017) Petar Veličković, Guillem Cucurull, Arantxa Casanova, Adriana Romero, Pietro Lio, and Yoshua Bengio. 2017. Graph attention networks. arXiv preprint arXiv:1710.10903 (2017).
- Wang and McCallum (2006) Xuerui Wang and Andrew McCallum. 2006. Topics over time: a non-Markov continuous-time model of topical trends. In Proceedings of the 12th ACM SIGKDD international conference on Knowledge discovery and data mining. ACM, 424–433.
- Wu et al. (2019b) Qitian Wu, Hengrui Zhang, Xiaofeng Gao, Peng He, Paul Weng, Han Gao, and Guihai Chen. 2019b. Dual Graph Attention Networks for Deep Latent Representation of Multifaceted Social Effects in Recommender Systems. In The World Wide Web Conference. ACM, 2091–2102.
- Wu et al. (2019a) Zonghan Wu, Shirui Pan, Fengwen Chen, Guodong Long, Chengqi Zhang, and Philip S Yu. 2019a. A comprehensive survey on graph neural networks. arXiv preprint arXiv:1901.00596 (2019).
- Xu et al. (2012) Zhiheng Xu, Yang Zhang, Yao Wu, and Qing Yang. 2012. Modeling user posting behavior on social media. In Proceedings of the 35th international ACM SIGIR conference on Research and development in information retrieval. ACM, 545–554.
- Yin and Wang (2014) Jianhua Yin and Jianyong Wang. 2014. A dirichlet multinomial mixture model-based approach for short text clustering. In Proceedings of the 20th ACM SIGKDD international conference on Knowledge discovery and data mining. ACM, 233–242.
- Zhang et al. (2018) Ziwei Zhang, Peng Cui, and Wenwu Zhu. 2018. Deep learning on graphs: A survey. arXiv preprint arXiv:1812.04202 (2018).
- Zhou et al. (2018) Jie Zhou, Ganqu Cui, Zhengyan Zhang, Cheng Yang, Zhiyuan Liu, and Maosong Sun. 2018. Graph neural networks: A review of methods and applications. arXiv preprint arXiv:1812.08434 (2018).
- Zhu et al. (2017) Yu Zhu, Hao Li, Yikang Liao, Beidou Wang, Ziyu Guan, Haifeng Liu, and Deng Cai. 2017. What to Do Next: Modeling User Behaviors by Time-LSTM.. In IJCAI. 3602–3608.