Space-time dependence of corona virus (COVID-19) outbreak
Abstract
We analyse the data for the global corona virus (COVID-19) outbreak using the results of a previously studied Susceptible-Infected-Removed (SIR) model of epidemic spreading on Euclidean networks. We also directly study the correlation of the distance from the epicenter and the number of cases. An inverse square law is seen to exist approximately. The studies are made for China and the rest of the world separately.
The novel corona virus (COVID-19), which causes an acute respiratory disease in humans, has emerged as the latest worldwide epidemic, having already claimed a considerable number of lives, especially in China, from where it started in late 2019 nature ; abnormal . The epicenter has been identified as the city of Wuhan in mainland China. Due to drastic precautionary steps taken in China, the disease has been contained to some extent of late, however, it has rapidly spread over to the rest of the world (ROW henceforth), causing serious concern. It is expected that because of the current awareness, efficient treatment and preventive measures in operation, the number of deaths may be controlled soon, but long term effects on academic activities, commerce, social life, sports, tourism etc. are anticipated.
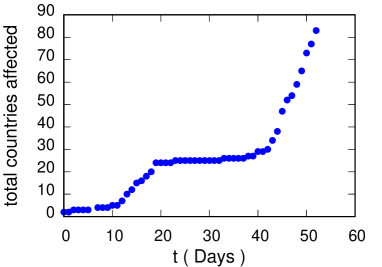
A considerable number of analysis of the available data of the number of cases and deaths have already been made, and a few data driven models have also been proposed italy ; chinese ; newsstand ; china2 ; crowd ; delay ; china3 ; deep ; scaling ; effect ; artificial ; visual ; dynamic ; trend . However, these works are mostly based on the data from a single country/region. In this work, the ongoing outbreak is studied using the data in data where the number of total cases, number of new cases and some other relevant information are available for China and other parts of the world. The data are available in the form of daily reports (starting from January 21, 2020; the onset of the disease happened much earlier in China) of new cases and total cases for different countries. Fig. 1 shows the number of countries affected as a function of time (starting date January 13, 2020 for this data), the total number at present is close to 90. We analyse some of the data using a previously studied model for epidemic spreading on complex networks khaleq1 .
The affliction caused by corona virus belongs to the class of Susceptible-Infected-Removed (SIR) disease, where an infected person either dies or recovers, and the disease can be contracted only once. For the newly detected cases, SIR typically shows a peak. However, real data may show multiple peaks due to delayed spreads and other, possibly demographic and geographic reasons. Here also, the total number of new cases (daily) shows a secondary growth beyond an initial peak value (see Fig. 2 upper panel). That this is due to the later global spread beyond China is clearly indicated when the data for China and ROW are plotted separately in the lower panel of Fig. 2. The number of newly infected cases for China shows the feature of a SIR type of disease as it shows a peak value followed by a decay, although not very smooth.
The above observation shows that it is better to study the data for China and the rest of the world separately, if one uses a SIR type of model. Since the newly infected number shows lots of fluctuations usually, it is more convenient to consider the cumulative data.
In the SIR model studied on a Euclidean network khaleq1 , it was assumed that the disease can be transmitted to a nearest neighbour and to some random other agent who is connected with a probability decaying algebraically with the Euclidean distance separating them. We attempt to fit the cumulative data using the results obtained in khaleq1 which gave very nice agreement with the Ebola outbreak in West Africa khaleq2 . The transmission of corona virus however, is much more probable than in Ebola in the latter one requires more intimate body contact to get infected.
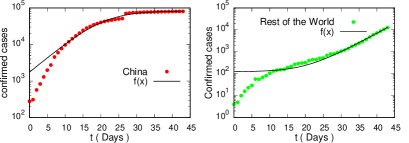
The cumulative data (total number of cases) for China indeed show a saturation and are fitted to the form obtained in khaleq1 :
| (1) |
such that at , a saturation value is obtained. The value of the fitting parameters are and . It can be seen that on day 26, there is a jump in the number (probably due to non-availability of quality data) and therefore the errors involved in fitting are not very small for and , but definitely less than .
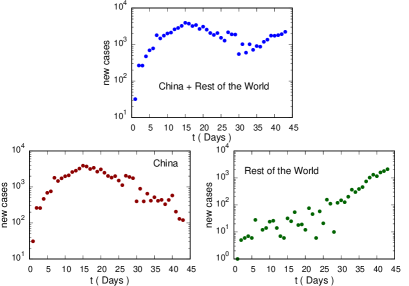
The data for the rest of the world (ROW) do not show a peak value yet for the newly infected cases indicating that it is still in the growing stage (see Fig. 2 lower panel). It is not unusual to find a exponential growth initially in epidemic spreading which would also give a exponential rise for the cumulative data. An initial exponential variation is expected from eq 1 provided the parameter which was noted for Ebola khaleq2 . However, we find that the present data are better fitted with an exponential fit beyond , in case one attempts to fit the entire data, the following form gives a fairly good fit:
| (2) |
with and . The data and the fittings for both China and ROW are shown in Fig. 3.
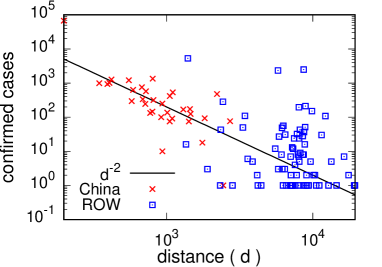
We next study the spatial dependence of the infection spread. The Haversine distances (in Km) between the places of occurrence of the disease and Wuhan are calculated and the number of cases reported at a distance is plotted in Fig. 4. For countries other than China, we take the distance from their capital cities to Wuhan. The data of China alone can be approximately fitted as . However, the fit may not be appropriate when all the data are included as the epicenters might have shifted elsewhere. Indeed we find the data at larger to be more scattered. The correlation coefficient between and the affected number is also calculated; for China it is -0.267 while for the rest of the world is is -0.197, agreeing with the above.
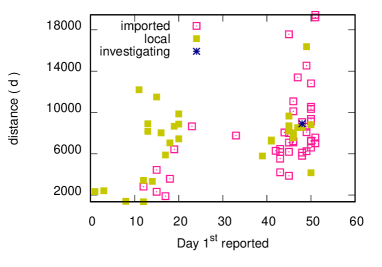
For infection to other countries, there can be two modes of transmission: local or imported. We plot in Fig. 5 the distances from Wuhan against the date of the first reported cases in the countries in the rest of the world (note that for this data, the origin of time is January 13, 2020 data ). We note that there can be places at nearly the same distance which got the first infection on dates widely separated. However, in general, one can note that the data points fall around two clusters quite well separated in time; one dominated by infections due to local transmission and the other consisting of imported infections mainly, the latter occurring at later dates.
To summarise, the space time dependence of the corona virus data show several interesting features as of now. The cumulative data for China show reasonably good agreement with the empirical form obtained in khaleq1 . Also, the numerical values of the timescales and , associated with the cumulative number of affected persons, are found to be quite close, consistent with the fact that the data are for the same virus. The epidemic is still in the rising stage outside China. The most intriguing result is the inverse square law dependence of the number of cases against distance from the epicenter. This could have some connection with the gravity law in social dynamics.
References
- (1) Zhou P., Yang X-L., Wang X-G., Hu B., Zhang L., Zhang W., Si H-R., Zhu Y., Li B., Huang C.L., Chen H-D., Chen J., Luo Y., Guo H., Jiang R-D., Liu M-Q., Chen Y., Shen X-R., Wang X., Zheng X-S., Zhao K., Chen Q-J., Deng F., Liu L-L., Yan B., Zhan F-X., Wang Y-Y., Xiao G-F., Shi Z-L. , A pneumonia outbreak associated with a new coronavirus of probable bat origin, Nature, https://doi.org/10.1038/s41586-020-2012-7.
- (2) Yunlu Wang, Menghan Hu, Qingli Li, Xiao-Ping Zhang, Guangtao Zhai, Nan Yao, Abnormal respiratory patterns classifier may contribute to large-scale screening of people infected with COVID-19 in an accurate and unobtrusive manner, arXiv:2002.05534
- (3) Guiseppe. Gaeta, Data analysis for the COVID-19 early dynamics in Northern Italy, arXiv:2003.02062
- (4) Yi-Cheng Chen, Ping-En Lu, Cheng-Shang Chang, A Time-dependent SIR model for COVID-19, arXiv:2003.00122
- (5) John Kastner, Hong Wei, Hanan Samet, Viewing the Progression of the Novel Corona Virus (COVID-19) with NewsStand, arXiv:2003.00107
- (6) Zhihua Liu, Pierre Magal, Ousmane Seydi, Glenn Webb, Predicting the cumulative number of cases for the COVID-19 epidemic in China from early data, arXiv:2002.12298
- (7) Zhiming Fang, Zhongyi Huang, Xiaolian Li, Jun Zhang, Wei Lv, Lei Zhuang, Xingpeng Xu, Nan Huang, How many infections of COVID-19 there will be in the ”Diamond Princess”-Predicted by a virus transmission model based on the simulation of crowd flow, arXiv:2002.10616
- (8) Yu Chen, Jin Cheng, Xiaoying Jiang, Xiang Xu, The Reconstruction and Prediction Algorithm of the Fractional TDD for the Local Outbreak of COVID-19, arXiv:2002.10302
- (9) Yimin Zhou, Zuguo Chen, Xiangdong Wu, Zengwu Tian, Liang Cheng, Lingjian Ye, The Outbreak Evaluation of COVID-19 in Wuhan District of China, arXiv:2002.09640
- (10) Xiaowei Xu, Xiangao Jiang, Chunlian Ma, Peng Du, Xukun Li, Shuangzhi Lv, Liang Yu, Yanfei Chen, Junwei Su, Guanjing Lang, Yongtao Li, Hong Zhao, Kaijin Xu, Lingxiang Ruan, Wei Wu, Deep Learning System to Screen Coronavirus Disease 2019 Pneumonia, arXiv:2002.09334 [pdf] physics.med-ph cs.LG eess.IV
- (11) Ming Li, Jie Chen, Youjin Deng, Scaling features in the spreading of COVID-19, arXiv:2002.09199
- (12) Benjamin F. Maier, Dirk Brockmann, Effective containment explains sub-exponential growth in confirmed cases of recent COVID-19 outbreak in Mainland China, arXiv:2002.07572
- (13) Zixin Hu, Qiyang Ge, Shudi Li, Li Jin, Momiao Xiong, Artificial Intelligence Forecasting of Covid-19 in China, arXiv:2002.07112
- (14) Baoquan Chen, Mingyi Shi, Xingyu Ni, Liangwang Ruan, Hongda Jiang, Heyuan Yao, Mengdi Wang, Zhenhua Song, Qiang Zhou, Tong Ge, Visual Data Analysis and Simulation Prediction for COVID-19, arXiv:2002.07096
- (15) Liangrong Peng, Wuyue Yang, Dongyan Zhang, Changjing Zhuge, Liu Hong, Epidemic analysis of COVID-19 in China by dynamical modeling, arXiv:2002.06563
- (16) Qiang Li, Wei Feng, Trend and forecasting of the COVID-19 outbreak in China, arXiv:2002.05866
- (17) https://www.who.int/emergencies/diseases/novel-coronavirus-2019/situation-reports
- (18) Abdul Khaleque, Parongama Sen, The susceptible– infected–recovered model on a Euclidean network, Journal of Physics A:Mathematical and Theoretical, 46 095007 (2013).
- (19) Abdul Khaleque, Parongama Sen, An empirical analysis of the Ebola outbreak in West Africa, Scientific Reports, 7 42594 (2017).