The explosion energy of the type IIP supernova SN 2013fs with a confined dense circumstellar shell
Abstract
The recent study of SN 2013fs flash spectrum suggests enormous for SN IIP explosion energy, far beyond possibilities of the neutrino mechanism. The issue of the explosion energy of SN 2013fs is revisited making use of effects of the early supernova interaction with the dense circumstellar shell. The velocity of the cold dense shell between reverse and forward shocks is inferred from the analysis of the broad He II 4686 Å on day 2.4. This velocity alongside with other observables provide us with an alternative energy estimate of erg for the preferred mass of . The inferred value is within the range of the neutrino driven explosion.
keywords:
supernovae: general – supernovae: individual: SN 2013fs1 Introduction
A single star with an initial mass of 9-25 retains significant amount of the hydrogen envelope prior to the core collapse and explodes as a red supergiant (RSG) giving rise to SN IIP (Heger et al., 2003) ("P" stands for the light curve "plateau") or SN IIL ("L" for linear light curve). In some cases a distinction between SN IIP and SN IIL is illusive, so SN II as a designation SN II becomes more adequite. A RSG pre-SN loses its mass via the slow wind with velocities reliably known only for a few objects, e.g., km s-1 for SN 1998S (Chugai et al., 2002) and km s-1 for SN 1997eg (Chugai, 2019). The typical wind density parameter is g cm-1 as inferred from radio and X-ray data (Chevalier et al., 2006). The SN interaction with the wind of that density cannot produce detectable optical emission lines.
Yet following SN 2006bp (Quimby et al., 2007) at least dozen of SNe II show high ioniation emission lines on a smooth continuum in early ( days) spectra (Khazov et al., 2016). This phenomenon dubbed "flash spectrum" is the emission lines from a confined dense circumstellar (CS) shell ( cm) ionized by the flash of UV radiation after the shock breakout (Groh, 2014; Khazov et al., 2016; Yaron et al., 2017). The phenomenon of high ionization emission lines in early spectra was observed formerly in the type IIL SN 1998S (Fassia et al., 2001) and interpretted as originated in the confined ( cm) CS shell with the mass of and the Thomson optical depth of (Chugai, 2001). The mechanism of the vigorous mass loss responsible for the dense confined CS shell is not yet understood. Only % of SNe II demonstrate signatures of the confined CS shell (Khazov et al., 2016) which suggests that some special preconditions (e.g., initial mass, rotation) should be met for the masive star to become "flash" SN II.
Recently, Yaron et al. (2017) explored flash spectrum of SN 2013fs and among important results on the structure of the confined CS shell authors reported an estimate of the explosion energy based on the analysis of the early (< 3 day) multiband photometry. (Here we identify the explosion energy and the ejecta kinetic energy.) For the ejecta mass of 10 the inferred energy is amazingly high erg (Yaron et al., 2017). Their estimate significantly exceeds the explosion energy for normal SNe IIP and is also far above the upper limit ( erg) for the neutrino explosion mechanism (Janka, 2017). Although supernovae could be caused by the more energetic explosions (e.g., hypernovae), it seems that currently it is premature to abandon the neutrino mechanism for SN 2013fs. A hint for a possible uncertainty of the energy estimate stems from a significant discordance of the RSG radius inferred by the hydrodynamic and analytical approaches (Yaron et al., 2017). In this situation an alternative estimate of the explosion energy of SN 2013fs is highly demanded.
Here we explore the early stage of the hydrodynamic interaction of SN 2013fs ejecta with the dense CS shell in an attempt to propose an alternative energy estimate. Particularly we make use of the broad emission at about 4500 Å at 2.4 day identified with the He II 4686 Å line (Bullivant et al., 2018). It will be argued that this line originates from the fragmented cold dense shell (CDS) between the reverse and forward shock (Section 2). The inferred CDS velocity in a combination with other observables will permit us to constrain the explosion energy via the modelling of the SN/CSM interaction (Section 3).
The study is based on the Keck-1 spectrum at the age of 2.42 days (Oct. 8.45) and the spectrum on day 51 (Nov. 26) taken at the Palomar 200-inch telescope; both spectra are retrieved from the WISeREP database (Yaron & Gal-Yam, 2012) (https://wiserep.weizmann.ac.il). Below I use the explosion date Oct. 6.03 (UTC), the average between 2013 Oct. 6.12 (Yaron et al., 2017) and Oct. 5.946 (Bullivant et al., 2018).
2 Broad He II 4686 Å
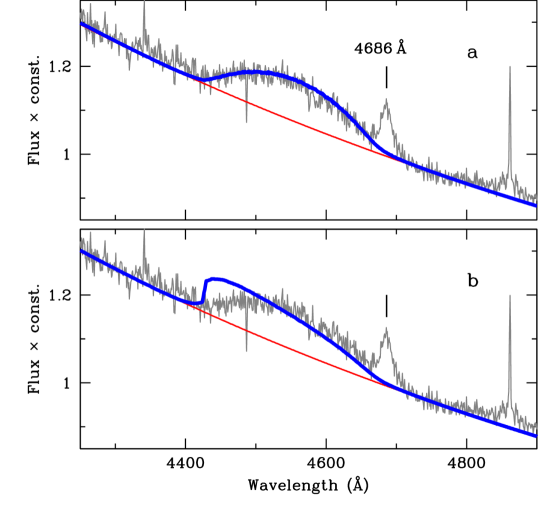
The SN 2013fs spectrum on day 2.42 shows a broad low contrast emission at about 4500 Å (Bullivant et al., 2018). Authors identify it with He II 4686 Å emitted by the SN ejecta with the velocity of km s-1. While the identification seems reasonable, the suggested line-emitting site raises a problem. The point is that the line-emitting layer in the early unshocked ejecta ionized by keV X-rays from the reverse shock is very narrow, (where cm2 g-1 is the X-ray absorbtion coefficient) and accordingly has a small velocity dispersion . The line profile in this case should be boxy, skewed towards blue by the occultation effect. The observed broad He II line is indeed skewed towards blue, but the original profile looks dome-like, not boxy (cf. Bullivant et al., 2018, Fig. 20).
An alternative line-emitting site is the CDS, although in this case the dome-like profile requires special preconditions. The spherical thin shell predicts M-shaped profile for the optically thick line (Gerasimovič, 1933; Cid Fernandes & Terlevich, 1994) and boxy profile for the optically thin line, both options inconsistent with the observed profile. In fact, a smooth thin CDS cannot survive. The decelerating CDS is subject to the Rayleigh-Taylor instability that results in the CDS fragmentation, which produces an ensemble of filaments and randomly folded sheets of the dense cold gas (Chevalier & Blondin, 1995; Blondin & Ellison, 2001). The line profile emitted by the fragmented shell for the optically thin line is boxy. Moreover, for the optically thick line the profile may also be boxy. The profile shape depends on the mixing degree specified by the area ratio , i.e., the ratio of the cumulative surface of CDS fragments to the undisturbed CDS surface. The parabolic profile is expected for and boxy profile for (Chugai et al., 2004). The dome-like profile of the He II line at 2.4 days suggests that the CDS should be fragmented and well mixed. A possible clumpy structure of the CS shell additionally favours the advanced mixing of the CDS (cf. Blondin, 2001, Fig. 6).
The computed He II 4686 Å profile is shown for two extreme mixing cases, and (Fig. 1). The fragmented CDS in the model lies at the sharp photosphere that presumably coincides with the inner boundary of the CDS. The fragmented shell should absorb in the continuum in order to fit the profile around zero and positive radial velocities. The optimal optical depth is 0.2. The adopted Thomson optical depth of the wind is in line with the estimates of Yaron et al. (2017). The result is not sensitive to the variation of the wind Thomson optical depth in the range of %. The case provides an excellent fit while the case is rulled out. The expansion velocity of the CDS is found to be km s-1 that is consistent with the Bullivant et al. (2018) estimate of the velocity of the line-emitting gas ( km s-1). The narrow He II 4686 Å line with the FWHM km s-1 (Fig. 1) that is apparently emitted by the CS gas will be discussed in Section 4.
The broad He II 4686 Å emission is likely dominated by the recombination. In that case for the solar composition of the hydrogen and helium one expects the comparable emission of the H that is actually not seen on day 2.4 (cf. Bullivant et al., 2018, Fig. 7). The likely reason for that is a significant He enrichment indicated by the low ratio H/ He II 4686 Å in the CS flash spectrum of SN 2013fs (Yaron et al., 2017).
3 CS interaction and the explosion energy
3.1 Kinematic constraints
The inferred expansion velocity of the CDS can be used alongside with the maximal velocity of the unshocked ejecta km s-1 at d recovered from the blue edge of the H absorption in the Palomar spectrum to constrain the explosion energy of SN 2013fs for a given ejecta mass. An important additional constraint is provided by the photospheric radius (Yaron et al., 2017) that should coincide with the model CDS at the early stage. In order to describe these observables we consider the SN interaction with the CS gas in the thin shell approximation (Chevalier, 1982; Giuliani, 1982; Chugai, 2001). Yet, as we will see, kinematic considerations only are not able to constrain the energy. The point is that the change of the energy can be compensated by a corresponding change of the CS density so that the CDS velocity at the certain age is preserved. In the next section models with different energy and CS density will be discriminated using the H liminosity.
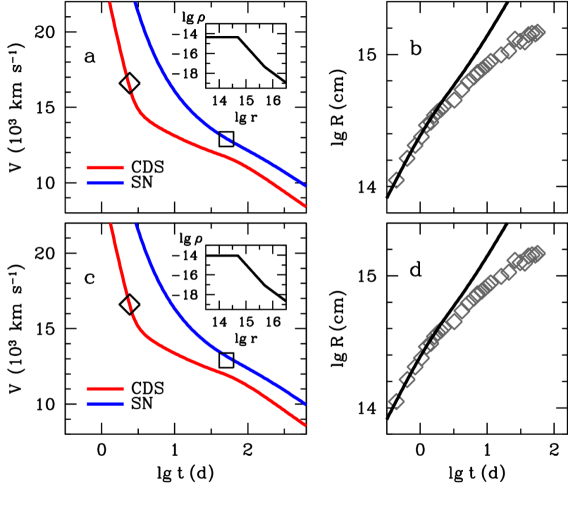
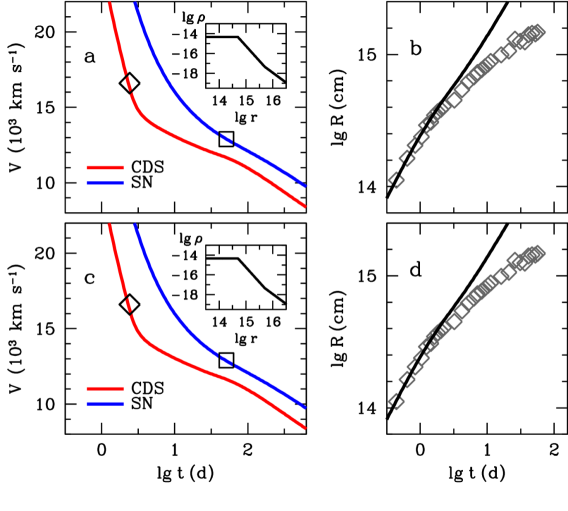
The dynamic evolution of the CDS is determined by the density distribution of SN ejecta in outer layers and the CS density . The density of the homologously expanding ejecta is set as with and determined by the ejecta mass and kinetic energy . The hydrodynamic model of SN 2018in (the normal SN IIP) suggests (Utrobin & Chugai, 2013) that is adopted here. The density distribution of the confined CS shell is presumably uniform within the extent of the confined CS shell cm, the value estimated by Yaron et al. (2017). For cm the CS density presumably falls as and beyond cm the CS density turns to a slow RSG wind with and the density parameter g cm-1.
For the fiducial model A we adopt the kinetic energy of erg, very mush close to the upper limit for the neutrino mechanism. In the model B the energy is set to be erg that by a factor of 1.5 exceeds the upper limit for the neutrino mechanism. In both models the ejecta mass is in line with the value inferred by Yaron et al. (2017). Yet we explore other possibilities as well. The CS density for the same normalized distribution is determined for each model from the optimal fit (Fig. 2). Both presented models reproduce the CDS velocity at d, maximal velocity of unshocked ejecta at d, and the photosphere radius at days (Fig. 2) for the mass of the confined CS shell of in the model A and of in the model B. For other choice of the ejecta mass and the same CS density, the appropriate energy obeys the scaling relation that is obtained numerically.
3.2 Constraint from the H luminosity
Both the model A and the model B with the energy beyond the neutrino mechanism meet observational requirements. We therefore need to apply an additional tool to discriminate between the models. The significant difference of the mass of the confined CS shell in these models prompts that the H emission from the CS gas could provide us a crucial test.
The observed H luminosity at d is erg s-1 (Yaron et al., 2017). The emission measure at this age is of cm-3 in the model A and of cm-3 in the model B. The efficient recombination coefficient for the H emission in the recombination case C (optically thick Balmer lines) is cm3 s-1 (Osterbrock, 1989). The effective temperature at this age is K (Yaron et al., 2017). Since the electron temperature in the preshock wind and decreases with the radius (Dessart et al., 2017) K is a resonable estimate. For this value we obtain then erg s-1 in the model A and erg s-1 in the model B. The H luminosity in the model A coincides with the observational value, whereas for the model B the H luminosity is by a factor of 10 higher. The H test thus strongly disfavours models with the energy significantly exceeding erg.
3.3 Ejecta mass and the light curve
The question may be posed whether the adopted ejecta mass of 10 is an optimal one. This estimate is obtained from the anlysis of the shock breakout continuum employing the radiation hydrodynamics (Yaron et al., 2017). An independent verification of this choice can be made based on the bolometric light curve. The observational bolometric light curve reported by Yaron et al. (2017) is truncated at 56 days. The sensible reconstruction of the later behavior can be performed with the -band photometry (Bullivant et al., 2018) that we match with the bolometric light curve in the range of 38-56 days (Fig. 4).
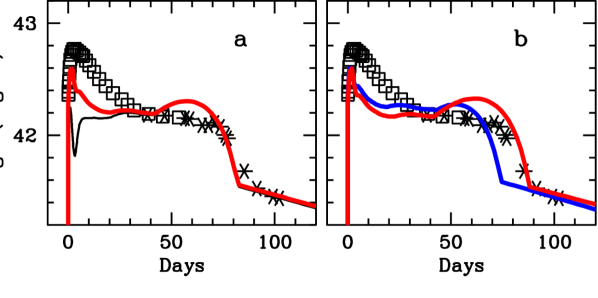
The model bolometric light curve is calculated below for the fiducial case A ( , erg), and two alternative cases: low mass (8 , erg) and high mass (12 , erg). It should be emphasised that both latter versions meet the same kinematic constraints as the model A (Fig. 3). The ejecta luminosity without the CS interaction is calculated based on a simple model that is composed by the two luminosity regimes: the initial diffusion luminosity of the uniform ejecta (Arnett, 1980) and the late time cooling wave (Chugai, 1991) with the effective temperature of 5000 K (Grassberg et al., 1971). The cooling wave regime turns on when the diffusion luminosity becomes lower than the cooling wave luminosity; this occurs at about 40-50 days. The initial condition is the uniform sphere of the radius with the kinetic energy , the homologous kinematics, and the thermal radiation . The thermal energy evolution is controlled by the adiabatic cooling, radioactive heating, and diffusion luminosity . The average escape time for the uniform distribution of the matter and radiation density is (Sunyaev & Titarchuk, 1980), where is the current envelope radius, is speed of light, and is the optical depth calculated with the Opal opacity (Iglesias & Rogers, 1996).
The computed light curve for the model A (Fig. 4a) is shown for two versions: without and with the CS interaction. The interaction luminosity is calculated already in the frame of the CS interaction model (Section 3.1). Apart from the adopted mass and energy the ejecta light curve is specified also by the RSG radius of cm, the 56Ni mass of 0.052 , and the CS mass 0.0036 . The inferred RSG radius is within the range of previous estimates cm (Yaron et al., 2017)
The puzzling minimum in the ejecta luminosity at days is related to the maximum in the behavior of the Opal opacity vs. temperature at about K. The minimum becomes pronounced in this particular case due to the approximation of the uniform envelope. The significant deficit of the model luminosity at the early epoch is also related to the approximation of the uniform ejecta: the latter is not able to describe the rapid radiation diffusion expected for real ejecta with rarefied density of outer layers. Yet the model satisfactorily reproduces the luminosity and duration of the light curve plateau.
The light curves for the lower and higher mass (Fig. 4b) are less successful in the plateau description although the difference with the model A is marginal. These cases can be considered as estimates for the range of uncertainties of the SN 2013fs mass and the explosion energy erg.
4 Discussion and Conclusions
The primary goal of the paper has been to infer an alternative estimate of the explosion energy in attempt to relax the disparity between the high kinetic energy reported earlier (Yaron et al., 2017) and the neutrino mechanism. The argued origin of the broad He II 4686 Å emission from the fragmented CDS results in the CDS velocity estimate that combined with other observational constraints permits us to infer the energy erg for the 10 ejecta reported in earlier study Yaron et al. (2017) and confirmed here as well. Remarkably that the new energy estimate is within the range erg implied by the neutrino driven explosion (Janka, 2017).
The large disparity between the present and former energy estimates indicates some systematic effect. A hint for possible systematic errors related to the energy estimate from the shock breakout analysis is provided by the large difference of the pre-SN radius estimated from the hydrodynamic modelling (1000 ) and the analytical consideration (180 ) (Yaron et al., 2017). Yet, independently of the exact source of systematic error the former energy estimate anyway indicates that the explosion energy of SN 2013fs is likely high compared to other SNe IIP. In that sense the former and the present energy estimate are qualitatively agree with each other. It would be interesting to verify whether the phenomenon of the confined dense shell in SNe IIP is always accompanied by their high explosion energy.
When interpeting the broad He II 4686 Å emission on day 2.42 we omitted the component with the intermediate FWHM of km s-1. Although this component is not involved directly in our model for the broad He II line we point out sensible explanations for this feature. The relatively low velocity of the line-emitting gas of the intermediate component suggests that this line is related to the CS gas. On the other hand, the absence of a narrow component (FWHM km s-1), unlike, e.g.,that in the H (Fig. 1), indicates that only a high velocity CS gas is involved in the emission. Two conjectures are conceivable for the origin of this high velocity CS gas: (i) the preshock wind accelerated by the supernova radiation; (ii) the accelerated fragments of crushed CS clouds engulfed by the forward shock. These possibilities should be discriminated via the detailed modelling.
At the moment we aware of at least three well observed SNe II with the estimated extent of the confined dense CS shell (): SN 1998S with cm (Chugai, 2001), SN 2013cu with cm (Groh, 2014), and SN 2013fs with cm (Yaron et al., 2017). The extension of dense CS shell of another SN 2006bp showing flash spectrum can be estimated based on the fact that the narrow H in SN 2006bp disappeared betweed days 3 and 5 (Quimby et al., 2007). The broad He II 4686 Å in SN 2006bp on day 2 implies the CDS velocity of km s-1. With this average velocity and the lifetime of narrow H of 4 day the extension of the confined CS shell turns out to be cm, comparable with the above three supernovae. To summarize, in four discussed SNe II the extent of the confined CS shell falls in the range of cm. Among these SNe the wind velocity is well determined only for SN 1998S in which case km s-1 (Chugai et al., 2002). A reasonable assumption is that other three SNe have the similar wind speed in which case the strong mass loss occurs between 4 and 10 yrs prior to the core collapse.
The mechanism operating in the pre-collapse core that brings about a vigorous mass loss at this stage has yet to be understood. Depending on the prerequisites (e.g., mass, rotation, etc.) the mechanism probably operates with different efficiency marked by the fact that only about 1/5 of SNe II demonstrate flash spectra (Khazov et al., 2016).
Acknowledgements
I thank V. P. Utrobin for discussions.
References
- Arnett (1980) Arnett W. D., 1980, ApJ, 237, 541
- Blondin (2001) Blondin J. M., 2001, in Holt S. S., Hwang U., eds, American Institute of Physics Conference Series Vol. 565, Young Supernova Remnants. pp 59–68, doi:10.1063/1.1377072
- Blondin & Ellison (2001) Blondin J. M., Ellison D. C., 2001, The Astrophysical Journal, 560, 244
- Bullivant et al. (2018) Bullivant C., et al., 2018, MNRAS, 476, 1497
- Chevalier (1982) Chevalier R. A., 1982, ApJ, 259, 302
- Chevalier & Blondin (1995) Chevalier R., Blondin J. M., 1995, The Astrophysical Journal, 444, 312
- Chevalier et al. (2006) Chevalier R. A., Fransson C., Nymark T. K., 2006, ApJ, 641, 1029
- Chugai (1991) Chugai N. N., 1991, Soviet Astronomy Letters, 17, 210
- Chugai (2001) Chugai N. N., 2001, MNRAS, 326, 1448
- Chugai (2019) Chugai N. N., 2019, Astronomy Letters, 45, 71
- Chugai et al. (2002) Chugai N. N., Blinnikov S. I., Fassia A., Lundqvist P., Meikle W. P. S., Sorokina E. I., 2002, MNRAS, 330, 473
- Chugai et al. (2004) Chugai N. N., Chevalier R. A., Lundqvist P., 2004, MNRAS, 355, 627
- Cid Fernandes & Terlevich (1994) Cid Fernandes R., Terlevich R., 1994, Line profiles in compact supernova remnants and active galactic nuclei.. p. 365
- Dessart et al. (2017) Dessart L., John Hillier D., Audit E., 2017, A&A, 605, A83
- Fassia et al. (2001) Fassia A., et al., 2001, MNRAS, 325, 907
- Gerasimovič (1933) Gerasimovič B. P., 1933, Zeitschrift fur Astrophysik, 7, 335
- Giuliani (1982) Giuliani Jr. J. L., 1982, ApJ, 256, 624
- Grassberg et al. (1971) Grassberg E. K., Imshennik V. S., Nadyozhin D. K., 1971, Ap&SS, 10, 28
- Groh (2014) Groh J. H., 2014, Astronomy and Astrophysics, 572, L11
- Heger et al. (2003) Heger A., Fryer C. L., Woosley S. E., Langer N., Hartmann D. H., 2003, ApJ, 591, 288
- Iglesias & Rogers (1996) Iglesias C. A., Rogers F. J., 1996, ApJ, 464, 943
- Janka (2017) Janka H.-T., 2017, Neutrino-Driven Explosions. p. 1095, doi:10.1007/978-3-319-21846-5_109
- Khazov et al. (2016) Khazov D., et al., 2016, ApJ, 818, 3
- Osterbrock (1989) Osterbrock D. E., 1989, Astrophysics of gaseous nebulae and active galactic nuclei
- Quimby et al. (2007) Quimby R. M., Wheeler J. C., Höflich P., Akerlof C. W., Brown P. J., Rykoff E. S., 2007, ApJ, 666, 1093
- Sunyaev & Titarchuk (1980) Sunyaev R. A., Titarchuk L. G., 1980, A&A, 500, 167
- Utrobin & Chugai (2013) Utrobin V. P., Chugai N. N., 2013, A&A, 555, A145
- Yaron & Gal-Yam (2012) Yaron O., Gal-Yam A., 2012, PASP, 124, 668
- Yaron et al. (2017) Yaron O., et al., 2017, Nature Physics, 13, 510