Charge-, salt- and flexoelectricity-driven anchoring effects in nematics
Abstract
We investigate the effects of electric double layers and flexoelectricity on the surface anchoring in general nematic fluids. Within a simplified model, we demonstrate for a nematic electrolyte how the surface anchoring strength can be affected by the surface charge, bulk ion concentration and/or flexoelectricity, effectively changing not only the magnitude of the anchoring but also the anchoring type, such as from planar to tilted. In particular, we envisage possible tuning of the anchoring strength by the salt concentration in the regime where sufficiently strong electrostatic anchoring, as controlled by the (screened) surface charge, can compete with the non-electrostatic anchoring. This effect is driven by the competing energetic-torque couplings between nematic director and the emergent electrostatic potential, due to surface charge, ions and flexoelectricity. Our findings propose a way of influencing surface anchoring by using electrostatic effects, which could be used in various aspects, including in the self-assembly of colloidal particles in nematic fluids, optical and display patterns, and sensing.
I Introduction
Surfaces are one of the main tools for controlling the orientational order of the building blocks in complex nematic fluids. The interaction imposed at the surfaces on the nematic fluids is called surface anchoring Jerome (1991); De Gennes and Prost (1993), and it fundamentally emerges because of the interaction between the nematic building blocks and the surface material, such as a polymer-rubbed wall, glass or another liquid or gas. With span of combinations of materials, the surface anchoring can impose surface orientational order in almost every arbitrary direction, from homeotropic Stark (2001), planar Crawford et al. (1993), planar degenerate Fournier, J.-B. and Galatola, P. (2005) to tilted Patel and Yokoyama (1993) and even degenerate tilted Jagemalm and Komitov (1997); also the interaction can be of different strength. Technologically, control over surface anchoring is instrumental in display applications of nematic fluids, but goes also far beyond this, and is central in applications including sensors McCamley et al. (2007), emulsification Poulin and Weitz (1998) and microfluidics Batista et al. (2015). The surface anchoring is commonly associated with surface-imposed ordering of (passive) materials such as molecules, polymers, or colloidal particles, but actually, the same type of interaction emerges also in non-equilibrium -active matter- systems Wu et al. (2017); Duclos et al. (2018).
An electric field is another tool for controlling the orientational order in nematic fluids, and is usually applied as an external field (voltage), but can also be sourced, for example, from local charges present in the materials (such as ions) Sawada et al. (1999), or by flexoelectricity where the elastic distortion of the nematic generates a local (electric) polarisation Meyer (1969). Often the effects of free charges and flexoelectricity are small and considered negligible, but this does not need to be true. By introducing ions into nematics or using flexoelectricity, one opens a possibility to create electric fields that are strongly spatially anisotropic both in direction and magnitude, with the complexity of the electric field being determined by the nematic and ion profile (and their mutual coupling), and not only by the electrodes as in the case of external electric fields Thurston (1984). Furthermore, the use of ions in liquid crystals was demonstrated in a recent experimental paper to affect electrostatically controlled anchoring of charged colloidal particles on a surface Mundoor et al. (2019), and also indirectly by the balance of screened electrostatic interactions and elastic interactions to produce specific crystal structures Mundoor et al. (2016). Ions also influence the isotropic-nematic phase transition in lyotropic liquid crystals Mukherjee et al. (2005) and influences nonlinear electroosmosis in nematic liquid crystals Poddar et al. (2017). On the other hand, flexoelectricity is predicted to stabilize blue plases Alexander and Yeomans (2007); Castles et al. (2010) and is known to influence director profiles in nematic cells Barbero, G. and Durand, G. (1986); Barbero et al. (1999); Liu et al. (2018), colloidal transport Tatarkova et al. (2007), and flow Wiant et al. (2005); Pieranski and Godinho (2019). The joint phenomenon in these works is that the anisotropic dielectric interaction of electric charge or flexoelectric polarisation in a nematic directly competes with other aligning mechanisms of nematics, such as the nematic elasticity and the surface anchoring.
In this paper, we show the possible control and tuning of nematic surface ordering, beyond standard surface anchoring, using surface charge, bulk ionic inclusions and flexoelectricity, as also affected by charge regulation. Using a simplified model, we obtain a better general understanding of how the surface charge, electrostatic screening by ions and flexoelectricity in combination with standard surface anchoring can lead to various effective surface anchoring regimes, as a result of various combined local torques, which are not only of different effective strengths, but also types. This work extends previous work on salt-induced surface anchoring Alexe-Ionescu et al. (1993); Nazarenko and Lavrentovich (1994); Nazarenko et al. (1999); Meister and Jérôme (1999); Kühnau et al. (1999); Ponti et al. (1999); Barbero and Evangelista (2000); Shah and Abbott (2001); Derfel and Felczak (2002); Barbero and Olivero (2002); Evangelista and Barbero (2006), by putting more emphasis on varying the salt concentration by e.g. doping the sample, which affects the anchoring via electrostatic screening and charge regulation, as was already experimentally observed in Ref. Bungabong et al. (2010). Finally, the work is a contribution towards establishing electrostatic effects -charge, ions, flexoelectrictiy- as an interesting control mechanism for (self) assembly and even topology in general nematic complex soft matter.
This paper is organised as follows. In Sec. II we outline the theoretical framework that we will use. In Sec. III we discuss the control of anchoring by surface charge and salt, and discuss the influence of the various parameters, while in Sec. IV we highlight the effect of charge regulation. In Sec. V, we show how flexoelectricity influences the anchoring and in Sec. VI we finish with conclusions and an outlook.
II Theory
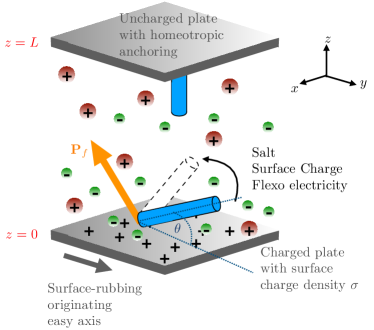
The design of effective surface anchoring is demonstrated in the geometry of standard (hybrid aligned nematic - HAN) nematic cells, as shown in Fig. 1. This simple geometry is chosen for clearness of the effects, but the demonstrated phenomena could be applied in principle in any nematic cell geometry, nematic emulsions, or nematic colloids, performing as a major novel control mechanism in these systems. Specifically, we consider a single charged plate with charge density at , separated from an uncharged plate situated at , both with surface area . Between the two plates, a nematic material is present which is characterised by the dielectric tensor , where is the dielectric constant perpendicular to the director field , and is the dielectric anisotropy. For the upper plate we assume strong homeotropic anchoring conditions, while for the bottom plate weak planar non-degenerate anchoring is assumed with the easy axis parallel to the plate. This cell geometry allows us to parametrise the nematic director as .
The nematic fluid with dispersed ions and emergent flexoelectricity can be described at the continuum mesoscopic level by a total free energy which is a combination of various free energy contributions: nematic elasticity, surface anchoring, (ideal-gas) entropy of ions in nematic, and the electrostatic energy. Therefore, the free energy is written as,
| (1) |
where the liquid-crystal part is described by the Oseen-Frank elastic free energy Oseen (1933); Frank (1958) within the equal-constant approximation and the anchoring is described by the Rapini-Papoular surface free energy Rapini and Papoular (1969),
| (2) |
where is the elastic constant of the nematic, is the anchoring strength and the prime ′ indicates differentiation with respect to . In the nematic, ions are dissolved with number density , and they give an (ideal-gas) contribution to the free energy Barrat and Hansen (2003),
| (3) |
where is the thermal energy and the thermal volume. The electrostatic part couples and , and we will express this with the formulation of the free energy by using the electrostatic potential as a variational parameter,
| (4) |
Here, is the total (number) charge density, we rescaled the dielectric tensor using the rotationally averaged dielectric constant, , and is the isotropic Bjerrum length. In this geometry .
The flexoelectric polarisation is given by Barbero et al. (1986)
| (5) |
with and the splay and bend flexoelectric coefficient, and the elementary charge, such that is a number (bound) charge density with same dimensions as . To convert to charge densities given in [C m-3] one should simply multiply with . In this particular geometry, the flexoelectric polarisation is of the form
| (6) |
The equilibrium profile of the nematic is determined by the minimum of the total free-energy (Eq. 1), which is minimised according to electrostatic potential , nematic orientation (given by director angle ), and ion number densities . Firstly, minimisation with respect to the electrostatic potential , , gives the Poisson equation,
| (7) |
or rewritten in SI units , with the dielectric displacement. Moreover, notice that , which is the familiar electrostatic energy. This shows that we indeed used the correct (variational) free energy. The surface terms in the variation of the free energy with respect to the electrostatic potential give the electrostatic boundary conditions
| (8) |
and global charge neutrality condition
| (9) |
Secondly, minimisation of the total free energy with respect to the nematic orientation, , gives the nematic Euler-Lagrange equation for the nematic director
| (10) |
with and boundary conditions for the nematic as
| (11) |
where is the nematic surface extrapolation length De Gennes and Prost (1993).
Thirdly, minimisation of the total free energy with respect to , , gives the final Euler-Lagrange equation, where is the chemical potential of the reservoir (ions are treated grand canonically with fixed chemical potential, so total number of ions is not fixed), with reservoir salt concentration . We find the Boltzmann distribution
| (12) |
Combined with Eq. (7), this introduces the modified Poisson-Boltzmann equation, that now full incorporates not only bulk ions but also flexoelectricity (and naturally, the coupling to nematic director profiles via the dielectric tensor),
| (13) |
where we introduced the isotropic Debye screening length . Eqs. (8)-(13) form a closed set of equations which we solve numerically by using the finite-element software package COMSOL Multiphysics.
The following numerical parameters explained below will be used in numerical calculations, roughly corresponding to the standard liquid crystal 5CB at K (which is roughly K below the isotropic-nematic transition temperature). Dielectric permittivities are , , and the isotropic dielectric constant is Bogi and Faetti (2001), which gives . For the elastic constant we take the average between the splay and twist constant, N Bogi and Faetti (2001) and the thermal energy is J. Anchoring strengths are considered between J m-2 to J m-2, corresponding to strong-anchoring and weak-anchoring regimes, respectively Blinov et al. (1989), giving surface extrapolation lengths between m and m.
The values of the surface charge density in nematic solvents like 5CB are less well known. For silica in water can vary between nm-2 and nm-2; however, 5CB has a much smaller dielectric constant than water, so we expect lower surface charges. Similar dielectric (but isotropic) solvents reported surface charge densities between nm-2 and nm-2 for charged colloidal particles in cyclohexylbromide with dielectric constant van der Linden et al. (2015); Everts et al. (2016), so we will use these as order of magnitude estimates for . Finally, we vary the Debye screening length between m and m, based on estimated Debye screening lengths due to ionic impurities in some liquid crystals Thurston et al. (1984); Shah and Abbott (2001); Colpaert et al. (1996), or estimates of liquid crystals with doped ions Cognard (1984); Sprokel (1973, 1974); Bungabong et al. (2010). The nanometre regime could be accessible if special salts are synthesised that can dissolve in low-dielectric liquid crystalline solvents, or if water-based liquid crystal systems are used such as lyotropic or chromonic liquid crystals (although these systems might not have a significant dielectric anisotropy).
Finally, flexoelectric coefficients of 5CB are estimated to be of the order 1-10 pC m-1 Murthy et al. (1993), while also much higher values are currently obtained with special molecules, the so-called giant flexoelectricity with flexoelectric coefficient up to nC m-1 Harden et al. (2006). Note that in this geometry only the sum matters, because the component of the flexoelectric polarisation is projected out because of translational symmetry in the plane of the surfaces. In this work we will use the flexoelectric coefficients as tuning parameters and use the pC m-1 regime.
III Electric charge-controlled effective anchoring
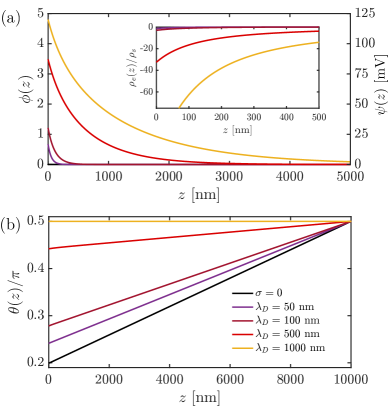
Electric (surface) charge introduced onto the bottom surface of the nematic cell () causes the development of an inhomogeneous electrostatic potential, and in turn the reorientation of the nematic director, as shown in Fig. 2. The electric potential close to the charged surface (at ) is large, and decreases with separation from the charged surface (increasing ); similarly, the net charge density in the diffuse screening cloud,
| (14) |
(see inset in Fig. 2(a)) shows that the charge in the screening cloud decreases with . In this geometry, this is not much different as it would occur in isotropic solvents.
The resulting director profiles are shown in Fig. 2(b), where the effect of increasing surface charge is shown. When (black line in Fig. 2), the director profile is linear,
| (15) |
with determined from the transcendental equation . For and since , the nematic director wants to align parallel to the electric field () due to the free-energy contribution , with the electric field, whereas the bottom plate has an easy axis that wants to align the nematic director perpendicular to this electric field (). These two opposing effects give rise to the director profiles in Fig. 2(b), where high charge densities push the director profiles towards the constant profile when electrostatic effects are much larger than the anchoring effects.
For sufficiently large , the director profile shows a generally linear behaviour even for , whereas the non-linear dependence on the scale of the profiles seems to be negligible. However, the non-linear part has a first derivative that cannot be necessarily neglected, and this is what mathematically drives the salt- and charge-induced anchoring transition via the boundary condition Eq. (11).
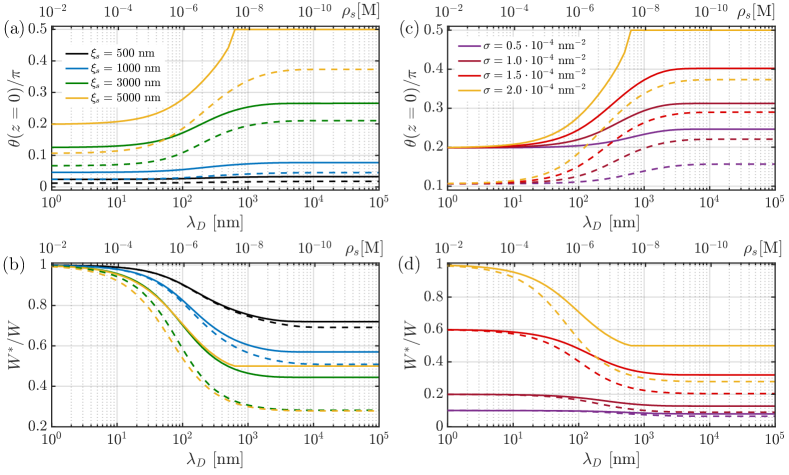
In Fig. 3 we investigate the effects of the bulk ion concentration (or equivalently ), on the director at the bottom plate . We show the dependency of the surface angle for various system sizes (dashed lines are taken at m, while full lines are taken at m), extrapolation lengths and charge density . For small compared to the system size, the anchoring strength is large, and this means that the value of the surface angle is always close to the easy-axis value (), as can be seen in Fig. 3(a), e.g. black lines. Conversely, if is large, electrostatics dominates and in a large parameter regime, see full yellow line in Fig. 3(a). If is, however, somewhere in between these two extremes, electrostatics can compete with the anchoring, and lies between and . What is even more striking is that the surface angle is quite strongly bulk ion (salt) concentration dependent, since tuning changes the orientation of the director on the bottom plate.
For the surface angle dependence, we see two asymptotes, one for low Debye screening length and one for high . For low , or equivalently high salt concentration , the bottom charged plate is highly screened by the ions and coincides with the value as if there is no surface charge on the bottom plate, see Eq. (15). The value of the asymptote depends on the ratio only. The low-screening asymptote, that occurs at low salt concentration and consequently large screening length, is most relevant when the screening length becomes of the order of the system size . In this case the effect of the electric field is largest and becomes closer to , and even when the anchoring is sufficiently weak, see, for example, the full yellow line in Fig. 3(a)-(b). Note, that while the non-electrostatic anchoring is weak, the homeotropic electrostatic anchoring is strong for these parameters, allowing for the control of the surface angle by the salt concentration.
The almost linear profiles (see Fig. 2(b)) allow us to define an effective anchoring strength in this geometry, given by the competition of the actual surface anchoring and the effect of (screened) surface charge. By mapping the case of non-vanishing and on the linear profile of Eq. (15), we find assuming that charge and salt renormalise the anchoring and not the easy-axis value, that
| (16) |
The ratio for varying is shown in Fig. 3(b). In line with Fig. 3(a) we see that an increase in , in other words, more towards homeotropic, results in a lowering of such that the planar anchoring is less favoured. When the bottom plate will have homeotropic alignment , we have that . For a larger system size (compare dashed with full lines), there is a larger variability of as function of , but this does not necessarily mean that the surface angle will have larger values, because is also determined by the value of .
Similar nematic behaviour arises upon varying the surface charge density , as shown in Fig. 3(c)-(d) for the same two different system sizes as in Figs. 3(a)-(b) (full and dashed lines). Again two asymptotes for the surface angle emerge as functions of the Debye screening length, where the high-screening asymptote is independent of the value of , whereas increasing does change the value of the low-screening asymptote. In Fig. 3(d) we see the equivalent formulation in terms of .
Nematic orientational ordering at the surface directly affects also the electric field at the surface. Indeed, for all regimes of surface nematic director shown in Fig. 3, the normal component of the electric field at the surface, given as
| (17) |
decreases for increasing , since increases. This could be considered as counterintuitive since one would expect that a larger magnitude of the electric field at the bottom plate’s surface would also reorient the director more parallel to the electric field, but in Fig. 3 we see the opposite. This shows that the value of the surface angle depends more on the ability of the electric field to distort the nematic from the zero- case sufficiently far from the plate, than the ability of the electric field to distort the nematic close to the bottom plate. This situation is reminiscent of the Fréedericksz transition Fréedericksz and Zolina (1933), where the electric coherence length that quantifies the ability of the electric field to overcome the elastic interactions, should be sufficiently large in order to have a transition in the nematic cell De Gennes and Prost (1993).
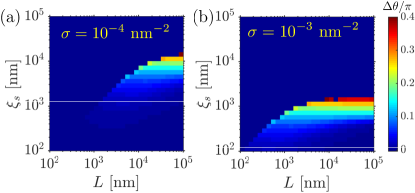
This leads us to the natural question: “For what parameter values of , and is the surface angle the most tuneable by varying the salt concentration?”. We attempt to answer this question by calculating the value of at the low-screening asymptote and to compare it with the value at nm, and consider their difference . We do not use the high-screening asymptote in this comparison since for some set of parameters, we find in the range of between 1 nm and . In these cases, the high-screening asymptote is only reached at low, unphysical values of , which are similar or smaller than the size of the molecular building blocks, and then our continuum theory breaks down.
We plot in Fig. 4 for varying and for two values of . We see that the surface angle is most tunable for (for the director would align in a completely homeotropic manner), and that the specific values of and for which it is tuneable depends on : for low this occurs at higher values of and than for high , for which the tendency to reorient towards a homeotropic alignment is larger. We conclude that for surface charges where the electrostatic homeotropic anchoring can compete with the non-electrostatic planar anchoring, we find possible tunability of the total anchoring by the salt concentration.
Finally, in this section, we assumed that the nematic dielectric anisotropy is positive, , so the director tends to lie parallel to the electric field. In the case where , the dielectric coupling between nematic director and electric field would prefer the director to align perpendicular to , and in this case would decrease with the Debye screening length . Such behaviour, for example, could be realised by using nematic materials like MBBA Meyerhofer (1975).
IV Charge-regulation effects on the anchoring-strength tunability
Realistic chargeable surfaces are not necessarily constant charge over the full range of salt concentrations what we have assumed in Sec. III. Therefore, charge regulation is of major interest in soft matter applications, from the charging behaviour of colloidal particles Heinen et al. (2014); van der Linden et al. (2015); Markovich et al. (2016); Trefalt et al. (2016); Hallett et al. (2018); Bakhshandeh et al. (2019), to the effect on interaction potentials Everts et al. (2017), to phase behaviour Leung et al. (2013); Everts et al. (2016), but it is also important in biological context. We use the Langmuir adsorption isotherms Ninham and Parsegian (1971) and consider two different systems that are characterised by the following chemical reactions,
| (18) | |||||
| (19) |
where is a neutral surface site that acquires its charge by adsorption of a cation (), and is a surface site that can positively charged by losing an anion (). The equilibrium constants for these reactions are given by , , denote surface coverages (fraction of sites occupied), and square brackets denote the concentration of the particular species. From a microscopic point of view equilibrium constants can be formulated in terms of a binding energy and a binding volume that accounts for all configurations that correspond to a chemical bond. Therefore, the values do not depend explicitly on surface coverages nor concentrations. Furthermore, recently it was shown within a minimal sticky hard-sphere model that the equilibrium constant of a surface group on a chargeable surface does not equal the equilibrium constant of the same functional group in single molecules, see for details Ref. Bakhshandeh et al. (2019).
We derive expressions for the surface charge density of both chemical reactions,
| (20) | |||
| (21) |
Here we used that the total number of sites is conserved, and that the concentrations can be expressed as and . Furthermore, is the surface number density of chargeable sites. Eqs. (20) and (21) will be used in boundary condition Eq. (8), rather than choosing a fixed value of . We note that these expressions can also be obtained by adding an appropriate surface free energy to the total free energy Everts et al. (2017). These two reactions behave differently as function of salt concentration and hence of . Surfaces with reaction CRa discharge for increasing (decreasing ). The maximal surface charge density equals . In contrast, surfaces with reaction CRd acquire a higher surface charge for increasing . In this case and for our choice of parameters, we find since in this confined geometry a Donnan potential is generated at high .
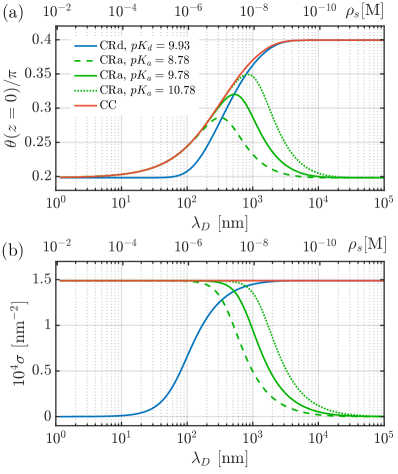
In Fig. 5 we compare the CRd and CRa case with the constant-charge (CC) case. We chose parameters such that the plot highlights the differences best. We choose values of and such that the CR cases saturate at , for CRd at high , and for CRa at low . For CRd we took nm-2, but the precise value is not so relevant as it is for the CRa case. For the CC case we took . In Fig. 5(b) we plot as function of , showing the charging/discharging differences between the CRa and CRd cases.
When compared to the CC case, we see that reaction CRd reaches its high-screening asymptote at a higher value of than the CC case, see Fig. 5(a). The reason is that the surface charge is lower at these salt concentrations, see Fig. 5(b), because of charge regulation. The low-screening asymptote coincides with that of the CC case by construction. Hence, the tunability range at the same for CRd is smaller than for CC and the value of tunes the value of .
On the other hand, for this set of parameters we see that CRa gives a non-monotonous behaviour for as function of . This non-monotonous behaviour emerges because of two opposing effects. Firstly, decreases for increasing , and secondly, when increases the charge becomes more important to reorient the director towards . When reaches the curve follows the CC curve with the same value of as the of the CRd case. The value of is set by rather than the value of (in contrast with the CRd case). instead sets the value of at which the plate starts to discharge for increasing . This means that we can shift the maximum of as function of by tuning (compare the green lines in Fig. 5(a)). For 5CB the most interesting range is to have tunable in the 100 nm-1 m regime, these are Debye screening lengths that are still reachable by doping 5CB, and it is easier to dope than to deionise a liquid crystal.
Finally, we note that the two reaction mechanisms CRa and CRd give so remarkably different anchoring behaviour that by measuring the director orientation one can learn something of the reaction mechanism on how a general surface becomes charged. This is a valuable observation because for some surfaces the charging process is not known in detail and one has to hypothesise which chemical reactions are relevant for the surface charging. For example, our results suggest that the planar to homeotropic transition observed in Ref. Bungabong et al. (2010) is of the CRa type.
V Flexoelectricity-driven anchoring control
Flexoelectricity is another electrostatic mechanism for controlling the effective surface anchoring, as an alternative or as an addition to the surface alignment control by the surface charge. Because of the geometric constraints in the nematic cell under consideration, we can tune the strength of the flexoelectricity by a single parameter , allowing us to access different material regimes. In contrast to just having a surface charge, flexoelectricity results in a bound space-charge density to which the ions can couple.
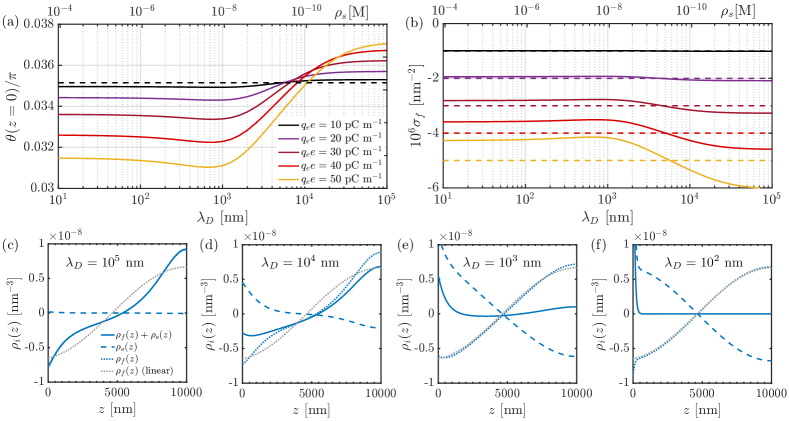
Flexoelectricity-driven control of surface ordering is shown in Fig. 6. In Fig. 6(a), the nematic director surface angle is shown for different screening lengths , and we see that upon increasing , initially decreases, and then increases when exceeds nm. This effect is rather weak even for high flexoelectric coefficients, with the change in the director angle of the order of , and is also independent of the sign of , because the EL equations have an internal symmetry for . Therefore, this phenomenon is only of theoretical interest. The dashed black line in Fig. 6(a) shows the case where and , and corresponds to the linear profile as given by Eq. (15).
In order to understand this small, non-monotonous, non-linear behaviour upon varying , we consider the flexoelectric surface bound charge density on the bottom plate, given by , with an outward-pointing unit normal, such that
| (22) |
In Fig. 6(b), we plot for various values of . The dashed lines indicate the situation where we take the linear profile of Eq. (15) and put it in Eq. (22). This can be interpreted as if the presence of flexoelectricity would not perturb the director profile, but still generate a flexoelectric polarisation since there is a director gradient. We see that follows the same trend as as function of salt concentration: when is high (more negative) is also larger and vice versa.
What is surprising is that at the no-salt limit (high ) is higher than the unperturbed state, the system prefers to have a surface flexoelectric polarisation. This can be rationalised when we also consider the bulk, where a flexoelectric polarisation (volume) charge density is generated, given by
| (23) |
In the low-screening limit we plot in Fig. 6(c), and in dotted grey we plot the situation when the director profile would not be perturbed. The salt concentration is negligible. We see that close to the bottom plate, a higher (more negative) is found compared to the unperturbed state (compare full blue with dotted grey line), and the same happens close to the top plate, albeit the top plate has no surface flexoelectric polarisation due to the strong homeotropic boundary conditions. The cost of having a flexoelectric polarisation charge density close to the top and bottom plate is compensated by the fact that in the middle of the cell is reduced compared to the unperturbed state. The region where it is reduced is larger than the region where is enhanced. Reducing in the middle of the cell at the expense of increasing it close to the plates cannot happen indefinitely because this would also cost more elastic energy.
When salt is added we see that a diffuse screening cloud is formed with charge density as given by Eq. (14), see the dashed lines in Fig. 6(d), that is positively charged close to the bottom plate and switches sign roughly in the other half of the nematic cell. This diffuse ion cloud effectively screens the flexoelectric polarisation charge (blue dotted line), and is doing this the most effectively near the bottom and the top plate (compare blue full line with dotted blue line). This causes to reduce (becoming less negative), and this ultimately also enhances in the middle of the plate, whereas close to the plates becomes close to the unperturbed state (compare dotted blue with dotted grey in Fig. 6(e)). The bulk is then almost effectively screened, until it is completely screened as we can see in the full blue line in Fig. 6(f)). However, there is not enough salt to completely screen the surface, as is seen from close to the bottom plate. This allows to become more negative again upon adding salt (decreasing ).
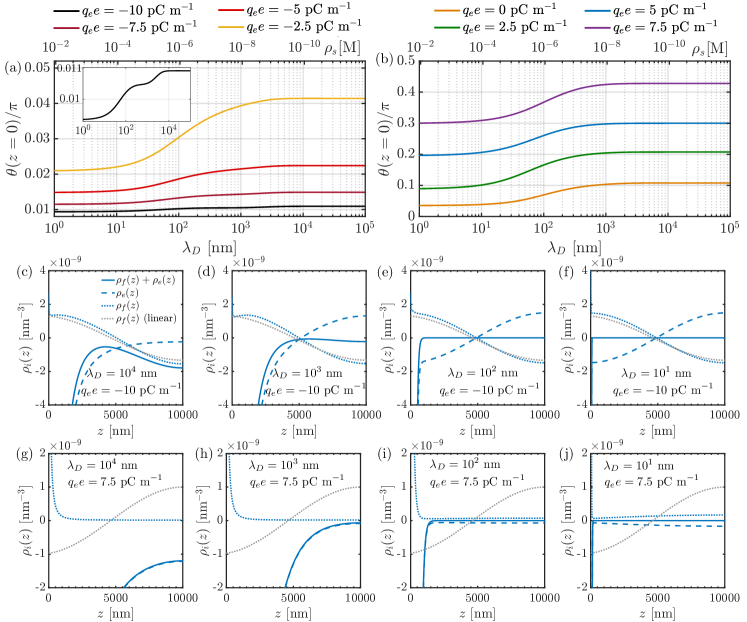
When there is a free surface charge the symmetry is lost, and we have to consider and separately. In Fig. 7(a) we show the effects of ions on in a nematic liquid crystal with negative flexoelectric coefficient. First of all, we see that a more negative destabilises the homeotropically aligned surface state for and . This is in accordance with the surface free energy analysis of Ref. Alexe-Ionescu et al. (1993). Secondly, for varying salt concentration, we observe that a more negative reduces the high-screening asymptote and reduces the tunability range of the surface angle. However, the profile of the most negative shows the most interesting characteristics for , revealing three plateaus as function of of theoretical interest. For all values of the value of is similar to the unperturbed state (Fig. 7(c)-(f)) compared to the case where where this only occurs for sufficiently high (Figs. 6(e)-(f)). At high there is not enough salt available to screen , so the available salt screens the free surface charge on the bottom plate while only partially screening in the bulk, see Fig. 7(c), compare full blue line with dotted blue line. Upon lowering , the ions are able to screen in the bulk. When this occurs, increasing only leads to more screening of which lowers the surface angle, but because of the negative value of , the value of the low-screening asymptote is lower than that of the case where .
For , we see that increasing results in an overall higher value of the surface angle, again in accordance with the analysis of Ref. Alexe-Ionescu et al. (1993), and a larger tunability of this quantity, see Fig. 7(b), compared to the unperturbed state. This enhancement towards homeotropic anchoring is accompanied by a that is not so sensitive to the value of unless is very small, see Fig. 7(g)-(i), and it is very different than the of the unperturbed state, with even a different sign close to the bottom plate. For this configuration it seems to be more energetically favourable to have no bulk flexoelectric polarisation, only close to the bottom plate, and having a positive allows for this. Increasing (lowering ) enhances the screening of the bottom plate and hence reduces the surface angle. There is also a flexoelectric surface charge density, which in the full range of is of the order of nm-2 and is therefore too low to compete with the free surface charge already present on the plate. These examples highlight the complex interplay when flexoelectricity is added, because it couples in a nontrivial way with (ion) electrostatics and the director profile.
VI Conclusions and outlook
In this paper, we have investigated the effects of surface charge, ion (salt) bulk concentration and flexoelectricity on the effective alignment of a nematic fluid at a surface. We have investigated the specific case of a plate that enforces planar anchoring that competes with the homeotropic alignment due to the effects of surface charge. We have found that electrostatic screening can tune the electrostatic part of the alignment, in other words, by adding salt one can effectively tune the anchoring strength of a surface. The tunability is largest when the electrostatic anchoring is large enough to compete with the non-electrostatic anchoring. We have highlighted the role of the various parameters, such as bare anchoring strength, system size, surface charge and salt concentration, and their interplay.
Besides discussing surfaces that have a constant surface charge independent of the salt concentration, we have also considered charge-regulating surfaces that acquire their surface charge by ad- or desorption of ions. This directly influences the tunability of the orientation of the director at the surface, and in particular, the dependence on the salt concentration is different if the charging occurs via a dissociative or an associative process. Namely, for an associative charging, surfaces discharge upon decreasing the salt concentration, while dissociative charging leads to surfaces discharging with increasing the salt concentration. This shows that measuring the director tunability can reveal information on the surface chemistry and the charging properties of external surfaces.
Furthermore, we have considered flexoelectric effects on the alignment of the director at an external surface. We found that even in the absence of surface charges the director is tunable by the salt concentration; however, the variability of the director orientation is very small. When a free surface charge is added, we found that negative flexoelectric coefficients reduce the tunability of the director orientation at the surface, and makes the orientation more planar. In contrast, positive flexoelectric coefficients enhance the tunability and promote more homeotropic alignment for the full range of salt concentrations.
Our findings have clear relevance in various fluids with nematic orientational order, most evidently in nematic fluids, as charges and ionic impurities are regularly present in such materials. We show the surface ordering in the context of an idealised flat-plate geometry, where only specific elastic and flexoelectric modes can be excited; however, more complex systems and geometries would respond in a similar manner, offering very interesting advanced routes for the microscopic design of even more complex electric charge and electric potential profiles. Nevertheless, it would be appealing to also consider theoretically the inclusion of more elastic and flexoelectric modes, as well as going beyond the treatment of the effective Rapini-Papoular surface free energy that is used in this work, e.g. by using simulations. Finally, we envisage that the geometries with colloidal particles in nematics are interesting because ions could influence the anchoring strength depending on the exact configuration of particles. We hope that our paper will stimulate experimental and theoretical work on ion-doped liquid crystals, rather than viewing ions as an impurity, with a special emphasis on controlling the salt concentration in the nematic host.
Acknowledgements
J. C. E. acknowledges financial support from the European Union’s Horizon 2020 programme under the Marie Skłodowska-Curie grant agreement No. 795377. M. R. acknowledges financial support from the Slovenian Research Agency ARRS under contracts P1-0099, L1-8135 and J1-1697. The authors acknowledge I. Smalyukh and S. Čopar for fruitful discussions. Finally, the authors would like to thank the Isaac Newton Institute for Mathematical Sciences for support and hospitality during the programme [The Mathematical Design of New Materials] when part of this work on this paper was undertaken. This work was supported by: EPSRC grant number EP/R014604/1.
References
- Jerome (1991) B. Jerome, Rep. Prog. Phys. 54, 391 (1991).
- De Gennes and Prost (1993) P.-G. De Gennes and J. Prost, The physics of liquid crystals, Vol. 83 (Oxford University Press, 1993).
- Stark (2001) H. Stark, Phys. Rep 351, 387 (2001).
- Crawford et al. (1993) G. P. Crawford, R. Ondris-Crawford, S. Žumer, and J. W. Doane, Phys. Rev. Lett. 70, 1838 (1993).
- Fournier, J.-B. and Galatola, P. (2005) Fournier, J.-B. and Galatola, P., Europhys. Lett. 72, 403 (2005).
- Patel and Yokoyama (1993) J. Patel and H. Yokoyama, Nature 362, 525 (1993).
- Jagemalm and Komitov (1997) P. Jagemalm and L. Komitov, Liq. Crys. 23, 1 (1997).
- McCamley et al. (2007) M. K. McCamley, G. P. Crawford, M. Ravnik, S. Žumer, A. W. Artenstein, and S. M. Opal, App. Phys. Lett. 91, 141916 (2007).
- Poulin and Weitz (1998) P. Poulin and D. A. Weitz, Phys. Rev. E 57, 626 (1998).
- Batista et al. (2015) V. M. O. Batista, M. L. Blow, and M. M. Telo da Gama, Soft Matter 11, 4674 (2015).
- Wu et al. (2017) K.-T. Wu, J. B. Hishamunda, D. T. N. Chen, S. J. DeCamp, Y.-W. Chang, A. Fernández-Nieves, S. Fraden, and Z. Dogic, Science 355 (2017), 10.1126/science.aal1979.
- Duclos et al. (2018) G. Duclos, C. Blanch-Mercader, V. Yashunsky, G. Salbreux, J.-F. Joanny, J. Prost, and P. Silberzan, Nature Phys. 14, 728 (2018).
- Sawada et al. (1999) A. Sawada, K. Tarumi, and S. Naemura, Jpn. J. Appl. Phys 38, 1418 (1999).
- Meyer (1969) R. B. Meyer, Phys. Rev. Lett. 22, 918 (1969).
- Thurston (1984) R. N. Thurston, J. Appl. Phys. 55, 4154 (1984).
- Mundoor et al. (2019) H. Mundoor, B. Senyuk, M. Almansouri, S. Park, B. Fleury, and I. I. Smalyukh, Sci. Adv. 5 (2019), 10.1126/sciadv.aax4257.
- Mundoor et al. (2016) H. Mundoor, B. Senyuk, and I. I. Smalyukh, Science 352, 69 (2016).
- Mukherjee et al. (2005) P. K. Mukherjee, J. P. F. Lagerwall, and F. Giesselmann, Liq. Cryst. 32, 1301 (2005).
- Poddar et al. (2017) A. Poddar, J. Dhar, and S. Chakraborty, Phys. Rev. E 96, 013114 (2017).
- Alexander and Yeomans (2007) G. P. Alexander and J. M. Yeomans, Phys. Rev. Lett. 99, 067801 (2007).
- Castles et al. (2010) F. Castles, S. M. Morris, E. M. Terentjev, and H. J. Coles, Phys. Rev. Lett. 104, 157801 (2010).
- Barbero, G. and Durand, G. (1986) Barbero, G. and Durand, G., J. Phys. France 47, 2129 (1986).
- Barbero et al. (1999) G. Barbero, G. Skačej, A. L. Alexe-Ionescu, and S. Žumer, Phys. Rev. E 60, 628 (1999).
- Liu et al. (2018) H.-H. Liu, Y.-J. Zhang, H.-R. Yue, L.-Z. Zhu, and R.-X. Yang, Chin. Phys. Lett. 35, 026103 (2018).
- Tatarkova et al. (2007) S. A. Tatarkova, D. R. Burnham, A. K. Kirby, G. D. Love, and E. M. Terentjev, Phys. Rev. Lett. 98, 157801 (2007).
- Wiant et al. (2005) D. Wiant, J. T. Gleeson, N. Éber, K. Fodor-Csorba, A. Jákli, and T. Tóth-Katona, Phys. Rev. E 72, 041712 (2005).
- Pieranski and Godinho (2019) P. Pieranski and M. H. Godinho, Eur. Phys. J. E 42, 69 (2019).
- Alexe-Ionescu et al. (1993) A. L. Alexe-Ionescu, G. Barbero, and A. G. Petrov, Phys. Rev. E 48, R1631 (1993).
- Nazarenko and Lavrentovich (1994) V. G. Nazarenko and O. D. Lavrentovich, Phys. Rev. E 49, R990 (1994).
- Nazarenko et al. (1999) V. G. Nazarenko, V. M. Pergamenshchik, O. V. Koval’chuk, A. B. Nych, and B. I. Lev, Phys. Rev. E 60, 5580 (1999).
- Meister and Jérôme (1999) R. Meister and B. Jérôme, J. Appl. Phys. 86, 2473 (1999).
- Kühnau et al. (1999) U. Kühnau, A. G. Petrov, G. Klose, and H. Schmiedel, Phys. Rev. E 59, 578 (1999).
- Ponti et al. (1999) S. Ponti, P. Ziherl, C. Ferrero, and S. Zumer, Liq. Cryst. 26, 1171 (1999).
- Barbero and Evangelista (2000) G. Barbero and L. R. Evangelista, An elementary course on the continuum theory for nematic liquid crystals, Vol. 3 (World Scientific Publishing Company, 2000).
- Shah and Abbott (2001) R. R. Shah and N. L. Abbott, J. Phys. Chem. B 105, 4936 (2001).
- Derfel and Felczak (2002) G. Derfel and M. Felczak, Liq. Cryst. 29, 889 (2002).
- Barbero and Olivero (2002) G. Barbero and D. Olivero, Phys. Rev. E 65, 031701 (2002).
- Evangelista and Barbero (2006) L. R. Evangelista and G. Barbero, Liq. Cryst. 33, 1 (2006).
- Bungabong et al. (2010) M. L. Bungabong, P. B. Ong, and K.-L. Yang, Sen. Act. B: Chem. 148, 420 (2010).
- Oseen (1933) C. W. Oseen, Trans. Faraday Soc. 29, 883 (1933).
- Frank (1958) F. C. Frank, Discuss. Faraday Soc. 25, 19 (1958).
- Rapini and Papoular (1969) A. Rapini and M. Papoular, J. Phys. Colloques 30, C4 (1969).
- Barrat and Hansen (2003) J.-L. Barrat and J.-P. Hansen, Basic concepts for simple and complex liquids (Cambridge University Press, 2003).
- Barbero et al. (1986) G. Barbero, I. Dozov, J. F. Palierne, and G. Durand, Phys. Rev. Lett. 56, 2056 (1986).
- Bogi and Faetti (2001) A. Bogi and S. Faetti, Liq. Crys. 28, 729 (2001).
- Blinov et al. (1989) L. M. Blinov, A. Y. Kabayenkov, and A. A. Sonin, Liq. Crys. 5, 645 (1989).
- van der Linden et al. (2015) M. N. van der Linden, J. C. P. Stiefelhagen, G. Heessels-Gürboğa, J. E. S. van der Hoeven, N. A. Elbers, M. Dijkstra, and A. van Blaaderen, Langmuir 31, 65 (2015).
- Everts et al. (2016) J. C. Everts, M. N. van der Linden, A. van Blaaderen, and R. van Roij, Soft Matter 12, 6610 (2016).
- Thurston et al. (1984) R. N. Thurston, J. Cheng, R. B. Meyer, and G. D. Boyd, J. Appl. Phys 56, 263 (1984).
- Colpaert et al. (1996) C. Colpaert, B. Maximus, and A. D. Meyere, Liq. Crys. 21, 133 (1996).
- Cognard (1984) J. Cognard, J. Elec. Chem. Int. Elec. 160, 305 (1984).
- Sprokel (1973) G. J. Sprokel, Mol. Crys. Liq. Crys. 22, 249 (1973).
- Sprokel (1974) G. J. Sprokel, Mol. Crys. Liq. Crys. 26, 45 (1974).
- Murthy et al. (1993) P. R. M. Murthy, V. A. Raghunathan, and N. V. Madhusudana, Liq. Crys. 14, 483 (1993).
- Harden et al. (2006) J. Harden, B. Mbanga, N. Éber, K. Fodor-Csorba, S. Sprunt, J. T. Gleeson, and A. Jákli, Phys. Rev. Lett. 97, 157802 (2006).
- Fréedericksz and Zolina (1933) V. Fréedericksz and V. Zolina, Trans. Faraday Soc. 29, 919 (1933).
- Meyerhofer (1975) D. Meyerhofer, J. Appl. Phys. 46, 5084 (1975).
- Heinen et al. (2014) M. Heinen, T. Palberg, and H. Löwen, J. Chem. Phys. 140, 124904 (2014).
- Markovich et al. (2016) T. Markovich, D. Andelman, and R. Podgornik, Eur. Phys. Lett. 113, 26004 (2016).
- Trefalt et al. (2016) G. Trefalt, S. H. Behrens, and M. Borkovec, Langmuir 32, 380 (2016).
- Hallett et al. (2018) J. E. Hallett, D. A. J. Gillespie, R. M. Richardson, and P. Bartlett, Soft Matter 14, 331 (2018).
- Bakhshandeh et al. (2019) A. Bakhshandeh, D. Frydel, A. Diehl, and Y. Levin, Phys. Rev. Lett. 123, 208004 (2019).
- Everts et al. (2017) J. C. Everts, S. Samin, N. A. Elbers, J. E. S. van der Hoeven, A. van Blaaderen, and R. van Roij, Phys. Chem. Chem. Phys. 19, 14345 (2017).
- Leung et al. (2013) C.-Y. Leung, L. C. Palmer, S. Kewalramani, B. Qiao, S. I. Stupp, M. Olvera de la Cruz, and M. J. Bedzyk, Proc. Nat. Ac. Sci. 110, 16309 (2013).
- Ninham and Parsegian (1971) B. W. Ninham and V. Parsegian, J. Theor. Biol. 31, 405 (1971).