Supplementary Information: Evidence of Lifshitz transition in thermoelectric power of ultrahigh mobility bilayer graphene
.1 1. Thermopower as a function of transverse electric field ()
Fig. S1(a) shows thermoelectric power (TEP) as a function of for different values of at 8 K. Increase in results in an increase in DOS near the band edges because of the opening of band gap. Therefore, the enhancement of TEP as a function of is associated with sharp changes in the band curvature at the band edges Wang et al. (2011).
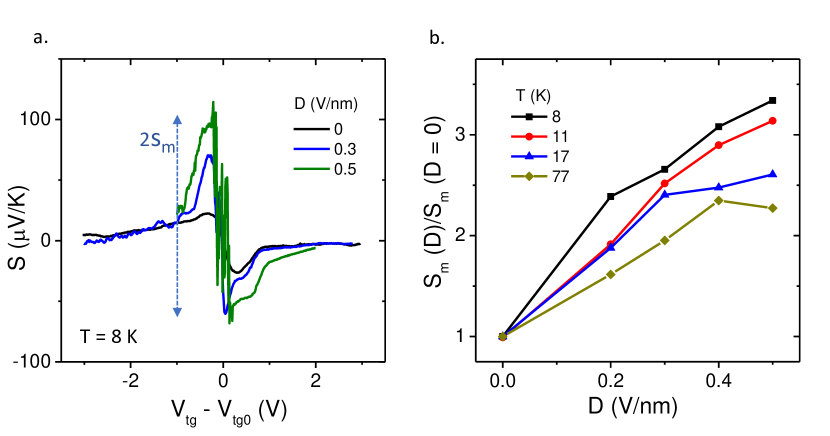
Fig. S1(b) shows the plot of as a function of . There is an enhancement of TEP by a factor of three upon increasing at 8 K (Fig. S1(b)). The enhancement factor reduces to (at 77 K) with the increase in temperature. Temperature-induced broadening reduces the relative increase of the factor in the Mott formula thereby resulting in overall reduction in the TEP enhancement Wang et al. (2011).
.2 2. Comparison of TEP with conductance measurements
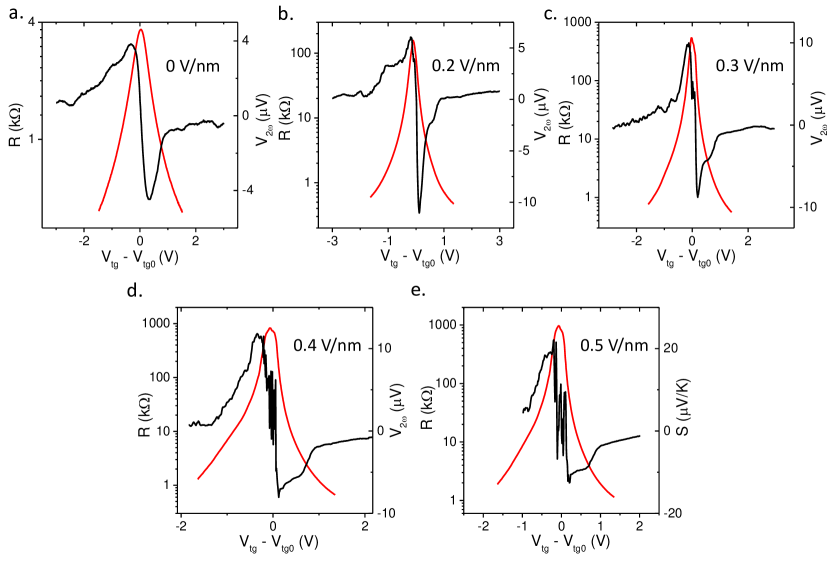
Fig. S2 shows the TEP measurements at various values of along with resistance measurements. While TEP plateaus appear at characteristic number densities on either side of CNP, no corresponding features were observed in confirming TEP as a sensitive probe of DOS in comparison with conductance measurements.
.3 3. Sensitivity of density of states (DOS) to the complex strain parameter ()
The bandstructure and the DOS of BLG is very sensitive to the gauge parameter used in Eq. 2 (main text). is a complex parameter used to quantify the magnitude of strain in BLG Mucha-Kruczyński et al. (2011). is given by
| (1) |
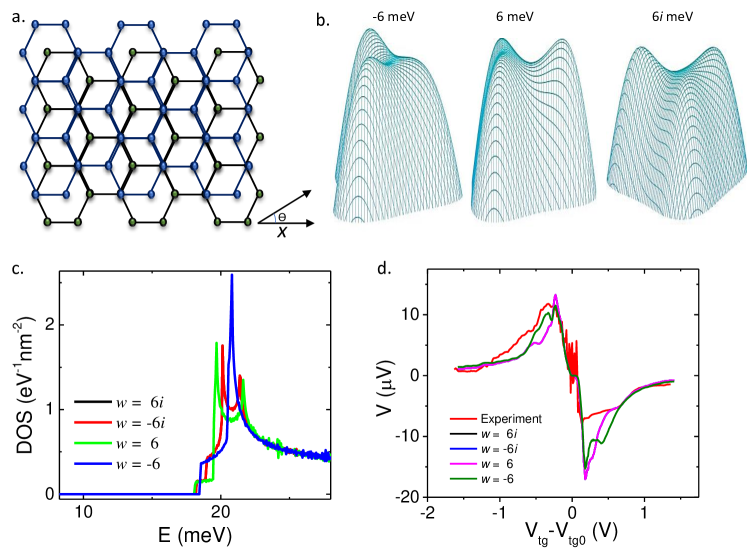
where, is the shift in the top layer with respect to the bottom layer due to the shear deformation, , is the change in interlayer and skew interlayer hopping terms with respect to change in the coupled carbon atom distances, and are the eigen values of strain tensor when a strain is applied with the principal axis at an angle from the coordinate axis (Fig S3(a)) Varlet et al. (2015).
Therefore is generally a complex number whose phase depends on the direction of principal axis and shear deformation. Therefore, the modified DOS of BLG not only depends on the magnitude of , it is very sensitive to the phase of complex parameter as well.
Fig. S3 (b) shows the bandstructure near the valance band edge for V/nm with meV and meV. Clearly, the type of distortion in bandstructure is dependent on . This is also reflected in the DOS (Fig. S3 (c)) where there are two van-Hove singularities for meV and meV whereas there is only one LT for meV. Fig. S3 (d) shows the fitting of Mott formula for V/nm with the inclusion of different values of . meV and meV seem to reproduce the plateau fairly well whereas meV does not replicate the plateau at the same number density.
.4 4. Mott fitting of TEP for V/nm and V/nm
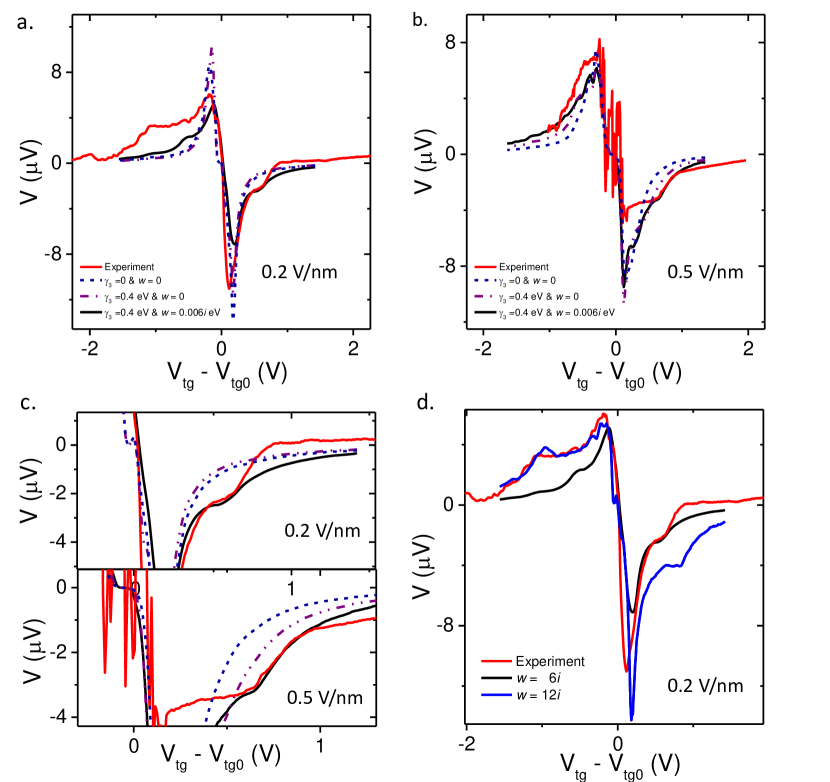
The analysis and fitting of Mott formula for V/nm and 0.5 V/nm is depicted in Fig. S4. The magnified plots (Fig. S4 (c)) show excellent reproduction of plateau on the electron doped region. The plateaus on the hole doped regime, however, are not replicated at the same density. The fitting of Mott formula with a higher value of (= 12 meV) seems to fit the plateau on the hole side perfectly (Fig. S4 (d) for V/nm). This electron-hole asymmetry in the value of could be because of strain inhomogeneities or the presence of perpendicular strain associated with the change in interlayer distance, which has not been incorporated in our calculations Verberck et al. (2012).
References
- Wang et al. (2011) C.-R. Wang, W.-S. Lu, L. Hao, W.-L. Lee, T.-K. Lee, F. Lin, I.-C. Cheng, and J.-Z. Chen, Phys. Rev. Lett. 107, 186602 (2011).
- Mucha-Kruczyński et al. (2011) M. Mucha-Kruczyński, I. L. Aleiner, and V. I. Fal’ko, Phys. Rev. B 84, 041404 (2011).
- Varlet et al. (2015) A. Varlet, M. Mucha-Kruczyński, D. Bischoff, P. Simonet, T. Taniguchi, K. Watanabe, V. Fal’ko, T. Ihn, and K. Ensslin, Synth. Met. 210, 19 (2015).
- Verberck et al. (2012) B. Verberck, B. Partoens, F. Peeters, and B. Trauzettel, Phys. Rev. B 85, 125403 (2012).