xGASS: The Role of Bulges Along and Across the Local Star-Forming Main Sequence
Abstract
We use our catalogue of structural decomposition measurements for the extended GALEX Arecibo SDSS Survey (xGASS) to study the role of bulges both along and across the galaxy star-forming main sequence (SFMS). We show that the slope in the – relation flattens by 0.1 dex per decade in when re-normalising by disc stellar mass instead of total stellar mass. However, recasting the – relation into the framework of only disc-specific quantities shows that a residual trend remains against disc stellar mass with equivalent slope and comparable scatter to that of the total galaxy relation. This suggests that the residual declining slope of the SFMS is intrinsic to the disc components of galaxies. We further investigate the distribution of bulge-to-total ratios () as a function of distance from the SFMS (). At all stellar masses, the average of local galaxies decreases monotonically with increasing . Contrary to previous works, we find that the upper-envelope of the SFMS is not dominated by objects with a significant bulge component. This rules out a scenario in which, in the local Universe, objects with increased star formation activity are simultaneously experiencing a significant bulge growth. We suggest that much of the discrepancies between different works studying the role of bulges originates from differences in the methodology of structurally decomposing galaxies.
1 Introduction
The observed correlation between a galaxy’s star formation rate (SFR) and stellar mass likely contains fundamental information from which we can begin to understand the evolution of galaxies over cosmic time (Brinchmann et al., 2004; Daddi et al., 2007; Rodighiero et al., 2010; Wuyts et al., 2011; Noeske et al., 2007). From this, the star-forming main sequence (SFMS) has become a powerful tool for understanding the origins of the distribution and evolution of galaxy properties throughout the Universe. The SFMS is commonly parameterised via a linear relation between and (i.e. a power law), with an observed scatter of dex (Speagle et al., 2014; Whitaker et al., 2015) and a slope ranging from 0.5 to 1.0 dex. Uncertainties in the slope arise predominantly from inconsistencies in individual calibrations (Pannella et al., 2009; Davies et al., 2016) and how “star-forming” galaxies are defined (Salim et al., 2007). The SFMS seems to hold over at least the last 10 Gyr (Elbaz et al., 2007; Peng et al., 2010; Whitaker et al., 2012; Whitaker et al., 2014; Popesso et al., 2019b) with a normalisation that is observed to increase at earlier epochs (Schreiber et al., 2015). This likely reflects the sharp decline in the cosmic star formation history by a factor of 10 since (Lilly et al., 1996; Madau et al., 1998; Hopkins & Beacom, 2006).
Many studies have shown that the – relation has a slope that is less than unity (e.g. Whitaker et al. 2014; Lee et al. 2015; Schreiber et al. 2015; Tomczak et al. 2016). This departure from unity is most notable when the SFMS is recast in terms of the ratio of current to current stellar mass, or specific (). This can be considered to be a galaxy’s fractional mass-growth rate or, its inverse, the galaxy build-up time. Given that the – relation is observed to have a range of negative slopes, this implies that not all galaxies form stars at a constant efficiency throughout their evolution and that a residual mass trend may hint at the possible physical process(es) responsible for the suppression of towards higher masses. This coincides with the term “downsizing”, which has often been used to describe the observation that more massive galaxies have formed earlier and at a faster rate (Neistein et al., 2006). Historically, the concept of is synonymous to the birthrate parameter (Kennicutt et al., 1994; Boselli et al., 2001), expressed as the ratio of the current to the average integrated over its lifetime. Early-type galaxies generally have a small birthrate parameter indicating that most of their stars have formed at an earlier epoch.
Furthermore, there is evidence to suggest that the – relation is not strictly a power law, but instead shows curvature in the high stellar mass () regime (Elbaz et al., 2011; Whitaker et al., 2014; Gavazzi et al., 2015; Lee et al., 2015; Schreiber et al., 2015; Popesso et al., 2019a). Such studies find a low mass power law of slope , which becomes shallower above a turnover mass that ranges from to , with evidence suggesting that this turnover mass may increase with redshift (Tomczak et al., 2016). However, other studies do not observe a mass-dependent slope (e.g. Rodighiero et al. 2014; Speagle et al. 2014). In addition to fitting a power law, the SFMS can also be defined by tracing the ridge along the locus of the star-forming galaxy distribution (Renzini & Peng, 2015).
A suggested explanation for the existence of a flattening in the SFMS has been attributed to the decreasing contribution of star-forming discs towards higher stellar masses. If it is assumed that the bulk of star formation occurs in the disc, then a flat, linear relation in the star-forming main sequence could remain if one considers the disc mass alone (Guo et al., 2015). Abramson et al. (2014) show that by re-normalising the by the disc (instead of total) stellar mass (), one can account for dex of declining per decade of . They suggest that the discs maintain a constant if one correctly accounts for the mass present in passive bulges. However, this result has not been confirmed by other authors who show that a constant does not necessarily exist amongst discs considered independently (Guo et al., 2015; Whitaker et al., 2015; Schreiber et al., 2015; Morselli et al., 2017). Popesso et al. (2019a) suggest that, because the discs of high-mass galaxies are redder than their lower mass counterparts, the bending of the SFMS is instead due to the starvation of cold gas in a hot halo environment. As well as looking at the role of bulges in regulating the shape of the SFMS, many studies have also studied how the position of a galaxy across the SFMS relates to the growth of their central component. Morselli et al. (2017); Popesso et al. (2019a) find that the average of galaxies increases both above and below the SFMS and is suggested to correspond to a central enhancement of star formation activity observed in starburst galaxies (Morselli et al., 2019; Belfiore et al., 2018; Ellison et al., 2018). These observations have pointed towards a possible scenario in which star-forming galaxies may oscillate about the SFMS due to successive compaction events followed by depletion of their cold gas reservoirs (Zolotov et al., 2015; Tacchella et al., 2016).
We investigate the nature of these findings in this paper using the structural decomposition of the xGASS sample (Catinella et al., 2010, 2018). Although this sample only contains 1,200 galaxies, in the context of measuring structural parameters through modelling of galaxy light profiles, it is important to note that to achieve reliable measurements of galaxy structure, large number statistics alone is not sufficient. In Cook et al. (2019), we showed that informed model validation (beyond goodness-of-fit metrics) is necessary to consistently derive physically meaningful solutions for galaxy models. As we will show, this has important implications when understanding how morphology is linked to the evolution of galaxies.
This paper is organised as follows. In Section 2, we describe the sample used and the structural decomposition catalogue. Section 3 presents our results of analysing the role of structure along and across the SFMS, followed by an analysis of the implications of poorly fit models in Section 4. In Section 5, we discuss our results in regards to previous works and conclude in Section 6. All distance-dependent quantities are computed assuming , and km s-1 Mpc-1.
2 Sample and Summary of Data
The sample used throughout this paper is the extended GALEX Arecibo SDSS Survey (xGASS; Catinella et al. 2010, 2018). This survey contains 1179 galaxies selected only by redshift () and stellar mass ( ), and currently represents the deepest sample of cold gas observations for galaxies in the local Universe to date. In addition to these cold gas observations is a substantial amount of auxiliary data yielding optical and star formation properties across the full sample. The parent sample comes from the Sloan Digital Sky Survey (SDSS) DR6 (Adelman-McCarthy et al., 2008) for which SDSS spectroscopy and Galaxy Evolution Explorer (GALEX) Medium Imaging Survey (Martin et al., 2005) observations were available. The final sample was selected randomly such that a near flat distribution in stellar mass was achieved (see Catinella et al. 2018 for more details). Optical parameters (excluding those derived from model fitting) were taken from the SDSS DR7 (Abazajian et al., 2009) database whilst UV properties and star formation rates (SFR) are calculated by combining near-UV (NUV) photometry (from various GALEX catalogues) and mid-infrared (MIR) photometry from the Wide-field Infrared Survey Explorer (WISE, Wright et al. 2010) as detailed in Janowiecki et al. (2017). In the cases where unflagged measurements were not available in both NUV and MIR, SFRs were instead determined from the spectroscopic energy distribution fits in Wang et al. (2011).
In Cook et al. (2019), we present the accompanying catalogue of bulge-disc decompositions for the xGASS representative sample using SDSS , and -band imaging data. This catalogue aimed to robustly measure the morphological parameters of the bulges and discs of galaxies with a low level of spurious fits. We improved on previous bulge-disc decomposition catalogues with the combined usage of ProFit (Robotham et al., 2017) — a Bayesian two-dimensional galaxy photometric profile fitting code — with additional model filtering and constrained remodelling. Importantly, each galaxy was individually verified and wherever a poor fit was attained (e.g. due to galaxy interactions, prominent secondary features such as bars, etc.), the galaxy was remodelled with informed constraints to further discourage these issues from recurring. This was possible for a total of 1073 (91%) galaxies, a considerably larger fraction than would be the case without model validation. The resulting catalogue is far less contaminated by spurious model fits, which are commonplace amongst much larger samples. Whilst the additional need for constrained remodelling does not scale up to larger galaxy surveys, the added gain of minimising incorrectly modelled and/or misclassified galaxies exceeds the increased statistics one might depend upon to wash out any issues faced during the model fitting stages.
A key quantity derived from the model fitting is the bulge-to-total ratio (), expressed as the fraction of light (or otherwise, stellar mass) contained within the bulges of galaxies in a given band. A significant fraction of xGASS galaxies are best modelled as single-component systems, corresponding to for the 292 pure-disc galaxies and, conversely, for the 55 pure-bulge galaxies classified in the sample. Finally, stellar masses were determined using empirical recipes following Zibetti et al. (2009), where we have used -band flux measurements and () colours from the individual component profiles.
3 Results
3.1 Role of Bulges Along the Star-Forming Main Sequence
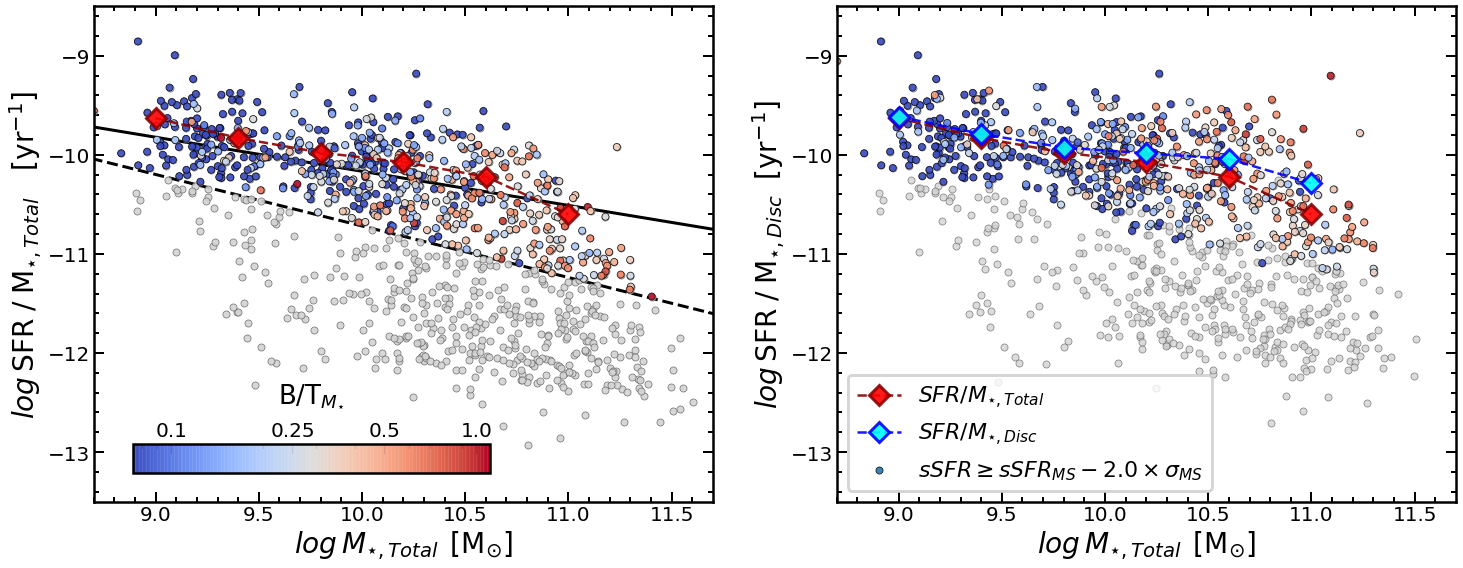
We begin by investigating the positions of galaxies along the plane to understand the origin of the residual dependence on mass in the slope of the SFMS. In particular, whether this can be explained by the morphological transition that occurs towards higher stellar masses, where bulges (themselves typically not star-forming) become increasingly predominant. The left panel of Figure 1 shows the – plane for all xGASS galaxies with the subset of star-forming galaxies shown as coloured points. Here, star-forming galaxies have been defined as those with a greater than 2 below the SFMS as defined in Catinella et al. (2018); see also Janowiecki et al. (2019). The xGASS SFMS is given by the following expression:
| (1) |
with a corresponding scatter () as a function of stellar mass given by:
| (2) |
which, for the range of stellar masses in xGASS, equates to a typical scatter in the SFMS of – dex; in agreement with many previous studies (Daddi et al., 2007; Speagle et al., 2014; Popesso et al., 2019a) at this redshift.
The right panel of Figure 1 shows instead the re-normalisation of the specific by the disc stellar mass, defined here as:
| (3) |
This quantity reflects the fractional mass-growth of the disc alone. Whilst there may be some contribution to the from a bulge or nuclear region, this is likely quite small. In both panels, star-forming galaxies are coloured according to their stellar mass bulge-to-total ratio, hence indicating by how much each galaxy will shift when plotted by its disc mass. Blue points — being pure-disc systems — do not move as, by definition, all of their mass is contained within their disc. The larger diamond points show the median for star-forming galaxies within each bin. There is indeed a slight flattening ( dex) of the relation above stellar masses of in transition from (red) to (blue), which is qualitatively in agreement with the results of Abramson et al. (2014). Below this mass, the two relations are nearly equivalent with a slightly declining slope, as this regime is occupied predominantly by disc-dominated galaxies.
The flattening of this relation seen at high could be explained by the removal of the contribution from (non-star-forming) bulges to the which increases with Abramson et al. 2014; Erfanianfar et al. 2016. Although we observe a slight difference in this work when removing the bulge components, it is not sufficient to completely eliminate a residual trend with the total stellar mass. Furthermore, the resulting vs. relation has a comparable scatter to the relation prior to being re-normalised. This is in contrast to the relations shown in Abramson et al. (2014) for which a dramatic increase in is observed. The underlying difference between these analyses is the different structural decomposition catalogues used between these works. Abramson et al. (2014) utilise the Simard et al. (2011) catalogue with fixed Sérsic indices for both the bulge () and disc () components. It has previously been shown that in many cases, this catalogue greatly overestimates the contribution of a bulge component (Meert et al., 2015; Cook et al., 2019). In Section 4, we illustrate this in more detail with reference to the catalogue of morphological measurements of Domínguez Sánchez et al. (2018) determined via a deep-learning algorithm trained upon visually-classified morphological types.
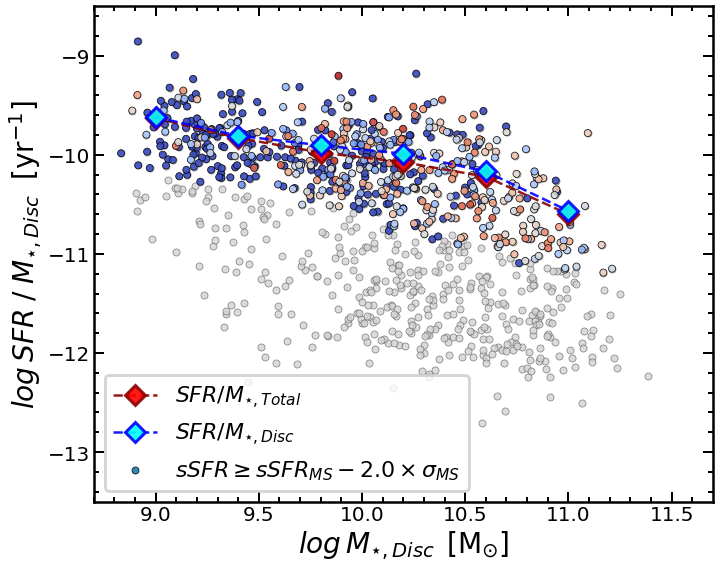
Simply re-normalising the by the disc mass does not necessarily identify whether the slope of the – relation approaches unity if viewed in the framework of discs alone. This is because in Figure 1 above, we are comparing a disc-normalised quantity () with the total stellar mass. For comparison, we also show the equivalent plot for the disc-normalised plotted against instead of (as is the case in e.g. Abramson et al. 2014). Here, galaxies do not simply move upwards on the axis as in Figure 1, but also towards lower stellar masses. Normalising both axes of this plot by their disc quantities appears to largely remove the flattening of the slope seen in Figure 1. This implies that there is a residual dependence of the SFMS on stellar mass even for discs taken independently. A slightly declining slope is also observed for galaxies taken as a whole because — particularly at — the majority of their stellar mass resides within a disc component. Indeed, this may explain why a down-bending is observed at high stellar masses with increasing prominence towards later epochs, where galaxies become increasingly dominated by passive bulges (Schreiber et al., 2015; Popesso et al., 2019a). Note that the xGASS sample does not probe enough galaxies in this regime to detect whether the slope is further mass-dependent at these higher stellar masses.
3.2 Distributions of sSFR across Stellar Mass
Much of the difference seen in the slope of the SFMS between different works likely originates from differences in the definition of “star-forming” galaxies. We obtain similar results when reproducing the analysis presented in the previous section with different approaches for defining a “star-forming” population (e.g. NUV colour; not shown). Note that the definition used in Figure 1 is fairly conservative. Placing the division lower might impact the extent of the separation between the and relations as a larger fraction of bulge-dominated galaxies will be included.
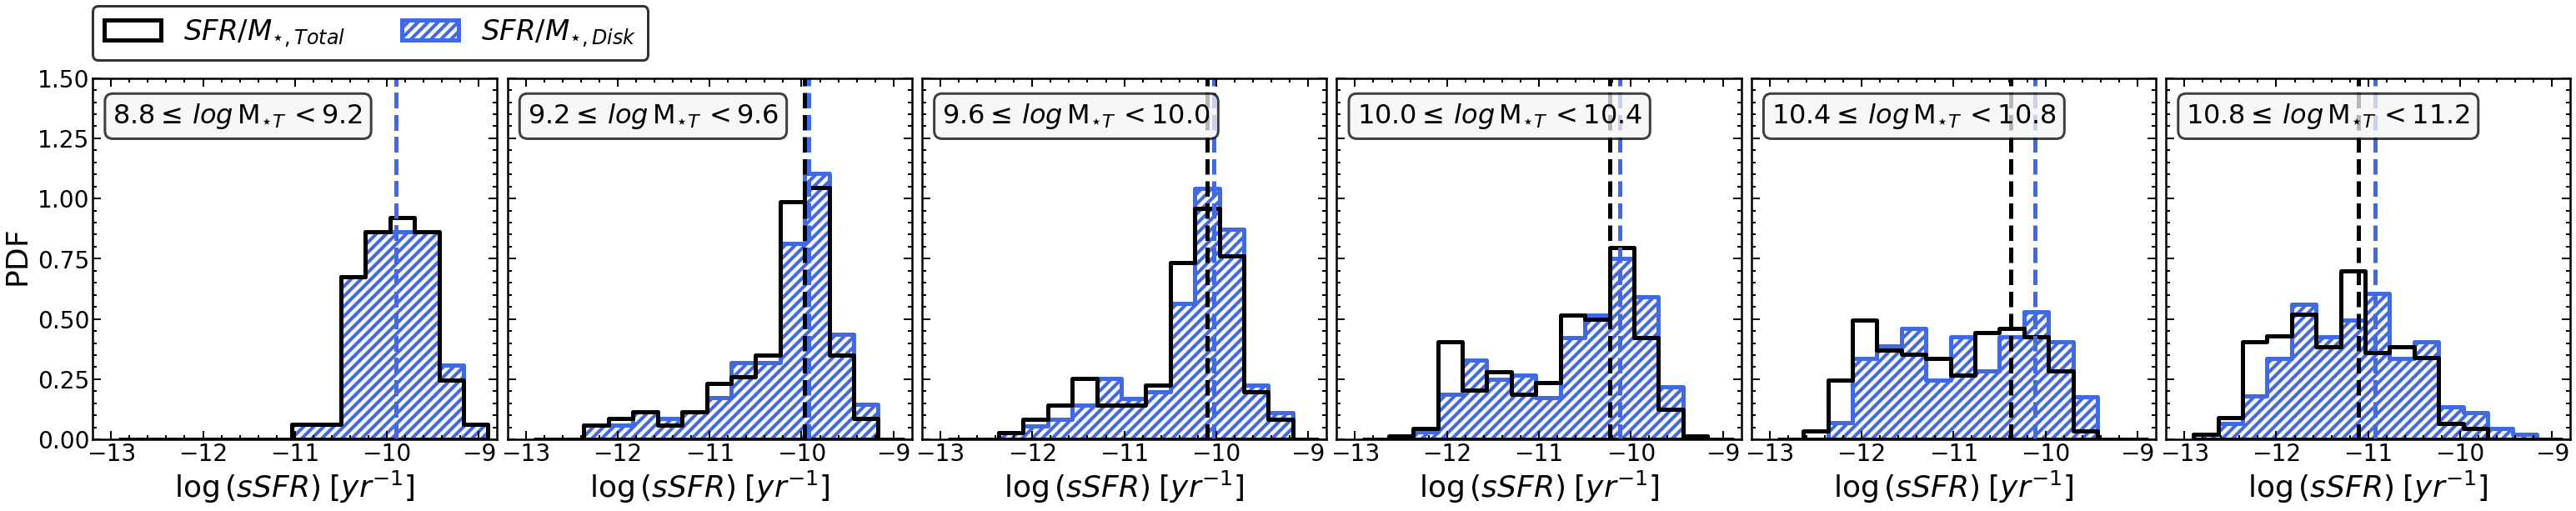
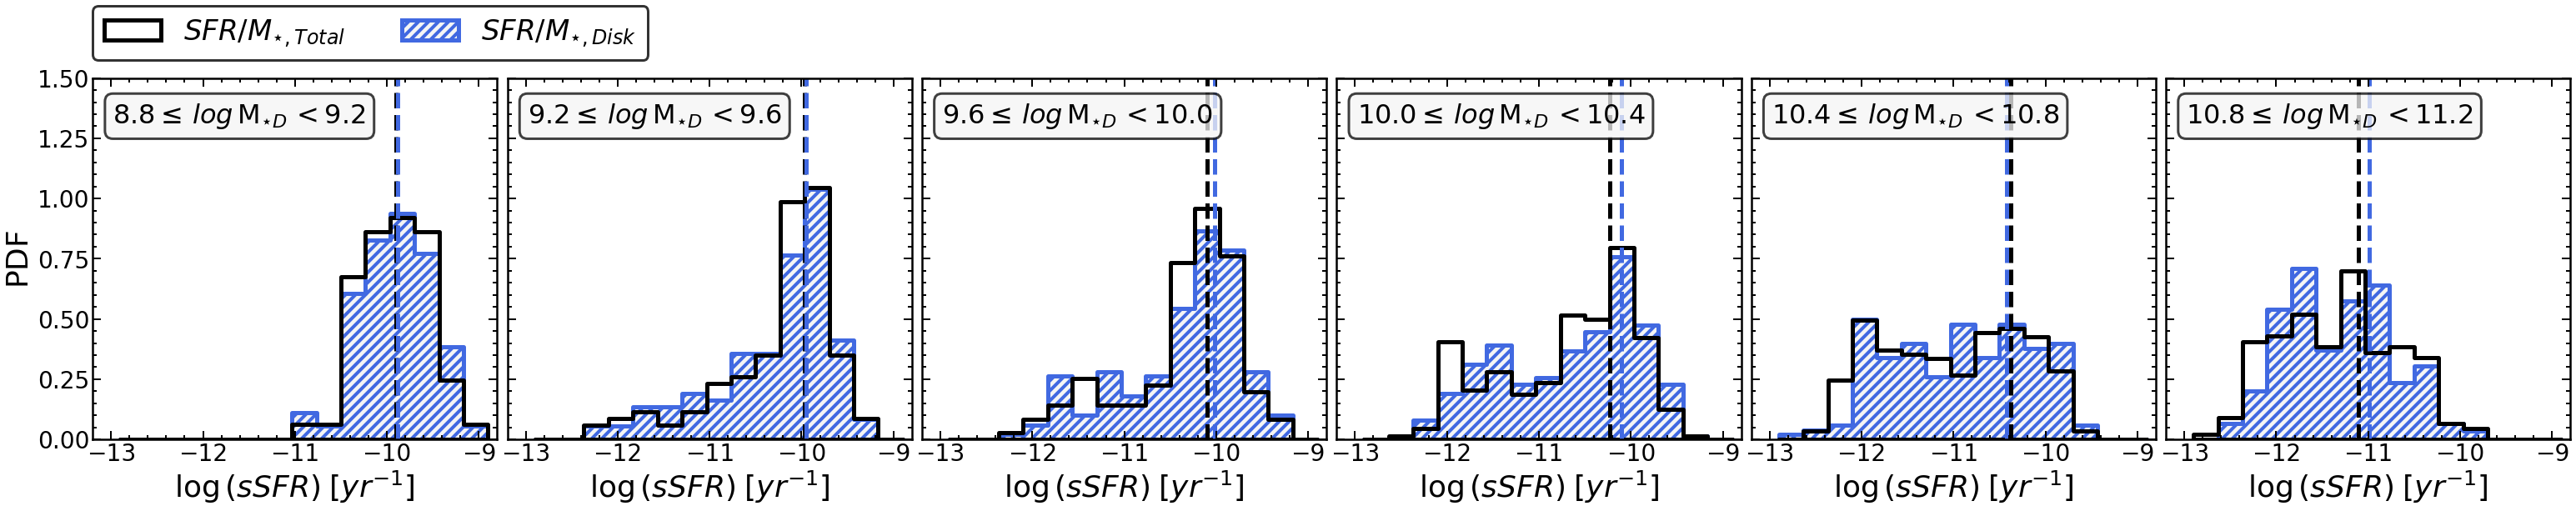
We attempt to illustrate whether this could have a significant effect on our results by studying the distributions of as a function of stellar mass. The – plane is first divided into wide bins in stellar mass within which we simultaneously fit Gaussians to both star-forming and passive populations (where present). This is in principle a simplified way of finding the ridge line connecting the peaks of number density along a 2D histogram of galaxies in the – plane as has recently been proposed by Renzini & Peng (2015). In this way, one obtains the loci of the SFMS across stellar mass independently of a particular cut in . Figure 3 shows the resulting probability density functions obtained when dividing galaxies in bins of for both (black) and (blue) in the top row. The distribution of is skewed slightly towards higher values with respect to , confirming that there is indeed an effect when isolating the disc. The peaks of the Gaussian models (vertical dashed lines) trace the SFMS across stellar mass showing a gradual decline at and a flattening above this. This difference is at the level of 0.1 dex, similar to that seen in Figure 1 and confirms that the presence of a bulge itself cannot entirely explain the negative residual slope in the – relation. Note that the SFMS becomes highly non-Gaussian towards the high mass end, thus the sharp decline of the SFMS peak at more likely reflects our inability to fit a suitable Gaussian model to the limited sample size of these data. As a comparison, in the bottom row of Figure 3, we replicate this analysis for the vs plane as shown in Figure 2 by instead binning across disc stellar mass. As before, we confirm that comparing galaxies at a fixed removes the differences seen in Figure 1. This shows that the self-similar aspect of discs observed in the previous analysis is not strongly dependent on how star-forming galaxies are selected.
3.3 Role of Bulges Across the Main Sequence
A common explanation for the observed slope of the SFMS is the change in morphology that occurs along it. However, one should not confuse this with the actual passage of individual galaxies within this plane. Rather, the SFRs of galaxies on the SFMS are regulated in a quasi-steady-state by the inflows and outflows of gas as well as stochastic events such as mergers and violent disc instabilities (Bouché et al., 2010; Daddi et al., 2010; Genzel et al., 2010; Davé et al., 2012; Lilly et al., 2013; Dekel & Mandelker, 2014; Tacchella et al., 2016). This has prompted many studies to investigate how various physical properties vary amongst galaxies located above and below the SFMS, including star formation efficiency, morphology, IR/UV ratio, dust temperature, cold gas content (e.g. Wuyts et al. 2011; Elbaz et al. 2011; Nordon et al. 2013; Saintonge et al. 2016). In particular, Morselli et al. (2017); Popesso et al. (2019a) observe that the average bulge-to-total ratio of galaxies across the main sequence appears to form a parabolic shape with the minimum locus sitting along the main sequence and the maximum in the passive population. They find intermediate bulge-to-total ratios for galaxies lying slightly below the SFMS as well as in its upper envelope.
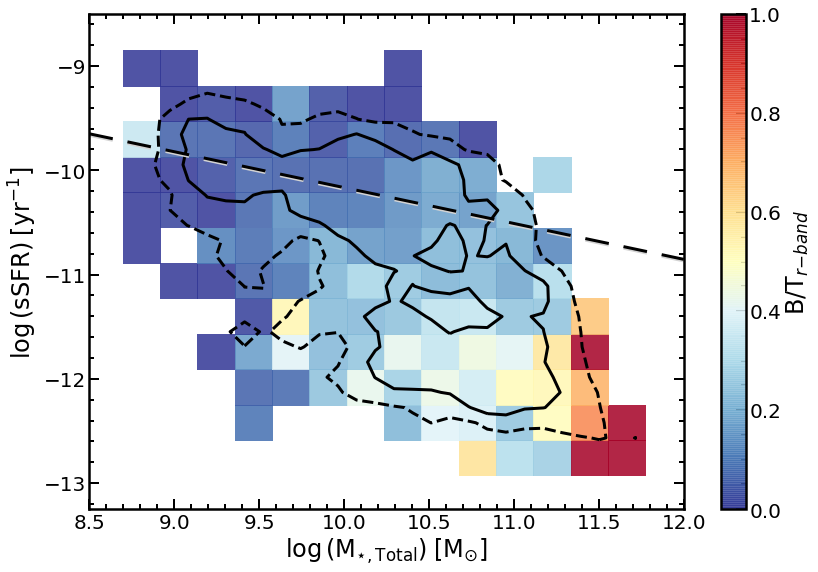
Figure 4 shows the – plane with the mean -band shown in each bin. The overlaid contours represent the and percentiles of the number distribution of galaxies. As already pointed out by previous works (Wuyts et al., 2011), this plot shows that the main sequence is primarily populated by disc-dominated galaxies, whereas below the main-sequence there is an increasing contribution from bulges. Along the SFMS, the mean also increases with stellar mass, varying from at to at .
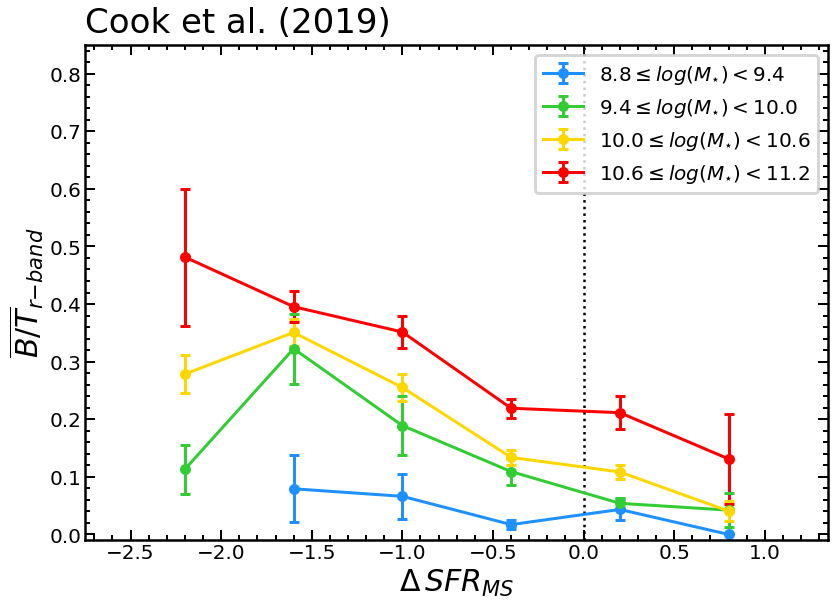
In the left panel of Figure 5, we perform a similar exercise as has been done in Morselli et al. (2017) by looking at the mean -band as a function of distance from the SFMS (). The relatively small size of the xGASS sample affords separating galaxies into four stellar mass bins of width 0.6 dex. This is in contrast to the work done by Morselli et al. (2017) who utilise a much larger sample selected from SDSS with the bulge-disc decomposition measurements from Simard et al. (2011). Here, our results do not replicate the trends with structure as a function of , in particular, the average bulge-to-total ratio decreases monotonically from the passive population to the upper envelope of the SFMS. This anticorrelation is observed in each bin of stellar mass, with the exception of the lowest bin which remains at a relatively constant average bulge-to-total ratio of .
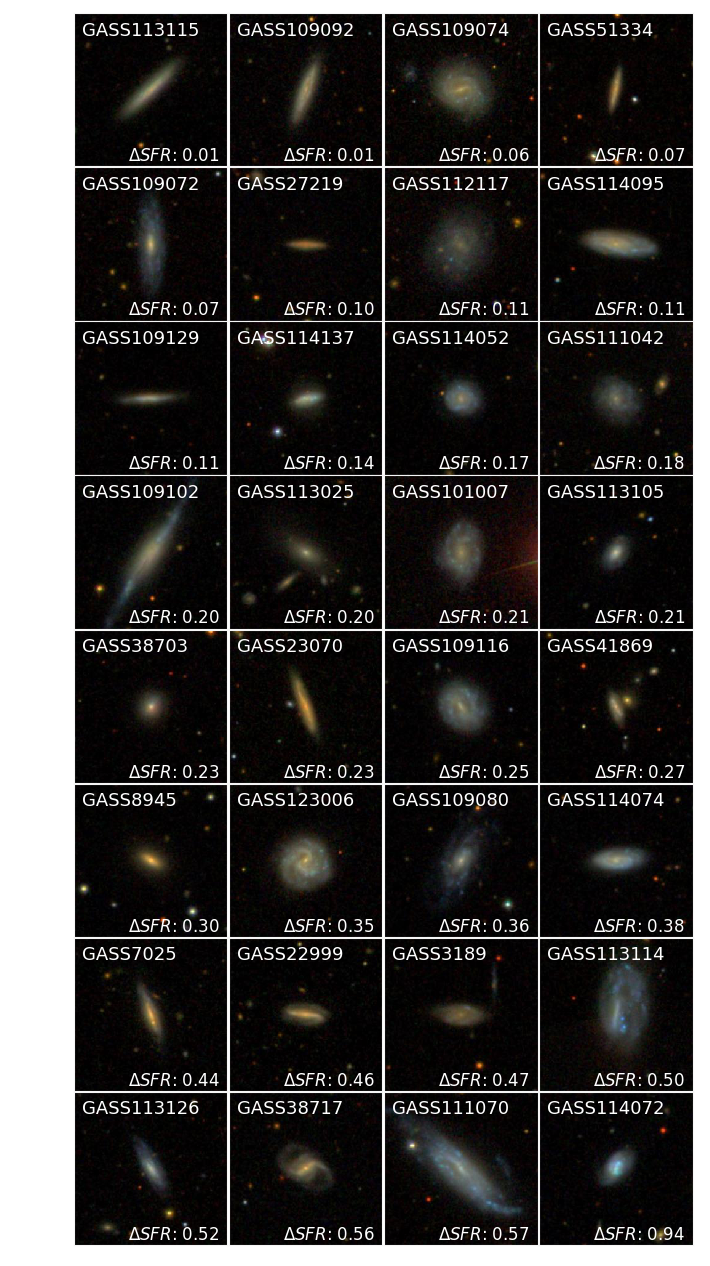
It is possible that the disparity of the trends observed in Figure 5 with respect to the Morselli et al. (2017) result may be due to the differences between the samples being studied. Whilst the sample used in Morselli et al. (2017) incorporates galaxies between , with and identified as not hosting active galactic nuclei, the galaxies in xGASS were selected based on redshift () and stellar mass () only. The larger sample used in the Morselli et al. (2017) analysis includes rare starburst galaxies with SFRs at more than 1 dex above the SFMS. Due to the relatively low numbers of galaxies in the xGASS sample, it is not possible to probe such high SFRs and as such we are not able to make a direct comparison in this regime. However, the upturn in bulge-to-total ratios observed in Morselli et al. (2017) becomes statistically significant for low stellar masses () in the regime 0.5 dex above the SFMS. In xGASS, dex marks the confidence interval of star-forming galaxies (i.e. 95% of SF galaxies have dex). That said, we find very few examples of galaxies above this point with , particular in the lowest stellar masses where the upturn is most evident for Morselli et al. (2017); Popesso et al. (2019a).
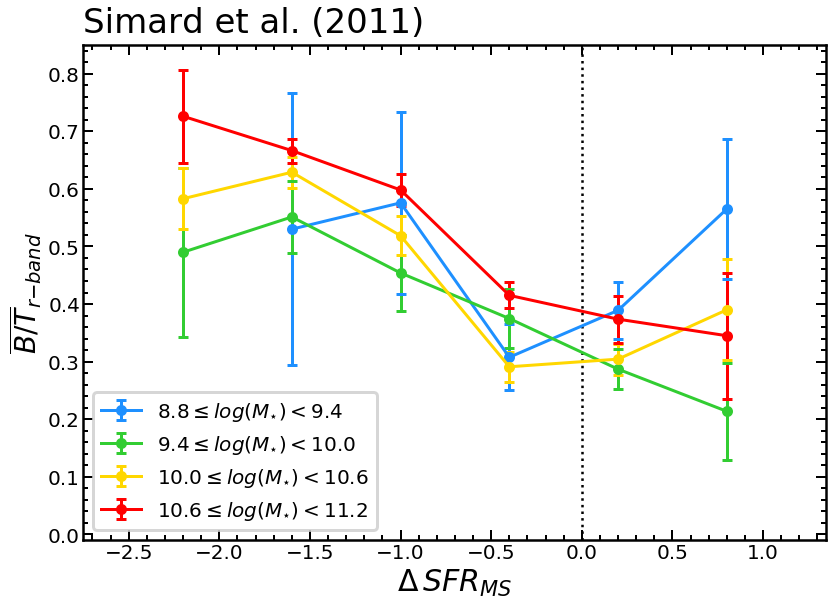
To understand how the differences between both samples impacts our results above, we repeat the analysis using the Simard et al. (2011) structural decomposition catalogue with the xGASS sample in the right panel of Figure 5. In all mass bins at all regions across the SFMS, galaxies show a higher average . In at least two of the mass ranges, we observe the trends seen in Morselli et al. (2017) of an upturn in the average of galaxies above . This suggests that, whilst the difference in samples and lower number statistics of xGASS above the main sequence may play a role, the elevated average observed in galaxies above the SFMS are, at least partially, rooted in the differences in structural decomposition catalogues. We discuss these differences further in Section 4.
4 Spurious Modelling in Structural Decomposition
From the results shown above, it is clear that the structural decomposition of galaxy light profiles and subsequent model classification must be performed very carefully to minimise the contamination of spurious measurements of structural parameters. Relying solely on large number statistics to overcome the many inherent complications of modelling galaxies may prove to be a less viable solution than using smaller samples, where individual galaxies are modelled in greater detail and model selection is based on physical properties rather than statistical measures of their ‘goodness of fit’ (see Cook et al. 2019).
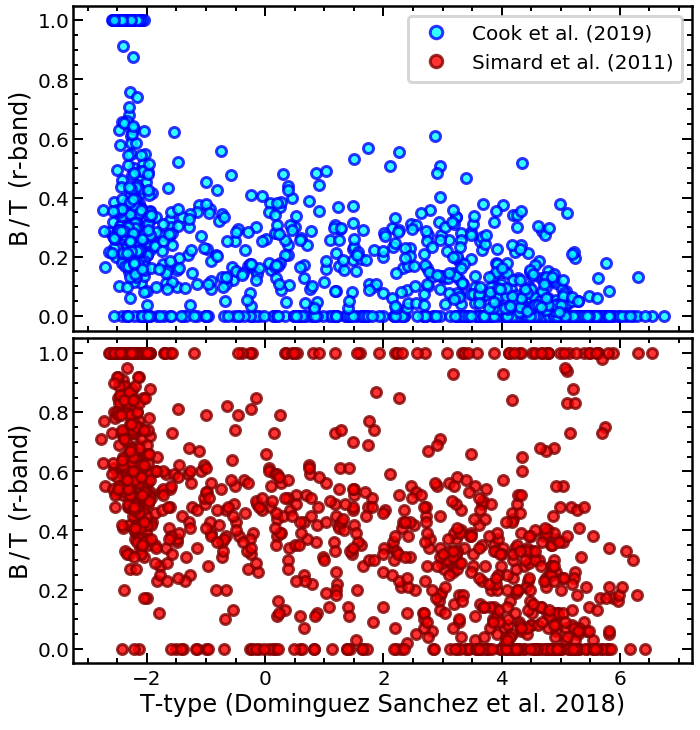
In Figure 6, we present a comparison between bulge-to-total ratios derived from the structural decomposition of SDSS galaxies against their T-types measured from a machine learning algorithm described in Domínguez Sánchez et al. (2018). Here, a more-negative T-type indicates an earlier morphological class, hence we expect this to correlate with an increasing average . This trend is indeed observed to some degree in both catalogues shown here but with important caveats. Firstly, galaxies visually classified as early-type galaxies (T-type ) exhibit a large range in . This highlights the high degree of uncertainty in modelling light profiles for galaxies that are visually identified as early-type, as profile fitting codes have difficulties distinguishing large spheroids from diffuse discs in this regime. In general, there is a larger spread in at a given T-type in the Simard et al. (2011) catalogue, which again reflects the fact that the sample involved is significantly larger ( galaxies) and inherently has limitations to the extent to which models can be validated after being modelled. In particular, many galaxies selected from the Simard et al. (2011) catalogue are visually identified as late-type systems from their T-type but have a high B/T. In fact, many of these galaxies would be classified as pure-bulge systems (i.e. ) when basing the model classification on their Sérsic index () or via the bulge-to-total ratio as measured by a corresponding two-component model. This highlights an important caveat when using structural decomposition catalogues which should be carefully considered before bulge and disc measurements are assigned to a galaxy.
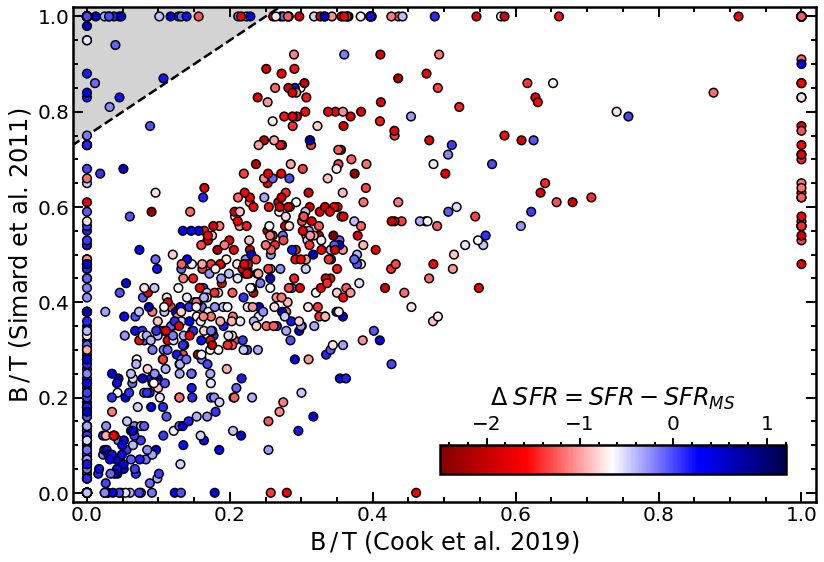
To illustrate this further, Figure 7 shows a galaxy-matched comparison between the measured in Cook et al. (2019) and those derived from Simard et al. (2011). Here, we take the suggested approach from Simard et al. (2011) of using the probability derived from an F-test comparing the likelihood that the two-component model is preferred over the single-component one. They assign the value as the F-test probability that a two-component model is not required compared to that of a pure-Sérsic model. In particular, a galaxy is considered to be best fit by a two-component model if . We reiterate here that whilst these single-component models may have provided the mathematically-preferred solution (in terms of their goodness-of-fit metric), given the data quality and model constraints, they may not be physically correct solutions. That said, this probability alone can only indicate whether a particular photometric image exhibits a smaller residual when modelled with one or two components but explicitly does not separate between single-component models that are pure-disc or pure-bulge systems. A cut in Sérsic index is often used as such a discriminator (Allen et al., 2006; Meert et al., 2015) and, in some cases, an additional measurement of galaxy colour (Kelvin et al., 2012). Here, the cut is made at for the Simard et al. (2011) catalogue to remain consistent with previous works and to present a conservative comparison. Whilst the Sérsic index — or other metrics such as concentration index () or central surface brightness — scales roughly with increasing bulge fraction, the mapping is far more convoluted and certainly not a one-to-one relation (Graham et al., 2001). In particular, it cannot always distinguish between a purely disc- or spheroid-dominated system, particularly in the case of galaxies that are irregular, disrupted or observed edge-on.
In this particular case, selecting the best model complexity (i.e. number of components) based on residuals of the and Sérsic index is in principle not sufficient. This leads to a non-negligible fraction of inherently pure-disc systems being considered as either bulge-dominated in the case where the F-test incorrectly maps to model complexity or as a pure-bulge where the Sérsic index is artificially inflated. The bottom panels of Figure 7 show a series of SDSS RGB cutout images for xGASS galaxies which show the greatest tension between values derived between the two catalogues. The vast majority of these galaxies are consistent with highly disc-dominated systems corroborating that model selection via a F-test probability and cut in Sérsic index is not always valid.
In the era of large surveys, structural decomposition studies will need to move beyond current strategies for model selection in favour for those that can extract more information from the residual () maps. In particular, the use of deep learning algorithms in this field may be the most promising solution to finding the balance needed between a fast, automated and reproducible method that also incorporates the required intuition of visually inspected model selection. In order to implement such deep learning algorithms, one requires a large enough training set that is representative of galaxies in a particular sample. Previous studies have generated mock galaxy images by injecting synthetic Sérsic profiles into real astronomical data. However, these synthetic images do not yet encompass the true complexities of galaxies which vary as a function of environment, mass, projection, sensitivity, redshift, etc. This is becoming increasingly important when investigating the secondary correlations that are present within global galaxy scaling relations.
5 Discussion
Here, we discuss the main findings of this paper. These are: (a) the declining slope in the SFMS at high total stellar masses () is not sufficiently explained by the inclusion of bulges; (b) importantly, when done in a consistent manner (i.e. vs. ), this difference is no longer present; (c) the average bulge fraction of galaxies increases monotonically as a function of distance from the SFMS (at all stellar masses) as well as with increasing total stellar mass.
5.1 Slope of the Star-forming Main Sequence
Previously, Abramson et al. (2014) have shown that re-normalising specific by the disc mass alone (as opposed to total stellar mass) can account for of the decline in the SFMS for every order of magnitude increase in stellar mass for galaxies with . In this work, we have used a different sample and, importantly, a more robust set of structural decomposition measurements to show that the disc-normalised relation (in this same mass regime) accounts for only . This result has also been confirmed by Popesso et al. (2019a), who find that the bulge component accounts for only % at to % at . This result alone suggests that the non-identical star formation histories of galaxies encapsulated by the residual negative slope in the – relation cannot be completely explained by the growth of bulges at higher stellar masses.
Moreover, recasting this relation as a disc-normalised quantity () against a global property () can be difficult to interpret given the residual coupling to that exists between these two quantities. Instead, framing this relation in terms of exhibits an identical slope to that seen in the relation with total galaxy quantities. This implies that the observation of higher mass galaxies having built up at earlier epochs and over shorter timescales is itself intrinsic to the disc components of galaxies. Under the assumption that star formation proceeds predominantly within discs, it is perhaps not surprising that the heterogeneous growth of galaxies is rooted in their discs whilst bulges appear to have only at most a secondary role.
In both Figures 1 and 2, it is evident that a clear relationship between the and stellar mass remains once recast into disc-normalised quantities with a SFMS scatter comparable to the total relation. This is in contrast to the disc-normalised relations of Abramson et al. (2014) in which the scatter of the SFMS increases significantly. Although a larger sample was used, the greater uncertainties in the bulge and disc model parameters leads to a larger overall scatter and the resulting relation between and is no longer well-defined. We have shown that with a smaller sample, the resulting scatter can be significantly reduced when using structural decomposition measurements with further model validation and filtering as described in Cook et al. (2019).
5.2 Morphology across the SFMS
Perpendicular to investigating the role of bulges in regulating the relation along the SFMS, we also investigate the distribution of morphology across it. The trends of an increasing bulge prominence as a function of distance below the SFMS observed in this work are in good agreement with recent studies (Bluck et al., 2014; Morselli et al., 2019). At all stellar masses, galaxies below the main sequence are always on average more bulge-dominated than those on or above it. Whilst at face value this might suggest that the build up of a bulge may be linked to the suppression of star formation in galaxies, Cook et al. (2019) showed that the presence (and relative prominence) of bulges in star-forming galaxies has little-to-no impact on their overall atomic hydrogen (H i) gas reservoirs. If we consider the H i reservoir within a galaxy to indicate its potential for future star formation, we would expect a signature to appear here if, in fact, the presence of a bulge could in some way affect the continued star formation in a galaxy.
Note that our results are in tension with those found in previous studies (e.g. Morselli et al. 2017; Popesso et al. 2019a) also using local samples of SDSS galaxies. In particular, Morselli et al. (2017) find that at most stellar masses, the minimum average of galaxies aligns closely with the peak of the SFMS (i.e. ), whereas Popesso et al. (2019a) find this minimum to increase gradually as a function of stellar mass. Note, however, that using global structural parameters of CANDELS galaxies modelled by van der Wel et al. (2012), Morselli et al. (2019) showed recently that galaxies above the SFMS exhibit lower Sérsic indices on average than galaxies on or below the SFMS, which is consistent with this work. Our results in Figure 5 show that the average is monotonically declining with no apparent increase above the SFMS. This implies that as galaxies experience episodes of heightened star formation activity, a change in their morphology does not necessarily follow. The results of Morselli et al. (2017); Popesso et al. (2019a) have prompted a scenario in which galaxies receive a large infall of gas that triggers star formation and subsequently promotes the growth of the central bulge. In this compaction-depletion scenario, repeated phases of gas inflow towards the centre of a galaxy are followed by depletion due to an episode of heightened star formation activity. This advances galaxies along the main sequence before reaching a final quenching event. Our data instead do not reveal a population of starburst galaxies (emerging from either merger events or violent disc instabilities) which harbour a prominent star-forming bulge component.
As is highlighted by Figure 7, this tension is likely due to the differences between structural decomposition measurements used in these studies, rather than differences in calibration of indicators or stellar mass measurements. The presence of visually classified late-type galaxies modelled as highly bulge-dominated systems partly explains the discrepancies between this study and those based on the Simard et al. (2011) catalogue.
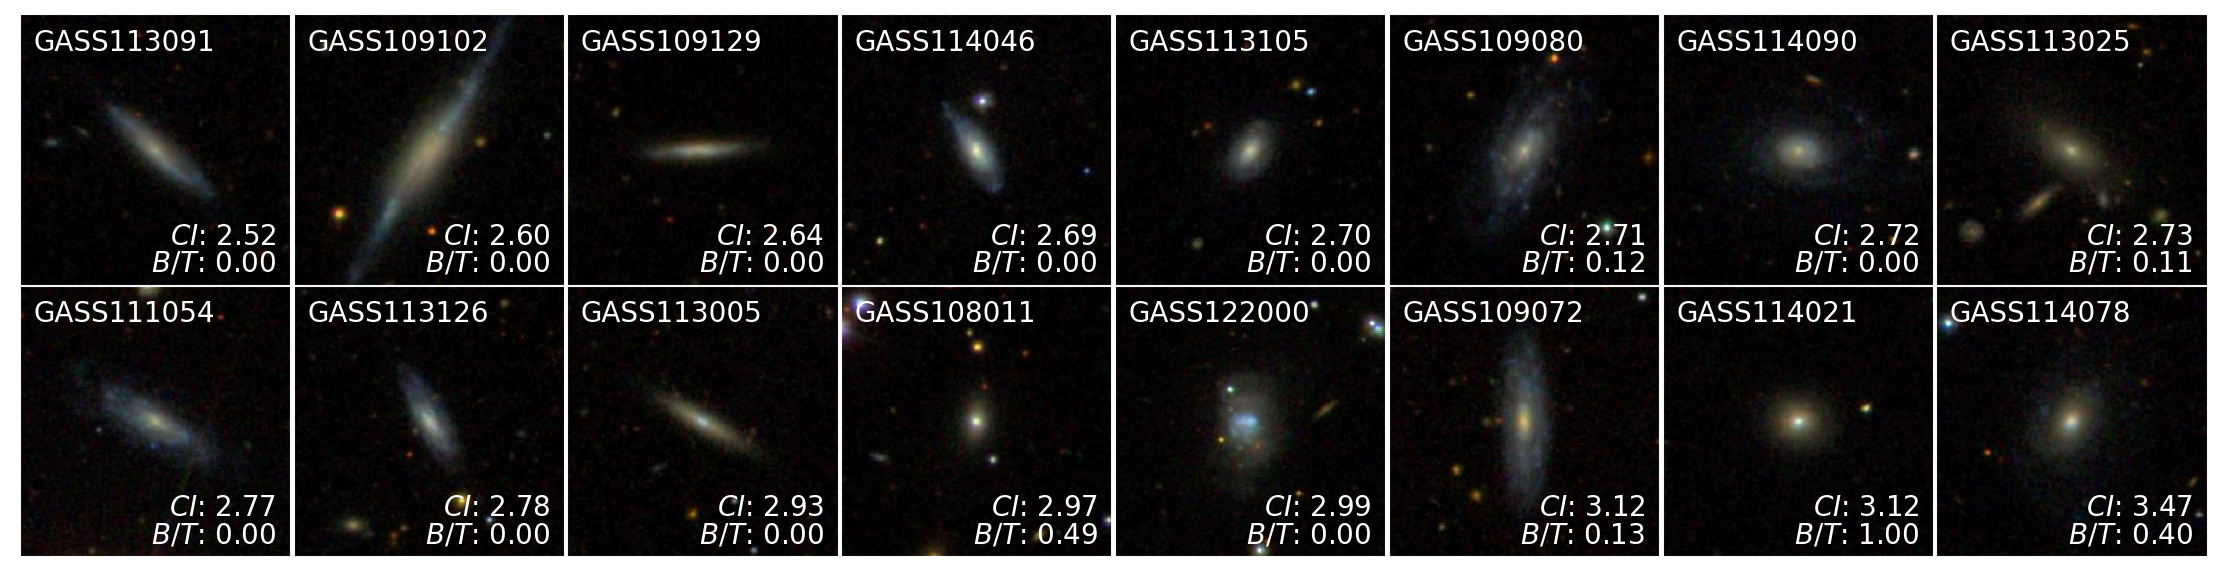
Lastly, we note that a similar increase above the main sequence has been observed when using SDSS-based concentration indices () in place of of structural decomposition (e.g. Appendix B of Morselli et al. 2017). It is important to emphasise that from a physical point of view there is no one-to-one mapping between concentration index and and even the mapping onto Sérsic index is not strictly monotonic when the effects of seeing are considered (Graham & Driver, 2005). Moreover, the concentration index (and accordingly, a single-component Sérsic index) is itself a poor proxy for since both low and high map to single-component models as pure-discs and pure-bulges, respectively. As an example, low mass star-forming galaxies often show features such as inner star-bursts or bars which increase the concentration of light (and Sérsic index) measured despite there being no bulge structure present. This is highlighted in Figure 8, where we show examples of low mass galaxies in xGASS above the main sequence and with concentration indices greater than 2.5 which roughly delineates where the upturn becomes statistically significant in the Morselli et al. (2017) analysis. As can be seen, our structural decomposition suggests that in most cases, there is little-to-no contribution from a bulge structure but a large concentration index results nonetheless. As such, it should not be used as evidence that highly star-forming systems have bigger bulges.
6 Conclusions
In this work, we study the role of bulges both as regulators of star formation rate (along the SFMS) as well as by-products (across the SFMS) using our catalogue of robust structural decompositions (Cook et al., 2019) of the xGASS sample. We find that the slope of the – flattens by 0.1 dex per decade in when re-normalising the specific star formation rate by the stellar mass of the disc. However, this flattening is only observed above a stellar mass of ; below this, the relation retains a gradual negative slope as this regime is dominated by pure-disc systems. This fact, in addition to the persistence of the negative slope when plotting against the disc stellar mass, indicates that the residual mass dependence of this relation is more closely linked to physical processes acting on the disc, rather than the contribution from bulges. Galaxies situated on the SFMS exhibit an increasing average as a function of stellar mass, from nearly pure-discs () to % bulge fractions over the mass range of – . However, this alone is not sufficient to explain the residual slope in the – relation.
Furthermore, we have found that the average of galaxies as a function of distance from the SFMS is monotonically decreasing at all stellar masses; with the exception of our lowest bin () which is consistent with pure-disc systems throughout its range of star-formation rates. This finding is in agreement with some previous works (Bluck et al., 2014; Morselli et al., 2019) but not with other works which find an increased average above the SFMS (Morselli et al., 2017; Popesso et al., 2019a). We do not find evidence for a population of starburst galaxies with systematically higher bulge fractions in the local Universe.
We attribute this discrepancy to differences in the structural decomposition measurements used in each of these works. The limited model validation viable in such large catalogues can lead to spurious structural measurements being assigned to galaxies. In particular, using a goodness-of-fit metric to decide model complexity (number of components) and a proxy for morphology (e.g. Sérsic index, concentration index) to distinguish pure-discs and pure-bulges is not in itself sufficient to classify galaxies in a robust manner.
Acknowledgements
We would like to gratefully thank the referee for their insightful and constructive comments.
Parts of this research were supported by the Australian Research Council Centre of Excellence for All Sky Astrophysics in 3 Dimensions (ASTRO 3D), through project number CE170100013.
LC is the recipient of an Australian Research Council Future Fellowship (FT180100066) funded by the Australian Government.
References
- Abazajian et al. (2009) Abazajian K. N., et al., 2009, The Astrophysical Journal Supplement Series, 182, 543
- Abramson et al. (2014) Abramson L. E., Kelson D. D., Dressler A., Poggianti B., Gladders M. D., Oemler Augustus J., Vulcani B., 2014, ApJ, 785, L36
- Adelman-McCarthy et al. (2008) Adelman-McCarthy J. K., et al., 2008, The Astrophysical Journal Supplement Series, 175, 297
- Allen et al. (2006) Allen P. D., Driver S. P., Graham A. W., Cameron E., Liske J., de Propris R., 2006, MNRAS, 371, 2
- Belfiore et al. (2018) Belfiore F., et al., 2018, MNRAS, 477, 3014
- Bluck et al. (2014) Bluck A. F. L., Mendel J. T., Ellison S. L., Moreno J., Simard L., Patton D. R., Starkenburg E., 2014, MNRAS, 441, 599
- Boselli et al. (2001) Boselli A., Gavazzi G., Donas J., Scodeggio M., 2001, AJ, 121, 753
- Bouché et al. (2010) Bouché N., et al., 2010, ApJ, 718, 1001
- Brinchmann et al. (2004) Brinchmann J., Charlot S., White S. D. M., Tremonti C., Kauffmann G., Heckman T., Brinkmann J., 2004, MNRAS, 351, 1151
- Catinella et al. (2010) Catinella B., et al., 2010, MNRAS, 403, 683
- Catinella et al. (2018) Catinella B., et al., 2018, MNRAS, 476, 875
- Cook et al. (2019) Cook R. H. W., Cortese L., Catinella B., Robotham A. S. G., 2019, arXiv e-prints, p. arXiv:1909.10202
- Daddi et al. (2007) Daddi E., et al., 2007, ApJ, 670, 156
- Daddi et al. (2010) Daddi E., et al., 2010, ApJ, 714, L118
- Davé et al. (2012) Davé R., Finlator K., Oppenheimer B. D., 2012, MNRAS, 421, 98
- Davies et al. (2016) Davies L. J. M., et al., 2016, MNRAS, 461, 458
- Dekel & Mandelker (2014) Dekel A., Mandelker N., 2014, MNRAS, 444, 2071
- Domínguez Sánchez et al. (2018) Domínguez Sánchez H., Huertas-Company M., Bernardi M., Tuccillo D., Fischer J. L., 2018, MNRAS, 476, 3661
- Elbaz et al. (2007) Elbaz D., et al., 2007, A&A, 468, 33
- Elbaz et al. (2011) Elbaz D., et al., 2011, A&A, 533, A119
- Ellison et al. (2018) Ellison S. L., Sánchez S. F., Ibarra-Medel H., Antonio B., Mendel J. T., Barrera-Ballesteros J., 2018, MNRAS, 474, 2039
- Erfanianfar et al. (2016) Erfanianfar G., et al., 2016, MNRAS, 455, 2839
- Gavazzi et al. (2015) Gavazzi G., et al., 2015, A&A, 580, A116
- Genzel et al. (2010) Genzel R., et al., 2010, MNRAS, 407, 2091
- Graham & Driver (2005) Graham A. W., Driver S. P., 2005, Publications of the Astronomical Society of Australia, 22, 118
- Graham et al. (2001) Graham A. W., Trujillo I., Caon N., 2001, AJ, 122, 1707
- Guo et al. (2015) Guo K., Zheng X. Z., Wang T., Fu H., 2015, ApJ, 808, L49
- Hopkins & Beacom (2006) Hopkins A. M., Beacom J. F., 2006, ApJ, 651, 142
- Janowiecki et al. (2017) Janowiecki S., Catinella B., Cortese L., Saintonge A., Brown T., Wang J., 2017, MNRAS, 466, 4795
- Janowiecki et al. (2019) Janowiecki S., Catinella B., Cortese L., 2019, in American Astronomical Society Meeting Abstracts #233. p. 429.04
- Kelvin et al. (2012) Kelvin L. S., et al., 2012, MNRAS, 421, 1007
- Kennicutt et al. (1994) Kennicutt Robert C. J., Tamblyn P., Congdon C. E., 1994, ApJ, 435, 22
- Lee et al. (2015) Lee N., et al., 2015, ApJ, 801, 80
- Lilly et al. (1996) Lilly S. J., Le Fevre O., Hammer F., Crampton D., 1996, ApJ, 460, L1
- Lilly et al. (2013) Lilly S. J., Carollo C. M., Pipino A., Renzini A., Peng Y., 2013, ApJ, 772, 119
- Madau et al. (1998) Madau P., Pozzetti L., Dickinson M., 1998, ApJ, 498, 106
- Martin et al. (2005) Martin D. C., et al., 2005, ApJ, 619, L1
- Meert et al. (2015) Meert A., Vikram V., Bernardi M., 2015, MNRAS, 446, 3943
- Morselli et al. (2017) Morselli L., Popesso P., Erfanianfar G., Concas A., 2017, A&A, 597, A97
- Morselli et al. (2019) Morselli L., Popesso P., Cibinel A., Oesch P. A., Montes M., Atek H., Illingworth G. D., Holden B., 2019, A&A, 626, A61
- Neistein et al. (2006) Neistein E., van den Bosch F. C., Dekel A., 2006, MNRAS, 372, 933
- Noeske et al. (2007) Noeske K. G., et al., 2007, ApJ, 660, L43
- Nordon et al. (2013) Nordon R., et al., 2013, ApJ, 762, 125
- Pannella et al. (2009) Pannella M., et al., 2009, ApJ, 698, L116
- Peng et al. (2010) Peng Y.-j., et al., 2010, ApJ, 721, 193
- Popesso et al. (2019a) Popesso P., et al., 2019a, Monthly Notices of the Royal Astronomical Society, 483, 3213
- Popesso et al. (2019b) Popesso P., et al., 2019b, MNRAS, 490, 5285
- Renzini & Peng (2015) Renzini A., Peng Y.-j., 2015, ApJ, 801, L29
- Robotham et al. (2017) Robotham A. S. G., Taranu D. S., Tobar R., Moffett A., Driver S. P., 2017, MNRAS, 466, 1513
- Rodighiero et al. (2010) Rodighiero G., et al., 2010, A&A, 518, L25
- Rodighiero et al. (2014) Rodighiero G., et al., 2014, MNRAS, 443, 19
- Saintonge et al. (2016) Saintonge A., et al., 2016, MNRAS, 462, 1749
- Salim et al. (2007) Salim S., et al., 2007, The Astrophysical Journal Supplement Series, 173, 267
- Schreiber et al. (2015) Schreiber C., et al., 2015, A&A, 575, A74
- Simard et al. (2011) Simard L., Mendel J. T., Patton D. R., Ellison S. L., McConnachie A. W., 2011, The Astrophysical Journal Supplement Series, 196, 11
- Speagle et al. (2014) Speagle J. S., Steinhardt C. L., Capak P. L., Silverman J. D., 2014, ApJS, 214, 15
- Tacchella et al. (2016) Tacchella S., Dekel A., Carollo C. M., Ceverino D., DeGraf C., Lapiner S., Mand elker N., Primack Joel R., 2016, MNRAS, 457, 2790
- Tomczak et al. (2016) Tomczak A. R., et al., 2016, ApJ, 817, 118
- Wang et al. (2011) Wang J., et al., 2011, MNRAS, 412, 1081
- Whitaker et al. (2012) Whitaker K. E., van Dokkum P. G., Brammer G., Franx M., 2012, ApJ, 754, L29
- Whitaker et al. (2014) Whitaker K. E., et al., 2014, ApJ, 795, 104
- Whitaker et al. (2015) Whitaker K. E., et al., 2015, ApJ, 811, L12
- Wright et al. (2010) Wright E. L., et al., 2010, AJ, 140, 1868
- Wuyts et al. (2011) Wuyts S., et al., 2011, ApJ, 742, 96
- Zibetti et al. (2009) Zibetti S., Charlot S., Rix H.-W., 2009, MNRAS, 400, 1181
- Zolotov et al. (2015) Zolotov A., et al., 2015, MNRAS, 450, 2327
- van der Wel et al. (2012) van der Wel A., et al., 2012, ApJS, 203, 24