Survey of very broad Diffuse Interstellar Bands
Abstract
This paper considers a very special set of a few interstellar features — broad diffuse interstellar bands (DIBs) at 4430, 4882, 5450, 5779 and 6175 ÅÅ. The set is small, and measurements of equivalent widths of these DIBs are challenging because of severe stellar, interstellar, and sometimes, also telluric contaminations inside their broad profiles. Nevertheless, we demonstrate that they do correlate pretty tightly (DIBs 4882 and 5450 to a lesser extent though) with other narrower diffuse bands, as well as with the color excess E(BV). The studied broad DIBs correlate well with both interstellar molecule CH and interstellar Ki, i.e. it is hardly possible to verify whether the environments, facilitating the formation of very broad DIB carriers, are dominated by either molecular or atomic gas as both these species likely occupy the same volume.
1 Introduction
The diffuse interstellar bands (DIBs) have been known since nearly 100 yr (Heger, 1922) but still remain unidentified. For a recent review see Krełowski (2018). The recently promoted identification of a few near infrared DIBs as being carried by C (Cordiner, Linnartz, Cox et al. (2019) and references therein) does not take into account the fact that the two strongest DIBs do not show the laboratory predicted strength ratio and thus those of weaker bands are very uncertain (Galazutdinov et al. (2017), Galazutdinov & Krełowski (2017)). DIB profiles are always broader than those of interstellar atomic lines or those of simple interstellar radicals (CH, CN, CH+). The most recent survey of DIBs (Fan et al., 2019) reports the presence of 556 features in the optical range. However, several DIBs have been discovered also in the infrared part of spectrum, see e.g. Galazutdinov et al. (2017) and references therein. In turn, diffuse bands are tentatively divided into two or three non-equal groups: the first group is the most numerous one of so-called narrow diffuse bands with a typical full width at the half maximum (FWHM) close to 1 Å the second contains a few features with FWHM4 Å, and the third one is a small group of broad DIBs with FWHM 10 Å. In the current research we focus on it. Let us emphasize that the difference between broad and narrow diffuse bands is of physical origin. Perhaps, they are formed by different kinds of molecules. Indeed, the broad DIBs are well seen in targets being in the environment characterized by strong UV flux, e.g. in type objects, where for so-called narrow DIBs, the features that seem to be related to absorption features of simple interstellar radicals (CH, CN, CH+) are very weak (see Krełowski (2018) and references therein).
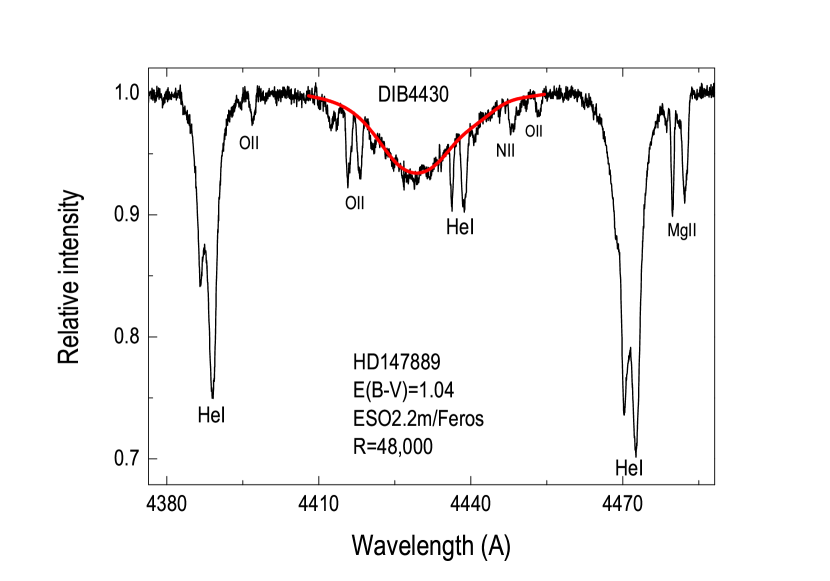
The first very broad DIB, centered at 4430 Å was identified as such more than 80 yr ago (Beals & Blanchet (1938); Merrill & Humason (1938)). The band, as broad as about 40 Å, FWHM 20 Å was found as stationary in a spectroscopic binary. It was reasonably easy to demonstrate that the strength of this feature correlates with a color excess but precise measurements were difficult since the very broad profile was naturally contaminated (especially in B-type stars) with numerous stellar lines of various intensity (Herbig, 1966). This is why the first determined correlations between 4430 and color excess or intensities of other interstellar features were found to be reasonably poor (Greenstein & Aller, 1950).
The discovered later, 6170 DIB, is the only very broad DIB that is not severely contaminated with stellar lines (Rudkjøbing, 1970). The latter publication reported the 4430/6175 strength ratio to be related to the galactic longitude and to the total-to-selective extinction ratio. The conclusion was, however, based on a rather small sample of reddened stars. We found that the 6170 diffuse band is often blended with another broad DIB marked as 6177 Å one. Also, this double-DIB is often blended with many narrow diffuse bands (Galazutdinov et al., 2000, Hobbs et al., 2008), challenging the measurements. Here we measured the features of 6170 and 6177 together and marked the resulting one as 6175 DIB.
Diffuse bands’ intensities, especially of 4430, have been typically related to the continuous extinction curve (Herbig, 1967). Until the end of the 1960s the 4430 DIB was the most frequently investigated diffuse feature. The band is the first DIB observed outside our Milky Way system (Houziaux, Nandy & Morgan, 1980). Until the beginning of the 1980s the hypothesis that the DIBs are carried by dust grains was taken very seriously. Herbig (1967) compared the problem of DIB identification to those of nebulium and coronium, saying that its solution may be of similar importance.
A statistical investigation of 65 sources revealed a rather tight correlation between the color excess and the 4430 DIB intensity (Gammelgaard, 1975). The relation suffers, however, a rather serious scatter among heavily reddened targets. Soon after the extra-atmospheric observations have been launched, Danks (1980) suggested the correlation between the 4430 DIB and the 2200 bump of the extinction curve. Isobe et al. (1986) analyzed a sample of 482 reddened stars. Their 4430 strengths do correlate with E(BV) but the scatter is very substantial.
A real breakthrough in the DIB investigations was the publication of Herbig (1975) which, due to the enhanced signal-to-noise (S/N) ratio, raised the number of known DIBs from 9 to 39 features plus a few suspects. Herbig demonstrated quite narrow DIBs (like 6196 or 6379), as well as pretty broad (like 5780 or 6284) and very broad ones (like 4882 or 6175). All these features’ intensities showed a rather tight correlations with the E(BV). The Herbig’s investigation was based on averaged spectra with S/N100. A statistically valuable sample of the 4430 central depth in low-resolution, high-S/N spectra (Krełowski et al., 1987) suggested the local differences in relative strengths of the very broad feature. The paper emphasized the problem of the profile stellar contaminations. Later the very broad DIBs were investigated rather seldomly.
The recent paper of (Sonnentrucker et al., 2018) revitalized the idea of investigating the broadest diffuse bands. They studied 21 sightlines and demonstrated profiles of a few broad DIBs, but only the relation of 6175 to E(BV). Moreover, they analyzed correlations between the broad DIBs and narrower ones. In their opinion the 4963 DIB originates in rather molecular gas while 5780, 5797, 6284, and 6613 Å DIBs primarily trace atomic gas. Our idea is to check the above-mentioned suggestions using a larger sample of much higher resolution spectra.
2 Observational data
Our observations have been collected using several high-resolution, fiber-fed echelle spectrographs and are as follows.
-
•
The Fiber-fed Extended Range Optical Spectrograph (FEROS), being fed with the 2.2m ESO L aSilla telescope (Kaufer et al., 1999) allows one to record in a single exposure the spectral range from 3600 to 9200 Å divided into 39 echelle orders. The resolution of the FEROS spectra is R=48,000. FEROS spectral orders cover pretty broad wavelength ranges, which make the spectrograph a very useful tool to check the spectral types and luminosity classes of the observed targets. The measurements are marked as ”F” in Table 1.
-
•
The Echelle SpectroPolarimetric Device for the Observation of Stars (ESPaDOnS) spectrograph is the bench-mounted high-resolution echelle spectrograph/spectropolarimeter) attached to the 3.58 m Canada-France-Hawaii telescope at Maunakea (Hawaii, US). It is designed to obtain a complete optical spectrum in the range from 3700 to 10,050 Å. For details see https://www.cfht.hawaii.edu/Instruments/Spectroscopy/ESPaDOnS/. The whole spectrum is divided into 40 echelle orders. The resolving power is about 68,000. The spectra from ESPaDOnS were obtained during the runs 05Ao5 (in 2010, with PI: B. Foing) and 15AD83 (in 2015, with PI: G. Walker). The measurements are marked as ”E” in Table 1.
-
•
The High Accuracy Radial velocity Planet Searcher (HARPS) spectrograph (Mayor et al., 2003), fed by the 3.6m ESO LaSilla telescope has a resolving power R=115,000 and broad spectral range which allows to cover all spectral lines used for classification of stars: Hei, Heii and Mgii as well as the interstellar Caii lines. HARPS spectra cover also a vast majority of Diffuse Bands and interstellar molecular features. The measurements are marked as ”H” in Table 1.
-
•
BOES (Bohyunsan Echelle Spectrograph) of the Korean National Observatory (Kim et al., 2007) is installed at the 1.8m telescope of the Bohyunsan Observatory in Korea. The spectrograph has three observational modes allowing resolving powers of 30,000, 45,000 and 90,000. In any mode, the spectrograph covers the whole spectral range from 3500 to 10,000 Å, divided into 75 – 76 spectral orders. The measurements are marked as ”B” in Table 1.
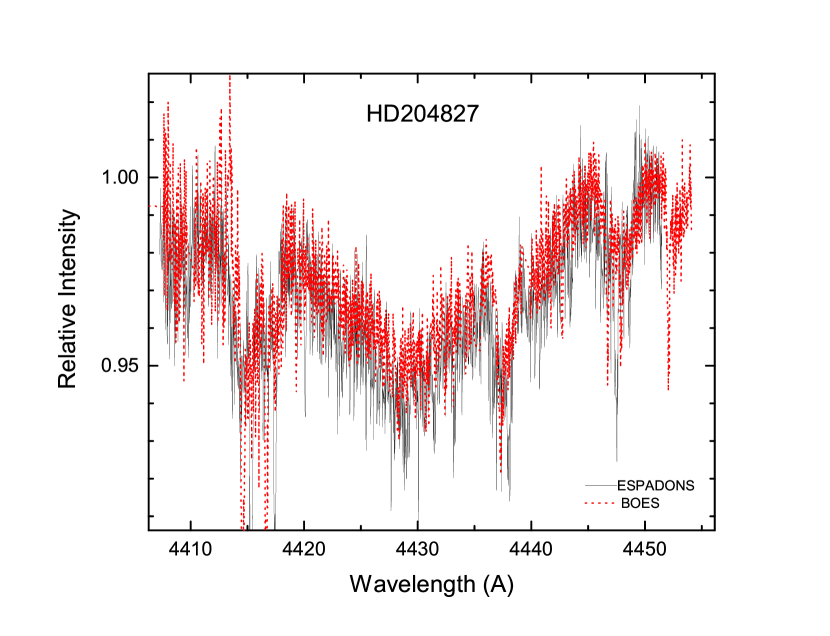
It is worth mentioning that all of the above spectrographs are fiber–fed, in most of cases providing an almost excellent flat-fielding procedure. The resulting flat-fielded spectra normally are nearly flat, i.e. the continuum is almost a straight line, making the normalization procedure much more evident than for those of slit instruments in most of cases. This is a very important advantage of fiber-fed spectrographs. Spectra from high-resolution slit spectrographs are often hardly useful for reliable measurements of broad features due to the complex shape (rather crowded) of spectral orders after the flat-field normalization. Also, we used the manual fit procedure to restore the broad DIB profiles, which allows for the elimination of stellar contamination. To confirm the above we present the plot (Fig. 1) comparing the HD204827 spectrum acquired with two fiber–fed echelle spectrographs: BOES and ESPaDOnS. In Fig.4 we show how we measured DIB5780 blended with broad DIB5779: the profile of the broad feature was accepted as a kind of pseudo-continuum. All other blended features were measured in the same manner.
Some objects were observed more than once. For the analysis we have selected the spectra with higher S/N ratio and/or with more evident position of the continuum. The complete set of measured profiles of broad diffuse bands is given in the Appendix.
All spectral images (except the ESPaDOnS data) were processed and measured in standard way using our own DECH111available upon request code. The spectral resolutions, provided by the above mentioned instruments, are not identical but all are high enough to precisely measure the strengths of the investigated spectral features of atomic and molecular species and, especially, of the broad DIBs.
3 Results
Values of the equivalent widths for DIBs and column densities for Ki and CH are presented in Tables 1 and 2. The equivalent width errors were estimated using the method from Vollmann & Eversberg (2006) in which both spectral noise and uncertainty of the continuum normalization are taken into account.
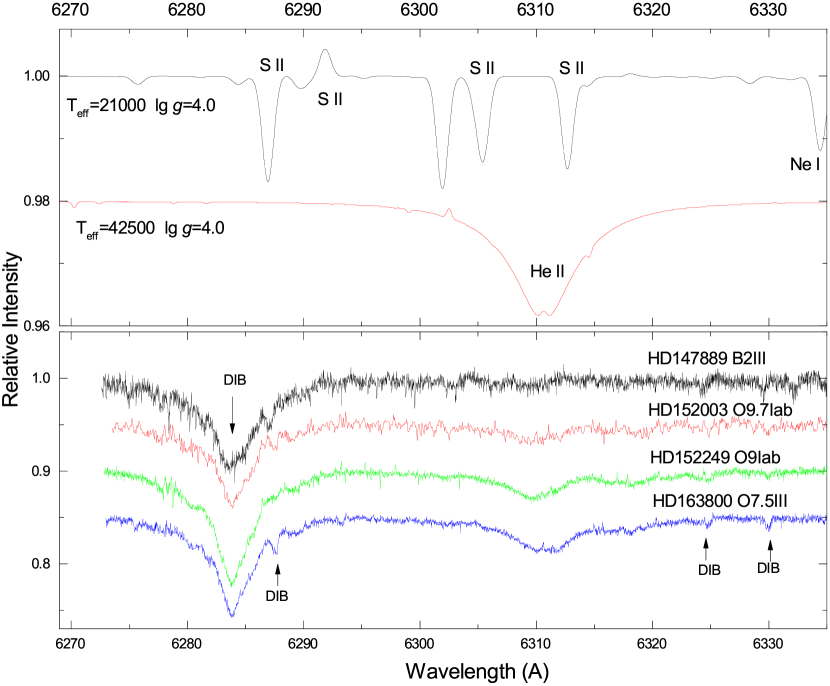
Sonnentrucker et al. (2018) mention many very broad DIBs but only some of them are marked as confirmed. Let’s consider one example marked by (Sonnentrucker et al., 2018) as probable: the 6311 DIB was originally mentioned by (Herbig, 1975) as a broad unconfirmed feature seen in HD183143. However, there are no data for this DIB in the measurements given in table of (Herbig, 1975). Then, in Jeniskens & Desert (1994) the feature is marked as present, however profiles in Fig. 6 (page 65 in the cited article) hardly prove this statement. Nevertheless, Tuairisg et al (2000) measured the feature as 6311.53 in HD183143, BD+40 4220 and BD+63 1964 though without addressing the stellar and interstellar contamination effects, which are severe in this area. Indeed, our spectra of the latter two objects do not confirm the presence of any broad feature in this area while the available spectra of HD 183143 cannot prove or disprove the presence of 6311.53 DIB due to the stellar contamination and continuum normalization issues. In our plot (Fig. 2) we clearly demonstrate that the suspect DIB is a stellar Heii line, typically observed in O-type stars. The feature does not exist in HD147889 as the latter is of B3V Sp/L, despite a very high reddening. In the upper panel of Fig. 2 we provide a comparison with the synthetic spectra calculated by Lanz & Hubeny (2003) and Lanz & Hubeny (2007) freely available in the TLUSTY web page111http://nova.astro.umd.edu/Tlusty2002/tlusty-frames-models.html. The shown stellar lines’ identification is based on the VALD database (Piskunov et al., 1995) line lists compiled with the effective temperature and logarithm of gravity values indicated for each synthetic spectrum in Figure 2.
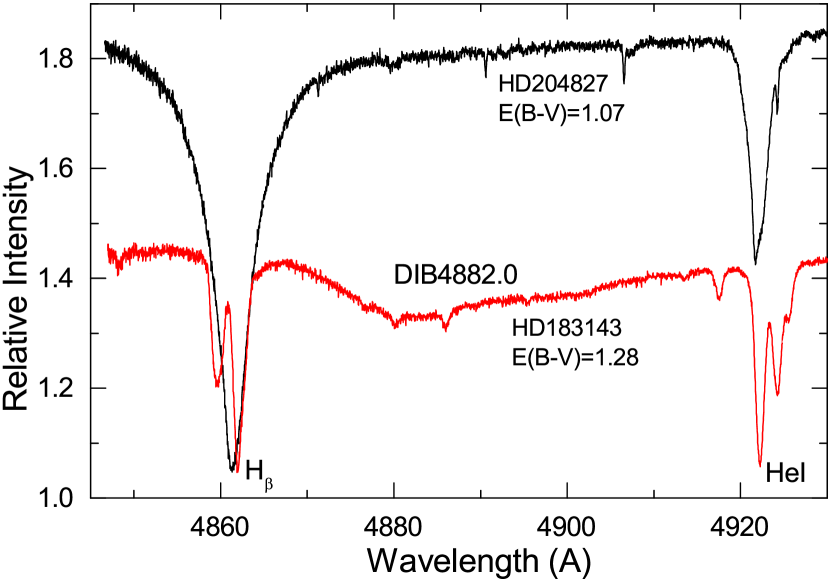
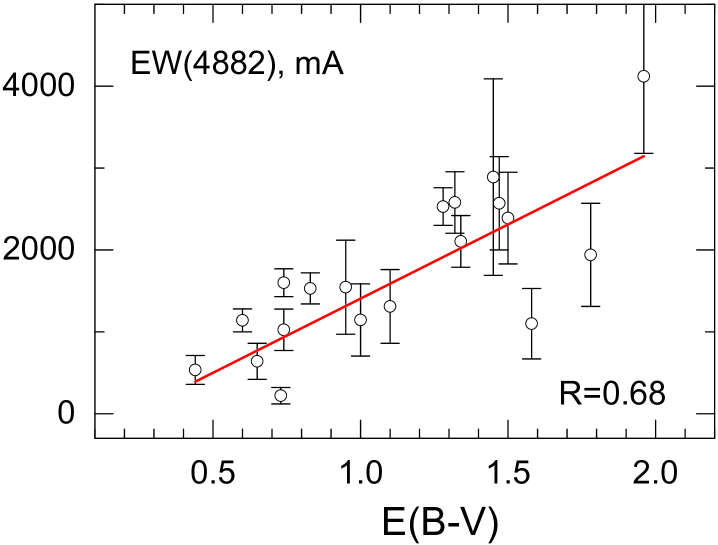
The 4882 feature is among the very broad DIBs, mentioned by (Herbig, 1975). Its measurements are naturally difficult because of the close proximity of the stellar line. This explains why the number of measurements of this feature given in Table 1 is substantially reduced. Worth mentioning is the rather poor correlation between this diffuse band and the amount of dust particles, which is demonstrated in Figures 3 and 8.
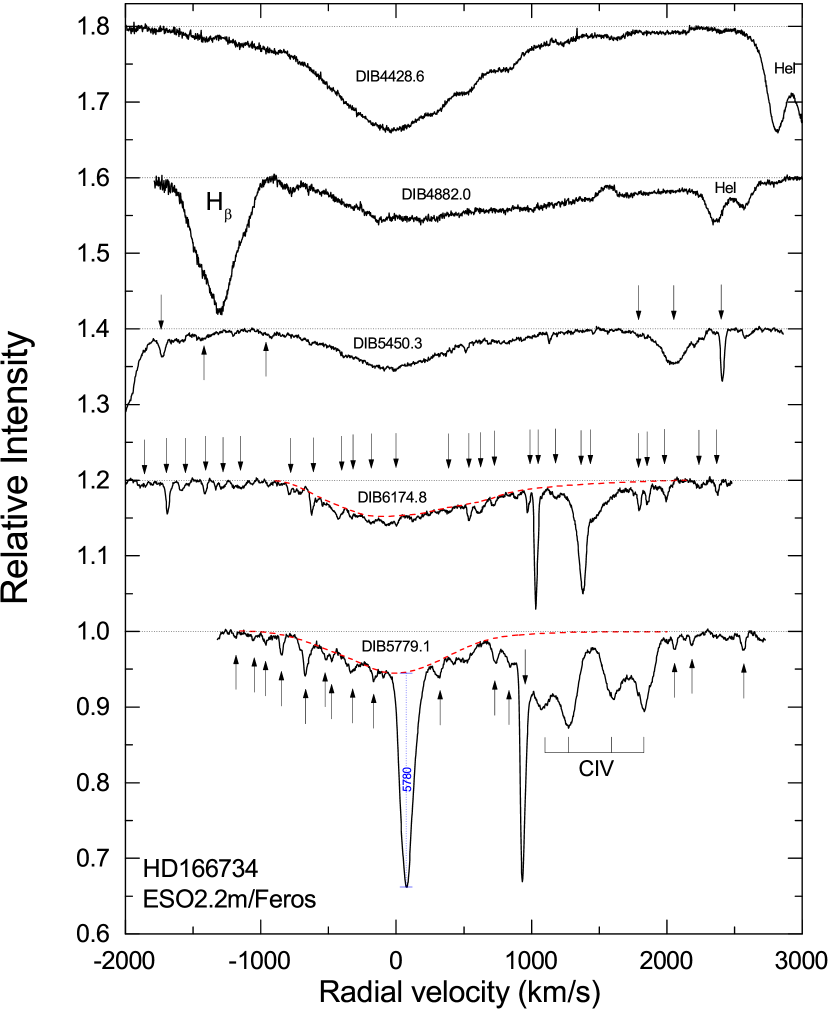
To verify what has been measured in our spectra, we show the profiles of our confirmed very broad DIBs (Fig. 4). To extract the profiles we have selected a very heavily reddened O7.5Iab star, HD166734, where the stellar contaminations in the DIB profiles are the smallest. It is of importance to mention that, e.g. the profile of the 6175 DIB, presented by Sonnentrucker et al. (2018) in the spectrum of B7 supergiant HD183143, is likely shown as too broad, perhaps because of stellar contaminations in its blue side. In all our spectra of O-type stars the profile begins around 6155 Å, not around 6130 Å. This is the possible source of errors: the borders of very broad features are ill-defined. It is thus very important to compare the spectra of different spectral types taken using different instruments.
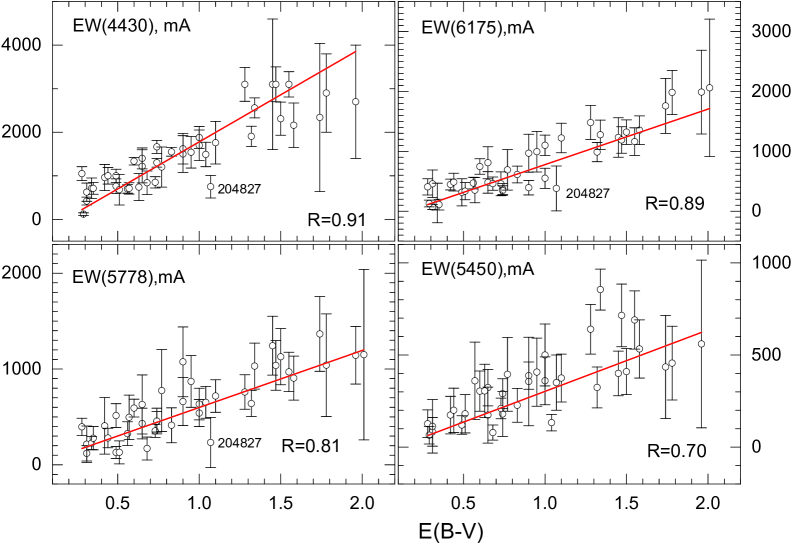
Our measurements of the sample of 43 high-resolution, high-S/N ratio spectra do confirm the already reported (see the Introduction) correlations of the very broad DIBs with a color excess; Figs. 7, 8 present the least-squares linear fits and the correlation coefficients for broad DIBs. All calculations were performed with the Y-errors taken into account.
We have measured the EWs of the broad DIBs (see Table 1), fitting the profile manually to separate the stellar contaminations (Herbig (1966); Krełowski et al. (1987)), especially strong in B type stars. Such a procedure leaves some arbitrariness but a more precise method hardly exists as the stellar spectra are a bit unpredictable (see an example of measurements in Fig. 5). This may lead to a correlation coefficient a bit smaller than the true one. In any case the broad features 4430, 6175 and 5779 do correlate quite tightly with E(BV) while 4882 and 5450 demonstrate a lower magnitude of correlation with the amount of interstellar dust.
Some diffuse bands are severely contaminated by telluric lines, e.g. reasonably broad DIB6284. Fortunately, spectra from fiber-fed spectrographs provide almost excellent removal of telluric lines by means of telluric standard stars. A good example is given in Fig. 6.

One of the very broad features, depicted at Fig. 4, is the 5450 DIB. It is reasonably weak and its profile is contaminated with stellar lines in B-type stars. The above makes the measurements of EWs uncertain. This is why a correlation between this DIB and E(BV) is lower than that of DIBs 4430, 6175, and 5779 (see Fig. 7).
A closer look into the area around 6175 reveals that the observed broad feature is a blend of at least two also broad bands centered approximately at 6170 and 6177 Å. Sometimes this separation is quite evident due to deep 6170 DIB: Cyg OB2 objects, HD 152233, HD 154368, HD 163800, etc. However, e.g. BD-13 4923, BD-13 4928, BD-13 4929, HD73882, HD319703, etc. exhibit a rather smooth profile without any indications of the presence of the blend.
It is particularly surprising that very broad 6175 DIB is pretty tightly correlated with E(BV) (Fig. 7). Despite a possible source of uncertainty, due to the manual fit and the abovementioned issues, the correlation coefficient is as high as 0.89. Thus the carriers of the very broad DIBs seem to be well mixed with other interstellar species, including dust grains. The correlation, based on our sample of 40 high-resolution, high-S/N ratio spectra, looks tighter than those presented by Sonnentrucker et al. (2018). The correlation would be even tighter but HD204827 departs down from the average relation and this effect is certainly not due to a measurement error.
Sonnentrucker et al. (2018) tried to relate the very broad diffuse band 6177 (we mark it as 6175) to other, narrower ones, in particular DIB 5780. The latter is the major one, discovered by Heger (1922). Both features in the Figure 10 of Sonnentrucker et al. (2018) seem to be closely related but the observed scatter seems to exceed the measurements’ errors.
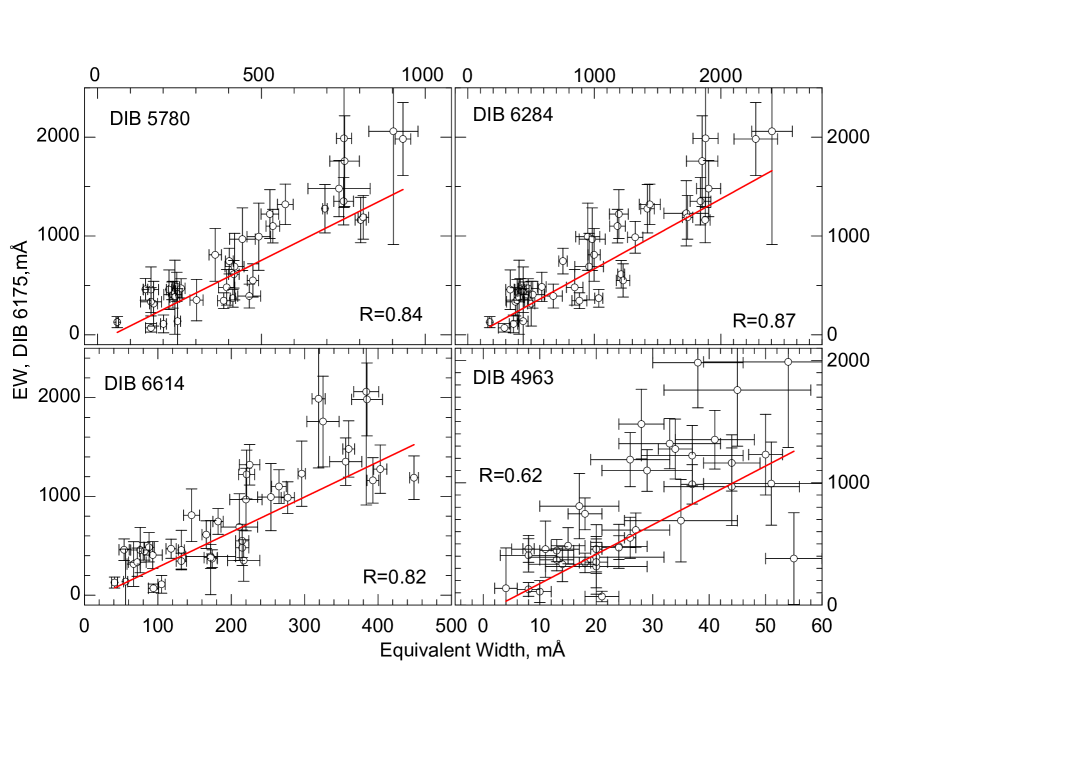
We have also checked the interrelations between very broad and narrower DIBs. The weighted linear fits with Pearson’s correlation coefficients are depicted on Fig. 9. The correlations’ magnitudes were calculated with measurement errors taken into account as the weights. All the fits presented on the Fig. 9 have the slope’s standard error between 0.07 and 5.05: with their best value (0.07) for the relation 6175 vs 6284 DIB and the worst one (5.05) for the relation 6175 versus 4963 DIB.
It is evident that the blend of broad DIBs at 6175 correlates very well with DIBs 5780, 6614 and, especially with 6284, which supposes a similar physical environment for their carriers. Its correlation with the narrow 4963 DIB is not so tight. It is, however, much more evident than that presented by Sonnentrucker et al. (2018). Let’s emphasize that our sample is twice as big as that in the latter paper. Anyway, the mutual correlations between the abovementioned DIBs are never as tight as that between 6614 and 6196 DIBs (Krełowski et al., 2016).
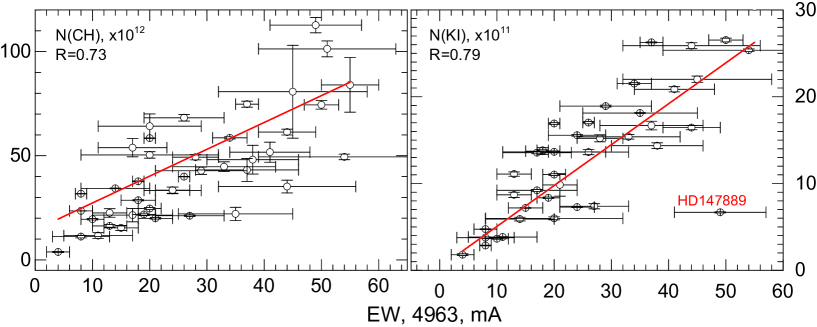
Sonnentrucker et al. (2018) divided the observed DIBs into the sets related to either atomic or molecular gas. The last one was considered as the environment for the 4963 DIB carrier. To verify this we related the column densities of the Ki 7699 Å line and the CH 4300.3 Å molecular feature to this band strength. Weighted fits, shown in Fig. 10, have the slope’s standard error 0.06 for K column densities versus 4963 EWs and 0.19 for CH column densities versus 4963 EWs. As seen in Fig. 10 the 4963 DIB correlates better with the atomic feature than with the molecular one. The former would be much better if not the specific object — HD147889. It is hard to say why the Ki line is so weak in the spectrum of this star. It was, however, verified in a few spectra from different instruments and thus is real. Anyway Fig. 10 creates some doubts on whether the 4963 carrier is really situated in molecular gas rather than in atomic gas. On the other hand, Thorburn et al. (2003) marked DIB 4963 as so-called C2-DIB correlating with the abundance of the interstellar C2 molecule. However, this conclusion was questioned by Galazutdinov et al.(2006) where the authors estimated the correlation coefficient as low as 0.56 for 20 measurements. Recently, Elyajouri et al. (2018) estimated the correlation between intensities of 18 C2-DIB including DIB 4963 and reported the correlation level for it as high as 0.95. The estimation is based on a rather small number of measurements thus the significance of the attribution of DIB 4963 as a C2-DIB remains low.
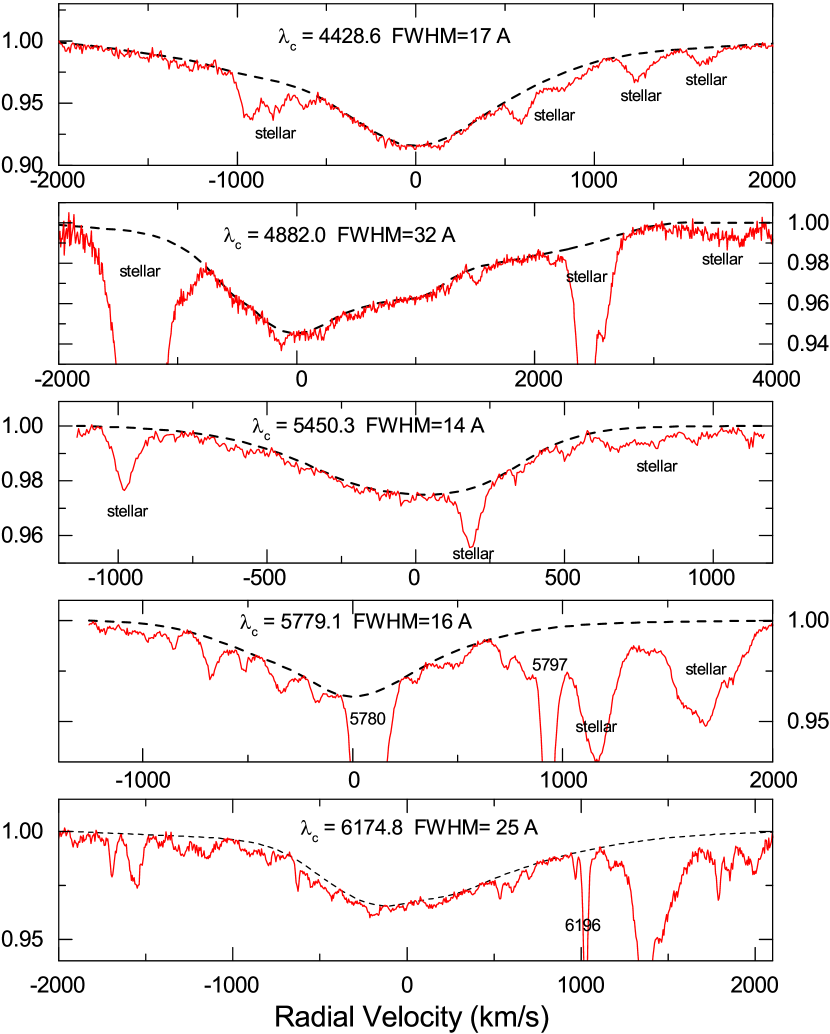
In Fig. 11 we provide the general average of all measured profiles of broad diffuse bands with estimated FWHM and the rest interstellar wavelength position. A good question is: where is the center of very asymmetric DIB4882? As it is shown in Fig. 11, we attributed the rest wavelength position to the deepest part of the feature’s profile, namely at 4882.0 Å. Thus, this diffuse band is a holder of a very extended right (red) wing with a rather sharp cut on the left (blue) wing that mimics the behavior of well-known bands of simple molecules. The average FWHM of this band, 32 Å makes it the broadest feature of the sample. Other bands’ central wavelengths and FWHM (given in the parentheses) are 4428.6 (17 Å), 5450.3 (14 Å), 5779.1 (16 Å) and 6174.8 (25 Å). The variability of the FWHM from object to object (Table 1) can be explained by the following reasons: (i) due to the shallowness of the broad features, the FWHM is very sensitive to the continuum normalization uncertainties and the position of the deepest point of the profile. The situation is more complex if the S/N ratio is low and in cases of severe stellar contamination. (ii) The FWHM may grow with the increasing the number of populated transitions of carrier molecule, i.e. the variability of the FWHM may be of physical origin.
| Star | EW(4963) | EW(5780) | EW(6284) | EW(6614) | N(CH)E12 | N(Ki)E11 |
|---|---|---|---|---|---|---|
| BD+404220 | 5415 | 75223 | 187999 | 3199 | 49.441.34 | 25.360.15 |
| BD-134923 | 379 | 52627 | 119474 | 22111 | 43.195.49 | 16.680.50 |
| BD-134927 | 5112 | 49236 | 94895 | 25418 | 101.33.80 | 30.990.35 |
| BD-134928 | 3510 | 41829 | 959113 | 21125 | 22.083.16 | 18.120.05 |
| BD-134929 | 4412 | 44239 | 983103 | 22022 | 35.213.06 | 25.880.34 |
| CygOB_7 | 4513 | 75445 | 1852124 | 32522 | 80.7422.29 | 22.010.37 |
| CygOB_8 | 417 | 75130 | 183982 | 35622 | 51.704.80 | 20.860.30 |
| CygOB11 | 388 | 93224 | 2276172 | 38521 | 48.116.90 | 14.360.33 |
| CygOB12 | 90375 | 2404160 | 38417 | 46.470.34 | ||
| Hersch36 | 2012 | 46335 | 67671 | 17234 | 50.401.56 | 5.990.17 |
| 15785 | 245 | 39425 | 84565 | 2159 | 33.351.58 | 15.560.10 |
| 24912 | 116 | 16323 | 43812 | 7613 | 11.671.39 | 3.840.03 |
| 34078 | 209 | 17112 | 50129 | 679 | 64.205.88 | 13.650.10 |
| 73882 | 81 | 1467 | 41448 | 547 | 31.750.11 | 2.860.04 |
| 76341 | 146 | 16332 | 37771 | 7212 | 34.330.15 | 5.900.21 |
| 78344 | 372 | 132361 | 2779 | 74.781.43 | 26.260.05 | |
| 80077 | 503 | 1727177 | 2965 | 74.442.04 | 26.530.21 | |
| 147165 | 42 | 2449 | 43838 | 563 | 3.810.27 | 1.800.10 |
| 147888 | 192 | 24822 | 26787 | 8313 | 21.840.57 | 8.350.09 |
| 147889 | 498 | 37113 | 43522 | 1799 | 112.703.71 | 6.680.07 |
| 148379 | 133 | 4138 | 103532 | 1747 | 22.532.06 | 11.090.25 |
| 149038 | 85 | 23028 | 51396 | 9313 | 11.160.60 | 3.760.09 |
| 149404 | 183 | 40212 | 75233 | 1827 | 28.630.32 | 13.730.40 |
| 148937 | 177 | 35919 | 99848 | 14611 | 21.473.18 | 9.210.11 |
| 149757 | 82 | 604 | 17415 | 414 | 23.520.04 | 4.740.04 |
| 152233 | 133 | 22711 | 44440 | 827 | 16.300.65 | 8.700.30 |
| 152235 | 181 | 38519 | 88259 | 1327 | 37.700.20 | 13.820.07 |
| 152249 | 153 | 2428 | 58534 | 887 | 15.361.22 | 7.190.05 |
| 154368 | 201 | 2188 | 33636 | 1324 | 58.450.10 | 16.910.10 |
| 154445 | 102 | 2019 | 36133 | 1055 | 19.530.39 | 3.640.06 |
| 157038 | 276 | 41616 | 121227 | 1666 | 21.200.31 | 7.380.30 |
| 163800 | 243 | 25512 | 47778 | 1187 | 33.461.48 | 7.280.05 |
| 166734 | 343 | 6947 | 142054 | 4039 | 58.600.52 | 21.510.11 |
| 168112 | 298 | 53521 | 118362 | 26510 | 42.801.77 | 18.920.11 |
| 168607 | 445 | 80317 | 187639 | 3938 | 61.361.41 | 16.440.24 |
| 168625 | 267 | 81116 | 173741 | 4496 | 68.241.58 | 13.620.30 |
| 169454 | 261 | 47417 | 122753 | 2159 | 39.960.11 | 17.020.13 |
| 179406 | 213 | 16317 | 29048 | 947 | 19.950.36 | 9.841.30 |
| 183143 | 284 | 73795 | 190395 | 3608 | 49.301.29 | 15.210.40 |
| 185859 | 202 | 30220 | 39089 | 21722 | 24.670.52 | 11.030.10 |
| 204827 | 555 | 23615 | 40539 | 1729 | 84.0013.10 | 30.350.20 |
| 208501 | 176 | 24838 | 52495 | 12912 | 53.864.36 | 13.550.12 |
| 319703 | 339 | 57324 | 143883 | 22514 | 44.742.34 | 15.380.26 |
4 Discussion
Our conclusions do not always agree with those of Sonnentrucker et al. (2018). In many cases we can confirm the latter: most of the mutual correlations between different DIBs look very similar. Thus we confirm the existence of strong correlation between a broad 6175 DIB and two medium 5780 and 6284 ones where the Pearson correlation coefficients are 0.84 and 0.87, respectively. This may confirm that they have the same molecular carrier (McCall et al., 2010). It is worth mentioning that our paper (Krełowski et al., 2016) demonstrates examples of evidently different 6196 vs. 6614 strength ratios and thus it is difficult to state that any two DIBs are of common origin.
However, we do not confirm a poor correlation (between the 6175 DIB and E(BV)(r=0.57) of Sonnentrucker et al. (2018) versus r=0.89 in the present paper, as well as too low of a degree of correlation (r = 0.01 in Sonnentrucker et al. (2018)) between 6175 and 4963 DIBs, it is 0.62 in our case.
It is also rather risky to divide the observed DIBs in between of atomic and molecular gas clouds. It is clear from Fig. 10 for the case of the relatively weak and narrow diffuse band at 4963 Å, so-called C2 DIB. The figure demonstrates a better relation between this DIB and the atomic Ki, not the CH molecule, as it could be inferred, e.g. from the Sonnentrucker et al. (2018), where, on the basis of poor correlation between the 6175 and 4963 diffuse bands, the authors suggest an atomic gas environment for DIB 6175.
The current list of the observed molecules in ISM is available at
https://www.cv.nrao.
edu/{̃}awootten/allmols.html. The most numerous
group among them are two- and three-atomic molecules. An attempt to fit
vibrational contours of the molecules to the very broad DIBs results in
the following assumptions:
-
1.
4430 CuCl D–X (0, 1) medium-strong band with a red-degraded double head at 4433.8; 4881 CuCl B–X (0, 0) strong band with a red degraded head at 4881.5. It is very interesting that the CuCl bands occur rather frequently as impurities in other spectra, especially in flames, fluorescence, absorption, discharge tubes, and also in arc. They also appear when CuCl is introduced into active nitrogen (Rao, Asundi & Brody, 1962); however, the very low abundances of both elements make this hypothesis uncertain.
-
2.
5450 BO2, headless and narrow band (maximum intensity at 5450). The waves of the bands are observed when boric acid is introduced into an arc or flame, or when finally divided boron is burnt (Kasan & Milliken, 1961); once again the abundance of boron makes the hypothesis unlikely.
-
3.
5779 SrF, yellow system (B–X) (0, 0) band with a close double heads at 5779.5 in branch and 5772.0 in branch (Novikov & Gurvich, 1967); it also looks like a chance coincidence of spectral features since the abundances of strontium and fluor are very rare in the space;
-
4.
6175 FeO, orange (A0, 2ii) strong band of A system (red degraded head at 6180.5) (Pears & Gaydon, 1984). In this case both elements are quite abundant which makes this hypothesis much more likely than the former ones.
Among them, only the existence of the FeO molecule has been confirmed in the ISM (https://cdms.astro.uni-koeln.de/cdms/portal/). Also, the abundance of oxygen and iron is quite high in comparison to rather exotic other elements listed in the first three cases. Thus only the last item may have some real meaning. Thus the molecular spectroscopy in its present state gives us no suggestion as to what the carriers of broad DIBs may be.
References
- Beals & Blanchet (1938) Beals, C. S. & Blanchet, G. H. 1938, MNRAS, 98, 398
- Cordiner, Linnartz, Cox et al. (2019) Cordiner, M. A., Linnartz, H., Cox, N. L. J. et al. 2019, ApJ, 875, 28
- Danks (1980) Danks, A.C., 1980, PASP, 92, 52
- Dekker et al. (2000) Dekker, H., D’Odorico, S, Kaufer, A., Delabre, B. & Kotzlowski, H., 2000, Proc. SPIE 4008, p. 534
- Elyajouri et al. (2018) Elyajouri et al. 2018, A&A, 616, 143
- Fan et al. (2019) Fan H., Hobbs L.M., Dahlstrom J.A., Welty D.E., York D.G., Rachford B., Snow T.P., Sonnentrucker P., Baskes N., Zhao G., 2019, ApJ, in press
- Galazutdinov et al. (2000) Galazutdinov, G. A., Musaev, F. A., Krelowski, J., Walker, G. A. H., 2000, PASP, 112, 648
- Galazutdinov et al. (2017) Galazutdinov, G. A., Lee, Jae-Joon, Han, Inwoo, Lee, Byeong-Cheol, Valyavin, G. & Krełowski, J. 2017, MNRAS, 467, 3099
- Galazutdinov et al. (2017) Galazutdinov, G. A., Shimansky, V. V., Bondar, A. et al. 2017, MNRAS, 465, 3956
- Galazutdinov & Krełowski (2017) Galazutdinov, G. A.; Krelowski, J., 2017, Acta Astronomica, 67, 2, 159
- Gammelgaard (1975) Gammelgaard, P., 1975, å, 43, 85
- Greenstein & Aller (1950) Greenstein, J. L. & Aller, L. H., 1950, ApJ, 111, 328
- Heger (1922) Heger, M. L. 1922, Lick Obs. Bull., 10, 146
- Herbig (1966) Herbig, G. H., 1966, Z. fuer Ap., 64, 512
- Herbig (1967) Herbig, G.H. 1967, IAUS, 31, 85
- Herbig (1975) Herbig, G.H. 1975, ApJ, 196, 129
- Hobbs et al. (2008) M. Hobbs, D. G. York, T. P. Snow, et al., 2008, ApJ, 680, 1256
- Houziaux, Nandy & Morgan (1980) Houziaux, L., Nandy, K. & Morgan, D. H., 1980, MNRAS, 138, 495
- Isobe et al. (1986) Isobe, S., Sasaki, G., Norimoto, Y. & Takahashi, J. 1986, PASJ, 38, 511
- Jenniskens & Desert (1994) Jenniskens, P.; Desert, F. -X. 1994, A&AS, 106, 39
- Kasan & Milliken (1961) Kasan, W. E. and Milliken, R. C., 1961, J. Chem. Phys. 39, 1738
- Kaufer et al. (1999) Kaufer, A. et al. 1999, The Messenger 95, 8
- Kim et al. (2007) Kim, K.-M., Han, I., Valyavin, G. G., et al. 2007, PASP, 119, 1052
- Krełowski (2018) Krełowski J., 2018, PASP, 130, 1001
- Krełowski et al. (2016) Krełowski, J., Galazutdinov, G. A., Strobel, A. & Mulas, G., 2016, Acta Astronomica, 66, 469
- Krełowski et al. (2016) Krełowski, J., Galazutdinov, G. A., Bondar, A. & Beletsky, Y., 2016, MNRAS, 460, 2706
- Krełowski et al. (1987) Krelowski, J., Walker, G. A. H., Grieve, G. R. & Hill, G. M. 1987, ApJ, 316, 449
- Lanz & Hubeny (2003) Lanz, T.; Hubeny, I., 2003, ApJS, 146, 417
- Lanz & Hubeny (2007) Lanz, T.; Hubeny, I., 2007, ApJS, 169, 83
- Mayor et al. (2003) Mayor, M., Pepe, F., Queloz, D., Bouchy, F. et al. 2003, The Messenger 114, 20
- McCall et al. (2010) McCall, B. J., Drosback, M. M., Thorburn, J. A., York, D. G., Friedman, S. D., Hobbs, L. M., Rachford, B. L., Snow, T. P., Sonnentrucker, P., Welty, D. E., 2010, ApJ, 708, 1628
- Merrill & Humason (1938) Merrill, P. W., Humason, M. L., 1938, PASP, 50, 212
- Novikov & Gurvich (1967) Novikov, M. M. and Gurvich, L. V., 1967, Opt. Spectrosc., 22, 395
- Pears & Gaydon (1984) Pears, R. W. B and Gaydon, A. G., “The Identification of Molecular Spectra”, Chapman and Hall, London, New York, 1984
- Piskunov et al. (1995) Piskunov et al., 1995, A&AS, 112, 525
- Rao, Asundi & Brody (1962) Rao, P. R., Asundi, R. K. and Brody, J. K., 1962, Canad. J. Phys., 40, 42 and 1443
- Rudkjøbing (1970) Rudkjøbing, M., 1970, Ap&SS, 6, 157
- Sonnentrucker et al. (2018) Sonnentrucker, P., York, B., Hobbs, L. M., Welty, D. E. et al. 2018, ApJS, 237, 40
- Thorburn et al. (2003) Thorburn, J. A., Hobbs, L. M., McCall, B. J., Oka, T., Welty, D. E., Friedman, S. D., Snow, T. P., Sonnentrucker, P., York, D. G., 2003, ApJ, 584, 339
- Tuairisg et al. (2000) Tuairisg, S. Ó., Cami, J., Foing, B. H., et al. 2000, A&AS, 142, 225
- Vollmann & Eversberg (2006) Vollmann, K., Eversberg, T., 2006, Astron. Nachr., 327, 862
Appendix A Appendix
A.1 Profiles of 4430 DIB
See pages 1-6 of 4430.pdf
A.2 Profiles of 4882 DIB
See pages 1-3 of 4882.pdf
A.3 Profiles of 5450 DIB
See pages 1-5 of 5450.pdf
A.4 Profiles of 5779 DIB
See pages 1-6 of 5778.pdf
A.5 Profiles of 6175 DIB
See pages 1-5 of 6170.pdf