Chandra Observations of NGC 7212: Large-Scale Extended Hard-Xray Emission
Abstract
Recent observations of nearby Compton thick (CT) active galactic nuclei (AGNs) with Chandra have resolved hard ( keV) X-ray emission extending out from the central supermassive black hole to kiloparsec scales, challenging the long-held belief that the characteristic hard X-ray continuum and fluorescent Fe K lines originate in the inner parsec due to the excitation of obscuring material. In this paper we present the results of the most recent Chandra ACIS-S observations of NGC 7212, a CT AGN in a compact group of interacting galaxies, with a total effective exposure of 150 ks. We find 20% of the observed emission is found outside of the central kiloparsec, with 17% associated with the soft X-rays, and 3% with hard X-ray continuum and Fe K line. This emission is extended both along the ionization cone and in the cross-cone direction up to 3.8 kpc scales. The spectrum of NGC 7212 is best represented by a mixture of thermal and photoionization models that indicate the presence of complex gas interactions. These observations are consistent with what is observed in other CT AGN (e.g., ESO 428G014, NGC 1068), providing further evidence that this may be a common phenomenon. High-resolution observations of extended CT AGN provide an especially valuable environment for understanding how AGN feedback impacts host galaxies on galactic scales.
1 Introduction
At the center of essentially every massive galaxy is a supermassive black hole (SMBH). These SMBHs emit enormous amounts of energy as active galactic nuclei (AGNs) powered by accretion onto the black hole (see Kormendy & Ho 2013; Padovani et al. 2017 for a review). In the AGN unified model energy is reflected, transmitted, and absorbed as it propagates out from the central nucleus, leaving traces of the AGN geometry on the observed multiwavelength emission (e.g., Lawrence & Elvis 1982; Antonucci 1993; Urry & Padovani 1995; Netzer 2015).
Until recently, it was believed that the characteristic hard X-ray continuum and fluorescent Fe K lines typical of an AGN could only originate from the excitation of an obscuring material in the inner parsecs. In this classical picture, the central SMBH and accretion disk are closely surrounded by an optically thick, molecular torus-like structure. This torus acts as an efficient screen such that radiation propagates along the opening angle as an ionization cone via direct transmission and reflection off of the obscuring material, while being completely attenuated in the cross-cone plane. Recent observations, however, have uncovered the presence of hard X-ray emission on kiloparsec scales in the direction of the ionization cone (e.g., Circinus, Arévalo et al. 2014; NGC 1068, Bauer et al. 2015; ESO 428G014, Fabbiano et al. 2017) and cross-cone (e.g., ESO 428G014 Fabbiano et al. 2018a, b, 2019) in nearby Compton thick (CT) AGN. The high column densities ( cm-2) of these CT AGN uniquely allow for these types of investigations as the obscuration depletes the X-ray emission of the central point-like source, revealing the extended material.
In this paper, we present the results of an investigation into the presence of extended hard X-ray emission in NGC 7212,111NGC 7212 is also called IRAS 22045+0959, CGCG 428-032, MCG +02-56-011, and UGC 11910. a nearby (; Mpc) Seyfert 2 galaxy with a heavily obscured AGN (; ; Hernández-García et al. 2015) located in a compact group of three interacting galaxies (e.g., Muñoz et al. 2007). NGC 7212 is part of a sample of nearby CT AGN in normal Seyfert 2 galaxies (as classified by their optical emission line ratios) with bright [O III] 5007 cores, and no history of nuclear starbursts (Levenson et al. 2006). Other CT AGN in this sample have already been mentioned as exhibiting extended X-ray emission on kiloparsec scales (e.g., NGC 1068, Bauer et al. 2015; ESO 428G014, Fabbiano et al. 2017, 2018a, 2018b, 2019), but NGC 7212 is the most distant of all of these nearby sources and thus is a valuable addition to this recent work in establishing the ubiquity of extended hard X-ray emission.
Previous observations of NGC 7212 have found kiloparsec-scale, diffuse, extended optical narrow line emission (ENLR; e.g., Wasilewski 1981; Falcke et al. 1998; Schmitt et al. 2003; Cracco et al. 2011; Congiu et al. 2017), and polarized optical broad line emission (e.g., Tran 1995a, b; Veilleux et al. 1997). It has a compact double radio source (extent ) with moderate radio power aligned with the elongated narrow line emission (e.g., P.A. , Falcke et al. 1998; Drake et al. 2003). In the X-rays, NGC 7212 has previously been established as nonvariable with a complex X-ray spectrum exhibiting the characteristic features of a CT AGN (e.g., Risaliti et al. 2000; Guainazzi et al. 2005; Bianchi et al. 2006; Levenson et al. 2006; Singh et al. 2011; Severgnini et al. 2012; Hernández-García et al. 2015; Marchesi et al. 2018).
To this extensive multiwavelength coverage, we have added deep X-ray observations of NGC 7212 for a cumulative Chandra exposure of 149.87 ks, in order to piece together a detailed picture of the morphological and spectral properties of this CT AGN. We describe these observations and the data reduction in Section 2, and report on the spatial and spectral properties of the nuclear and extended emission in Sections 3 and 4, respectively. In Section 5 we discuss the results of the spectral analysis and the implications of an extended hard X-ray component. Our findings and conclusions are summarized in Section 6.
2 Observations and Analysis
| ObsID | Instrument | (ks) | PI | Date | x (px) | y (px) |
|---|---|---|---|---|---|---|
| 4078 | ACIS-S | 19.90 | Kraemer | 2012 Nov 15 | -1.196 | 0.466 |
| 20372 | ACIS-S | 49.42 | Fabbiano | 2018 Aug 09 | ||
| 21668 | ACIS-S | 1.38 | Fabbiano | 2018 Aug 13 | 0.318 | 0.026 |
| 21672 | ACIS-S | 27.21 | Fabbiano | 2018 Sep 12 | -1.709 | -0.386 |
We obtained three Chandra ACIS-S observations of NGC 7212 (ObsIDs: 20372, 21668, 21672; P.I. Fabbiano) and combined these observations with an additional archival Chandra ACIS-S observation of this galaxy (ObsID: 4078; P.I. Kraemer) to generate a dataset with a cumulative effective exposure time of 147.82 ks (Table 1). These observations were then reprocessed and analyzed using CIAO 4.11 and CALDB 4.8.2 to enable subpixel analysis (Tsunemi et al. 2001; Wang et al. 2011). Each individual observation was inspected for high background flares () and all were deemed acceptable.
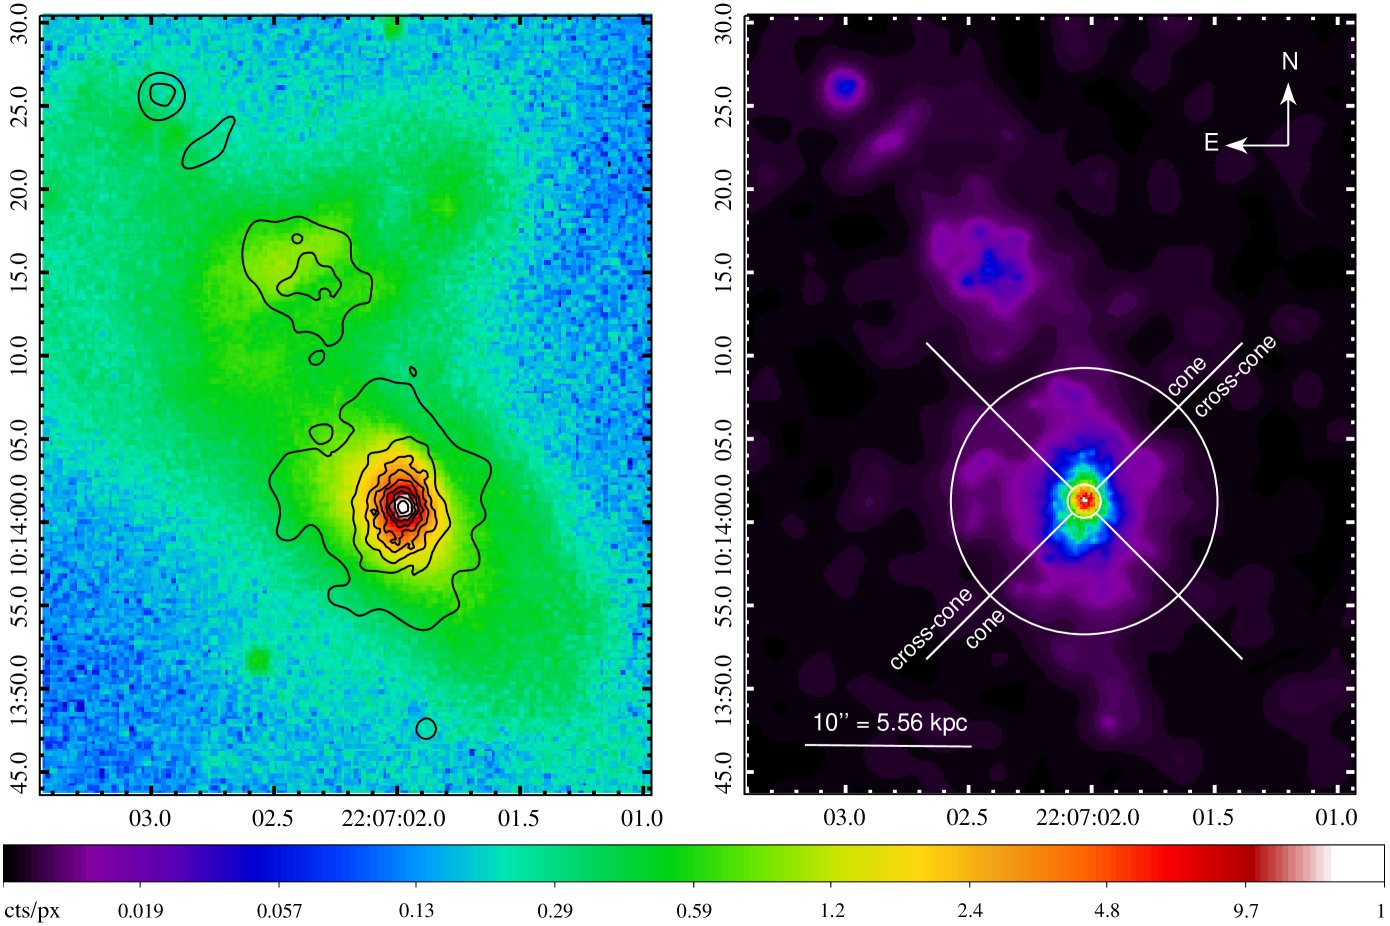
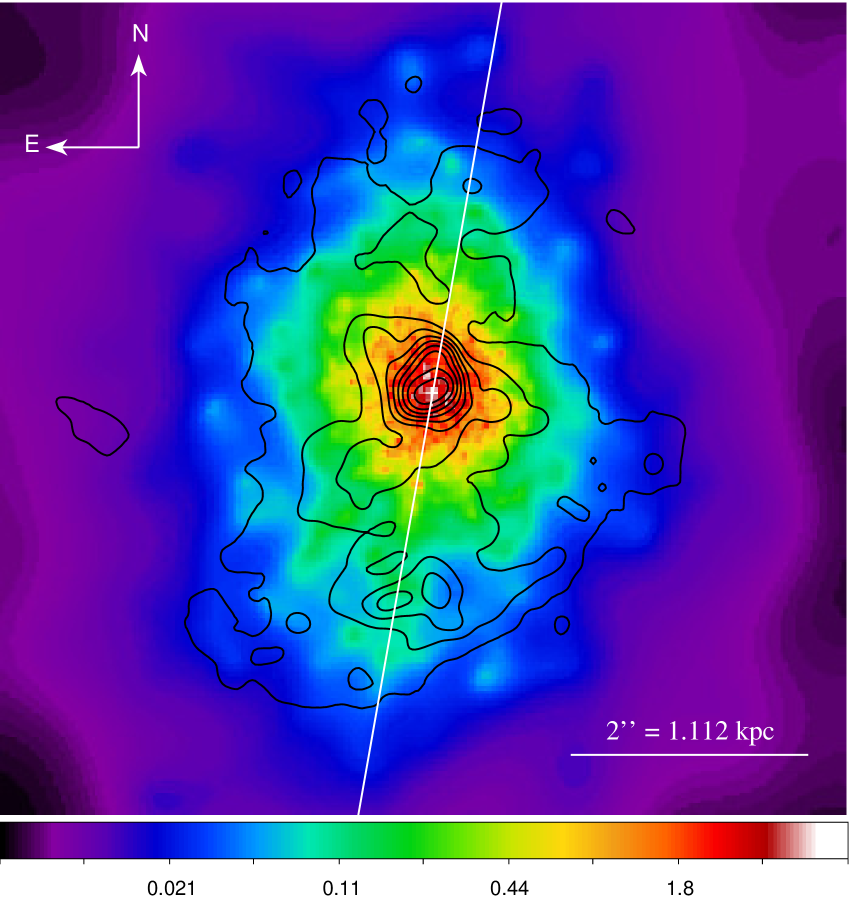
All four observations were exposure corrected and merged, following the CIAO merge threads,222http://cxc.harvard.edu/ciao/threads/combine/333http://cxc.harvard.edu/ciao/threads/merge_all/ using ObsID 20372 as the reference frame centered at (J2000) RA = 22:07:02.03 (3314530.44), decl. = +10:14:01.27 (10141.27). We first visually inspected each observation and determined that manually shifting to the reference image would allow for the best alignment. The final shifts (in native ACIS pixels) are listed in Table 1. The full-band (0.3-7.0 keV) merged image of NGC 7212 and its companion interacting galaxies are shown in Figure 1 (right). Contours corresponding to this merged 0.3-7.0 keV image are also shown overlaid on a g-band Pan-STARRs deep-stack image in Figure 1 (left). We limited our analysis to the 0.3-7.0 keV band, despite typically reliable Chandra coverage up to 8.0 keV, due to significant noise.
3 Spatial Analysis
|
|
|
|
|
|
|
|
|
|
|
|
|
|
|
|
|
|
|
|
| Energy | 8″circular | S - N | W - E | |||||
|---|---|---|---|---|---|---|---|---|
| (keV) | Counts (Err) | Counts (Err) | Counts (Err) | |||||
| 0.3-1.5 | 442.3 | (21.0) | 293.8 | (17.1) | 148.5 | (12.2) | ||
| 1.5-3.0 | 238.3 | (15.4) | 177.3 | (13.3) | 61.0 | (7.8) | ||
| 3.0-4.0 | 62.0 | (7.9) | 44.3 | (6.7) | 17.7 | (4.2) | ||
| 4.0-5.0 | 31.7 | (5.6) | 25.3 | (5.0) | 6.4 | (2.5) | ||
| 5.0-6.0 | 23.7 | (4.9) | 13.3 | (3.7) | 10.4 | (3.2) | ||
| 6.1-6.5 | 15.2 | (3.9) | 11.0 | (3.3) | 4.2 | (2.0) | ||
| 0.3-7.0 | 812.0 | (28.5) | 570.2 | (23.9) | 241.8 | (15.6) | ||
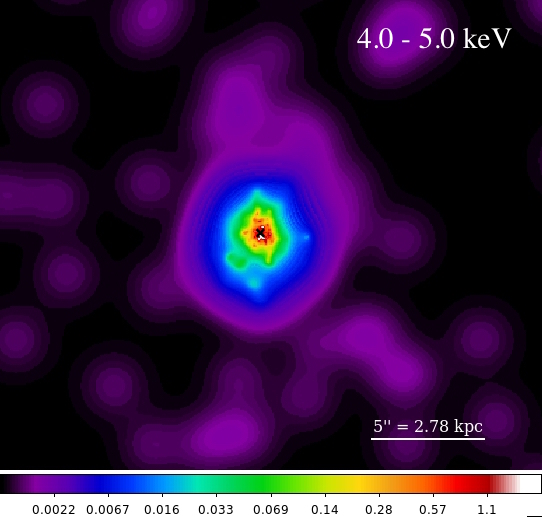
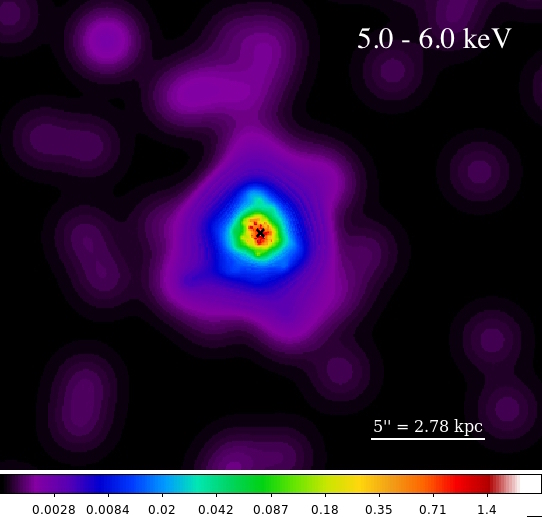
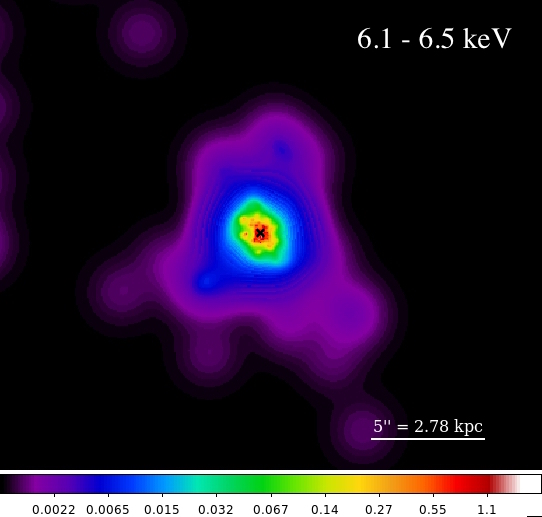
The resolution achieved by Chandra is unmatched in the X-rays and provides a unique opportunity to study the detailed morphological characteristics of NGC 7212 on subarcsecond scales (1″ = 556 pc). Using the CIAO image analysis tools available in SAOImage ds9444http://ds9.si.edu, we investigated the spatial characteristics of NGC 7212 by slicing the X-ray emission into six energy bins and generating corresponding images and radial profiles, following the methodology in Fabbiano et al. (2018a).
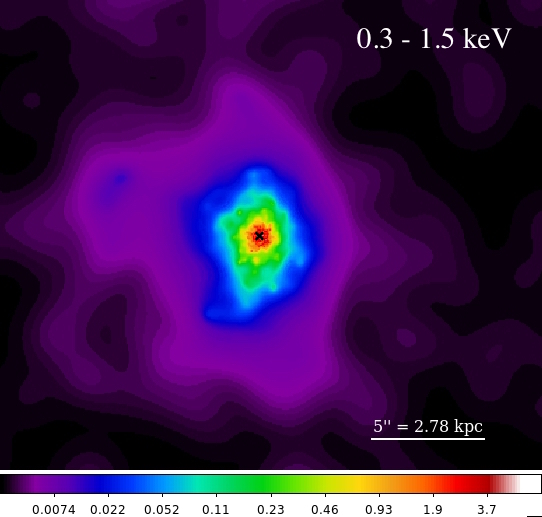
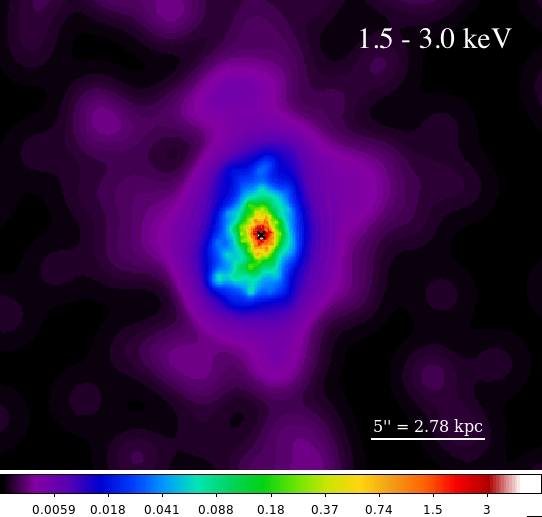
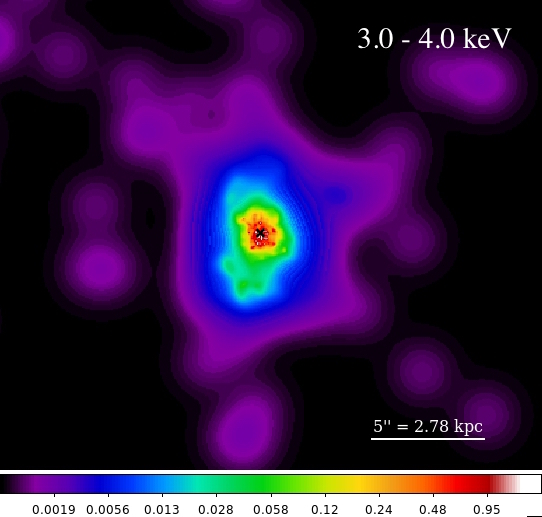
The images were built from subpixel data and adaptively smoothed using dmimgadapt in the ds9 CIAO package555http://cxc.harvard.edu/ciao/gallery/smooth.html for a pixel scale with 5 counts under the kernel for 30 iterations (Figure 2). The smoothing parameters were selected to optimize the details of the extended diffuse emission. Each energy sliced image reveals a bright nucleus with fainter diffuse large-scale emission. Focusing on the top two panels of Figure 2, there is obvious kiloparsec-scale extended emission in the soft energy bands ( keV). Likewise, at higher energies, focusing in particular on the keV regime where we expect strong Fe K fluorescence (bottom, right panel), extended diffuse emission is present, albeit on smaller scales than in the soft X-rays.
From the subpixel data that was used to generate the smoothed images, we extracted radial surface brightness profiles to quantify the significance of the extended emission. Based on an azimuthal projection of the surface brightness radiating outward from the central nucleus, we slice our data into two cone regions opening outward from the central nucleus in the southnorth (cone) and westeast (cross-cone) directions (Figure 1; right). Interestingly, NGC 7212 does not exhibit a strong azimuthal dependence, unlike what has been found for many other extended hard X-ray sources (e.g., NGC 1068, Bauer et al. 2015; ESO 428G014, Fabbiano et al. 2018a). Thus we define our cone angles by opposing angle wedges centered around the cardinal points (e.g., the southnorth cone is defined by angles that are around the north and south axes). The cone opening angles that we assume in this work are a conservative estimate.
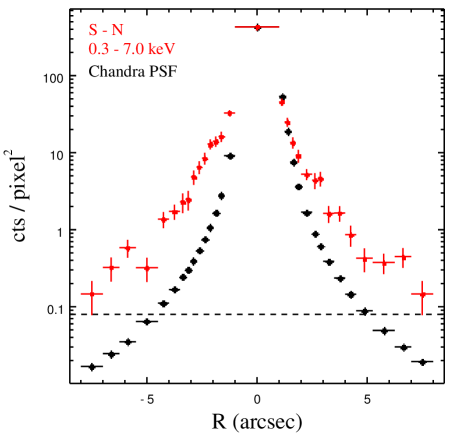
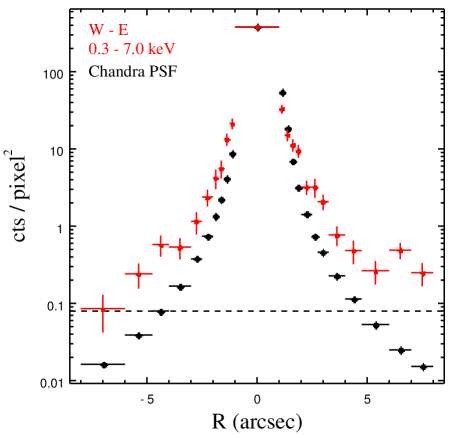
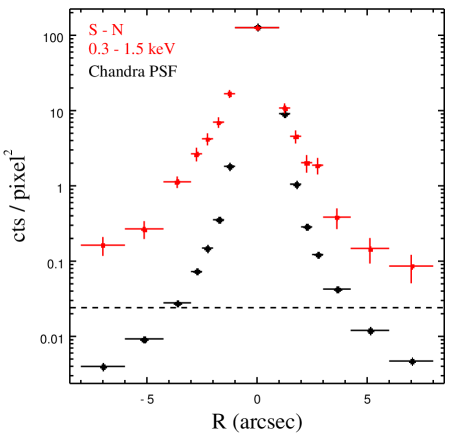
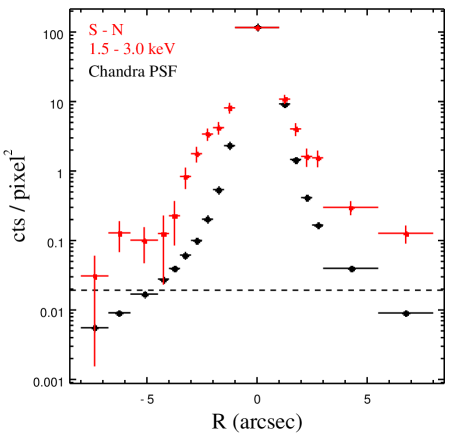
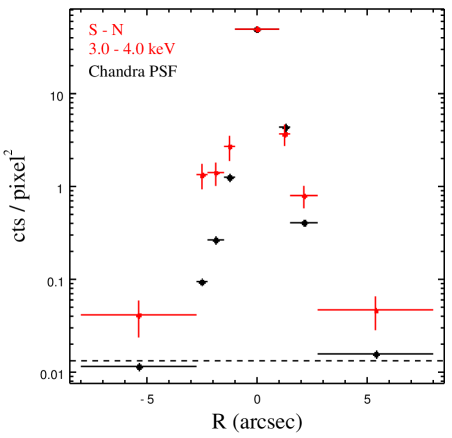
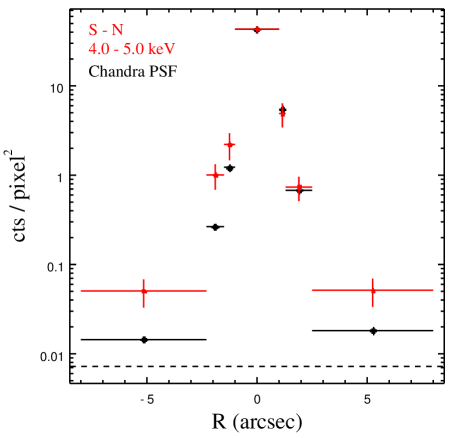
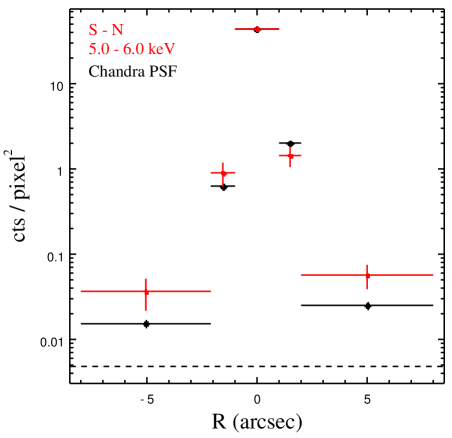
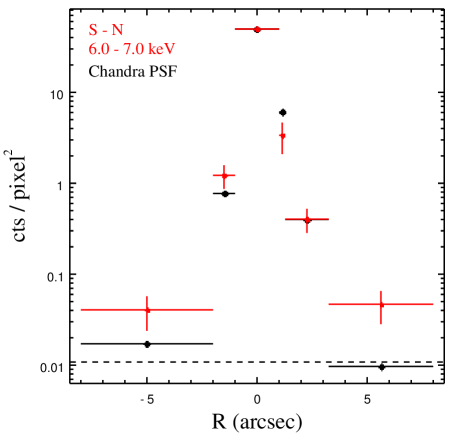
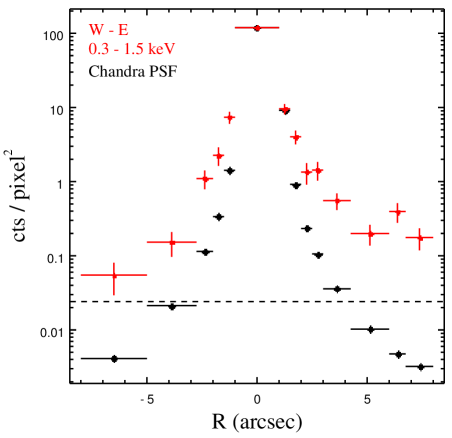
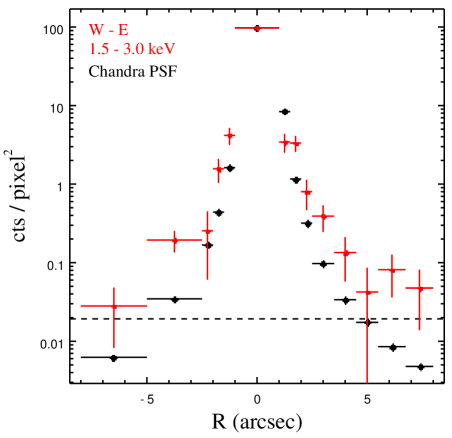
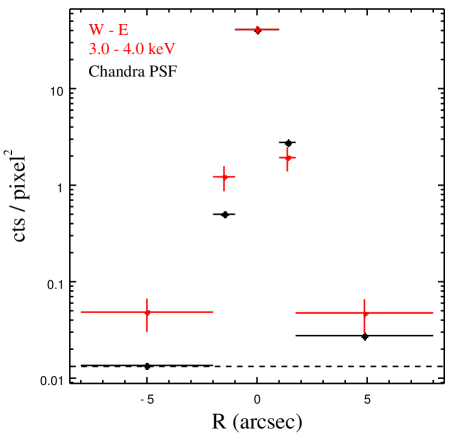
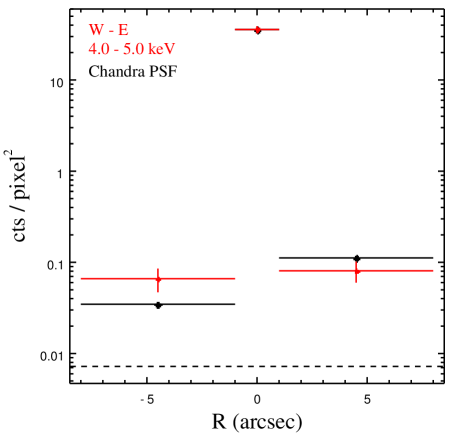
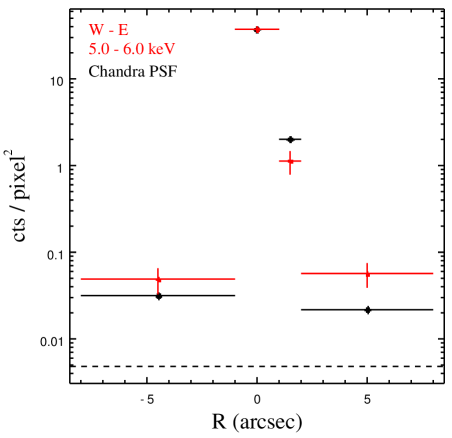
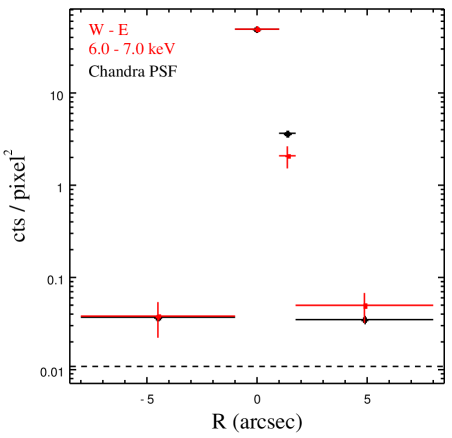
Concentric annuli were generated out to 8.0″ (4.448 kpc) for each energy band in SAOImage ds9, starting with a width of 1.0″ (0.556 kpc) and increasing as necessary in the outer regions to maintain a minimum of 10 counts. These extracted surface brightness profiles were then background subtracted and compared to a set of Chandra Point-source Functions (PSF) generated with ChaRT666http://cxc.harvard.edu/ciao/PSFs/chart2/ and MARX 5.4.0777https://space.mit.edu/cxc/marx/ following the CIAO PSF simulation thread888http://cxc.harvard.edu/ciao/threads/psf.html999http://cxc.harvard.edu/ciao/threads/marx_sim/ for the given centroid positions and energy bands (Figure 3). The PSF models were normalized to the source counts in the central 1.0″ circular region. Within the 8.0″ radius and excluding the nuclear region (inner 1.0″ circle), the full energy band ( keV) contains net excess counts above the Chandra PSF in the southnorth cone and net excess counts in the westeast cross-cone (Figure 3).
We further explore these excess counts as a function of energy in each cone region (Table 2). Of note, the high energy band where we would expect to see Fe K fluorescence ( keV) contains a significant excess of total counts. The radial profiles for the southnorth and westeast regions as a function of energy are shown in Figures 4 and 5, respectively. In both the north and east quadrants, the surface brightness falls below the PSF in the inner parsec (0.556 kpc). We do not expect this to be caused by pileup, as we estimate using PIMMS101010PIMMS v4.10; http://cxc.harvard.edu/toolkit/pimms.jsp less than 1% pileup for this source for both the individual and merged observations. Rather, this feature may be a consequence of CT obscuration or even strong nuclear absorption by a dust lane as suggested by optical observations along the northeast direction.
Outside of this feature, we find extended emission on kiloparsec scales (up to 8.0″ 4.5 kpc) in the cone and cross-cone directions, although less significant in the cross-cone region. Analyzing the surface brightness on larger azimuthal scales outside of the 8.0″ circular region becomes challenging due to possible contamination from the interacting group members, especially in the northern cone.
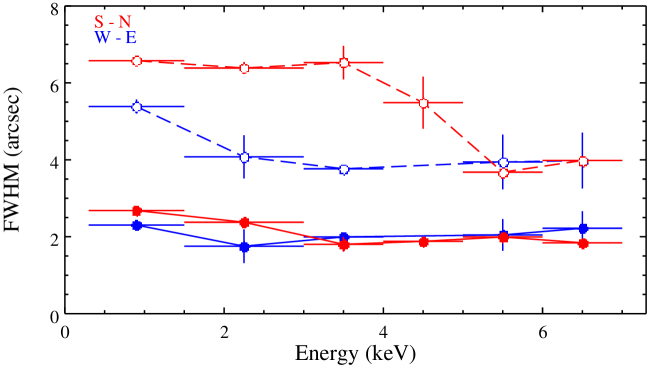
Following the methodology of Fabbiano et al. (2018a), we compare the extent of the diffuse emission in each energy bin by calculating the FWHM of the radial profiles in log space. This essentially normalizes the brightness in each energy band, minimizing the bias in the measured extent caused by higher signal-to-noise ratios. This is especially true at low energies where there are significantly more counts. We fit the radial profiles using a spline approximation, or for energies requiring wider bins (and therefore fewer points) we use a gaussian+polynomial curve. The errors (corresponding to ) are derived from a Monte Carlo error analysis driven by the uncertainty associated with the adaptive binning.
We find that the FWHM decl.reases slightly with increasing energy in the cone direction (as in Fabbiano et al. 2018a), but there is no significant trend in the FWHM with energy in the cross-cone direction (Figure 6; filled circles). The average width is consistent between the cone (red) and cross-cone (blue) directions, ″ (1.17 kpc) and ″ (1.20 kpc), respectively.
To better understand the extent of the surface brightness, we also calculate the width at 1% of the peak emission in each energy bin (Figure 6; open circles). Compared to the FWHM calculations, we find a larger discrepancy between the cone and cross-cone directions. Below 4 keV, the average width in the cone direction is ″ (3.66 kpc) compared to ″ (2.45 kpc) in the cross-cone direction. Above 4 keV, the 1% width drops to ″ (2.13 kpc) between 5.0 and 7.0 keV, and becomes consistent with the extent in the cross-cone direction. Similar trends in the surface brightness extent (as a function of energy) have been observed for ESO 428G014 (Fabbiano et al. 2018a), for which extended emission in both the cone and cross-cone direction are observed, including that the cross-cone extent of ESO 428G014 drops at lower energies compared to the cone direction.
4 Spectral Analysis
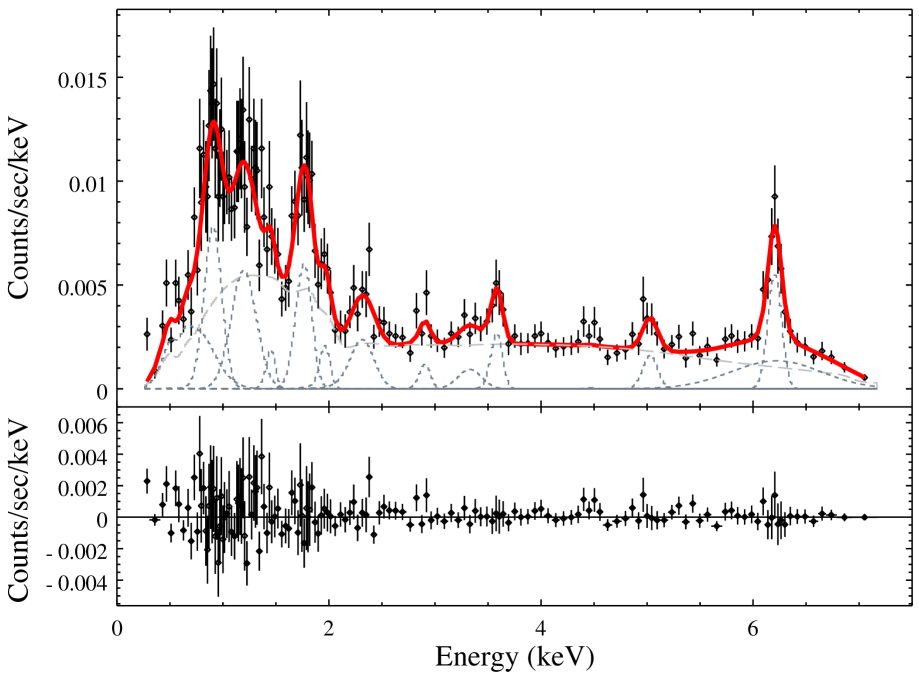
To characterize the extended X-ray emission, we extracted the spectrum of NGC 7212 for three regions centered on the peak counts at (J2000) RA = 22:07:02.03 (3314530.44), decl. = +10:14:01.27 (10141.27); (1) 8.0″ = 4.448 kpc circular region, (2) 1.5″ = 0.834 kpc nuclear region; and (3) 1.5″8.0″ annulus (Figure 7). The background was extracted from a surrounding, off-center, source-free region at (J2000) RA = 22:07:03.54 (3314553.00), decl. = +10:13:42.78 (101342.78) (Figure 7). We binned the spectra to have a minimum of 20 counts bin-1 in the 8.0″ circular region and 1.5″ nuclear region and a minimum of 10 counts bin-1 in the 1.5″8.0″ annulus region and fit them to models using Sherpa in the keV energy band. The keV spectra extracted from the 8.0″ circular region is shown in Figure 8. NGC 7212 has a complex soft excess, strong Fe K emission, and clear, distinct emission lines between 2 and 6 keV.
4.1 PEXRAV + Emission Line Models
We first fit the hard continuum in each region using a simple reflection PEXRAV model (fold_E=300; rel_refl=100; abund, Fe_abund=1; cosIncl=0.45) with power-law photon index (based on the NuSTAR/XMM best fits, Marchesi et al. 2018; and consistent with, e.g., Risaliti et al. 2000; Levenson et al. 2006; Hernández-García et al. 2015; Ricci et al. 2015; Koss et al. 2016), plus a gaussian emission line constrained to an energy range surrounding the Fe K keV line, with constant galactic absorption ( cm-2; Levenson et al. 2006). This simple power-law plus line model is consistent with the model components utilized in previous spectral fits of NGC 7212 (e.g., ASCA, Risaliti et al. 2000; XMM, Guainazzi et al. 2005; Hernández-García et al. 2015; CXC, Levenson et al. 2006; Hernández-García et al. 2015; NuSTAR, Koss et al. 2016; Marchesi et al. 2018), for which the median photon index is and the median equivalent width of the Fe K line is keV.
To this simple model we then systematically add unresolved emission lines, allowing the energy and amplitude to vary, while the redshift is kept frozen. We use a combination of fit statistics, significance of the emission line fluxes, and visual inspection of the residuals to justify the addition of another line. The best-fit emission line models are listed in Table 14.
For each region of interest, we find blended emission lines below 1.5 keV and distinct emission lines above 1.5 keV with the most significant lines at 1.8 keV (Si XIII) and at 6.4 keV where we expect to see the Fe K fluorescent line. There is a degree of uncertainty in the measured energies and amplitudes of the low energy blended lines, but they are consistent with lines (e.g., O VII, Ne IX, Mg XI) observed in other AGN spectra (e.g., Koss et al. 2015; Fabbiano et al. 2018a; Maksym et al. 2019) and identified in the NIST Atomic Spectra Database111111http://physics.nist.gov.
The keV spectrum extracted from the 8.0″ circular region is shown in Figure 8 with the best-fit PEXRAV and line models. In the hard X-rays (3.07.0 keV) and for all regions, we find the characteristic Fe K emission line. The Fe K emission is dominated by the neutral emission at 6.4 keV. The fit benefited from the addition of a broad weak emission line surrounding the neutral Fe line, potentially caused by neutral Fe wings or the presence of blended Fe XXV emission.
We also find strong, significant emission lines in the hard X-rays around 2.9, 3.6, and 5.2 keV (redshift corrected for the distance of NGC 7212). The presence of these lines is not expected for a typical CT AGN (e.g., Koss et al. 2015; Maksym et al. 2019) and presents an interesting challenge for line classification. Our best identifications for the 2.9 and 3.6 keV line are species of calcium fluorescence lines, or varieties of argon (Ar XVII, argon K fluorescence lines). The 5.2 keV emission line that appears to be confined to the inner nuclear region has not yet been identified. It is possible that we are observing the effects of cosmic spallation of the obscuring material such that vanadium K emission is enhanced (e.g., Skibo 1997; Turner & Miller 2010; Gallo et al. 2019), similar to observations of M51 (Xu et al. 2016). It is unlikely that this observed emission is due to the ACIS background, which is fairly well understood at these energies121212http://cxc.harvard.edu/cal/Acis.
| Counts | Norm. PEXRAV | () | ||
| Region | (error) | (ph cm-2 s-1) | Continuum + Lines | |
| 8.0″ circular region | 1289 (36) | 0.71 (155) | ||
| 1.5″ nuclear region | 625 (25) | 0.67 (218) | ||
| 1.5″8.0″ annulus | 664 (26) | 0.80 (86) | ||
| Region | Energy (keV) | Flux ( ph cm-2 s-1) | Significance () | Identification ( keV)151515Energies from NIST (physics.nist.gov); Koss et al. 2015; Maksym et al. 2019 |
| 8.0″ circular region | N VII Ly161616Lines blended in ACIS-S spectrum. These are tentative identifications. (0.500) O VII16 (0.569) | |||
| 1.5″ nuclear region | ||||
| 1.5″8.0″ annulus | ||||
| Fe XVII16 (0.826) | ||||
| Ne IX (0.905) Fe XIX (0.917, 0.922) | ||||
| Fe XX16 (1.241) Fe XXIV16 (1.129, 1.168) | ||||
| Mg XI (1.331, 1.352) Mg XII (1.472, 1.745) | ||||
| , | , | |||
| Si XIII (1.839, 1.865) | ||||
| Si XIV (2.005) | ||||
| S K (2.308) S XV (2.430) | ||||
| Ar K171717Lines in 3-6 keV are rarely observed in AGN. These are tentative line identifications. (2.958) | ||||
| Ar XVII17 (3.688) Ca K17 (3.691) | ||||
| 181818Lines at this energy do not fit into our current understanding of AGN emission. | ||||
| Fe K (6.442) | ||||
| Fe K wing16 Fe XXV16 (6.70) | ||||
4.2 Physical Models
Beyond understanding what emission lines are found in NGC 7212, it is possible to investigate the physical origin of the X-ray emission using more complex photoionization and thermal spectral models. We start building these physical models with the best-fit continuum + Fe K emission line spectral model for each region, as described in Section 4.1. To this we add a photoionization and/or thermal model, one component at a time, testing the fit statistics after each addition and estimating the improvement using the F-test (Tables 4, 6, 7; described in subsequent sections). Because the F-test has been shown to be unreliable in some cases (e.g., Protassov et al. 2002), we place more emphasis on the fit statistics and observed residuals. We first used purely photoionization and purely thermal models before attempting a mixture of the two. In situations where only small improvements to the quality of the fit were made by the addition of another component, we examined the residuals of the best fits to identify features that indicate the significance of the improvement (as is not sensitive to correlated residuals) to justify incorporating additional complexities.
|
|
|
|
4.2.1 N-component Photoionization Models
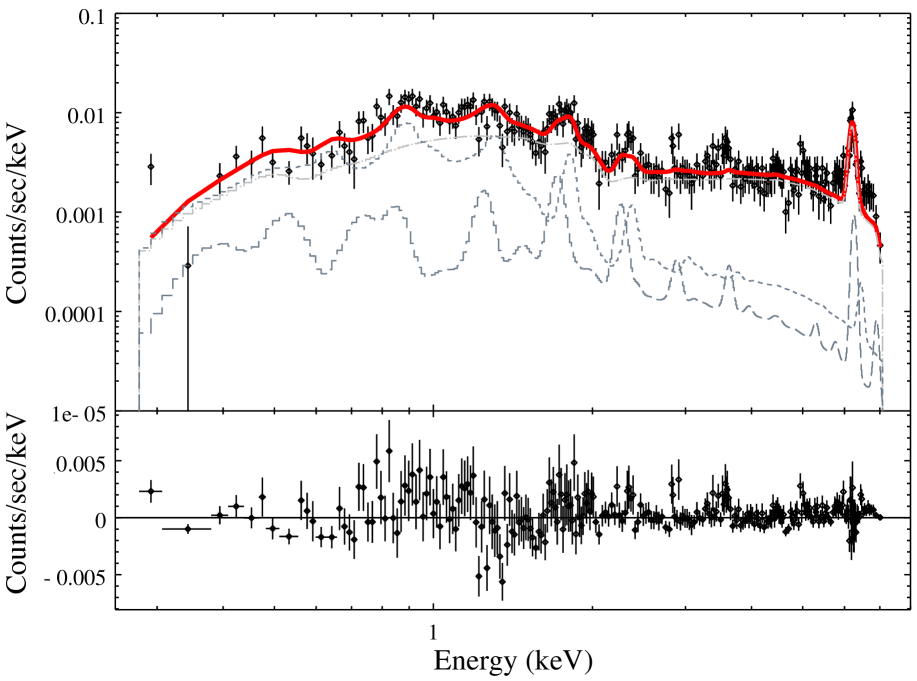
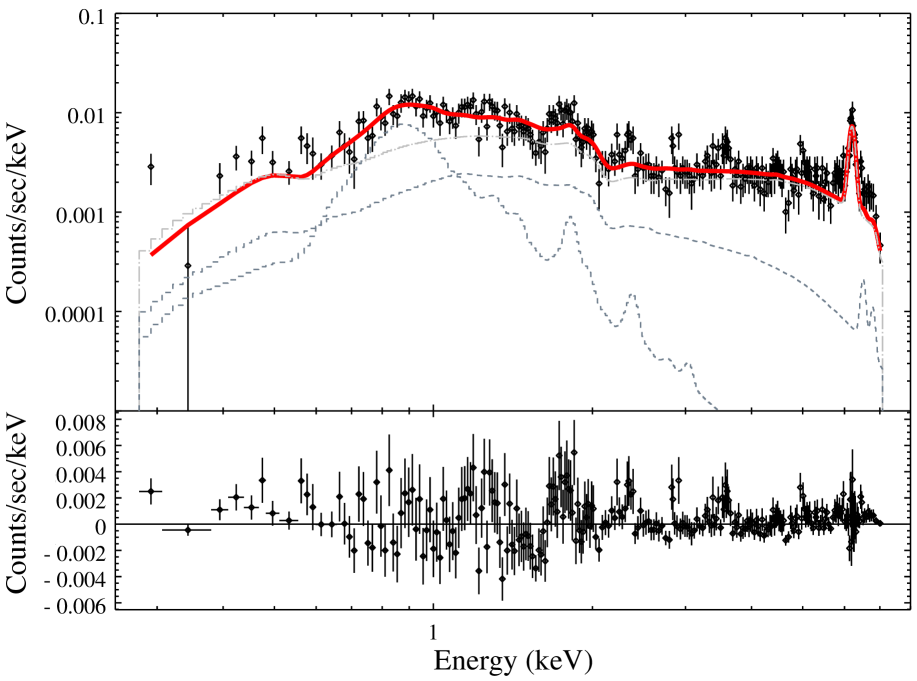
We start with a photoionization model since one has already been successfully used to describe a lower resolution spectrum of NGC 7212 (Bianchi et al. 2006). The photoionization model that we select is a CLOUDY (Ferland et al. 1998) model of reflection off of a plane parallel slab at an inclination of 45 degrees. The intensity and spectral shape of the ionizing radiation are set by the ionization parameter (U) and column density (), respectively. Beginning with a single CLOUDY component, we add up to two additional photoionization components. In all three regions, we find a significant improvement increasing from a one- to two-component CLOUDY spectral model and a worse fit adding a third photoionization component (Table 4). The best-fit, two-component CLOUDY model parameters are listed in Table 5 and the spectral fit for the circular region is shown in Figure 9 (top; left). As shown, this two-component photoionization model cannot fully represent the observed soft X-ray emission or the distinct emission lines between 3 and 6 keV.
4.2.2 N-component Thermal Models
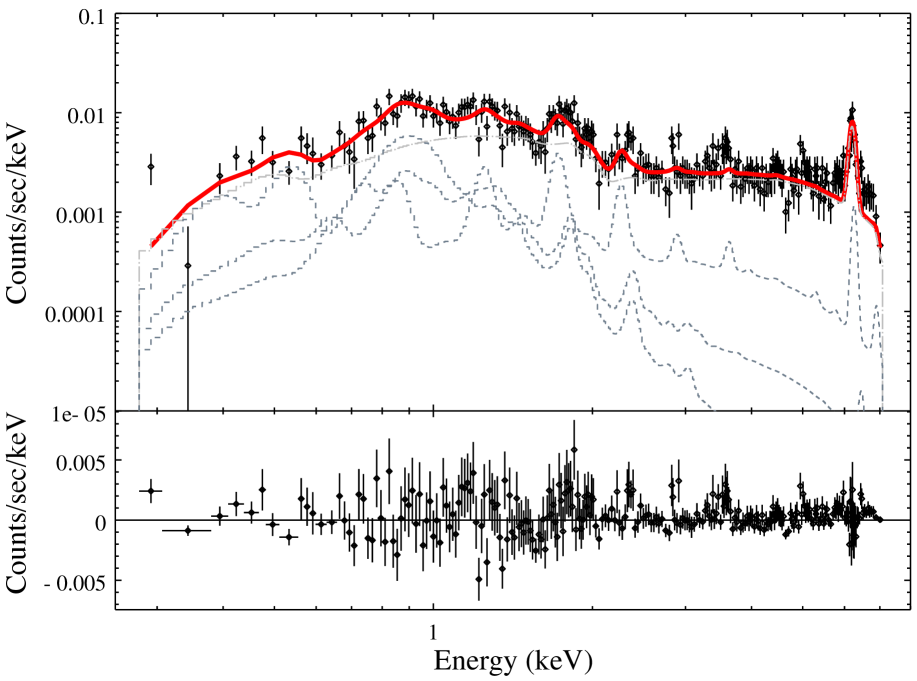
The thermal components in this investigation are drawn from a solar abundance APEC model (Foster et al. 2012) with varying temperature (keV) and normalization parameters. We started with a single thermal component and added up to two additional APEC components to our model, although a single component thermal model is not favored (Hernández-García et al. 2015). Compared to the pure photoionization models, the fit statistics are worse for the purely thermal components (Table 4). Furthermore, when comparing the best-fit, two-component CLOUDY model with the best-fit, two-component APEC model residuals, we do not see any improvements in describing the soft X-ray emission. The best-fit, two-component APEC model parameters are listed in Table 5 and the spectral fit for the circular region is shown in Figure 9 (top; right). Of our two thermal components, the components with keV in the circular and nuclear region are consistent with the APEC model in Koss et al. (2016) ( keV). The addition of a third component significantly improved the fit in the annulus region.
| Photoionization | Thermal | ||||
|---|---|---|---|---|---|
| F-Test P | F-Test P | ||||
| (8.0″ circular region) | |||||
| model | 1.20 (257) | … | 1.47 (258) | … | |
| model | 1.14 (254) | 1.18 (256) | |||
| model | 1.15 (251) | 1.19 (255) | |||
| (1.5″ nuclear region) | |||||
| model | 1.28 (217) | … | 1.34 (123) | … | |
| model | 1.23 (214) | 1.21 (121) | |||
| model | 1.25 (211) | 1.22 (119) | |||
| (1.5″8.0″ annulus) | |||||
| model | 1.08 (105) | … | 0.94 (140) | … | |
| model | 0.88 (102) | 0.96 (138) | |||
| model | 0.90 (100) | 0.77 (136) | |||
-
•
nmodel: number of photoionization or thermal components used in the model.
| TwoPhotoionization | TwoThermal | ||
|---|---|---|---|
| (8.0″ circular region) | (8.0″ circular region) | ||
| (1.5″ nuclear region) | (1.5″ nuclear region) | ||
| (1.5″8.0″ annulus) | (1.5″8.0″ annulus) | ||
| unconstrained | |||
-
Note.
U is the ionization parameter of each component, N is the column density (cm-2), T is the temperature (keV), and EM is the normalization of the APEC model (cm-5); , where is the angular diameter distance to the source (cm) and , are the electron and Hydrogen densities (cm-3).
4.2.3 Mixed Photoionization and Thermal Models
Since fits using individual photoionization and thermal models failed to adequately represent the complex observed emission, we fit the spectrum with a variety of mixed model combinations, up to three each. The fit statistics and F-test results for the selected model mixtures in each of the three regions are shown in Table 6.
The best model combinations are region dependent. In the nuclear region, the (two-photoionization, single thermal) model offered the best fit. Similarly this fit worked well in the circular region. For the circular region, including an additional thermal component () improved the spectral fit slightly. Adding additional thermal components () improved the spectral fit for the nuclear region compared to the single photoionization and thermal model, both in the observed residuals and the F-test calculation.
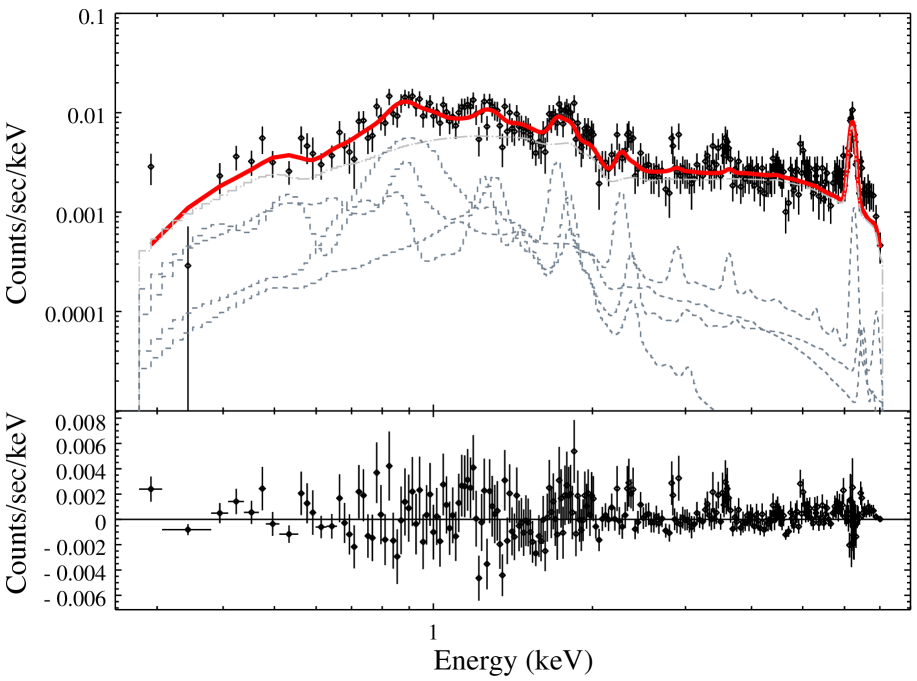
The best-fit parameters for our mixed models are listed in Table 8 and the and spectral fits for the circular region are shown in Figure 9 at the bottom right and left, respectively. In the extended emission region ( annulus), all of the mixed model spectral fits have and thus are acceptable solutions. In each region, however, none of the mixed models are able to completely fit the distinct emission lines between 3 and 6 keV, in which we see notable residual features for every mixed model combination.
| 8.0″ circular region | 1.5″ nuclear region | 1.5″8.0″ annulus | ||||
|---|---|---|---|---|---|---|
| N-Photo + N-Thermal | F-Test P | F-Test P | F-Test P | |||
| 1.18 (255) | … | 1.23 (215) | … | 0.77 (137) | … | |
| 1.12 (253) | 1.23 (213) | 0.70 (135) | ||||
| 1.09 (251) | 1.24 (211) | 0.72 (133) | ||||
| 1.08 (252) | 1.197 (212) | 0.72 (134) | ||||
| 1.07 (250) | 1.199 (210) | 0.73 (132) | ||||
| 1.08 (248) | 1.24 (208) | 0.74 (130) | 0.054 | |||
| 1.08 (249) | 1.23 (209) | 0.75 (131) | ||||
| 1.08 (247) | 1.26 (207) | 0.82 (129) | ||||
| 1.11 (245) | 1.27 (205) | 0.75 (127) | ||||
| 8.0″ circular region | 1.5″ nuclear region | 1.5″8.0″ annulus | ||||||
|---|---|---|---|---|---|---|---|---|
| P T | F-Test P | P T | F-Test P | P T | F-Test P | |||
| 1.18 (256) | … | 1.21 (269) | … | 0.77 (136) | … | |||
| 1.14 (254) | 1.23 (214) | 0.70 (135) | ||||||
| 1.08 (252) | 1.197 (212) | 0.88 (102) | ||||||
| 1.07 (250) | 0.31 | |||||||
| 8.0″ circular region: TwoPhotoionization + Thermal | 8.0″ circular region: TwoPhotoionization + TwoThermal | ||
|---|---|---|---|
| 1.5″ nuclear region: TwoPhotoionization + Thermal | 1.5″8.0″ annulus: Photoionization + TwoThermal | ||
-
Note.
U is the ionization parameter of each component, N is the column density (cm-2), T is the temperature (keV), and EM is the normalization of the APEC model (cm-5).
5 Discussion
Recently, deep, high-resolution observations of CT AGN have uncovered extended hard X-ray emission on kpc scales, a challenge to the long-held belief that hard X-ray emission was limited to the central few parsecs of the nucleus (e.g., Fabbiano et al. 2017; Maksym et al. 2017). The long-held assumption was that the origin of this emission is the reflection of energetic photons from the corona off obscuring material close to the nucleus (e.g., torus with luminosity-dependent distance of pc; Netzer 2015). This picture is in line with the “standard” AGN model (Urry & Padovani 1995), in which the geometrical orientation of an AGN, with respect to the observer, produces its observed multiwavelength properties. The presence of kiloparsec-scale extended emission raises questions about the nature, origin, and locations of the obscuring material.
High-resolution imaging observations of these sources allow us to better understand the limitations of the standard model and provide clues as to how the AGN interacts with and impacts its host galaxy through feedback processes. This work has closely examined NGC 7212, a CT AGN with extended X-ray emission, to better understand the spectral and spatial characteristics of this AGN class and provide constraints on the connection between AGN and their host galaxies. A discussion of our results is presented in the following subsections.
5.1 Luminosities
From our spectral fits we have calculated the keV luminosity for each region of interest (8.0″ circular region, 1.5″ nuclear region, and a 1.5″8.0″ annulus; Figure 1). We find that the 8″ circular region, containing the majority of the galactic emission, has a luminosity of erg s-1. Breaking this down further, we find the inner 1.5″ nuclear region, which contains the majority of the CT AGN emission, has a luminosity of erg s-1. For comparison with published results, we calculate the luminosity for keV in the 8″ region using PIMMS191919http://cxc.harvard.edu/toolkit/pimms.jsp and find an observed luminosity of erg s-1 (). Correcting for absorption, we calculate an intrinsic luminosity of erg s-1 (). This is consistent with what has been found for NGC 7212 in previous observations (e.g., observed luminosities: , Koss et al. 2016; intrinsic, unabsorbed luminosities: , Hernández-García et al. 2015; , Koss et al. 2016; , Müller-Sánchez et al. 2018; , Marchesi et al. 2018).
5.2 Spectral Emission Lines
The depth of our observation of NGC 7212 allows us to analyze three separate regions (8.0″ circular region, 1.5″ nuclear region, and a 1.5″8.0″ annulus) with enough statistical significance that we can compare the properties of the nuclear region to the region of extended emission. Each region is fit using a reflected power-law continuum with , consistent with the work of, e.g., Koss et al. (2016) and Marchesi et al. (2018), and additional gaussian emission lines, including a strong Fe K component. Not surprisingly, the normalization of the power-law component in the circumnuclear region is almost an order of magnitude larger than for the diffuse, extended emission in the outer region.
While we assume a photon index for the continuum in our emission line models of , we did compare the best-fit index for the nuclear and extended regions in the hard X-rays. We find that the extended region has a steeper photon index compared to that of the nuclear region ( compared to ), similar to what is found in ESO 428G014 (Fabbiano et al. 2017).
At energies below 1.2 keV, the predicted emission lines are complex and blended, but are consistent with what is observed in other nearby galaxies (e.g., Koss et al. 2015; Fabbiano et al. 2018a; Maksym et al. 2019). Similarly, the presence of strong Mg XI (1.331, 1.352 keV) and Si VIII (1.839, 1.865 keV) are typical for CT AGN.
In the hard X-rays, the most significant emission line that we see can be attributed to the Fe K emission line near keV. This line is believed to originate from within the AGN torus region due to the excitation of the obscuring material. Thus it comes as no surprise that this emission line is strong in the nuclear region (inner 1.5″0.8 kpc) where the CT AGN is located. However, we also find significant Fe K emission in the annulus in excess of the Chandra PSF model and extending to 3.7 kpc scales at of the relative strength of the nuclear region.
In the simplest picture where AGN are classified as a function of line-of-sight orientation (e.g., Urry & Padovani 1995), extended Fe K X-ray emission is unexpected for a CT AGN since the obscuring material (e.g., torus) is expected to act as a screen in the inner parsec, limiting this emission to the nuclear region (e.g., Netzer 2015). However, recent observations of nearby CT AGN find significant Fe K emission outside of the central nucleus (e.g., Circinus: extended 100 pc, Marinucci et al. 2013; Arévalo et al. 2014; NGC 1068: 30% Fe K emission observed at 140 pc, Bauer et al. 2015; ESO 428G014: extended 3.7 kpc, Fabbiano et al. 2017, 2018a, 2018b).
The hard energy band of NGC 7212 is more complex than expected for a CT AGN, especially in the 1.5″ nuclear region, where the AGN emission dominates. We discuss the presence of strong, significant lines between and 6 keV and their tentative identifications below.
5.2.1 Unique Features
We find three emission features not, to our knowledge, previously reported in AGN X-ray spectra. There is significant line emission near keV in the outer annuli (; Table 14) comparable in strength to the Fe K line that may be an argon fluorescence line ( keV). In order to achieve this kind of relative abundance in a photoionized plasma, the annulus region would need to contain a steeper ionizing spectrum compared to the nuclear region (which is consistent with our observations of the relative photon index; see Section 5.2). However, since the AGN spectrum is filtered through the torus, it is challenging to know for certain what shape illuminates the ambient gas. This line may also be present in the central nuclear region, but only at significance and so is unlikely to originate from the CT AGN directly.
In all three regions, we find a significant emission line near keV (Table 14). At this energy, possible identifications include Ar XVII ( keV) or a calcium K fluorescence line ( keV). At both and keV we cannot make anything more than tentative identifications since these lines are not characteristic of AGN. Furthermore, we do not currently have a good physical explanation for only finding neutral calcium.
We also find a distinct emission line near keV that is limited to the central 1.5″ nuclear region. We currently have no definitive identification for the emission line at keV, despite a thorough search of literature and the NIST Atomic Spectra Database202020http://physics.nist.gov. It is unlikely to be an artifact of the ACIS-S background, which is fairly well known at this energy212121http://cxc.harvard.edu/cal/Acis. Likewise, it is unlikely to be due to contamination from a nearby or background galaxy, as its closest neighbor is located 9.8 kpc away (e.g., Koss et al. 2016), and the probability of overlap with a background galaxy (e.g., located at where Fe K could explain this observed emission line) is low. vanadium He-like emission at keV from cosmic spallation (energetic particles bombarding optically thick material leading to the formation of elements) could explain this observed emission (Gallo et al. 2019). However, vanadium K is typically weak compared to other spallation lines that we do not see (e.g., titanium, chromium; Gallo et al. 2019). The importance of spallation in AGN is debatable (e.g., Skibo 1997; Turner & Miller 2010; Gallo et al. 2019), as is the origin of the energetic particles (e.g., accretion disks, disk winds; Turner & Miller 2010). The development of high-resolution spectroscopic instruments, e.g, calorimeters, is increasingly important for detecting spallation and identifying emission at unusual energies, especially in the hard X-rays.
5.2.2 Physical Models
As discussed in Section 4.2, we find that a single photoionization or thermal component does not fully represent the soft X-ray emission from NGC 7212 and a more complex mixture of the two is needed.
For the nuclear region ( = 834 pc), the best fit to the spectrum is a combination of the two photoionization models and a single thermal model with keV, and the two ionization parameters and . In comparison, the two-component thermal model finds keV, and keV. The two-component photoionization model finds , and (Table 5). Since many of the fit statistics in this region are very similar, we can conservatively say that the best spectral fit is given by, at minimum, one thermal and one photoionization component (but two photoionization models are preferred).
In the annulus region, the best-fit physical model is a combination of a single photoionization model with , and two thermal models with keV, and keV (Table 8). The three-component thermal model finds keV, keV, and 64 keV, which is essentially pure bremsstrahlung. The two-component photoionization model finds , and . Similar to the nuclear region, a three-component model is preferred in the annulus with, at minimum, one photoionization and one thermal model, plus one additional thermal or photoionization model.
Looking at the circumnuclear region ( circular region), we find that the best fit is the combination of two-photoionization and two-thermal models, although it is also well fit by a two-photoionization-one-thermal mixture. The two-two mixture is preferred since the residuals of the best fit are visually less correlated (Figure 9). This two-two model has the parameters: keV, keV, , and . These are consistent with the best-fit thermal and ionization parameters in both the nuclear and annular regions. Furthermore, the thermal component fit in each region, 0.89 keV, is consistent with previous observations of NGC 7212 (e.g., Koss et al. 2016; 0.8 keV). The densities that we derive in these mixed models are also consistent with typical densities in the interstellar medium (Tables 5, 8).
While NGC 7212 requires more than a single model component, the best-fit model mixture in each region was less complex than seen in other sources with observed extended X-ray emission (e.g., ESO 428G014, Fabbiano et al. 2018a). It is unclear whether this preference for a “simplified” model is due to statistics, as NGC 7212 has significantly fewer counts than ESO 428G014 ( counts compared to counts in their respective 8.0″ circular regions), or due to confusion, as we are averaging over a bigger physical region in NGC 7212 ( pc) compared to ESO 428G014 ( pc). The presence of dust lanes and disturbed irregular shape (compared to the more disky shape of ESO 428G014) observed in NGC 7212 may also play a role (e.g., Muñoz et al. 2007).
Since our spectral models are consistent across all three regions of interest, we can begin to trace the full physical picture of NGC 7212. The low temperature (0.8 keV) thermal emission in the inner nuclear and annulus regions may correspond to shocks with velocities of 850 km s-1 (assuming ; where is the mean molecular mass of a fully ionized gas, and is the Boltzmann constant; e.g., Wang et al. 2014; Fabbiano et al. 2018a).
In the annular region (), the best-fit mixed model prefers a combination of a higher temperature and lower temperature thermal model. This low temperature thermal component is consistent with what is observed in the nuclear region, suggesting similar energetic origins. The higher temperature component (6.8 keV) is isolated to the annular region and corresponds to velocities near km s-1, on order of what is expected from [O III] velocities in the inner nuclear region (e.g., Kraemer & Crenshaw 2000; Kraemer et al. 2008). Shocks at these velocities have been observed on extended scales in CT AGN (e.g., Fischer et al. 2013) and have been associated with starburst-driven winds (e.g., NGC 6240, Wang et al. 2014).
Optical ground-based observations and emission line diagnostics (e.g., BPT diagrams; Baldwin et al. 1981), from Congiu et al. (2017) (see also Contini et al. 2012) suggest that the ionization mechanism for NGC 7212 is a combination of photoionization and shocks, which is qualitatively consistent with our results. Recently, Terao et al. (2016) suggests that NGC 7212 is not likely affected by fast shocks based on near-IR observations. In our annular region, however, we find a thermal component that may be associated with fast shocks. This is not necessarily inconsistent with the Terao et al. (2016) results, since nonradiative, fast shocks would not be observed in the optical/IR.
The photoionization parameters from our best fits also provide constraints on the presence of highly ionized outflows, such as warm absorbers (WAs), in NGC 7212. WAs typically have velocities that range in the thousands of km s-1, column densities around cm-2 (e.g., Arav et al. 2013; Fischer et al. 2013). These outflows typically originate from the central continuum in the inner 100 parsec (e.g., Krongold et al. 2007; Arav et al. 2015), however, Arav et al. (2018) find that 12% of quasar outflows are found at distances larger than 1 kiloparsec. In many cases, AGN with WAs exhibit bi-conical outflows reflected in their photoionization parameters (e.g., Andrade-Velázquez et al. 2010; Fabbiano et al. 2018a).
In the inner nuclear region of NGC 7212, where outflows are typically located, the ionization parameters we find ( and ) are similar to what has been observed in CT AGN before. However, the column densities in this region are too high, and the velocities derived are too low, compared to what is typically seen in WAs. In comparison, the annular region contains a thermal component with high 2400 km s-1 velocities, and column densities that are more consistent with WAs. While we cannot definitely confirm the presence of WAs in NGC 7212, the extended region is a possible host to these high velocity, highly ionized outflows.
5.2.3 Radial Profiles and FWHM
As described in Section 3, we see extended emission in the soft and hard X-rays in both the cone (southnorth) and cross-cone (westeast) direction. It is possible to measure the extent of this X-ray emission out to kiloparsec scales by extracting and fitting the radial profiles of the emission for different energy bands. Looking at the extended region annulus, we find significant extended emission compared to the Chandra PSF for each energy bin: for example, in the keV band where we expect to see Fe K, we find an excess of counts.
The extended region (″ annulus) contributes to 20.5% of the total observed counts, where 17.1% of this emission is in the soft X-rays. Breaking this down further into the cone and cross-cone regions, we find 14.4% of the total observed counts originate from the annulus in the southnorth cone. The southnorth cone, in addition to containing the majority of the extended X-ray emission, also encompasses the optical ionization cone and ENLR (Figure 10; Schmitt et al. 2003; see also Cracco et al. 2011; Congiu et al. 2017) located at position angle, P.A. °. Other works have also uncovered extended emission in the optical and IR that is consistent along this cone axis (e.g., Hernández-García et al. 2015; Asmus et al. 2016; Müller-Sánchez et al. 2018).
We find a trend in the extended emission with energy in both the cone and cross-cone directions at 1% of the surface brightness such that the emission is more extended at soft X-rays. For the southnorth cone, in particular, the soft X-rays are significantly extended on kiloparsec scales (average width 3.7 kpc).
Our observations also show strong extended emission in the cross-cone direction where we expect significant obscuration from the torus in the “standard” model. The origin of the diffuse emission is likely ionizing radiation from the active nucleus, e.g., from the corona, propagating to large scales via interactions with the interstellar medium (ISM). Georgantopoulos & Akylas (2019) fit a torus model to NuSTAR observations of NGC 7212 using MYTorus222222http://mytorus.com/ and found the best-fit parameters cm-2 (consistent with Marchesi et al. 2018), , keV.
The presence of a clumpy torus in NGC 7212 could explain this excess emission, such that transmission occurs along the plane of the obscuring material. If we assume a torus geometry for the absorber with an opening angle of in the southnorth cone, we can estimate the transmission in the cross-cone direction. With these simple assumptions, we calculate that the volume of cross-cone region is the volume of the cone. From Table 2, we find that the cross-cone region contains more counts over the Chandra PSF than the southnorth cone for energies keV. Thus, the transmission in the cross-cone direction is of the cone direction. For comparison, this is higher than the cross-cone transmission estimated for ESO 428G014 (), but could be due to the weaker azimuthal dependence of NGC 7212, and may be explained by inclination effects.
Alternatively, this extended emission could be related to the compact double radio source observed in NGC 7212 (e.g., Tran 1995a, b; Falcke et al. 1998) that can be attributed to the presence of a jet. Recent relativistic hydrodynamical simulations of jets propagating through molecular disks (e.g., IC 5063; Mukherjee et al. 2018) have modeled the presence of warm and hot emission caused by jetcold disk interactions. In these models, regions with gas temperatures K may be found surrounding both cooler gas in the nucleus as well as expelled on large scales via filamentary winds. This is in line with our best fit spectral models that fit a thermal component with keV ( K) in both the nuclear and annular region.
The excess we observe is not oriented solely along the radio source axis (P.A. ; Falcke et al. 1998). However, the presence of hot gas in the cross-cone region may be explained by recent simulations that predict the presence of a hot cocoon with gas temperatures K surrounding the nucleus due to jet-ISM interactions. We find a thermal component in the annular region with keV ( K) that is not found in the nuclear region which may indicate the presence of one of these hot cocoons.
Further evidence supporting jet-ISM interactions in NGC 7212 is reported by Congiu et al. (2017). However, we cannot rule out supernova heating in the nuclear region or the annular region. The thermal component ( keV) in the nuclear region corresponds to a cooling time of yr. Given an energy content of erg, the supernova rate required to support this thermal energy is yr-1. In the annular region, assuming the thermal component keV is the dominant source of heating, the cooling time is years. For an energy content of erg, the heating could be accounted for with a supernova rate of yr-1.
6 Summary and Conclusions
We have analyzed the spectral properties and spatial extent of the kiloparsec-scale diffuse X-ray emission in NGC 7212 using 149.87 ks of combined Chandra observations.
-
1.
We find that the extended diffuse emission region ( kpc annulus) accounts for more than 20% of the total emission from 0.3 to 7.0 keV. We further break this down into the soft (0.3 - 3.0 keV) and hard (3.0 - 7.0 keV) X-rays, where we find contributions to the total observed emission of 17% and 3%, respectively. The energy bin surrounding the Fe K emission line and hard X-ray continuum (6.0 - 7.0 keV) supplies 2% of the total observed emission.
-
2.
Breaking the observed emission into discrete energy bands and cone/cross-cone regions, we find significant, up to 3.6 kpc, extended emission at 1% of the surface brightness. This extended emission is strongly associated with soft X-rays in the southnorth cone direction (accounting for more than 14% of the total counts), and is consistent with the observed ENLR region (e.g., Cracco et al. 2011; Congiu et al. 2017) and compact double radio source (e.g., Tran 1995a, b; Falcke et al. 1998). In the soft X-rays, this 3.7 kpc extended emission is similar in extent to the 3.4 kpc extended soft X-ray emission observed in ESO 428G014 (Fabbiano et al. 2018a), but remains the largest extent to date in the literature. In the hard X-rays, we observe emission at 1% of the total surface brightness up to 2.7 kpc (similar to the 2.8 kpc extent in ESO 428G014).
-
3.
The detected emission along the cross-cone direction raises doubts about the standard AGN model in which the hard X-rays originate from the excitation of a uniform obscuring torus. The presence of hard X-rays on observed kiloparsec scales (e.g., for keV the extent at 1% surface brightness is 2.13 kpc) could imply an interior clumpy torus structure (e.g., Nenkova et al. 2008) that allows for the transmission of radiation on kiloparsec scales. In the event of a clumpy torus, we estimate that transmission in the cross-cone direction is of the cone direction. This is higher than the cross-cone transmission of calculated for ESO 428G014 (Fabbiano et al. 2018a).
-
4.
We extract the spectrum for three different regions: an 8.0″ (4.448 kpc) circular region, 1.5″ (0.834 kpc) nuclear region, and 1.5″8.0″ annulus. For each region we fit a reflection model (PEXRAV) plus gaussian emission lines, incrementally adding lines until we obtain a good representation of the spectrum. For each region, the emission line model contains complex, blended emission lines in the soft X-rays below 1.2 keV likely made of O VII, Ne IX, and a variety of Fe lines. Strong individual lines are also found above 1.2 keV, including Mg XI, Si VIII, S K, and Fe K near 6.4 keV. The presence of these emission lines is consistent with lines found in other AGN (e.g., Koss et al. 2015; Fabbiano et al. 2018a; Maksym et al. 2019).
-
5.
In our spectral line fits, we also discover three significant emission lines in the hard X-rays that are not typically observed in CT AGN. The emission lines at 2.9 keV and 3.6 keV are tentatively identified as species of argon and/or calcium. The emission at 5.2 keV is puzzling and not identified.
-
6.
We also fit the spectra extracted for our three regions utilizing a combination of both photoionization and thermal physical models. In the inner nuclear region, we find the spectrum is best fit by a minimum of one photoionization and one thermal model component (although two photoionization model components are preferred). Similarly, the annulus region is best fit by at least one of each model component, but a second thermal component is preferred. Combining these two regions, we find the best-fit spectral model for the circular region is given as combination of two-photoionization and two-thermal models with model parameters that mirror the individual subregions. The derived parameters in all three regions are consistent with typical ISM densities.
-
7.
We find the ionization parameters in each region of interest are consistent with those found in highly ionized outflows (WAs). However, the typical velocities and column densities of WAs are more in line with the parameters derived in the annulus region, rather than near the central source.
-
8.
We find that the best-fit thermal spectral components for NGC 7212 may be equally well explained by shocks, jet-ISM interactions, and supernova heating.
-
(a)
In the inner nuclear region and annular region, the temperature at keV is consistent with 850 km s-1 shocks. The additional thermal component in the annulus region ( keV) corresponds to shocks near 2400 km s-1, and is consistent with previous observations of CT AGN (Fischer et al. 2013).
-
(b)
The warm thermal component ( keV) can likewise be explained by jet-ISM interactions in which warm gas is found surrounding cool gas in the nucleus and expelled on large scales via filament winds. Similarly, simulations of jet-ISM interactions predict a hot cocoon around the nuclear region that is consistent with the hot thermal component we observe in the annular region of NGC 7212 (e.g., Mukherjee et al. 2018).
-
(c)
We are unable to rule out supernova heating as the origin of this thermal component in both the nuclear region and annular region. For the nuclear region where keV (cooling time years; E erg), the heating could be accomplished with 0.1 supernova per year. Assuming the hot thermal component ( keV; cooling time years; E erg) dominates in the annular region, the supernova rate drops to 0.01 yr-1.
-
(a)
-
9.
Compared to other CT AGN with extended X-ray emission, the most comparable of which is ESO 428G014 (Fabbiano et al. 2018a), we find that NGC 7212 requires a less complex multicomponent spectral model. These differences may be purely due to statistics (our observations of NGC 7212 have combined 1300 counts, compared to 7000 counts for ESO 428G014), or confusion due to spatial scale (for NGC 7212, pc, compared to pc for ESO 428G014).
This work demonstrates the advantages of deep Chandra observations for recovering statistically significant spatial and spectral information about an exciting class of CT AGN with observed diffuse hard X-ray emission on kiloparsec scales. High-resolution observations of extended emission sources, such as NGC 7212, can recover important information about the AGN and surrounding ISM, which can be used to test the AGN standard model by analyzing the morphology of the torus, and provide new insights into gas dynamics and AGN feedback mechanisms. As we plan for the next generation of great observatories (e.g., Lynx), an emphasis on high spatial resolution and sensitive instruments will play a crucial role in the future of AGN studies.
References
- Andrade-Velázquez et al. (2010) Andrade-Velázquez, M., Krongold, Y., Elvis, M., et al. 2010, The Astrophysical Journal, 711, 888
- Antonucci (1993) Antonucci, R. 1993, ARA&A, 31, 473
- Arav et al. (2013) Arav, N., Borguet, B., Chamberlain, C., Edmonds, D., & Danforth, C. 2013, Monthly Notices of the Royal Astronomical Society, 436, 3286
- Arav et al. (2018) Arav, N., Liu, G., Xu, X., et al. 2018, The Astrophysical Journal, 857, 60
- Arav et al. (2015) Arav, N., Chamberlain, C., Kriss, G. A., et al. 2015, Astronomy and Astrophysics, 577, A37
- Arévalo et al. (2014) Arévalo, P., Bauer, F. E., Puccetti, S., et al. 2014, ApJ, 791, 81
- Asmus et al. (2016) Asmus, D., Hönig, S. F., & Gandhi, P. 2016, ApJ, 822, 109
- Baldwin et al. (1981) Baldwin, J. A., Phillips, M. M., & Terlevich, R. 1981, PASP, 93, 5
- Bauer et al. (2015) Bauer, F. E., Arévalo, P., Walton, D. J., et al. 2015, ApJ, 812, 116
- Bianchi et al. (2006) Bianchi, S., Guainazzi, M., & Chiaberge, M. 2006, A&A, 448, 499
- Congiu et al. (2017) Congiu, E., Contini, M., Ciroi, S., et al. 2017, MNRAS, 471, 562
- Contini et al. (2012) Contini, M., Cracco, V., Ciroi, S., & La Mura, G. 2012, A&A, 545, A72
- Cracco et al. (2011) Cracco, V., Ciroi, S., di Mille, F., et al. 2011, MNRAS, 418, 2630
- Drake et al. (2003) Drake, C. L., McGregor, P. J., Dopita, M. A., & van Breugel, W. J. M. 2003, AJ, 126, 2237
- Fabbiano et al. (2017) Fabbiano, G., Elvis, M., Paggi, A., et al. 2017, ApJ, 842, L4
- Fabbiano et al. (2018a) Fabbiano, G., Paggi, A., Karovska, M., et al. 2018a, ApJ, 855, 131
- Fabbiano et al. (2018b) —. 2018b, ApJ, 865, 83
- Fabbiano et al. (2019) Fabbiano, G., Siemiginowska, A., Paggi, A., et al. 2019, ApJ, 870, 69
- Falcke et al. (1998) Falcke, H., Wilson, A. S., & Simpson, C. 1998, ApJ, 502, 199
- Ferland et al. (1998) Ferland, G. J., Korista, K. T., Verner, D. A., et al. 1998, PASP, 110, 761
- Fischer et al. (2013) Fischer, T. C., Crenshaw, D. M., Kraemer, S. B., & Schmitt, H. R. 2013, The Astrophysical Journal Supplement Series, 209, 1
- Foster et al. (2012) Foster, A. R., Ji, L., Smith, R. K., & Brickhouse, N. S. 2012, ApJ, 756, 128
- Gallo et al. (2019) Gallo, L. C., Randhawa, J. S., Waddell, S. G. H., et al. 2019, MNRAS, 484, 3036
- Georgantopoulos & Akylas (2019) Georgantopoulos, I., & Akylas, A. 2019, A&A, 621, A28
- Guainazzi et al. (2005) Guainazzi, M., Matt, G., & Perola, G. C. 2005, A&A, 444, 119
- Hernández-García et al. (2015) Hernández-García, L., Masegosa, J., González-Martín, O., & Márquez, I. 2015, A&A, 579, A90
- Kormendy & Ho (2013) Kormendy, J., & Ho, L. C. 2013, ARA&A, 51, 511
- Koss et al. (2015) Koss, M. J., Romero-Cañizales, C., Baronchelli, L., et al. 2015, ApJ, 807, 149
- Koss et al. (2016) Koss, M. J., Assef, R., Baloković, M., et al. 2016, ApJ, 825, 85
- Kraemer & Crenshaw (2000) Kraemer, S. B., & Crenshaw, D. M. 2000, ApJ, 532, 256
- Kraemer et al. (2008) Kraemer, S. B., Schmitt, H. R., & Crenshaw, D. M. 2008, ApJ, 679, 1128
- Krongold et al. (2007) Krongold, Y., Nicastro, F., Elvis, M., et al. 2007, The Astrophysical Journal, 659, 1022
- Lawrence & Elvis (1982) Lawrence, A., & Elvis, M. 1982, ApJ, 256, 410
- Levenson et al. (2006) Levenson, N. A., Heckman, T. M., Krolik, J. H., Weaver, K. A., & Życki, P. T. 2006, ApJ, 648, 111
- Maksym et al. (2017) Maksym, W. P., Fabbiano, G., Elvis, M., et al. 2017, ApJ, 844, 69
- Maksym et al. (2019) —. 2019, ApJ, 872, 94
- Marchesi et al. (2018) Marchesi, S., Ajello, M., Marcotulli, L., et al. 2018, ApJ, 854, 49
- Marinucci et al. (2013) Marinucci, A., Miniutti, G., Bianchi, S., Matt, G., & Risaliti, G. 2013, MNRAS, 436, 2500
- Muñoz et al. (2007) Muñoz, D. J., Mardones, D., Garay, G., et al. 2007, ApJ, 668, 906
- Mukherjee et al. (2018) Mukherjee, D., Wagner, A. Y., Bicknell, G. V., et al. 2018, MNRAS, 476, 80
- Müller-Sánchez et al. (2018) Müller-Sánchez, F., Hicks, E. K. S., Malkan, M., et al. 2018, ApJ, 858, 48
- Nenkova et al. (2008) Nenkova, M., Sirocky, M. M., Nikutta, R., Ivezić, Ž., & Elitzur, M. 2008, The Astrophysical Journal, 685, 160
- Netzer (2015) Netzer, H. 2015, ARA&A, 53, 365
- Padovani et al. (2017) Padovani, P., Alexander, D. M., Assef, R. J., et al. 2017, A&A Rev., 25, 2
- Protassov et al. (2002) Protassov, R., van Dyk, D. A., Connors, A., Kashyap, V. L., & Siemiginowska, A. 2002, The Astrophysical Journal, 571, 545
- Ricci et al. (2015) Ricci, C., Ueda, Y., Koss, M. J., et al. 2015, ApJ, 815, L13
- Risaliti et al. (2000) Risaliti, G., Gilli, R., Maiolino, R., & Salvati, M. 2000, A&A, 357, 13
- Schmitt et al. (2003) Schmitt, H. R., Donley, J. L., Antonucci, R. R. J., Hutchings, J. B., & Kinney, A. L. 2003, ApJS, 148, 327
- Severgnini et al. (2012) Severgnini, P., Caccianiga, A., & Della Ceca, R. 2012, A&A, 542, A46
- Singh et al. (2011) Singh, V., Shastri, P., & Risaliti, G. 2011, A&A, 532, A84
- Skibo (1997) Skibo, J. G. 1997, ApJ, 478, 522
- Terao et al. (2016) Terao, K., Nagao, T., Hashimoto, T., et al. 2016, ApJ, 833, 190
- Tran (1995a) Tran, H. D. 1995a, ApJ, 440, 565
- Tran (1995b) —. 1995b, ApJ, 440, 578
- Tsunemi et al. (2001) Tsunemi, H., Mori, K., Miyata, E., et al. 2001, ApJ, 554, 496
- Turner & Miller (2010) Turner, T. J., & Miller, L. 2010, ApJ, 709, 1230
- Urry & Padovani (1995) Urry, C. M., & Padovani, P. 1995, PASP, 107, 803
- Veilleux et al. (1997) Veilleux, S., Goodrich, R. W., & Hill, G. J. 1997, ApJ, 477, 631
- Wang et al. (2011) Wang, J., Fabbiano, G., Risaliti, G., et al. 2011, ApJ, 729, 75
- Wang et al. (2014) Wang, J., Nardini, E., Fabbiano, G., et al. 2014, The Astrophysical Journal, 781, 55
- Wasilewski (1981) Wasilewski, A. J. 1981, PASP, 93, 560
- Xu et al. (2016) Xu, W., Liu, Z., Gou, L., & Liu, J. 2016, MNRAS, 455, L26