Branching fractions for decays in Ba+
Abstract
Branching fractions for decays from the level in 138Ba+ have been measured with a single laser-cooled ion. Decay probabilities to , and are determined to be , and , respectively, which are an order of magnitude improvement over previous results. Our methodology only involves optical pumping and state detection, and is hence relatively free of systematic effects. Measurements are carried out in two different ways to check for consistency. Our analysis also includes a measurement of the lifetime, for which we obtain 30.14(40) s.
pacs:
06.30.Ft, 06.20.fbI Introduction
Singly-ionized Barium has been well studied over the years with a wide range of precision measurements marx1998precise ; knoll1996experimental ; hoffman2013radio ; woods2010dipole ; sherman2008measurement ; kurz2008measurement ; munshi2015precision ; dutta2016exacting providing valuable benchmark comparisons with theory guet1991relativistic ; dzuba2001calculations ; iskrenova2008theoretical ; safronova2010relativistic ; sahoo2007theoretical ; gopakumar2002electric . Such comparisons have been motivated in part by the proposed parity nonconservation (PNC) measurement using the transition in 137Ba+ fortson1993possibility . Recently, we have proposed that accurately measured properties of 138Ba+ can be combined to provide an accurate model of the dynamic differential scalar polarizability for the clock transition BarrettProposal . With such a model, ac-Stark shifts of the clock transition could provide an in situ calibration of laser intensities and comparison of polarizabilities with another species. A limiting factor for the proposal was the accuracy of existing values for branching ratios. Moreover, recent measurements of branching fractions arnold2019measurements indicated possible problems with existing values dutta2016exacting . Consequently, we have remeasured these values with an order of magnitude improvement in their uncertainties.
Our measurements only involve optical pumping and state detection. Consequently, results are insensitive to laser intensity, frequency, and polarization changes provided they do not significantly affect optical pumping times and detection. Our implementation also allows the branching ratios to be determined in two different ways, which we do by way of a consistency check on our results.
II Experiment Overview
The relevant level structure for Ba+ is given in Fig. 1(a). Doppler cooling is provided by driving the transitions at 493 and 650 nm, with light scattered at 650 nm collected onto a single photon counting module (SPCM) for detection. The remaining three transitions at 455, 585, and 614 nm facilitate optical pumping as required. Throughout the report, we refer to and states collectively as the bright state, and states as the dark state.
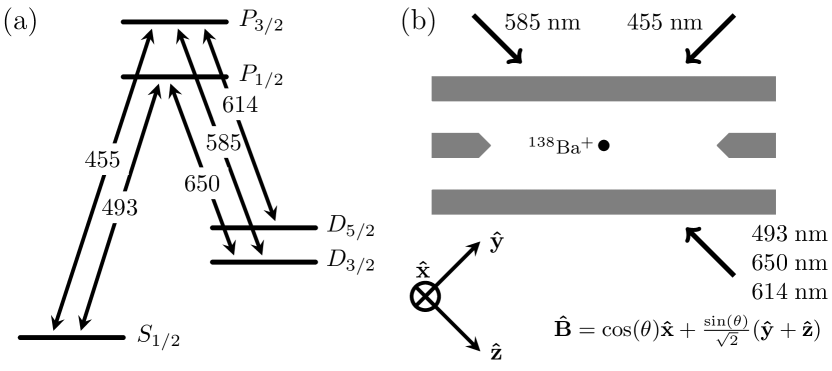
The experiments are carried out in a linear Paul trap with axial end-caps as described in arnold2018blackbody ; kaewuam2018laser . The laser configurations relative to the trap are shown in Fig. 1(b). An applied magnetic field of with the orientation given in Fig. 1(b) is sufficient to avoid any dark states, independent of the polarization state of any of the lasers.
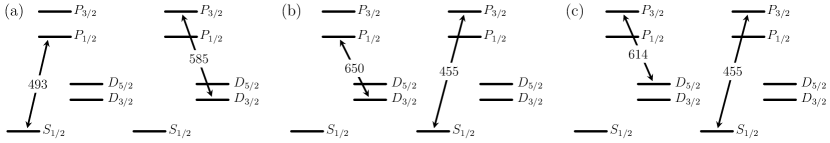
Probabilities for decay from to , , and are here denoted and , respectively. They are inferred from population measurements following the optical pumping sequences shown in Fig. 2 where it is given that each sequence is preceded by preparation into the appropriate bright or dark state. The remaining bright state population for the sequences shown in (a), (b), and (c), are , and , respectively, where
| (1) | |||
| and | |||
| (2) | |||
Since , only two measurements are needed to uniquely determine . In addition, each of the sequences in Fig. 2 can be repeated times within a single experiment to provide measurements of , , and . This can provide better statistics with a similar approach having been demonstrated with Ca+ gerritsma2008precision . Here we provide measurements of and , and use measurements of and over a range of to check for consistency.
III Measurements
III.1 Measurement of q
Measurements of involved optical pumping with lasers at 650, 455, and 614 nm with measured pumping time constants of 0.3, 1.0, and , respectively. However, as the 455-nm laser was only locked by a wavemeter, occasional frequency excursions of could occur, significantly changing the pumping rate. Consequently, the pump rate was also measured within each cycle of the experiment. In addition, measurements of a dark and bright state were also made to assess the detection efficiency in each case. Thus, a single experiment cycle consisted of four interleaved experiments.
Explicit pulse sequences for each of the four experiments are given in table 1. The cooling pulse in all four cases had a duration of and included repump light at 614 nm to ensure the atom is pumped to the bright state. The first two experiments use lasers at 455 and 650 nm to optically pump to ; partial pumping with a pulse monitors pumping rate of the 455-nm transition, and complete pumping with a pulse prepares the ion in the dark state. The third experiment uses complete optical pumping of the 455-nm transition alone to determine , and the final experiment provides a measurement of the bright state. The full cycle was repeated in blocks of 1000. Between each block, 10 measurements of the counts in 1 ms were made for both the bright state and background, where the latter was taken with the 493-nm laser turned off.
| Expt. 1 | Expt. 2 | Expt. 3 | Expt. 4 |
|---|---|---|---|
| Cooling | Cooling | Cooling | Cooling |
| 650 () | 650 () | 650 () | - |
| 650/455 () | 650/455 () | 455 () | - |
| Detect. | Detect. | Detect. | Detect. |
Over the course of two days, blocks of data were taken. The data is conditioned on the ’bright detection’ from expt 4, which gives a mean probability of for detecting dark. These events are not, however, Poisson distributed. In all cases where two or more dark events occured, they were clustered in consecutive experiments suggesting a collision event had inhibited bright detection through multiple 400 s cooling cycles. Consequently any blocks of 1000 cycles that have more than one dark state detection event during expt. 4 were omitted. This eliminates only 15 blocks, or of the data.
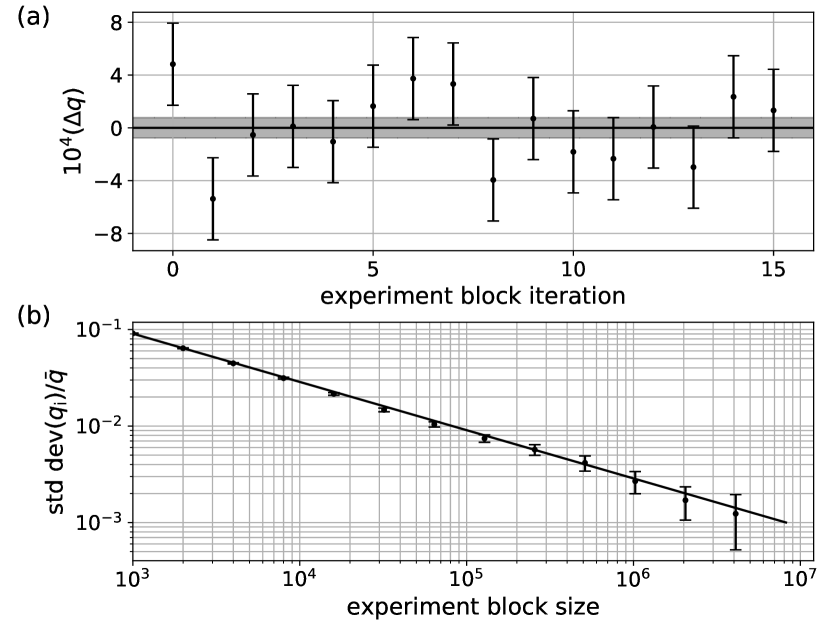
From the remaining data we obtain an estimate , where the uncertainty is statistical. Mean values of estimated from blocks of size are given in Fig. 3(a) where the uncertainties for each point are the expected projection noise, and the reduced is 0.84. The fractional standard deviation of mean values estimated from blocks of variable size is given in Fig. 4(b) to further demonstrate that the measurement continues to average down in accordance with the projection noise limit given by the solid line.
III.2 Measurement of p
As illustrated in Fig. 2 (a), measurement of entails optical pumping with lasers at 493 and 585 nm, which had measured pumping time constants of approximately 500 and 300 ns, respectively. The 585-nm light was generated by an 1170-nm diode laser that was locked to a frequency comb kaewuam2019spectroscopy and frequency doubled by a fiber-coupled, waveguide doubler. The result was a very stable scattering rate compared to that with the 455-nm laser used in the measurement of . Thus, the typical experiment cycle consisted of only two interleaved experiments: a bright state detection, to monitor collision events, and the measurement of . The latter consisted of of Doppler cooling, of optical pumping of the 493-nm transition to , of optical pumping with 585-nm light, and then detection. The pumping rate of the 585-nm transition was additionally monitored in-between each block to confirm its stability.
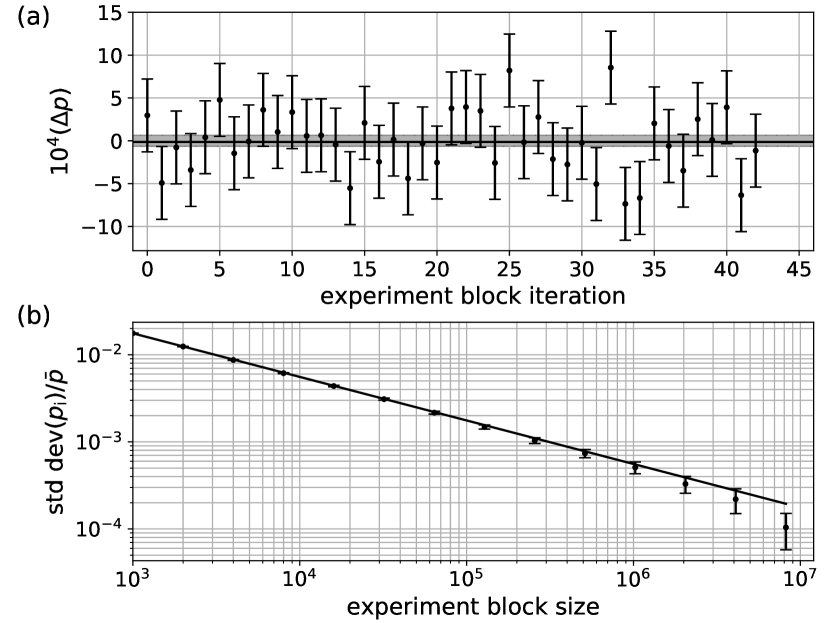
As for the measurement of , data is conditioned on the bright state detection experiment removing 16 out of 43100 blocks. From the remaining experiments, we obtain the estimate . Mean values of estimated from blocks of size are given in Fig. 4 (a) where the uncertainties are the expected projection noise, and the associated reduced is 0.76. The fractional standard deviation of mean values estimated from blocks of variable size is given in Fig. 4 (b) to further demonstrate the measurement continues to average down in accordance with the projection noise limit given by the solid line.
III.3 Measurements of pm and 1-rm
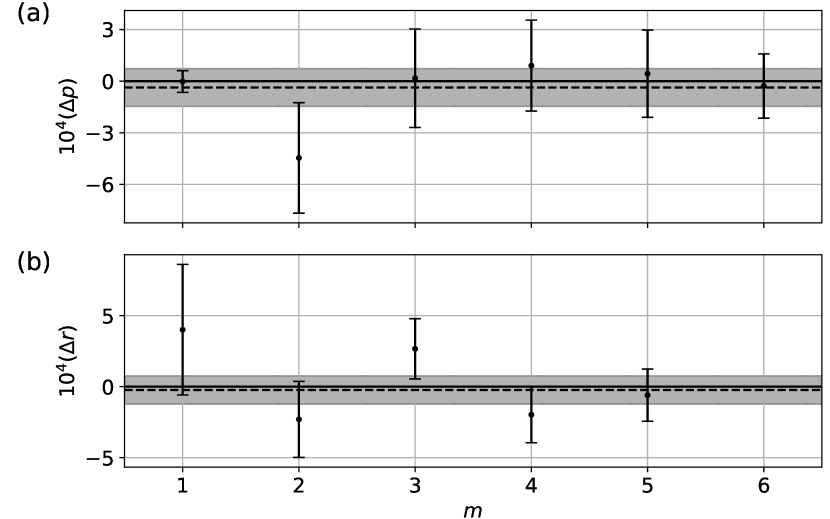
In a similar manner to the previous two subsections, consistency checks were carried out by cycling the pumping schemes in Fig. 2 (a) and (c) to measure and for a range of . Values for the estimated and for each value of are plotted in Fig. 5 where each measurement consists of approximately experiments. Taking the weighted average over in each case gives and , where we have excluded the result in the estimate for .
The value for is in good agreement with result given in the previous section. The value of is also in good agreement with obtained from the expression
| (3) |
and the measured values of and from the previous sections.
III.4 The D5/2 lifetime
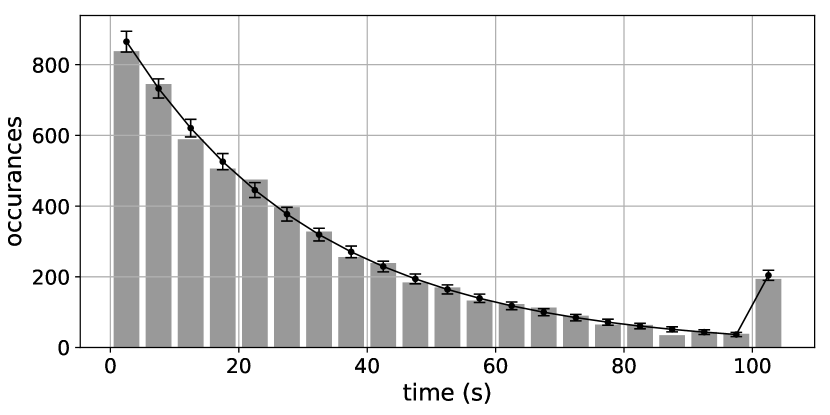
A recent measurement dijck2018lifetime gave a lifetime of 25.6(0.5) s, which was significantly less than previous experimental reports auchter2014measurement ; gurell2007laser ; royen2007monitoring ; nagourney1986shelved ; madej1990quantum and numerous calculations safronova2017forbidden . As it factors into consideration of systematic effects, we provide our own measurement for reference purposes. Our method continuously monitored a string of four ions initialized with typically one or two ions in the bright state and registered when each ion became bright. Detection light was imaged onto an electron multiplying charged-coupled device (EMCCD) camera with an imaging system having sufficient resolution to resolve the state of individual ions from a 10 ms exposure with typically better than efficiency. Images were captured every 20 ms until all ions were detected bright, which was verified by a further ten images. In these experiments, the 614 light was blocked at all times.
The initial state of the ion-string was set by optical pumping to and driving with a clock laser at 1762 nm. Ideally, the initial string would have one bright ion to facilitate sympathetic cooling for other ions in . However, the configuration could only be done probabilistically, which depends on the spatial profile of the beam, and pulse duration of the clock laser. Instances in which no ions are transferred to simply trigger a restart. Records starting with all ions dark are still used, so long as ions appear bright one at a time and the crystal is stable.
Within the detection records, there are four identifiable events in addition to the expected transition to the bright state: detection errors, swaps, melts, and dark transitions. Detection errors are identified by a single image that is different from previous and subsequent images. Swaps, as the name would imply, are a change in the ion configuration without a change in number of bright ions. Melts are characterized by all ions appearing dark for several images. They are presumably the result of a high impact collision, which destabilizes the ion crystal and may take several seconds to recrystallize. Finally, dark transitions are identified by a decrease in the number of bright ions and are the result of very rare, off-resonant excitation of the 493-nm cooling light.
Approximately 32 hours of data were collected from the same string of four ions with a total 2429 detection records starting with at least one dark ion. An additional 48 records were discarded as quantum jumps could not be unambiguously identified due to: (a) multiple ions appearing bright when starting from an all dark state (9); (b) the all bright verification step failing indicating a detection error triggered the last event (25); (c) the number of bright ions changing after a melting event (11); or (d) multiple ions transitioning at the same time (3).
Within the 2429 detection records there were 5620 bright transitions, 179 detection errors, 253 swaps, 50 melts, and 20 dark transitions. As all quantum jumps are recorded, the average of all bright transition times, , is the unbiased estimate of the lifetime. In Fig. 6, we give a histogram of all recorded bright transition times in 5 s bins. The final bin is the total of all events over 100 s. Black dots and the uncertainties are theoretical expectations given the estimated and number of events recorded. The reduced for the observed histogram is 0.97.
Note that it is important that all quantum jumps are observed in a given record when using this approach. When monitoring the decay of ions, the time for the first decay is governed by an exponential distribution with parameter , where is the decay rate for one ion. Hence, an observed set of times has a distribution
| (4) |
which is the expected independent, identical distributions for a single decay. This would not be the case if some events were missed.
With the exception of the most recent report dijck2018lifetime , the value of is consistent with previous reports auchter2014measurement ; gurell2007laser ; royen2007monitoring ; nagourney1986shelved ; madej1990quantum and a number of theoretical estimates safronova2017forbidden . Collision-induced decays are not likely significant in this experiment; of the 5620 observed decays, only 12 included an observable change in the ion configuration. In any case, such effects would decrease the observed lifetime.
IV Systematics
The experiments only involve optical pumping and state detection, which results in relatively few considerations for systematic effects. These are finite optical pumping times, unwanted scattering from leakage light, finite lifetime of and , collisions, and detection errors. The effect of finite lifetimes for and have the same effect as leakage light at 650 and 614 nm, respectively, and are considered in this context. Similarly collisions and detection errors are also considered in a similar context.
IV.1 Finite pumping times
With the exception of the lasers at 455 and 614 nm, which were locked to a wavemeter, all others lasers were locked to stable references giving correspondingly stable pumping rates. In the latter cases pumping times were more than 20 time-constants of the associated pumping rates, corresponding to a probability of for pumping errors. Hence only the 455- and 614-nm pumping times might be of concern.
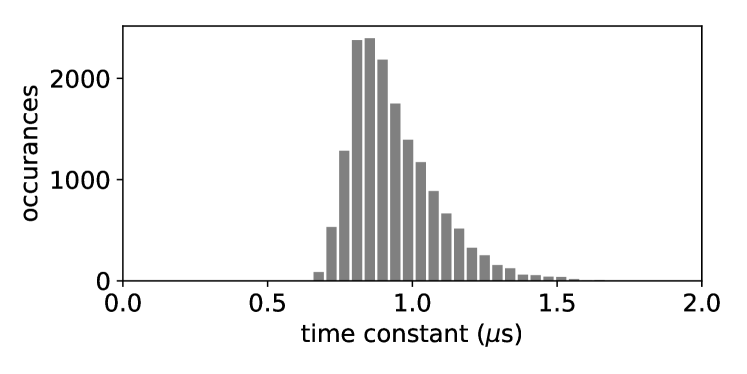
As noted in Sect. III.2, the 455-nm pumping rate was monitored in an interleaved experiment during the measurement of by measuring the population after partial pumping for a fixed time. From these measurements the pumping rate was estimated and a histogram of the associated time constant is given in Fig. 7. Almost all experiment cycles have pumping times more than 20 time-constants of the measured pumping rates rendering this effect is negligible at the level.
Repumping on the 614-nm transition occurs during the 400 s cooling which is far longer than the pumping time constant and thus insensitive to variations. The pumping rates for transitions at 455 and 614 nm were not monitored during the measurements of and in Sect. III.3. However the consistency of those results with the independently measured and demonstrate that the finite pumping times are not important to the accuracy reported.
IV.2 Leakage pumping rates
Here we describe the effects of stray light from each of the lasers and the experiments used to bound their effects. If a laser was not needed for any measurements in Sect. III, it is given that it was physically blocked and not merely switched off via an acousto-optic modulator (AOM).
IV.2.1 Stray light at 455 nm
The 455-nm laser was derived from a 910-nm diode laser, which was switched by a double-pass acousto-optic modulator (AOM) before a single-pass frequency doubling crystal. Hence the extinction ratio was very high. This was tested by optical pumping into , and waiting 10 ms before detection and cooling (with light at 614 nm blocked). In cycles we observed one event pumping to with three others attributed to collisions. The latter are identified by a sudden drop in counts that slowly recovers to the normal level.
The main effect of stray light at 455 nm would be to influence bright state detection, by pumping into the dark state, and measurements made of , by repumping during pumping of the 614-nm transition. In any case, given a pumping rate of and the typical experiment time of 400 s including pumping and detection, the probability of unwanted pumping is .
IV.2.2 Stray light at 614 nm
Stray light from the 614-nm laser effectively decreases the lifetime of the level, which was measured to be 30.14(40) s on a four ion string, as described in Sect. III.4. To test the leakage rate, we repeated this lifetime measurement with the 614-nm light unblocked but the switching AOM off. A neutral density filter attenuating the 614-nm beam was removed to give maximum pumping rate with the AOM on, which was measured to be 420 ns at the time of this test. From 239 decay events, we get an estimated lifetime of 29.7(1.9) s. This implies a scattering rate of consistent with zero. Taking as an estimated upper bound, the probability of scattering during the experiment is . During the actual data runs the measured pumping time constant was so the leakage scattering rate likewise would be smaller.
IV.2.3 Stray light at 585 nm
Similar to the 455-nm laser, the switch AOM for the 585-nm beam was placed before the doubling stage resulting in high extinction. As an initial test, the ion was left continuously scattering with the 585-nm light ‘off’, but unblocked, for about half an hour with no dark events. A further test was done by pumping to and waiting for 10 ms before detection and cooling (with light at 614 nm blocked). In 480 k experiments, we observed only one pumping event and two collisions. As with stray light at 455 nm, given a pumping rate of and typical experiment time of 400 s including pumping and detection, the probability of unwanted pumping is then .
IV.2.4 Stray light at 650 nm
Stray light from the 650-nm laser effectively decreases the lifetime of of . Unlike light at 455, 614, and 585 nm, stray light at 650 nm does not affect results at the detection step and thus one is only concerned with scattering during the pumping steps. A test for any leakage light at 650 nm was done by pumping to and waiting for with light at 455 nm on before detection and cooling. If a scattering event on the 650-nm transition results in a decay into , it is then pumped to by light at 455 nm with probability .
From 87.2 k cycles, we measured a dark probability of . From the 79.8(4.6) s lifetime of , we would expect a 2.5(3) probability of decay to in the 20 ms, of which will be pumped dark by light at 455 nm. The observed rate is thus dominated by scattering on the 650-nm transition, and the rate of scattering out of is . This effectively reduces the lifetime of to about .
For measurements of , there is little opportunity for leakage light at 650 nm to cause a problem because light at 585 nm will depopulate on a timescale of s. So the error caused by leakage light at 650 nm can only be . During measurements of , decay of the population from during the of optical pumping on the 455-nm transition will be more significant. Since the 455-nm optical pumping rate is much shorter than the pumping time, we make the approximation that any decay is immediately pumped to with probability . The error is then .
IV.2.5 Stray light at 493 nm
The 493-nm beam is double-passed by two AOMs and the measured extinction was in excess of 130 dB. We nonetheless attempted to measure this by pumping to , waiting 10 ms before optical pumping on the 585-nm transition before detection and cooling, all with light at 614 nm blocked. From 40 k cycles we saw no shelving events. Thus the scattering rate out of would be . As with stray light at 650 nm, this does not affect detection, and hence the error is .
IV.3 Collisions and detection errors
For the branching ratio measurements reported here we used a Bayesian detection scheme paez2016atomic ; myerson2008high in which the bright (dark) state probability is estimated in real time and terminates when the bright (or dark) state probability falls below a preset threshold, here set to . Count rates during the experiments were typically in the range counts/ms for a bright state, and a more stable 0.4 counts/ms for a dark state.
From the measurements sequences used for , the observed probability of detecting dark during expt. 4 was , which is taken as an estimate of a bright state detection error. Similarly, the probability of detecting a bright state during expt. 2 was , which is taken as an estimate of a dark state detection error. In both cases the observed error rates are significantly above the thresholds set in the Bayesian detection algorithm. Possible causes for excess detection errors would be collisions and the lifetime for bright and dark states, respectively.
The bright state control experiments taken during the measurements of , and and records for the lifetime measurement gave clear evidence of collisions. From the collision events identified in the measurements of and , the estimated collision rate would be roughly 1 every 48 minutes. Similarly data from the lifetime suggests a collision rate of 1 every 6 minutes, which is roughly consistent given the larger number of ions. Collision events occurring on this timescale, however, would not significantly contribute to the observed error rates, more so that these events were detected and removed. However, those events were collisions with sufficient impact to interrupt cooling over many experimental cycles. Less impactful collisions that interrupt only a single experiment would likely have a higher rate. We also note that varying fluorescent rates can influence the validity of the threshold. Simulations and independent experiments indicate this can be as much as a factor of four for a 10% drop in fluorescence. In any case, the observed bright state error rate is not significant at the level of the statistical uncertainties in the reported results.
For the dark state control experiment, decay during detection would likely trigger a bright state result. The probability of this occurring depends on the distribution of detection times. For our detection parameters, the average time to detect a dark state is s and the expected probability to decay within this time is 1.3. Although clearly a contributing factor, it is still smaller than the observed error rate. This could be due to state preparation errors associated with pumping into the dark state but, in any case, the observed dark state error rate of is not significant at the level of the statistical uncertainties in the reported results.
V Discussion
The dominant systematic in the branching ratios reported here are from detection errors and are not significant at the level of the statistical uncertainties. Thus our final values are given by
| (5) |
From these we can calculate the probabilities for decay from to , , and , denoted and , respectively. Values are given in table 2 along with those calculated from theory for comparison. As discussed in arnold2019measurements , theory values were calculated using a linearized coupled-cluster approach including single-double excitations with uncertainties estimated from additional calculation methods.
| Expt. | 0.741717(71) | 0.028031(23) | 0.230253(62) |
|---|---|---|---|
| Theory | 0.7423(18) | 0.0280(2) | 0.2297(15) |
The experimental values of differ by 2-3 standard deviations of the results reported in dutta2016exacting , but are in reasonable agreement with the values predicted in our previous work arnold2019measurements . The latter used measured branching fractions for decays from , experimental matrix elements from woods2010dipole , and theoretical estimates of matrix element ratios. With the above branching fractions and the reduced matrix element reported in woods2010dipole , matrix elements associated with decays and the lifetime can now be obtained using only experimentally determined values. The remaining matrix elements are found to be
| (6a) | ||||
| (6b) | ||||
which yields a lifetime of or linewidth . For all quantities, the dominant contribution to the uncertainties is from the reduced matrix element, .
The matrix elements given in Eq. 6 are in excellent agreement with theoretical calculations BarrettProposal , but differ from estimates obtained using experimental results combined with ratios of matrix elements calculated from theory arnold2019measurements . The ratios in question are
| (7a) | ||||
| (7b) | ||||
| and | ||||
| (7c) | ||||
which can now be obtained from the experimental results in Ref. woods2010dipole , the branching ratio reported in Ref. arnold2019measurements , and values given in Eq. 5. Specifically we have
| (8) | |||
| and | |||
| (9) | |||
where is the branching fraction for the level reported in arnold2019measurements .
Values for , , , and obtained from experimental results are given in table 3. Uncertainties are derived in the usual manner by taking the quadrature sum of independent contributions with the exception of for which relative uncertainties from each matrix element are added to allow for possible correlation in their determination. Theory values are also given for comparison with uncertainties determined from the maximum discrepancy between different computation methods arnold2019measurements . As noted in arnold2019measurements , calculated ratios are expected to be accurate as they depend only weakly on correlation corrections. Consequently, the and in the difference for and between experiment and theory maybe statistically significant. We would therefore recommend a 2 estimate of uncertainties for derived quantities such as the matrix elements in Eq. 6 and the corresponding estimates of and .
| Expt | Theory | |
|---|---|---|
| 1.4140(17) | 1.4109(2) | |
| 0.32466(13) | 0.32473(32) | |
| 0.95406(22) | 0.95338(38) | |
| 0.30974(14) | 0.30959(18) |
In general, theoretical calculations for Ba+ are in excellent agreement with experimental results derived from the matrix elements reported in woods2010dipole and branching ratios reported here and in arnold2019measurements . In all cases the matrix elements are better than of the experimentally determined values. As branching fractions provide ratios of matrix elements, all values are tied to the values of and reported in woods2010dipole . Thus, it would be of interest to confirm those results by a different methodology such as that demonstrated in hettrich2015measurement ; arnold2019dynamic . However, it would likely be difficult to reach a comparable level of accuracy via that approach.
In summary we have provided new branching ratio measurements for decays from . The new values are more than an order of magnitude more accurate than those given in previous reports and measurements have been done in two different ways to check for consistency. Together with results in woods2010dipole and arnold2019measurements , they provide a complete set of experimentally determined matrix elements for all the dominant contributions to the differential scalar polarizability, of the clock transition. In addition, we have provided a new measurement of the lifetime, which also improves upon previous values.
Acknowledgements.
This work is supported by the National Research Foundation, Prime Ministers Office, Singapore and the Ministry of Education, Singapore under the Research Centres of Excellence programme. M. S. Safronova acknowledges the sponsorship of the Office of Naval Research, USA, Grant No. N00014-17-1-2252.References
- (1) G Marx, G Tommaseo, and G Werth. Precise - and -factor measurements of Ba+ isotopes. The European Physical Journal D-Atomic, Molecular, Optical and Plasma Physics, 4(3):279–284, 1998.
- (2) KH Knöll, G Marx, K Hübner, F Schweikert, S Stahl, Ch Weber, and G Werth. Experimental factor in the metastable level of Ba+. Phys. Rev. A, 54(2):1199, 1996.
- (3) Matthew R Hoffman, Thomas W Noel, Carolyn Auchter, Anupriya Jayakumar, Spencer R Williams, Boris B Blinov, and EN Fortson. Radio-frequency-spectroscopy measurement of the Landé factor of the state of Ba+ with a single trapped ion. Phys. Rev. A, 88(2):025401, 2013.
- (4) Shannon L Woods, ME Hanni, SR Lundeen, and Erica L Snow. Dipole transition strengths in Ba+ from rydberg fine-structure measurements in Ba and Ba+. Phys. Rev. A, 82(1):012506, 2010.
- (5) JA Sherman, A Andalkar, W Nagourney, and EN Fortson. Measurement of light shifts at two off-resonant wavelengths in a single trapped Ba+ ion and the determination of atomic dipole matrix elements. Phys. Rev. A, 78(5):052514, 2008.
- (6) N Kurz, MR Dietrich, Gang Shu, R Bowler, J Salacka, V Mirgon, and BB Blinov. Measurement of the branching ratio in the decay of Ba II with a single trapped ion. Phys. Rev. A, 77(6):060501(R), 2008.
- (7) D De Munshi, T Dutta, R Rebhi, and M Mukherjee. Precision measurement of branching fractions of 138Ba+: Testing many-body theories below the 1% level. Phys. Rev. A, 91(4):040501(R), 2015.
- (8) Tarun Dutta, Debashis De Munshi, Dahyun Yum, Riadh Rebhi, and Manas Mukherjee. An exacting transition probability measurement-a direct test of atomic many-body theories. Scientific reports, 6:29772, 2016.
- (9) C Guet and WR Johnson. Relativistic many-body calculations of transition rates for Ca+, Sr+, and Ba+. Phys. Rev. A, 44(3):1531, 1991.
- (10) VA Dzuba, VV Flambaum, and JSM Ginges. Calculations of parity-nonconserving amplitudes in Cs, Fr, Ba+, and Ra+. Phys. Rev. A, 63(6):062101, 2001.
- (11) E Iskrenova-Tchoukova and MS Safronova. Theoretical study of lifetimes and polarizabilities in Ba+. Phys. Rev. A, 78(1):012508, 2008.
- (12) UI Safronova. Relativistic many-body calculation of energies, lifetimes, hyperfine constants, multipole polarizabilities, and blackbody radiation shift in 137Ba II. Phys. Rev. A, 81(5):052506, 2010.
- (13) BK Sahoo, BP Das, RK Chaudhuri, and D Mukherjee. Theoretical studies of the parity-nonconserving transition amplitude in Ba+ and associated properties. Phys. Rev. A, 75(3):032507, 2007.
- (14) Geetha Gopakumar, Holger Merlitz, Rajat K Chaudhuri, BP Das, Uttam Sinha Mahapatra, and Debashis Mukherjee. Electric dipole and quadrupole transition amplitudes for Ba+ using the relativistic coupled-cluster method. Phys. Rev. A, 66(3):032505, 2002.
- (15) Norval Fortson. Possibility of measuring parity nonconservation with a single trapped atomic ion. Phys. Rev. Lett., 70(16):2383, 1993.
- (16) MD Barrett, KJ Arnold, and MS Safronova. Polarizability assessments of ion-based optical clocks. Physical Review A, 100(4):043418, 2019.
- (17) KJ Arnold, SR Chanu, R Kaewuam, TR Tan, L Yeo, Zhiqiang Zhang, MS Safronova, and MD Barrett. Measurements of the branching ratios for decays in 138Ba+. Phys. Rev. A, 100:032503, 2019.
- (18) Kyle J Arnold, Rattakorn Kaewuam, Arpan Roy, Ting Rei Tan, and Murray D Barrett. Blackbody radiation shift assessment for a lutetium ion clock. Nature communications, 9, 2018.
- (19) Rattakorn Kaewuam, Arpan Roy, Ting Rei Tan, KJ Arnold, and MD Barrett. Laser spectroscopy of 176Lu+. Journal of Modern Optics, 65(5-6):592–601, 2018.
- (20) R Gerritsma, G Kirchmair, F Zähringer, J Benhelm, R Blatt, and CF Roos. Precision measurement of the branching fractions of the 4p decay of Ca II. The European Physical Journal D, 50(1):13–19, 2008.
- (21) R Kaewuam, TR Tan, KJ Arnold, and MD Barrett. Spectroscopy of the clock transition in 176Lu+. Phys. Rev. A, 99(2):022514, 2019.
- (22) Elwin A Dijck, Amita Mohanty, Nivedya Valappol, Mayerlin Nuñez Portela, Lorenz Willmann, and Klaus Jungmann. Lifetime of the 5d level of 138Ba+ from quantum jumps with single and multiple 138Ba+ ions. Phys. Rev. A, 97(3):032508, 2018.
- (23) Carolyn Auchter, Thomas W Noel, Matthew R Hoffman, Spencer R Williams, and Boris B Blinov. Measurement of the branching fractions and lifetime of the level of Ba+. Phys. Rev. A, 90(6):060501, 2014.
- (24) Jonas Gurell, Emile Biémont, Kiril Blagoev, Vanessa Fivet, Peter Lundin, Sven Mannervik, L-O Norlin, Pascal Quinet, Danijela Rostohar, Peder Royen, et al. Laser-probing measurements and calculations of lifetimes of the 5d and 5d metastable levels in Ba II. Phys. Rev. A, 75(5):052506, 2007.
- (25) P Royen, J Gurell, P Lundin, L-O Norlin, and S Mannervik. Monitoring the weak collisional excitation of a stored ion beam reveals the radiative decay rate of extremely long-lived metastable levels. Phys. Rev. A, 76(3):030502, 2007.
- (26) Warren Nagourney, Jon Sandberg, and Hans Dehmelt. Shelved optical electron amplifier: Observation of quantum jumps. Phys. Rev. Lett., 56(26):2797, 1986.
- (27) AA Madej and JD Sankey. Quantum jumps and the single trapped barium ion: Determination of collisional quenching rates for the 5d level. Phys. Rev. A, 41(5):2621, 1990.
- (28) UI Safronova, MS Safronova, and WR Johnson. Forbidden M1 and E2 transitions in monovalent atoms and ions. Phys. Rev. A, 95(4):042507, 2017. (and references therein).
- (29) Eduardo Paez, KJ Arnold, Elnur Hajiyev, SG Porsev, VA Dzuba, UI Safronova, MS Safronova, and MD Barrett. Atomic properties of Lu+. Phys. Rev. A, 93(4):042112, 2016.
- (30) AH Myerson, DJ Szwer, SC Webster, DTC Allcock, MJ Curtis, G Imreh, JA Sherman, DN Stacey, AM Steane, and DM Lucas. High-fidelity readout of trapped-ion qubits. Physical Review Letters, 100(20):200502, 2008.
- (31) M Hettrich, T Ruster, H Kaufmann, CF Roos, CT Schmiegelow, F Schmidt-Kaler, and UG Poschinger. Measurement of dipole matrix elements with a single trapped ion. Phys. Rev. Lett., 115(14):143003, 2015.
- (32) KJ Arnold, R Kaewuam, TR Tan, SG Porsev, MS Safronova, and MD Barrett. Dynamic polarizability measurements with 176Lu+. Phys. Rev. A, 99(1):012510, 2019.