Proxima Centauri b : A Strong Case for including Cosmic-Ray-induced Chemistry in Atmospheric Biosignature Studies
Abstract
Due to its Earth-like minimum mass of 1.27 M and its close proximity to our Solar system, Proxima Centauri b is one of the most interesting exoplanets for habitability studies. Its host star, Proxima Centauri, is however a strongly flaring star, which is expected to provide a very hostile environment for potentially habitable planets. We perform a habitability study of Proxima Centauri b assuming an Earth-like atmosphere under high stellar particle bombardment, with a focus on spectral transmission features. We employ our extensive model suite calculating energy spectra of stellar particles, their journey through the planetary magnetosphere, ionosphere, and atmosphere, ultimately providing planetary climate and spectral characteristics, as outlined in Herbst et al. (2019b). Our results suggest that together with the incident stellar energy flux, high particle influxes can lead to efficient heating of the planet well into temperate climates, by limiting CH4 amounts, which would otherwise run into anti-greenhouse for such planets around M-stars. We identify some key spectral features relevant for future spectral observations: First, NO2 becomes the major absorber in the visible, which greatly impacts the Rayleigh slope. Second, H2O features can be masked by CH4 (near infra-red) and CO2 (mid to far infra-red), making them non-detectable in transmission. Third, O3 is destroyed and instead HNO3 features become clearly visible in the mid to far infra-red. Lastly, assuming a few percent of CO2 in the atmosphere, CO2 absorption at 5.3 m becomes significant (for flare and non-flare cases), strongly overlapping with a flare related NO feature in Earth’s atmosphere.
1 Introduction
Given the recent, exciting discoveries of terrestrial-sized planets orbiting M-stars, together with the higher activity of many M-stars compared to our Sun (e.g. Reid & Hawley, 2005; Scalo et al., 2007), a better understanding of the influence and impact of such active host stars upon planetary habitability is crucial for the search for extra-terrestrial life and improving our understanding of Earth-like planets. Proxima Centauri b (hereafter Prox Cen b) is one of the most interesting exoplanets to date in terms of studying potential habitability (see, e.g., Turbet et al., 2016; Dong et al., 2017; Meadows et al., 2018; Berdyugina & Kuhn, 2019). With a minimum of 1.27 Earth masses (Anglada-Escudé et al., 2016), it may be similar in bulk properties to Earth. Although it receives only 65% of the mean total stellar irradiation (TSI) compared to Earth, Meadows et al. (2018) showed that an Earth-like atmosphere with, e.g. a surface carbon dioxide concentration of a few percent could lead to habitable conditions.
Proxima Centauri (hereafter Prox Cen), is an M5.5Ve flaring star. While direct observations of coronal mass ejections (CMEs) and corotating interaction regions (CIRs) are still challenging, model extrapolations from the Sun’s flare-CME correlation can be used to estimate the bombardment by stellar energetic particles (SEP). While the planetary magnetosphere could shield the planet from the majority of low-energy SEPs, the multitude of flares - and possible CMEs - of active M-stars may cause long-lasting changes to the planet’s atmospheric mass, composition and surface conditions (e.g. Vidotto et al., 2013). There is an ongoing debate as to whether such close-in planets orbiting active M-stars would be stripped of their atmospheres, e.g. if they lie within the star’s Alfvén sphere, leaving them without magnetospheric protection (e.g. Lammer et al., 2010; Airapetian et al., 2017a).
Including the impact of stellar high energetic particles in habitability studies in a self-consistent way requires a broad understanding of stellar, astrospheric, magnetospheric, and ion- and neutral chemical processes within the planet’s atmosphere. Modeling efforts by e.g. Segura et al. (2010), Grenfell et al. (2012), Tabataba-Vakili et al. (2016), Tilley et al. (2017), and Scheucher et al. (2018) have parameterized the top-of-atmosphere (TOA) incoming particle energy distributions, secondary particle generation in air showers, ionization of the atmosphere, and its impact on neutral atmospheric composition, using different methods. Herbst et al. (2019b) took this one step further by coupling cosmic-ray-induced magnetospheric, ionospheric and lower atmospheric processes in an interactive model suite.
Such studies are crucial in order to understand the expected range of atmospheres of such planets lying in - or close to - the habitable zone, as well as to better understand and interpret atmospheric spectra of next generation space missions such as JWST, HabEX, and LUVOIR, plus ground-based telescopes like the ELT.
2 Methodology
We apply the comprehensive model suite described in Herbst et al. (2019b) to study the habitability of Prox Cen b as influenced by the strong stellar activity of its host star.
2.1 Initial Atmosphere
We use our 1D climate-chemistry model (1D CCM) (see, e.g., Rauer et al., 2011; von Paris et al., 2015; Scheucher et al., 2018) to calculate initial climate and neutral atmospheric composition for Prox Cen b without SEP or GCR impacts. The stellar energy spectrum is taken from the Virtual Planetary Laboratory Spectral Database111http://depts.washington.edu/naivpl/content/spectral-databases-and-tools, described in Meadows et al. (2018), and the incoming stellar irradiation is scaled to Prox Cen b’s distance of 0.0485 AU. To build our planet, we start with the observed minimum mass of 1.27 ME and use the mass-radius relationship from Valencia et al. (2007) with an Earth-like ice-mass-fraction of 0.1%, which results in a radius R of 1.065 RE and a surface gravity gsurf of 10.98 ms-2 via m/R2.
We start with the Earth US standard 1976 atmosphere (Committee on Extension to the Standard Atmosphere - COESA) and increase the surface pressure to psurf = 1.119 bar, in order to maintain Earth’s atmospheric mass. We use Earth reference surface fluxes in our model similar to Segura et al. (2005) and Meadows et al. (2018) which result in the modern Earth 1976 surface mixing ratios of 1.5 ppm CH4, 190 ppm CO and 270 ppm N2O. This is achieved in our chemical scheme with 8.2x10¹⁰ molec./cm2/s CH4, 1.8x10¹¹ molec./cm2/s CO and 1.1x10⁹ molec./cm2/s N2O. These fluxes together with initial surface mixing ratios of 500 ppm H2, 21.1% O2 and 0.934% Ar are used as boundary conditions for all our Prox Cen b runs. With cloud-free conditions and a basaltic surface albedo of Asurf=0.13, we increase the CO2 amount in the atmosphere by replacing N2 with CO2 step-by-step. Our aim is to investigate potential surface habitability. We start with 5 % CO2 (72.4 % N2) and increase in steps of 5% up to 20% CO2 (57.4 % N2 respectively). The tropospheric temperatures and water amounts are calculated via adiabatic lapse rates after Manabe & Wetherald (1967) with a surface relative humidity, RH = 80%. For kinetic transport in the chemistry calculations we use eddy diffusion parameterized for Earth after Massie & Hunten (1981).
2.2 Galactic and stellar cosmic ray spectra
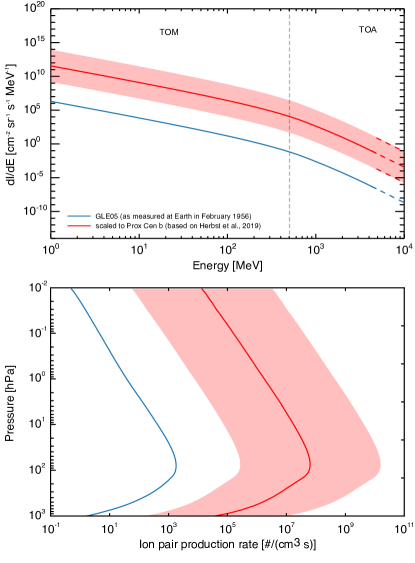
To model the impact of energetic particles on planetary atmospheres both galactic cosmic rays (GCRs) and SEPs have to be considered.Since Prox Cen is our nearest neighbor it is reasonable to assume the same local interstellar medium (LISM) conditions as for our Sun. However, analytical studies by Struminsky et al. (2017) and Sadovski et al. (2018) showed that GCRs with energies below 1 TeV are not able to reach Prox Cen b. Besides, the flux of such high energetic GCR particles in the LISM is vanishingly small and can be neglected to a first-order approximation. However due to the high stellar activity of Prox Cen, SEPs most likely have a strong impact on Prox Cen b. For example, Howard et al. (2018) most recently found strong X-ray flares with intensities up to 6.02 W/m2 on Prox Cen. Herbst et al. (2019a) suggested that such high flare intensities correspond to stellar proton fluences of protons/(cm2 sr s) around Prox Cen at 0.048 AU. To derive our actual particle spectrum, we scale from a well-known measured event spectrum. Our study is based on one of the strongest events measured on Earth, the ground level enhancement (GLE) of February 1956 (GLE05, see upper panel of Fig. 1).
2.3 Planetary magnetic field and atmospheric ionization
From Earth we know that low-energetic particles are deflected by the geomagnetic field which acts as an additional particle filter. Thus, the CR flux at the top-of-the-magnetosphere (TOM) is not the same as that at the top-of-the-atmosphere (TOA), which further depends on the magnitude and geometry of the planetary magnetic field (see, e.g., Herbst et al., 2013).
Assuming an Earth-like magnetic field, the so-called cutoff rigidity , an equivalent to the energy that particles require to enter the atmosphere at a given location, is computed with PLANETOCOSMICS (see, e.g., Desorgher et al., 2006). As a first order approximation, in this study we utilize the implemented International Geomagnetic Reference Field (IGRF, see, e.g., Thébault et al., 2015) model to describing the modern-Earth internal terrestrial magnetic field. The globally distributed cutoff rigidity values have been modeled based on the highest planetary disturbance value (k7). However, since no information on the spatial resolution of the exoplanetary atmospheric transmission is available, in this study, we assume planetary mid-latitudes around 60∘, corresponding to a mean cutoff rigidity of 1.11 GV (around 510 MeV), as indicated by the dashed line in the upper panel of Fig. 1. As can be seen, this cutoff separates the TOM from the TOA spectrum.
However, we note that the magnetospheric structure of Prox Cen b could be different from that of the Earth, for example, due to strong Joule heating caused by fast stellar winds impinging on the upper planetary atmosphere (see, e.g., Cohen et al., 2014).
Nevertheless, energetic charged particles that reach the planetary atmosphere will lose energy due to collisions with the surrounding atmospheric constituents, resulting in an ionization of the upper planetary atmosphere. Further, interactions with, for example, nitrogen, oxygen, or argon atoms might trigger the development of a secondary particle shower and associated photochemical effects. The deeper a particle is able to enter into the atmosphere, the more likely a collision with these species becomes. The generated secondary particles may further interact, resulting in the formation of atmospheric particle cascades (see, e.g., Dorman et al., 2004) and an altitude-dependent atmospheric ionization. This, however, strongly depends on the type and energy of the primary particle, the atmospheric altitude, and the location.
Neglecting GCRs and their astrospheric modulation, the SEP-induced ionization rates can numerically be described by
| (1) |
with representing the primary particle type, the upper energy of the stellar particle event, the stellar differential particle event spectrum, and the so-called atmospheric ionization yield function given as , where reflects the mean specific energy loss, while represents the atmospheric ionization energy (see, e.g., Porter et al., 1976; Simon Wedlund et al., 2011).
The event-dependent atmospheric ionization rates are modeled with the newly-developed Atmospheric Radiation Simulator (AtRIS, see Banjac et al., 2019), utilizing the provided planetary and atmospheric conditions, as well as the particle event spectrum.
2.4 Impact on atmospheric ionization, neutral-chemistry, and climate
The impact of ionization on neutral composition is modeled with the 1D Exoplanetary Terrestrial Ion Chemistry model (ExoTIC) (Herbst et al. (2019b), based on the UBIC model described, e.g., in Winkler et al. (2009); Sinnhuber et al. (2012); Nieder et al. (2014)), taking global averages of the particle-induced ionization calculated by AtRIS (Banjac et al., 2019). ExoTIC considers 60 neutral and 120 ion species for neutral, neutral-ion and photochemical reactions. Primary ions as well as excited species are provided from the ionization, dissociation and dissociative ionization of O2, N2 and O; an increase in CO2 mixing ratios may therefore lower the amount of primary ions from N2, O2 and O, but CO2 dissociative ionization is not considered.
Both particle-induced ionization and the production and loss rates of NOx (N(2D), N(4S), NO, NO2, NO3, N2O5), HOx (H, OH), HNO3, H2O, O3, O(3P), and O(1D) per initial ion, are then transferred from ExoTIC to the 1D CCM, which produces atmospheric climate and composition under SEP and GCR bombardment as input for the next iteration with AtRIS and ExoTIC. Planetary conditions are considered to be in equilibrium when neither ionization, redistribution rates, nor atmospheric conditions change.
2.5 Spectral characteristics
For spectral analysis we supply output (p, T, composition) from the coupled model suite as input into the ”Generic Atmospheric Radiation Line-by-line Infra-red Code” (GARLIC) (e.g. Schreier et al., 2014, 2018a, 2018b) using HITRAN 2016 (Gordon et al., 2017), CKD continua derived from Clough et al. (1989), visible and near infra-red (IR) cross sections from the Mainz Spectral Atlas (Keller-Rudek et al., 2013), and Rayleigh scattering parameterization from Sneep & Ubachs (2005),Marcq et al. (2011) and Murphy (1977).
3 Results
The upper panel of Fig. 1 shows the energy spectrum of GLE05 at Earth (blue) and its scaling to the energy spectrum at Prox Cen b (red, see Herbst et al., 2019a); the lower panel displays the corresponding cosmic-ray-induced ion-pair production rate calculated for the GLE05 from Earth scaled to Prox Cen b for the initial atmospheres described in Section 2.1. We see the typical ion-pair production peak in the lower stratosphere due to increasing atmospheric density.
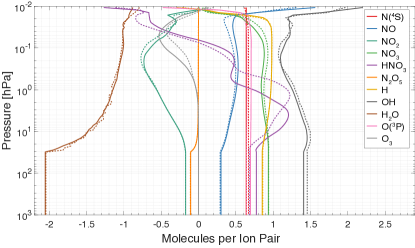
Figure 2 shows the ion-chemistry response for the species submitted from the ion-chemistry model to the 1D CCM. Tropospheric values are set to constants based on the lowermost stratospheric values. Rates for H and N(4S) are similar to Earth-like values of 1 and 0.6 respectively (compare, e.g., Herbst et al., 2019b; Sinnhuber et al., 2012), while values, e.g., for NO and OH are different. The NO formation rate is smaller than on Earth (0.5 compared to 0.58), with values for the 20 CO2 atmosphere being smaller than for the 5 CO2 case, indicating that this difference is due to the change in bulk atmosphere. The OH formation rate is distinctly larger than for Earth (1.5 compared to 1), with values for the 20 CO2 case larger than for the 5 CO2 case, again indicating that this difference is due to the change in bulk atmospheric composition. Further analysis shows that the formation rates of NO and OH from positive ion chemistry reactions are similar to Earth values, while those from negative ion chemistry are very different (not shown). Note the strong changes of the formation rates of HNO3 and O3 between the 5 and 20 CO2 cases. This might indicate that the different formation rates of OH and NO on Earth may be due to a different composition of negative NO containing cluster ions which also play a role in HNO3 formation via recombination (e.g., Sinnhuber et al., 2012). This demonstrates the importance of considering the full ion chemistry even for Earth-like (O2-N2) atmospheres.
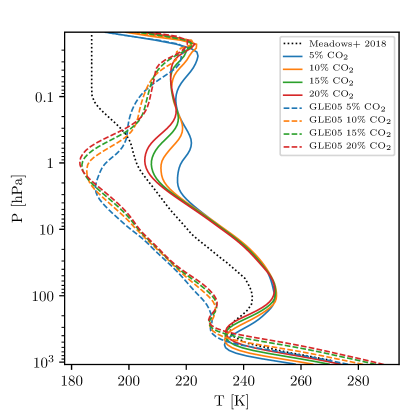
Figure 3 shows temperature profiles for scenarios having Earth-like atmospheres but with varying amounts of CO2 for quiescent stellar conditions (solid lines) and with GCRs and SEPs based on GLE05 (dashed lines). Figure 3 suggests CO2 greenhouse warming in the lower atmosphere together with associated mesospheric cooling. Associated with the weak stellar irradiation, results suggest 20% mixing ratio by volume (vmr) of CO2 is needed in the non-flare cases to achieve global average temperatures that support liquid surface water. In the middle atmosphere, results suggest that the temperature is not sensitive to changes in CO2. A comparison of our 5% CO2 run (solid-blue) with Meadows et al. (2018) who assumed an Earth-like Prox Cen b with 5% CO2 and who did not consider cosmic rays (black-dotted), generally shows reasonable agreement, although some differences arise due to the different assumptions used for CH4 surface fluxes. Our model with post-industrial surface fluxes (solid blue line, 5% CO2 in Fig. 4) yields CH4 concentrations of 5300 ppm, while Meadows et al. (2018) reported 1000 ppm with lower pre-industrial CH4 fluxes. In our model this leads to a stronger CH4 anti-greenhouse, hence lower surface temperatures with a warmer stratosphere.
Figure 3 additionally shows (dashed lines) atmospheric temperatures for flaring scenarios of Prox Cen with the calculated GLE05 induced ionization from Figure 1 and chemical production/loss rates from Figure 2. Surface CH4 here is decreased from 5300 down to 400 ppm (although CH4 vmr are still essentially iso-profiles as shown in Fig. 4), yielding a weaker anti-greenhouse effect, resulting in higher surface temperatures for the flaring cases. Interestingly, all four tested CO2 concentrations are sufficient for the flaring cases to warm the surface and
lead to habitable conditions. The 15% CO2 scenario outputs Earth-like 288 K global average surface temperatures.
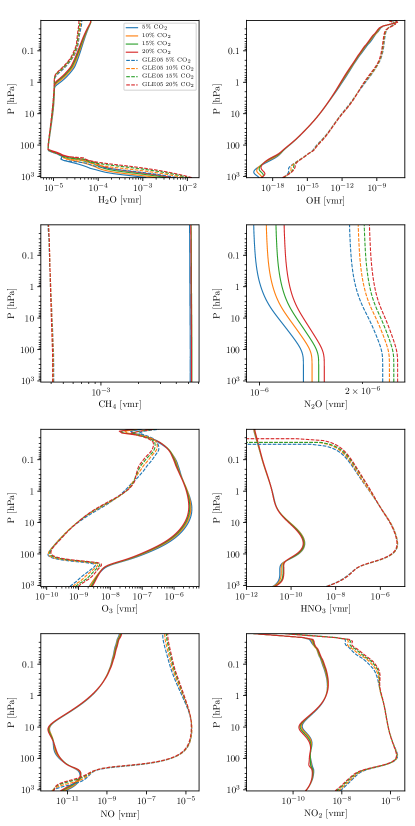
Figure 4 shows atmospheric vmr profiles of H2O, OH, CH4, N2O, O3, HNO3, NO, and NO2 for the quiescent and flaring cases from Figure 3. Our CH4 abundances are strongly increased compared to Earth. This arises (see Segura et al., 2005) due to lower UVB radiation which lowers O3 photolysis; this then lowers O(1D) (a product of O3 photolysis), which lowers the rate of H2O+O(1D), hence lowers OH and increases CH4. For the flaring cases, however, CH4 is effectively reduced by high amounts of cosmic-ray-induced OH, via . Stratospheric ozone strongly decreases similarly to Scheucher et al. (2018). Increases in OH and NO (which can remove stratospheric ozone and stimulate smog ozone) for the flaring cases are a result of the cosmic-ray-induced production rates from ion redistribution into neutral species. HNO3 increases by up to four orders of magnitude compared to the non-flaring case, mostly due to photochemistry (its main in-situ source is via the reaction: [’M’ refers to any third body]. The gas-phase precursors of HNO3 i.e. NO2 and OH, are stimulated by cosmic-ray-induced chemistry. H2O does not show significant changes in molecular abundance. NO2 shows up to four orders of magnitude increased concentrations for the flaring compared to quiescent case. Fig. 2 shows cosmic-ray-induced ion-chemical destruction of NO2. NO2 is incorporated into cluster ions which release other N-containing species under recombination, either NO, NO3 or HNO3, which then form NO2 in a multitude of secondary neutral gas-phase reactions, overwhelming the apparent loss. One important source is the higher UVB radiation environment in the lower-middle atmosphere because of the lowered O3 concentration, hence reduced UVB absorption. This increases photolysis of, most importantly, HNO3, HO2NO2 and N2O5, producing large amounts of NO2. Further, NO2 is a direct product of the O3 destruction mechanism starting with , and cosmic-ray-induced NOx and HOx also contribute significantly via the two reactions and . N2O, on the contrary, does not show changes due to cosmic rays significant enough to show up in our simulated spectra (Fig. 5). The 65% increase in overall abundance in Fig. 4 for our flaring cases compared to the quiescent runs is a little counter intuitive at first, because with the large decrease in O3 amounts the overall UVB and UVC radiation environment, i.e. photolysis of other species, increases. Our anaylsis showed that UVC fluxes 198 nm is decreased significantly, reducing N2O photolysis - the major N2O sink in our model. From a detailed investigation of changes in molecular abundances of other major absorbers overlapping in wavelength range with N2O photolysis (significant 175-240 nm), together with their photolysis cross-sections, showed a steep increase of HNO3 and NO2 (and some increase for HO2NO2 below 20 hPa) photolysis rates, hence shielding of N2O. Small changes in N2O with the variation of CO2 contents are most importantly related to temperature changes, i.e. H2O steam amounts and photolysis rates in the atmosphere.
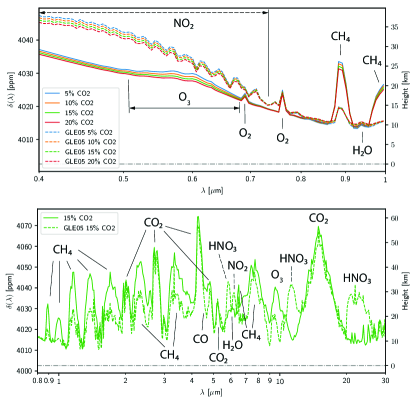
Figure 5 shows synthetic transmission spectra calculated by GARLIC. The visible to near IR (Fig. 5, upper panel) is a key region, e.g. for biosignature studies of, for example, O2 with the ELT (e.g. Snellen, 2014; Rodler & López-Morales, 2014). Bétrémieux & Kaltenegger (2013) noted the importance of including, for example, O2 and O3 absorption in this region, which is overlooked by many biosignature studies, but which is included in our work.
Our results (Fig. 5, upper panel) suggest a significant difference between the flaring and quiescent runs - but smaller differences due to changing composition for the individual flaring or quiescent runs. All quiescent runs show the O3 Chappuis bands around 600 nm known from Earth, with minor differences in strength, due to the slightly different strato-/mesospheric O3 amounts. This absorption feature is rather small compared with Earth’s atmosphere because of the generally lower O3 amounts of 70 Dobson units (DU) for the quiescent case. In the flaring runs, there is a striking broad absorption feature from 400 - 700 nm attributed to NO2. Due to high amounts of cosmic-ray-induced NO2, these features act almost as a continuum in the visible (making the sky brownish-red), stronger than the 600 nm O3 feature previously mentioned, and could potentially be misinterpreted as a steeper Rayleigh slope. We propose the NO2 feature as a spectral ”marker” of N2-O2 atmospheres which are subject to cosmic rays (see also Airapetian et al., 2017b).
The IR spectrum (Fig. 5, lower panel) shows a direct comparison of the 15% CO2 runs, where the flaring case leads to Earth-like temperatures of 288 K in Fig. 3. Again, the effect of varying composition was minor (not shown). As expected, the CH4 features in the mid IR, coinciding with H2O features, are significantly reduced because of reduced CH4 in the flaring runs. Similar to Tabataba-Vakili et al. (2016) and Scheucher et al. (2018), strong flare features from HNO3 occur around 11 m and 21 m, but the O3 absorption feature around 9.6 m is greatly reduced.
Around 5.3 m, we see a narrow but distinct absorption feature around 10 ppm (in ) above the lower-atmosphere H2O absorption background. On modern Earth, there is a band at 5.3 m from NO via stratospheric N2O oxidation which varies considerably with geomagnetic activity, due to fast solar wind, CIRs and CMEs, as well as from extra NO production in the upper mesosphere / lower thermosphere from far-UV and EUV photoionization, and particle impact ionization. Therefore the strength of this NO feature can be treated as an SEP indicator in Earth’s atmosphere (see, e.g., Airapetian et al., 2017b). However, in our modeled spectra, this feature (peaking at 5.35 m) has the same strength for both the flaring and the quiescent cases. We identified this as a weak absorption band of CO2, which generally receives little attention in the literature e.g. because of the much stronger CO2 bands in the spectral vicinity at 4.3 and 4.8 m. This 5.3 m spectral feature could therefore lead to misinterpretation of future observations because of the above discussed clear correlation with flares in Earth’s atmosphere.
It is striking that there is no single significant H2O feature in the spectrum. We tested this up to JWST-like spectral resolutions of R = 3000 in the near IR (not shown) by removing H2O absorption from the spectrum. The resulting spectra showed differences of no more than 2 ppm (in ) in selected CH4 window regions. H2O concentrations in an Earth-like troposphere decrease rapidly with height with the existence of a cold trap, hence major H2O absorption features arise lower down in the atmosphere. For example, in the 15 m CO2 band H2O would become optically thick at 28 km in our runs shown in Fig. 5, whereas CO2 makes the atmosphere opaque at heights of 61 km in transmission; thus, the absorption due to H2O could not be measured. Similarly, between 1-4 m all H2O absorption bands are overlapped by strong CH4 absorption which makes the atmosphere opaque at around 40 km. It is noteworthy, that in the absence of SEPs there is a weak feature from the H2O absorption band around 6 m as pointed out by Meadows et al. (2018) and indicated in Fig 5, which would be difficult to distinguish from background noise in our simulations.
4 Summary
We performed a habitability study of Prox Cen b assuming an Earth-like atmosphere, focusing on the influence of SEPs from stellar flares upon spectral transmission features. We applied our extensive model suite discussed in Herbst et al. (2019b), which includes: the calculation of SEP fluxes and spectral energy distributions; their precipitation through a planetary magnetosphere and atmosphere; cosmic-ray-induced atmospheric ionization; ion redistribution within the atmosphere; and atmospheric climate and neutral composition. Our results suggest a few words of caution for the analysis of spectra from future observations of such planets around M-dwarf stars.
Given the general lack of in-situ particle measurements from flaring events of Prox Cen, we scale the known SEP flux of GLE05 measured at Earth to the intensity of the measured flare (Herbst et al., 2019a) and the orbit of Prox Cen b, then calculate the ion-pair production in a theoretical Earth-like atmosphere with elevated CO2 amounts in order to warm the planet at its position of 0.65 TSI. Together with the production and loss rates of neutral species from the redistribution of cosmic-ray-induced ions, we find steady-state climate and atmospheric compositions that enable liquid surface water. Our results suggest that SEPs might play a crucial role in efficiently warming such planets, which would otherwise be too cold to be habitable (by reducing the anti-greenhouse gas CH4). Numerous studies (e.g. Segura et al., 2005; Rauer et al., 2011) have suggested that planets with Earth-like biomasses could develop methane abundances orders of magnitude higher than on Earth because of the different stellar spectrum (especially the reduced UVB), which can then lead to anti-greenhouse methane cooling (see Fig. 3).
By including SEPs from stellar flares, strong production of cosmic-ray-induced OH efficiently reduces CH4, hence results in temperate global average surface temperatures for all our test atmospheres. This result is exciting because strong SEPs and flares are generally considered to be disfavorable for planetary habitability, because of potentially increased atmospheric escape and increases in surface dosage. We suggest that the habitability of Earth-like planets near the outer HZ of cooler stars could depend strongly on both, CH4 and CO2. Methane, in turn, can be sensitive to cosmic-ray-induced chemistry.
We identify some key features in our synthetic planetary transmission spectra (Fig. 5), some related to SEPs, and note some cautions related to the possible misinterpretation of future spectral observations.
N2-O2-dominated atmospheres could produce large cosmic-ray-induced amounts of NO2, strongly absorbing between 400 - 700 nm. This could lead to erroneous Rayleigh slope extraction from observations, which could potentially influence estimates of e.g. bulk atmospheric composition or/and atmospheric dust and aerosols / hazes.
No significant H2O absorption feature can be seen in our modeled transmission spectra. This is because H2O absorption bands are strongly overlapped by CH4 and CO2 absorption, which occurs higher up in the atmosphere, thus making these spectral regions opaque for radiation. One would need high-resolution spectroscopy to infer H2O from near-mid IR transmission spectroscopy of such planets.
Results suggest HNO3 spectral features become apparent in the mid and far IR, similar to results discussed in Tabataba-Vakili et al. (2016); Scheucher et al. (2018). These features might not only be an indicator for SPEs bombarding a planet with an N2-O2 atmosphere, but could potentially be used as an indirect hint for the presence of H2O where one cannot see its absorption features in the spectrum.
O3 features are rather weak for scenarios around quiescent mid-late type M-dwarfs. This arises mainly due to photochemical responses due to the different stellar spectrum (see e.g. Segura et al., 2005; Grenfell et al., 2012). The weakened ozone features are then even further reduced by SEPs.
We calculate a 5.3 m feature with similar strength in both our non-flaring as well as flaring star runs. This comes from a weak 5.35 m absorption band of CO2 and overlaps strongly with the 5.3 m NO absorption feature that is evident after SEP events on Earth. Therefore one might misinterpret the presence of such a feature as an Earth-like N2-O2 atmosphere under strong SEP bombardment.
In a nutshell, we applied our extensive model suite to study the influence of cosmic rays on Prox Cen b as a potentially Earth-like planet and identified some interesting spectral features with strong potential for general characterization and misinterpretation of atmospheric compositions of Earth-like planets in the HZ around M-stars.
References
- Airapetian et al. (2017a) Airapetian, V. S., Glocer, A., Khazanov, G. V., et al. 2017a, The Astrophysical Journal, 836, L3. https://doi.org/10.3847%2F2041-8213%2F836%2F1%2Fl3
- Airapetian et al. (2017b) Airapetian, V. S., Jackman, C. H., Mlynczak, M., Danchi, W., & Hunt, L. 2017b, Scientific Reports, 7, 14141. https://doi.org/10.1038/s41598-017-14192-4
- Anglada-Escudé et al. (2016) Anglada-Escudé, G., Amado, P. J., Barnes, J., et al. 2016, Nature, 536, 437. https://doi.org/10.1038/nature19106
- Banjac et al. (2019) Banjac, S., Herbst, K., & Heber, B. 2019, Journal of Geophysical Research: Space Physics, 124, 50. https://doi.org/10.1029/2018JA026042
- Berdyugina & Kuhn (2019) Berdyugina, S. V., & Kuhn, J. R. 2019, The Astronomical Journal, 158, 246. https://doi.org/10.3847%2F1538-3881%2Fab2df3
- Bétrémieux & Kaltenegger (2013) Bétrémieux, Y., & Kaltenegger, L. 2013, The Astrophysical Journal, 772, L31. https://doi.org/10.1088%2F2041-8205%2F772%2F2%2Fl31
- Clough et al. (1989) Clough, S., Kneizys, F., & Davies, R. 1989, Atmospheric Research, 23, 229 . http://www.sciencedirect.com/science/article/pii/0169809589900203
- Cohen et al. (2014) Cohen, O., Drake, J. J., Glocer, A., et al. 2014, ApJ, 790, 57
- Desorgher et al. (2006) Desorgher, L., Flückiger, E. O., & Gurtner, M. 2006, in 36th COSPAR Scientific Assembly, Vol. 36
- Dong et al. (2017) Dong, C., Lingam, M., Ma, Y., & Cohen, O. 2017, The Astrophysical Journal, 837, L26. https://doi.org/10.3847%2F2041-8213%2Faa6438
- Dorman et al. (2004) Dorman, L. I., Pustil’Nik, L. A., Sternlieb, A., et al. 2004, IEEE Transactions on Plasma Science, 32, 1478
- Gordon et al. (2017) Gordon, I., Rothman, L., Hill, C., et al. 2017, Journal of Quantitative Spectroscopy and Radiative Transfer, 203, 3 , hITRAN2016 Special Issue. http://www.sciencedirect.com/science/article/pii/S0022407317301073
- Grenfell et al. (2012) Grenfell, J. L., Grießmeier, J.-M., von Paris, P., et al. 2012, Astrobiology, 12, 1109
- Herbst et al. (2013) Herbst, K., Kopp, A., & Heber, B. 2013, Annales Geophysicae, 31, 1637
- Herbst et al. (2019a) Herbst, K., Papaioannou, A., Banjac, S., & Heber, B. 2019a, Astron. Astrophys., 621. https://doi.org/10.1051/0004-6361/201832789
- Herbst et al. (2019b) Herbst, K., Grenfell, J., Sinnhuber, M., et al. 2019b, Astron. Astrophys., 631. https://doi.org/10.1051/0004-6361/201935888
- Howard et al. (2018) Howard, W. S., Tilley, M. A., Corbett, H., et al. 2018, ArXiv e-prints, arXiv:1804.02001
- Keller-Rudek et al. (2013) Keller-Rudek, H., Moortgat, G. K., Sander, R., & Sörensen, R. 2013, Earth System Science Data, 5, 365. https://www.earth-syst-sci-data.net/5/365/2013/
- Lammer et al. (2010) Lammer, H., Selsis, F., Chassefière, E., et al. 2010, Astrobiology, 10, 45, pMID: 20307182. https://doi.org/10.1089/ast.2009.0368
- Manabe & Wetherald (1967) Manabe, S., & Wetherald, R. T. 1967, Journal of Atmospheric Sciences, 24, 241
- Marcq et al. (2011) Marcq, E., Belyaev, D., Montmessin, F., et al. 2011, Icarus, 211, 58 . http://www.sciencedirect.com/science/article/pii/S0019103510003271
- Massie & Hunten (1981) Massie, S., & Hunten, D. 1981, Journal of Geophysical Research: Oceans, 86, 9859
- Meadows et al. (2018) Meadows, V. S., Arney, G. N., Schwieterman, E. W., et al. 2018, Astrobiology, 18, 133, pMID: 29431479. https://doi.org/10.1089/ast.2016.1589
- Murphy (1977) Murphy, W. F. 1977, The Journal of Chemical Physics, 67, 5877. https://doi.org/10.1063/1.434794
- Nieder et al. (2014) Nieder, H., Winkler, H., Marsh, D. R., & Sinnhuber, M. 2014, Journal of Geophysical Research (Space Physics), 119, 2137
- Porter et al. (1976) Porter, H. S., Jackman, C. H., & Green, A. E. S. 1976, J. Chem. Phys., 65, 154
- Rauer et al. (2011) Rauer, H., Gebauer, S., Paris, P. V., et al. 2011, A&A, 529, A8
- Reid & Hawley (2005) Reid, I. N., & Hawley, S. L. 2005, New Light on Dark Stars: Red Dwarfs, Low-Mass Stars, Brown Dwarfs (Springer Berlin Heidelberg), doi:10.1007/3-540-27610-6. https://doi.org/10.1007/3-540-27610-6
- Rodler & López-Morales (2014) Rodler, F., & López-Morales, M. 2014, The Astrophysical Journal, 781, 54. https://doi.org/10.1088%2F0004-637x%2F781%2F1%2F54
- Sadovski et al. (2018) Sadovski, A. M., Struminsky, A. B., & Belov, A. 2018, Astronomy Letters, 44, 324. https://doi.org/10.1134/S1063773718040072
- Scalo et al. (2007) Scalo, J., Kaltenegger, L., Segura, A., et al. 2007, Astrobiology, 7, 85, pMID: 17407405. https://doi.org/10.1089/ast.2006.0125
- Scheucher et al. (2018) Scheucher, M., Grenfell, J., Wunderlich, F., et al. 2018, ApJ, 863, 6. https://doi.org/10.3847/1538-4357/aacf03
- Schreier et al. (2014) Schreier, F., Gimeno García, S., Hedelt, P., et al. 2014, JQSRT, 137, 29. https://doi.org/10.1016/j.jqsrt.2013.11.018
- Schreier et al. (2018a) Schreier, F., Milz, M., Buehler, S. A., & von Clarmann, T. 2018a, JQSRT, 211, 64. https://doi.org/10.1016/j.jqsrt.2018.02.032
- Schreier et al. (2018b) Schreier, F., Städt, S., Hedelt, P., & Godolt, M. 2018b, Molec. Astrophysics, 11, 1. https://doi.org/10.1016/j.molap.2018.02.001
- Segura et al. (2005) Segura, A., Kasting, J. F., Meadows, V., et al. 2005, Astrobiology, 5, 706. http://adsabs.harvard.edu/abs/2005AsBio...5..706S
- Segura et al. (2010) Segura, A., Walkowicz, L. M., Meadows, V., Kasting, J., & Hawley, S. 2010, Astrobiology, 10, 751
- Simon Wedlund et al. (2011) Simon Wedlund, C., Gronoff, G., Lilensten, J., Ménager, H., & Barthélemy, M. 2011, Annales Geophysicae, 29, 187
- Sinnhuber et al. (2012) Sinnhuber, M., Nieder, H., & Wieters, N. 2012, Surveys in Geophysics, 33, 1281
- Sneep & Ubachs (2005) Sneep, M., & Ubachs, W. 2005, Journal of Quantitative Spectroscopy and Radiative Transfer, 92, 293
- Snellen (2014) Snellen, I. 2014, Philosophical Transactions of the Royal Society A: Mathematical, Physical and Engineering Sciences, 372, 20130075. https://royalsocietypublishing.org/doi/abs/10.1098/rsta.2013.0075
- Struminsky et al. (2017) Struminsky, A., Sadovski, A., & Belov, A. 2017, Cosmic Rays near Proxima Centauri b, Zenodo, The work was partly supported by the Russian Foundation for Basic Research (grant 16-02-00328) and the Programm 1.7 P2 of the Russian Academy of Sciences., doi:10.5281/zenodo.1064778. https://doi.org/10.5281/zenodo.1064778
- Tabataba-Vakili et al. (2016) Tabataba-Vakili, F., Grenfell, J. L., Grießmeier, J.-M., & Rauer, H. 2016, A&A, 585, A96
- Thébault et al. (2015) Thébault, E., Finlay, C. C., Beggan, C. D., et al. 2015, Earth, Planets and Space, 67, 79
- Tilley et al. (2017) Tilley, M. A., Segura, A., Meadows, V. S., Hawley, S., & Davenport, J. 2017, ArXiv e-prints, arXiv:1711.08484
- Turbet et al. (2016) Turbet, M., Leconte, J., Selsis, F., et al. 2016, A&A, 596, A112. https://doi.org/10.1051/0004-6361/201629577
- Valencia et al. (2007) Valencia, D., Sasselov, D. D., & O’Connell, R. J. 2007, The Astrophysical Journal, 665, 1413. https://doi.org/10.1086%2F519554
- Vidotto et al. (2013) Vidotto, A. A., Jardine, M., Morin, J., et al. 2013, A&A, 557, A67
- von Paris et al. (2015) von Paris, P., Selsis, F., Godolt, M., et al. 2015, Icarus, 257, 406 . http://www.sciencedirect.com/science/article/pii/S0019103515002389
- Winkler et al. (2009) Winkler, H., Kazeminejad, S., Sinnhuber, M., Kallenrode, M. B., & Notholt, J. 2009, Journal of Geophysical Research (Atmospheres), 114, D00I03