Structure and fluctuations of the premelted liquid film of ice at the triple point.
Abstract
In this paper we study the structure of the ice/vapor interface in the neighborhood of the triple point for the TIP4P/2005 model. We probe the fluctuations of the ice/film and film/vapor surfaces that separate the liquid film from the coexisting bulk phases at basal, primary prismatic and secondary prismatic planes. The results are interpreted using a coupled sine Gordon plus Interface Hamiltonian model. At large length-scales, the two bounding surfaces are correlated and behave as a single complex ice/vapor interface. For small length, on the contrary, the ice/film and film/vapor surfaces behave very much like independent ice/water and water/vapor interfaces. The study suggests that the basal facet of the TIP4P/2005 model is smooth, the prismatic facet is close to a roughening transition, and the secondary prismatic facet is rough. For the faceted basal face, our fluctuation analysis allows us to estimate the step free energy in good agreement with experiment. Our results allow for a quantitative characterization of the extent to which the adsorbed quasi-liquid layer behaves as water, and explains experimental observations which reveal similar activation energies for crystals grown in bulk vapor or bulk water.
The Version of Record of this article has been published and is available is Molelcular Physics, 05 March 2019, http://www.tandfonline.com/10.1080/00268976.2019.1583388
I Introduction
Snowflakes offer the opportunity to observe the beautiful structure of ice micro-crystals.Libbrecht (2005) The striking symmetry that is revealed, is related to the stability of well defined crystal facets, which intersect at the edges making well defined angles.Pfalzgraff et al. (2010) As temperature is increased, some crystal facets altogether disappear, while the edges and sides gradually blur and eventually become rounded.
Whereas ice crystals in snowflakes grow under kinetic control,Libbrecht (2005); Ball (2016); Demange et al. (2017) the process described is an illustration of a thermodynamic surface phase transition.Burton et al. (1951); van Beijeren (1977); Abraham (1980); Lipowsky (1982); Fisher and Weeks (1983); Rommelse and den Nijs (1987); Ball and Evans (1988); Lipowsky (1990); Evans (1992) These transitions, which are best characterized for independent well defined facets at equilibrium, determine overall the equilibrium crystal shape of a crystalline solid.Herring (1951); Rottman and Wortis (1984); Chaikin and Lubensky (1995); Kuroda and Lacmann (1982)
In surface physics there are two main types of phase transitions, roughening and surface melting, that have been characterized on the basis of well understood solvable models.van Beijeren (1977); Abraham (1980); Lipowsky (1982); Fisher and Weeks (1983); Lipowsky (1990)
The roughening transition characterizes the thermal disorder that occurs on facets of a two phase system well away from the triple point. This transition separate smooth facets, with a low number density of defects, and small finite perpendicular fluctuations, from rough surfaces, exhibiting a large number of defects and diverging height fluctuations that do not differ at a coarse scale from those found in fluid-fluid interfaces. It is believed that when the correlation length of parallel height fluctuations becomes larger than the size of the crystal, the facet disappears and becomes round.Jayaprakash et al. (1983)
Surface melting characterizes a different type of transition that involves three, rather than two phases. It occurs as the crystal is heated close to the melting point. In such cases, it is often found that the metastable liquid phase that is approached from below builds a small surface layer, of finite thickness.Conde et al. (2008); Yang et al. (2013); Limmer and Chandler (2014); Kling et al. (2018); Pickering et al. (2018); Mohandesi and Kusalik (2018); Qiu and Molinero (2018) This process is known as premelting. Surface melting occurs in those other instances where the thickness of the premelting layer diverges as the melting point is approached, very much as in a wetting transition.Schick (1990) For the the ice/vapor interface, surface melting can only occur at the triple point, and it is defined as a divergence of the premelting film as the triple point is approached along the sublimation line. Unfortunately, the relation of premelting with the corresponding equilibrium crystal shape remains unclear, and it is a matter of concern whether the premelting transition could round off the edges of a crystal shape as in roughening.Dosch et al. (1995)
Whereas these prototypical transitions serve as a benchmark to assess surface induced disorder in real systems, they may be well insufficient to interpret the variety of complex surface phenomena that are found in real substances. In the case of a roughening transition, for example, one sometimes finds roughening can occur on surfaces which preserve the crystalline structure (the vertical displacements remain congruent with the lattice spacing), as in surfaces of nickel,Cao and Conrad (1990) while other reports refer to a surface disordering transition with complete loss of the translational order on the surface, as in gold.Gibbs et al. (1988) Already for such simple atomic crystals, it is possible to find surfaces that neither premelt, nor roughen, that roughen without premelting, or exhibit both roughening and premelting before the triple point is reached.Mei and Lu (2007); Yang et al. (2013)
A key issue that could be missing in the conventional picture is the interplay of roughening and premelting with the related phenomenon of layering.Ball and Evans (1988); Evans (1992) This is a sequence of layer by layer transitions that can occur on top of a substrate and lead to the discontinuous growth of an adsorbed film. At the mean field level, typically surface melting is preceded by a large number of such transitions. However, surface phase transitions related to short-range molecular correlations are fluctuation dominated processes,Jasnow (1984) and the mean filed picture is often considerably transformed after renormalization of surface capillary waves.Chernov and Mikheev (1988, 1989); Henderson (1994)
Given this variety of surface phenomena, it is not unexpected to find how difficult and controversial the characterization of equilibrium surface properties is in such a common and important molecular crystal as ice.Dash et al. (2006); Elbaum (1991); Elbaum and Schick (1991); Elbaum et al. (1993); Lied et al. (1994); Dosch et al. (1995); Bluhm et al. (2002); Sazaki et al. (2012); Asakawa et al. (2015, 2016); Murata et al. (2016); Sánchez et al. (2017); Slater and Michaelides (2019)
There is currently ample experimental evidence indicating that the ice/vapor crystal surface exhibits premelting at both the basal and prismatic planes close to the triple point.Elbaum et al. (1993); Lied et al. (1994); Dosch et al. (1995); Bluhm et al. (2002); Sadtchenko and Ewing (2002); Sánchez et al. (2017); Smit and Bakker (2017) However, several features of this transition layer are still a matter of debate. Firstly, the temperature at which the premelting transition occurs, which varies from -50 C, to a few Celsius below the triple point depending on the experimental source.Dash et al. (2006) Secondly, there is also no consensus on the thickness of the premelting layer, which varies between 10 to several hundred Angstroms close to the triple point.Dash et al. (2006); Michaelides and Slater (2017) Thirdly, the nature of the transition itself, which appear likely to be a continuous process as reported recently.Pickering et al. (2018); Qiu and Molinero (2018) Finally, It had been apparently unresolved for a long time whether the premelting layer remains finite,Elbaum (1991); Elbaum and Schick (1991); Elbaum et al. (1993) or diverges (surface melting),Lied et al. (1994); Dosch et al. (1995) at the triple point. However, recent advances in confocal microscopy have allowed the direct visual inspection of ice surfaces which clearly confirm previous hints of the appearance of water droplets on the ice surface very close to the triple point.Elbaum et al. (1993); Gonda et al. (1999) Such observations seem to confirm that the ice surface remains only partially wet at the triple point, whence, does not exhibit surface melting.Sazaki et al. (2012); Asakawa et al. (2015, 2016); Murata et al. (2016) Notice, however, that there is some evidence that contamination of water or air largely increases the size of the premelted film,Elbaum et al. (1993); Wettlaufer (1999); Bluhm et al. (2002); Mitsui and Aoki (2019), an indication that could reconcile to some extent the conflicting results from different laboratories.Elbaum (1991); Elbaum and Schick (1991); Elbaum et al. (1993) Finally, very recent experiments show indications of layering on the basal ice surface,Sánchez et al. (2017); Michaelides and Slater (2017) though the interpretation of Frequency Sum Generation experiments is difficult and often consistent with alternative explanations.Smit and Bakker (2017) A layer-wise packing of adsorbed liquid onto a solid surface is certainly not unexpected by liquid state theory,Ball and Evans (1988); Evans (1992) but as noticed earlier, this is a fluctuation dominated phenomena and it is still to be determined whether this structural feature is a proper thermodynamic surface phase transition in this case.Chernov and Mikheev (1988)
Further hints on the ice surface may be obtained from crystal growth experiments.Libbrecht (2013) Controlled growth of ice crystals at about 10-20 ÂC below zero, usually produce prisms, with flat basal facets and hexagonal shape, whether as grown from the vapor,Elbaum (1991) or the liquid phase.Maruyama et al. (1997) After the appearance of a thin premelting film, the hexagonal shape of such crystallites is observed to round as the triple point approaches, possibly indicating a roughening transition of the prismatic facets .Elbaum (1991); Maruyama et al. (1997); Gonda et al. (1999); Asakawa et al. (2015) In such studies, the basal plane is found to remain smooth, indicating no roughening of the basal orientation. Such observations are consistent with an ice surface exhibiting premelting before roughening for the prismatic face, and no roughening at all for the basal face.
On the other hand, there are claims that the equilibrium crystal shape of ice should be completely rounded above -6 C,Gonda and Yamakazi (1978); Colbeck (1983); Dosch et al. (1995) an observation which would indicate fully roughened planes. In fact, x-ray reflectivity experiments have reported observation of a fully rough surface of the basal plane before the advent of premelting at about -13 C.Lied et al. (1994); Dosch et al. (1995) These observations seem reasonable on theoretical grounds, since theoretical estimates of the surface free energy,Libbrecht (2013) as well as computer simulations of different ice models, indicate a very small anisotropy of the surface free energy,Benet et al. (2014a) whence, the expectation of a quasi-spherical equilibrium crystal shape.
Accordingly, it would appear that not only the thickness of the premelting film is unknown. Even the relative order of the premelting and roughening transitions, or the occurrence of the latter altogether, are still a matter of debate.
Simulation studies could be a very useful tool for the study of the ice/vapor interface, since direct observation at atomic scale is possible. Studies up to date have confirmed the presence of a premelting layer, but it is difficult to determine whether these models exhibit surface melting, for problems of limited system sizes and inaccuracy in the location of the melting point.Furukawa and Nada (1997); Conde et al. (2008); Bishop et al. (2009); Pereyra and Carignano (2009); Pan et al. (2011) Recently, Limmer and Chandler performed extensive simulations of the ice/vapor interface, and observed a logarithmic divergence of the premelting layer consistent with a surface melting transition on the basal plane; as well as a rough solid surface of diverging correlation length.Limmer and Chandler (2014) This is a very careful study of surface melting, but it is arguable whether the results may be extrapolated to describe a real substance such as water. Clearly, the presence of the surface melting transition is an extremely subtle property which is likely to require a very fine molecular model to describe reliably. Indeed, it has been suggested that the absence of surface melting in water is the result of complicated many-body interactions which require to take into account the time dependent dielectric response of solid and liquid phases, as well as retardation effects.Elbaum and Schick (1991) These are fine features that are well beyond the coarse scale of simple non-polarizable point charge models (let alone models that altogether ignore dispersion forces and the electric interactions of water).
In this work we extend our study of the ice/vapor interface,Benet (2015); Benet et al. (2016) with ice described using the TIP4P/2005 model of water.Abascal et al. (2005) This force field is apparently very close to the best rigid-point charge model of water,Vega and Abascal (2011) and is therefore a good starting point for the study of short range contributions to surface premelting. By introducing a convenient order parameter, we are able to resolve the liquid from the solid, and study the fluctuations of the resulting solid/film and film/vapor surfaces. This offers us a unique opportunity to study the interplay between premelting and roughening of the solid/film surfaces. Our results show that both basal and prismatic faces exhibit premelting, with hints of a roughening transition on the prismatic facet. Unfortunately, a conclusive statement is still not possible, because some limitations of the model that are unimportant in the study of bulk properties turn out to be major concerns whenever two or more phases are involved, as is the case in our study. Firstly, for reasons of numerical convenience, the dispersive interactions are cut-off at a finite distance. Secondly, the non-polarizable model is known to exhibit a static dielectric constant that is smaller for the solid than for the liquid phase, at odds with real water.MacDowell and Vega (2010) Finally, because of the absence of polarizability, no retardation effects are incorporated at all. Fortunately, it is expected that the range where these effects are important is beyond the film thickness observed in our simulations.Elbaum and Schick (1991)
II Theory
II.1 Roughening transition of an interface
The most significant feature of a roughening transition is a divergence of the parallel and perpendicular correlations of the interface. Whereas this is essentially a general feature in all roughening processes, the detailed physics of the considered interfaces may be quite different. Here we briefly review how such transition comes about in two important cases, namely, and adsorbed premelted film, and a solid surface.
II.1.1 Complete roughening of an adsorbed liquid-vapor interface
Consider a system with two bulk phases in coexistence (such as a solid and vapor phases), and a third metastable phase (such as a liquid) that is adsorbed between the solid and vapor. The premelted liquid film exhibits a quasi-liquid-vapor interface, which may be described in terms of its local height above the solid phase, , where is a point on the plane of the substrate. In the capillary wave approximation, the free energy of a given film profile is given as:
| (1) |
The first term, is a binding potential describing the effective interaction of the liquid-vapor interface with the underlying solid substrate. In principle, the binding or interface potential for an adsorbed liquid on an inert substrate may be calculated from computer simulations.MacDowell et al. (2014); Benet et al. (2014b) However, the extension to premelting in a single component system seems difficult. Here, it suffices to assume that there exists a binding potential whose minimum sets the equilibrium film thickness of the system. The second term is governed by the liquid-vapor surface tension, , and penalizes increments of the surface area. Expanding the Hamiltonian to second order in the fluctuations of away from the equilibrium film height, one finds:
| (2) |
where the primes in denote differentiation with respect to . The partition function for this Hamiltonian may be worked out by expanding in Fourier modes. This yields the following result for the spectrum of film height fluctuations:
| (3) |
This spectrum is the signature of a film with finite roughness. For wave-lengths that are smaller than a parallel correlation length , the fluctuations correspond to a rough interface, with a spectrum characterized by a power law divergence. As the wave-vector becomes small, however, damps the fluctuations, which become smooth for wavelengths larger than . In the limit where , however, the correlation length becomes infinite, the power law follows down to zero wave-vectors, and the interface becomes rough on all length scales, indicating complete roughness of the interface.
II.1.2 Roughening transition of a solid’s surface
We now consider a roughening transition that does not correspond to the unbinding of a fluid film from a solid substrate, but rather, to the unbinding of the solid-liquid interface from its own underlying bulk solid substrate. Traditionally, this process has been described using so called Solid on Solid models, which describe the solid as made of prismatic columns, of discrete heights, , that are multiples of the inter-plane spacing, .Chaikin and Lubensky (1995); Nelson et al. (2004) At 0 K, a high symmetry surface is completely smooth, such that all columns are of equal height. Rising a column by one lattice spacing creates a defect of energy , which, however, increases the surface entropy. The energy of a given realization of column heights may be described qualitatively using the SOS Gaussian model:
| (4) |
where the sum runs over all neighboring lattices, and it is understood that the column heights are multiples of the lattice spacing.
Whereas this model offers a rather clear description of the roughening process, it is difficult to solve analytically. For this reason, it is convenient to resort to a somewhat more abstract continuum model, known as the sine-Gordon model, which has the advantage of being solvable. In this way, the energy is now written as:
| (5) |
Here, the discrete column heights are now transformed into a continuum surface height, , so that the squared differences of Eq 4 are transformed into a squared gradient. Together with this contribution, a bulk pining field is added in order to favor surface heights that are multiples of the lattice spacing. The parameter is the interface stiffness, Fisher and Weeks (1983); Chaikin and Lubensky (1995); Nelson et al. (2004) which penalizes deviations from the planar configuration, while is a bulk-surface coupling parameter which dictates the strength of the bulk pining field.
This model exhibits a roughening transition, at a temperature , where the bulk-surface coupling constant effectively vanishes. Above this temperature, the bulk pining field is absent, and the Hamiltonian becomes exactly as the capillary wave Hamiltonian of fluid-fluid interfaces. For highly symmetric crystals with low anisotropy, the stiffness does not show large differences among different facets, and the roughening temperature is mainly governed by the distance between equivalent planes, . Accordingly, high symmetry faces, with small inter-plane spacing, are usually those with highest roughening temperature.
It is instructive to expand the sine-Gordon Hamiltonian to quadratic order in the surface profile. Up to an additive irrelevant constant, we obtain:Nelson et al. (2004); Safran (1994)
| (6) |
Whence, to quadratic order in the surface height, the sine-Gordon Hamiltonian for column fluctuations is essentially equal to the Capillary Wave Hamiltonian for adsorbed films, with an effective pining strength in place of . Accordingly, the spectrum of fluctuations is:
| (7) |
As long as the pining coefficient remains finite, the surface height fluctuations are bound, and the surface is said to be smooth. If, however, , the fluctuations diverge as and the surface becomes rough on all length scales. According to the theory of equilibrium crystal shapes, crystal facets of length smaller than the correlation length disappear and become round.Dash et al. (2006)
II.2 Model for coupled interface fluctuations
We now attempt to provide a phenomenological description of interface fluctuations of a premelted solid-vapor interface. Consider, to be specific, a premelted water film (f), that is adsorbed on top of a bulk ice phase (i) separating it from a bulk vapor phase (v). Overall, the ice/vapor interface may be described in terms of two different dividing surfaces, one, separating solid ice from the water film, (if), and other, separating the film from the vapor phase (fv). In our phenomenological model, we describe the fluctuations of the ice/film surface using the sine-Gordon Hamiltonian, and the film/vapor surface using the Capillary Wave Hamiltonian, as follows:
| (8) |
where and are the local positions of the i/f and f/v surfaces, respectively; is the stiffness of the i/w interface, is the surface tension of the w/v interface and is a local interface potential which binds the film of premelted ice to the bulk ice phase.
This Hamiltonian may be simplified by expanding to quadratic order in and , as noted previously. This results in a total energy which is essentially the sum of Eq 5 and Eq 1, with and coupled via the interface potential. The Hamiltonian may be worked out as before, by writing the film heights in Fourier modes, yielding:
| (9) |
where we have introduced as the effective bulk crystal field strength, for short.
The statistical weight of this Hamiltonian, yields a Gaussian bivariate distribution for the surface modes analogous to that found for coupled fluid-fluid interfaces under gravity.Li et al. (2001); Fukuto et al. (2006); Pershan and Schlossman (2012) This can be solved immediately, providing the following result for the spectrum of fluctuations:
| (10) |
These set of equations for the compound ice/vapor fluctuating interface is denoted henceforth as the sine Gordon plus Capillary Wave model (SG-CW).
In order to assess the significance of these equations, it is convenient to introduce the effective surface stiffness, as:
| (11) |
where the sub-indexes and denote here either the or surfaces. Notice has dimensions of a surface free energy and corresponds exactly to the surface tension for rough and isotropic interfaces in the limit of vanishing wave-vector. In the event that one or both of the bulk phases involved are anisotropic, it corresponds rather to the surface stiffness coefficient, which effectively diverges to infinity for a smooth interface as the wave-vector vanishes.
In order to analyze the rich and complex behavior afforded by the coupled sine Gordon+capillary wave model, we introduce parallel correlation lengths characteristic of isolated ice/water and water/vapor interfaces, , and , respectively.
| /q range | ||||
| Comment | Smooth and pinned | Rough and pinned | Smooth and depinned | Rough and depinned |
Depending on the relative value of with respect to the parallel correlation lengths, we can identify four different regimes. In the very small wave-vector regime, all three effective stiffness coefficients , and diverge. It corresponds to the case where the if surface is smooth, and the fv surface is pinned to the solid. On the contrary, for length-scales that are small compared to both and , the if and fv surfaces become uncorrelated, while the effective stiffness become finite and adopt the value corresponding to independent rough interfaces. For small wave-vectors, one of either two intermediate regimes can occur in the event that the parallel correlation lengths of the ice/water or water/vapor surfaces are very different. If , and , then if and fv surfaces become strongly correlated and behave as one single rough interface with a stiffness coefficient that is the sum of the independent stiffness coefficients, . If, on the other hand, , but , then the if surface remains smooth, but the fv surface depins and effectively becomes rough.
In practice, since we are actually interested in the behavior of ice covered by a premelting film of finite thickness, is finite, and only the first two low wave-vector regimes are of interest. Most significantly, the model allows for a clear distinction between two different possible scenarios, namely, 1) the case where the film/vapor unbinds (surface melting), before the roughening transition is reached. Then remains finite, and the low wave-vector stiffness coefficients become effectively infinite. This is the smooth-and-pinned scenario. 2) the case where a roughening transition occurs before the unbinding of the fv surface from the if surface. In this case, , and the effective stiffness of both the ice/fluid and fluid/vapor surfaces, as well as their coupling attain a finite value equal to the sum of and . This is the rough-and-pinned scenario. The Table 1 summarizes the limits of in each of the four possible situations described above.
III Methods
We have used the TIP4P/2005 model of water. Our systems consist of an ice slab placed in the middle of the direction of a rectangular simulation box of sides , and with the interface placed at the plane. Surrounding this slab there are water molecules if an ice/water system is simulated, or vacuum for an ice/vapor system.
In order to deal with a reasonable number of molecules we set . In this way our systems present an elongated interfacial area which allow us to study capillary waves propagating along the direction. The values of the box sides and the number of molecules of each system are shown in Table 2.
In order to analyze our systems we need to find a discrete function describing the interface. To manage this we make use of the order parameter of Lechner and Dellago Lechner and Dellago (2008), which allows us to distinguish between solid and liquid molecules.
When analyzing ice/water systems we follow the same procedure as in Ref. Benet et al. (2014c). In this procedure we get rid of fluid–like molecules by making use of the order parameter and the biggest solid cluster is found.
However, for the ice/vapor system the procedure is not always the same, as we can find two different surfaces as mentioned in the introduction: the ice/film surface and the film/vapor surface. For the ice/film surface the procedure is exactly the same as for the ice/water surface, since we are interested only in solid–like molecules. On the contrary, for the film/vapor surface we are interested in the interface between a liquid–like film and a vapor. For this reason we do not make use of any order parameter and we just look for the biggest cluster, regardless it is solid or fluid. By doing this we get rid of any vapor particle.
Finally, once we have isolated the molecules which concern us for each surface we can define a discretised interface profile along the direction, . Due to the anisotropy of the ice facets, the surface fluctuations are characterized not only by the chosen facet, but also by the direction of the axis along which the fluctuations are measured. To distinguish different realizations of the fluctuations, we denote the surface in round parenthesis, and the direction perpendicular to the propagation of the fluctuations in squared parenthesis, as described in detail in Ref.Benet et al. (2014c); Benet (2015); Benet et al. (2016) For example, the primary prismatic facet is denoted here as (pI). Propagation of waves along the direction perpendicular to the basal or secondary prismatic planes are non-equivalent. We specify this by indicating in square brackets the crystal direction perpendicular to the direction of wave propagation. Whence, (pI)[pII] corresponds to propagation of surface waves on the pI plane that run along the Basal direction.
We prepare our systems by equilibrating an ice Ih configuration at T=248K and 1 bar, about 2 K below the triple point of the model Vega and Abascal (2011); Rozmanov and Kusalik (2011); Conde et al. (2017). We then re-scale the simulation box to the average value of , and to avoid any stress. The solid is then placed next to a liquid or vacuum, for ice/water and ice/vapor interfaces respectively, and equilibrated in the NVT ensemble until the energy of the systems remains stable.
Then we perform production runs of about in the NVT ensemble with the time step for the Velocity-Verlet integrator fixed to . The cut-off distance for Lennard-Jones interactions was set at 0.9 nm and standard Ewald summations were used. Snapshots were saved every , resulting in a total of about 6500 snapshots. The temperature if the system was fixed by using the velocity-rescaling thermostat of Bussy, Donadio and Parrinello Bussi et al. (2007).
| Orientation | ice/water interface | Molecules | ice/vapour interface | Molecules |
|---|---|---|---|---|
| (Basal)[pII] | 18.7696x1.8039x9.3319 | 10112 | 18.7696x1.8039x9.3319 | 4632 |
| (pI)[Basal] | 18.0134x2.1991x8.0808 | 10240 | 18.0577x2.2045x9.5000 | 5520 |
| (pI)[pII] | 17.6430x2.3491x7.8227 | 10368 | 17.6430x2.3491x9.0000 | 5760 |
| (pII)[Basal] | 17.9927x2.2047x8.3875 | 10670 | 18.0596x2.2063x9.0000 | 5760 |
| (pII)[pI] | 18.3690x1.8037x8.3928 | 8896 | 18.3661x1.8035x9.0000 | 4800 |
| (pI)[Basal] | 36.1163x2.2062x19.0000 | 23040 | ||
| (pI)[pII] | 36.7309x1.8034x19.0000 | 19200 |
IV Results
Here we present results for the structure of the ice/water and ice/vapor interface of basal, primary prismatic (pI) and secondary prismatic (pII) planes. The simulations of the ice/water interface are carried out at a temperature of ca. T=248.5K, while those of the ice/vapor interface are simulated at ca. T=248.7K.
Unfortunately, the melting point is difficult to determine with state of the art simulations to a precision better than K, and the literature reports data scattered between about 249 and 253 K.Vega and Abascal (2011); Rozmanov and Kusalik (2011); Conde et al. (2017) The melting point seems to depend not only on system size, as discussed recently,Conde et al. (2017) but also on the Lennard-Jones cutoff-distance (c.f. Ref.Mastny and de Pablo (2007)). Whereas we did not make a precise evaluation of the melting point here, our results seem consistent with results reported for systems with a Lennard-Jones cutoff of nm, whence, K. To avoid the need for a detailed knowledge of the model properties, we refer to our simulation henceforth somewhat loosely as being 2 K away from the triple point.
IV.1 Density profiles
IV.1.1 Ice/water interface
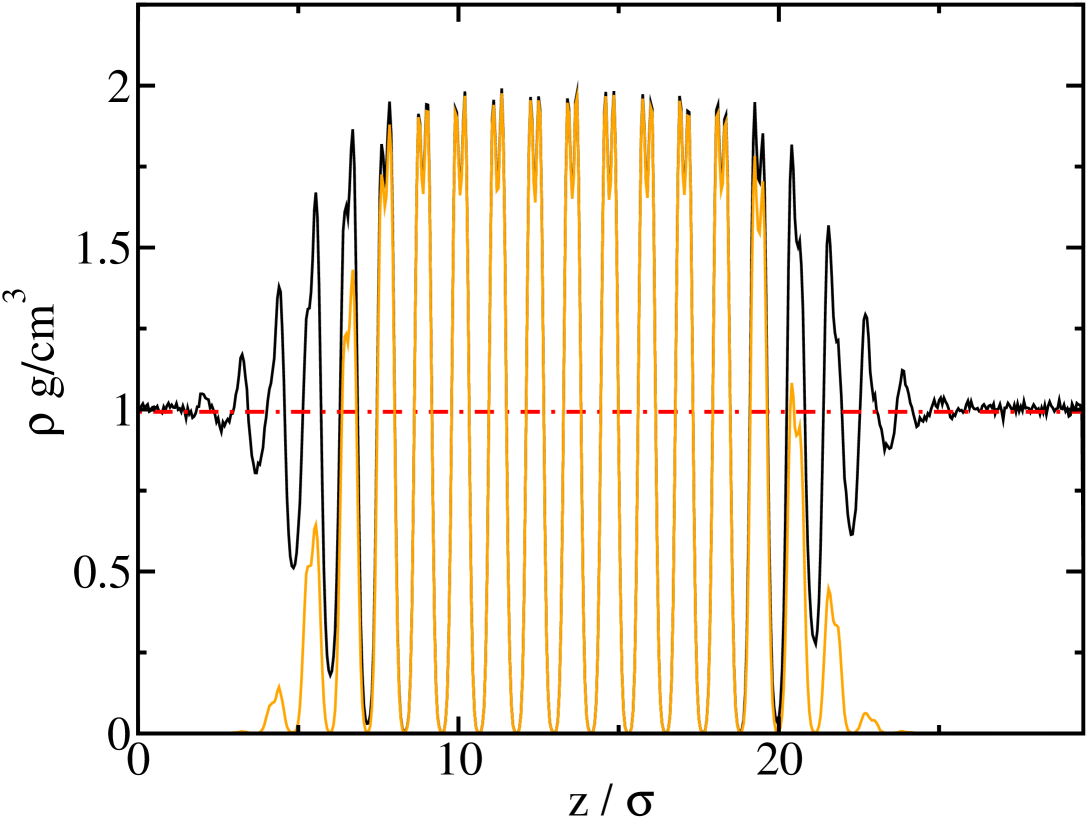
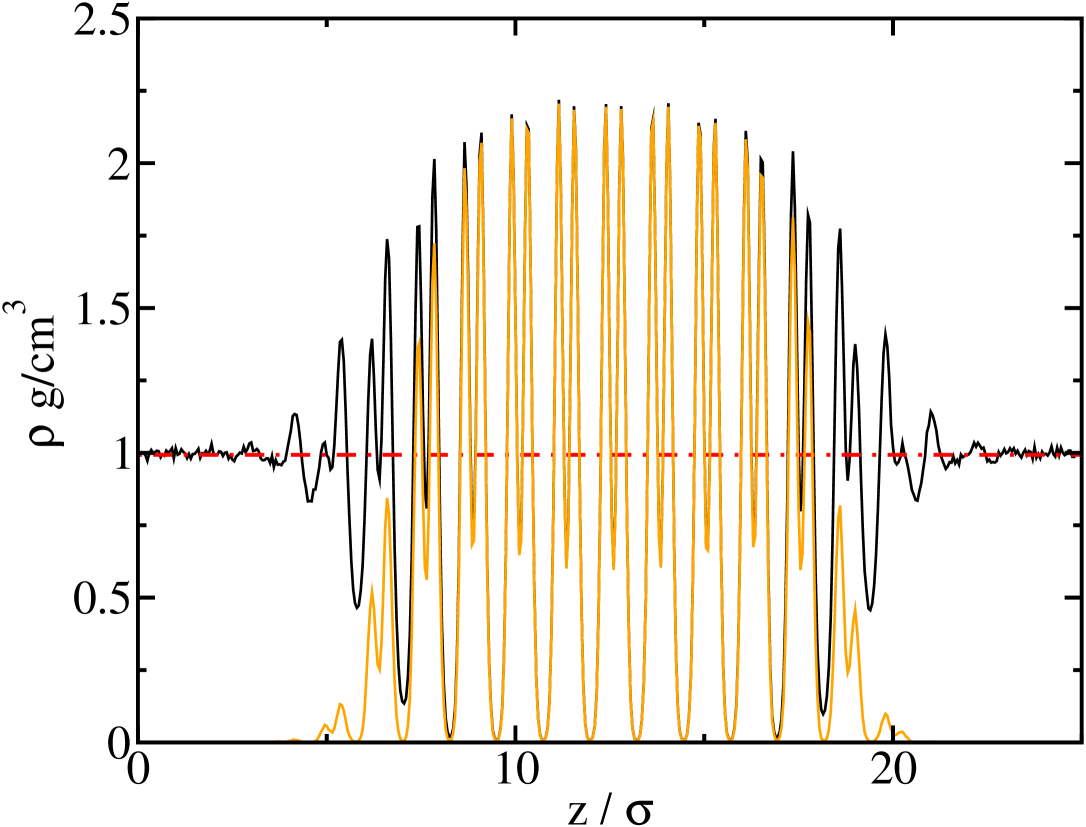
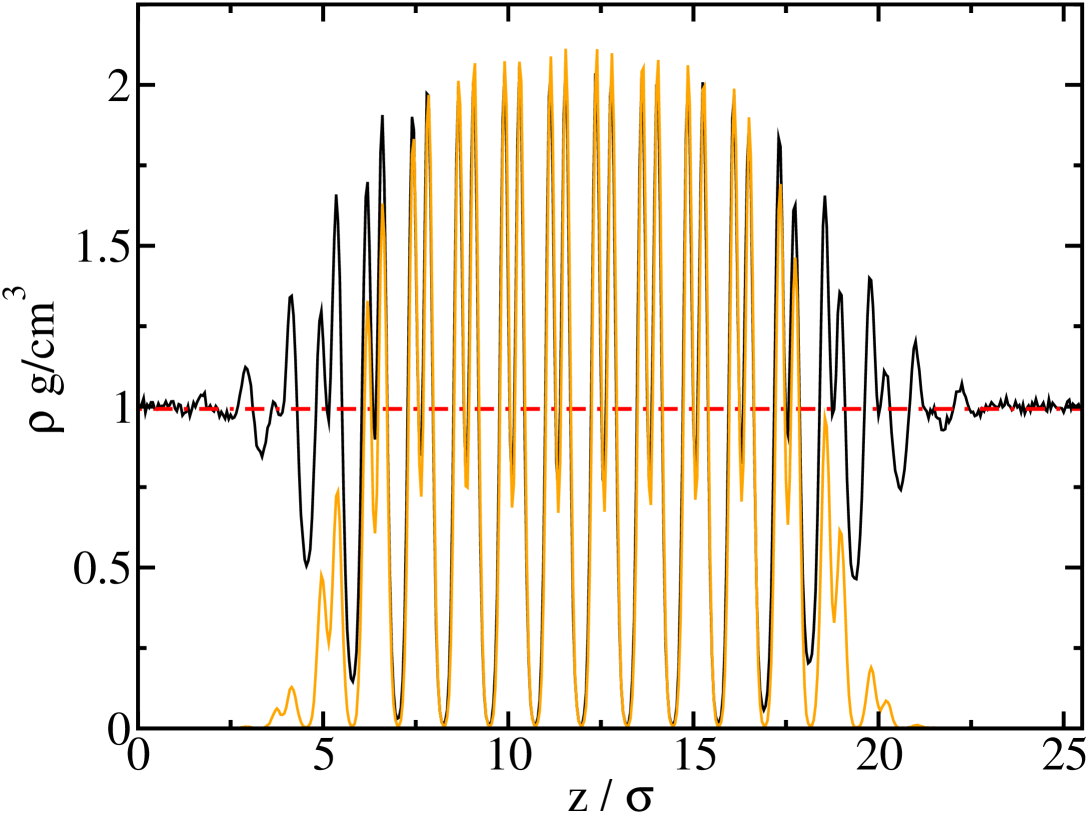
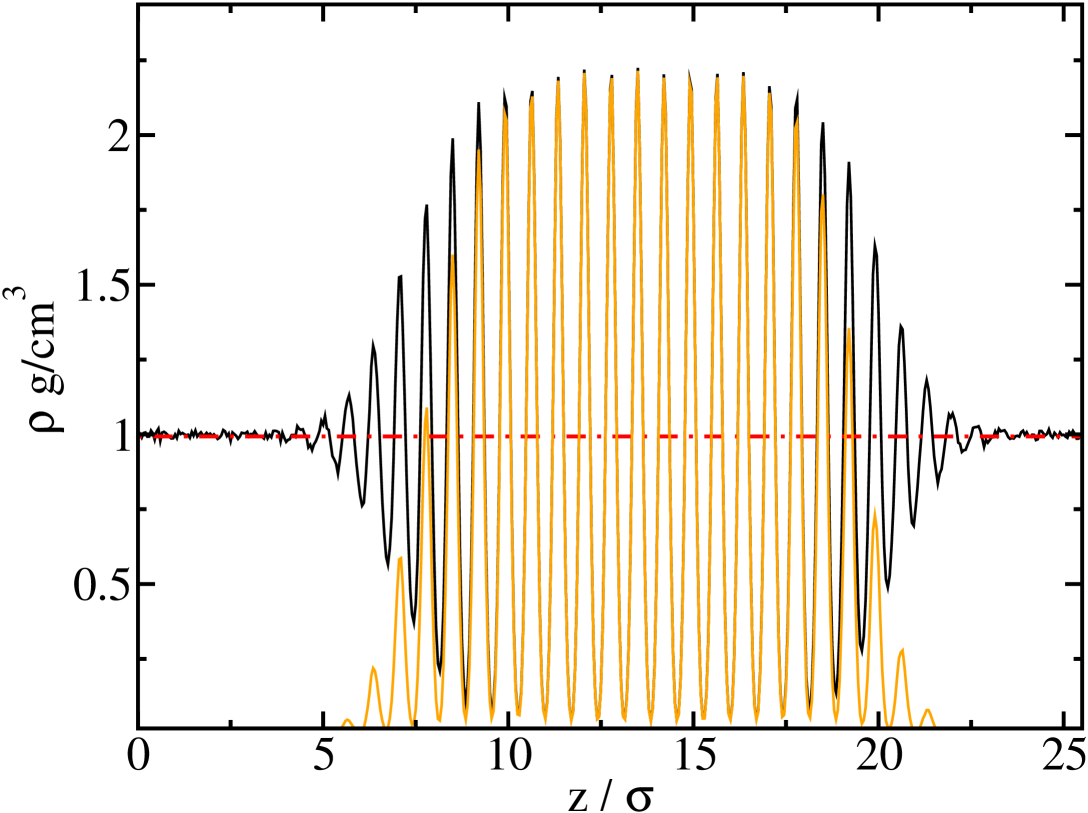
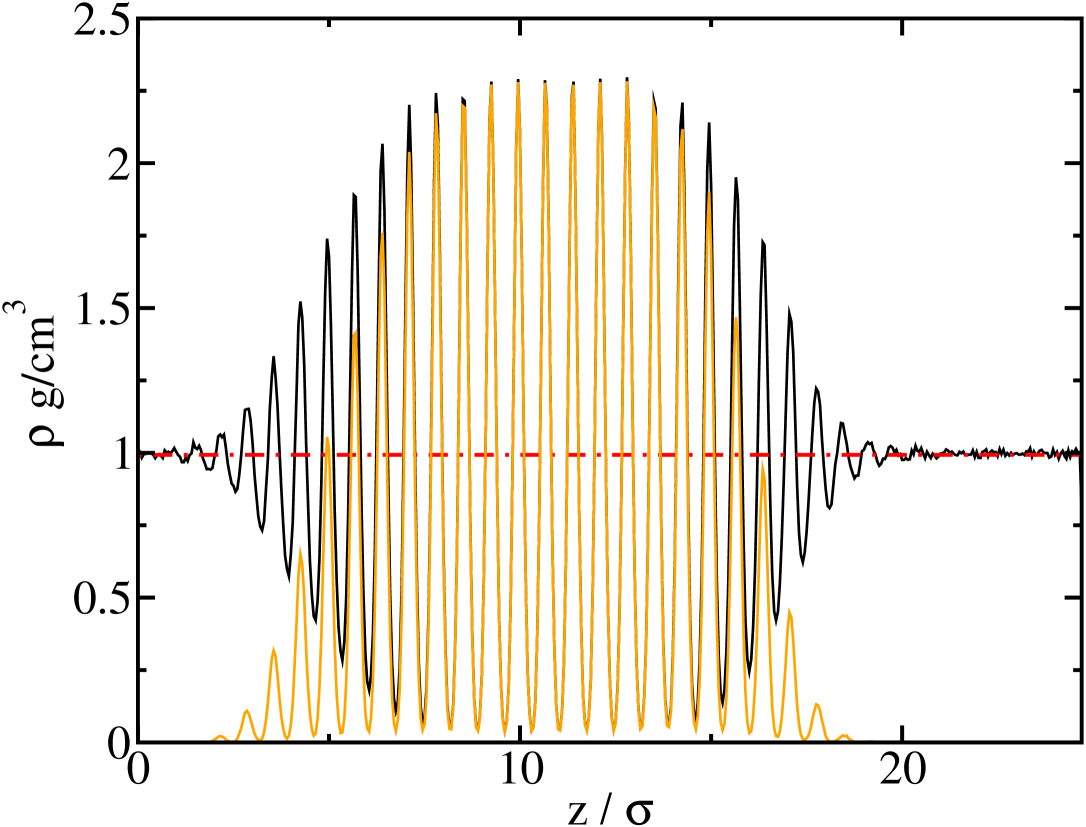
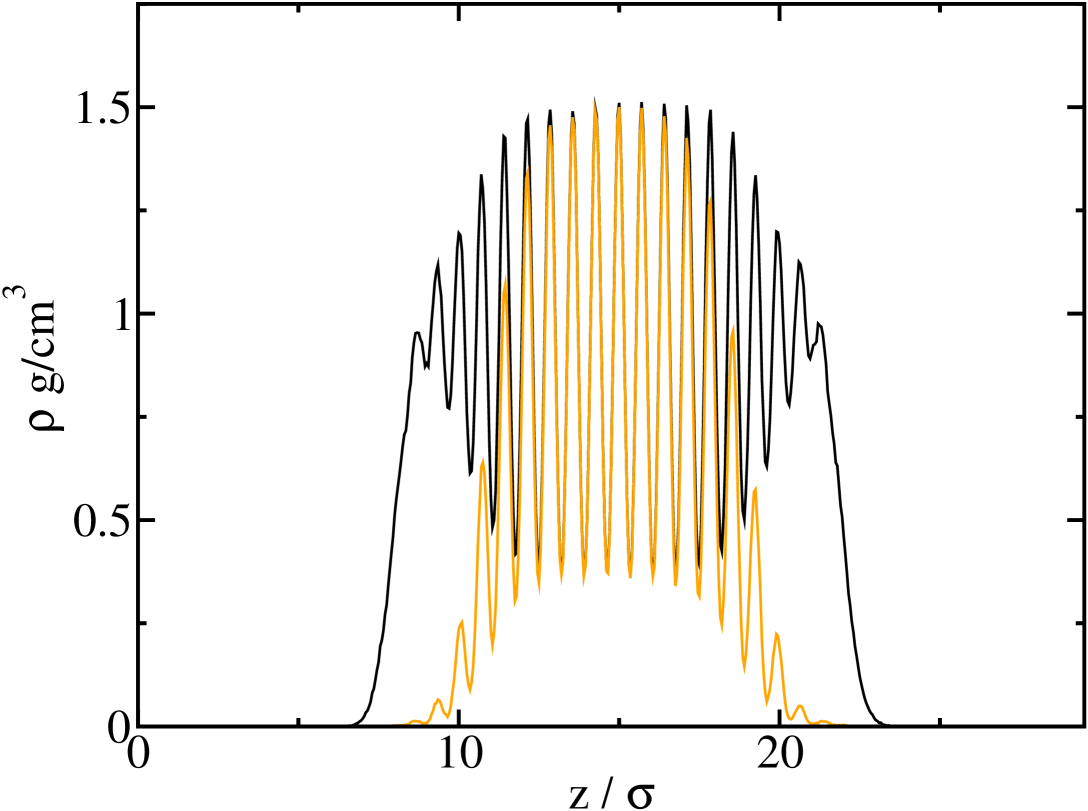
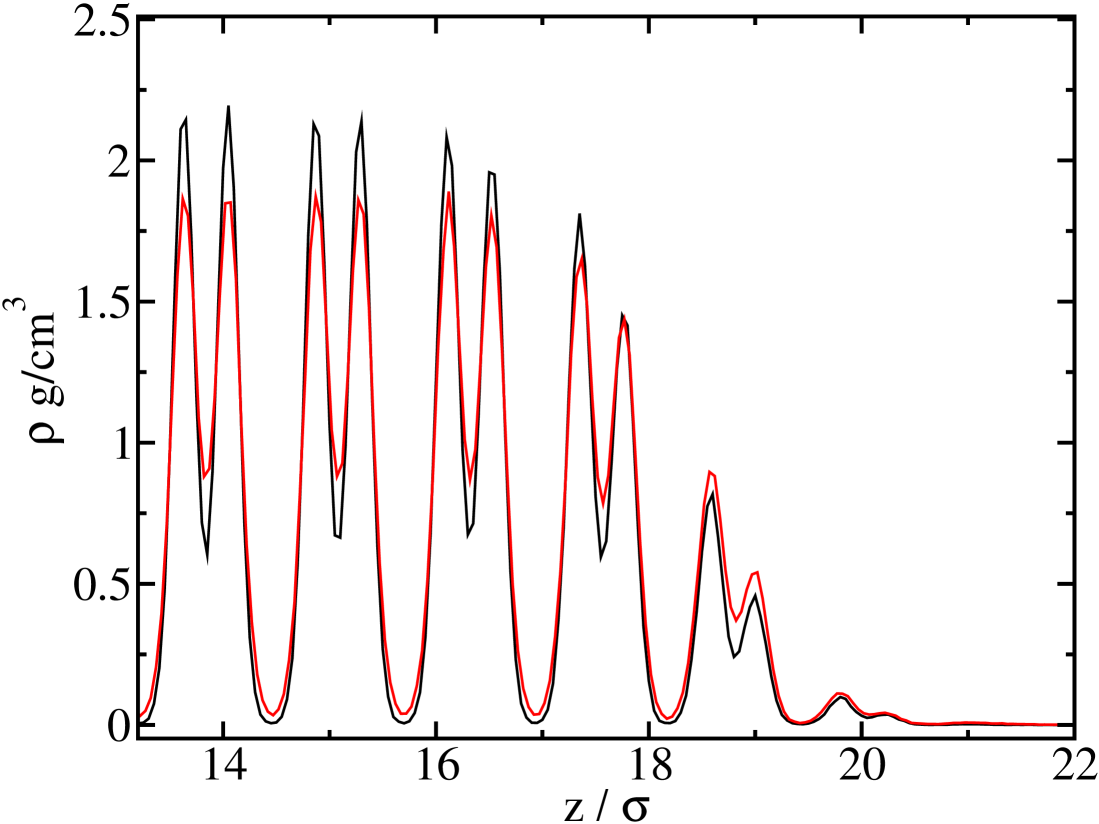
Fig. 1 shows results for the density profiles across the ice/water interface for all three planes studied and different surface setups.Benet (2015) Notice that the density profiles are not intrinsic properties of the bulk thermodynamic field, but rather, depend also on the lateral system size. With this caution, however, we can interpret the density profiles in the mean field sense.
For each plane, it is apparent the coexistence of a well equilibrated bulk solid phase, with oscillatory behavior, and a homogeneous liquid phase of uniform density. This can be inferred by comparing the total density profile (black lines), with the density of molecules labeled as solid (orange lines), which are fully coincident within a large slab several layers thick. The bulk solid phase acts on average as a hard wall, whereupon damped oscillations of the liquid phase decay towards the bulk liquid phase due to packing correlations.
Although the thickness of the interface is almost the same in the three planes studied Benet et al. (2014a) the number of layers involved in it differs. The basal plane exhibits 5 distinct layers of ordered liquid before decaying to the bulk density; the pI plane shows four bimodal oscillations, and the pII is that exhibiting a larger number of layers with about six clear oscillations before decaying to the liquid density. In all cases, there is a clear penetration of the solid density into the region where the liquid is the majority phase. This indicates either a rough interface, or the presence of terraces, such that, along the same layer, a partially filled solid stacking is interrupted by pockets of liquid water.
As expected, the density profiles of equal planes but different geometries, do not differ from each other. Unlike the stiffness coefficients, the density profiles are properties of the plane only, not of a privileged direction for wave propagation within that plane. Hence, the density profiles of the (pI)[basal] and (pI)[pII] setups are essentially identical, and similarly, those of the (pII)[basal] and (pII)[pI] are also equal.
IV.1.2 Ice/vapor interface
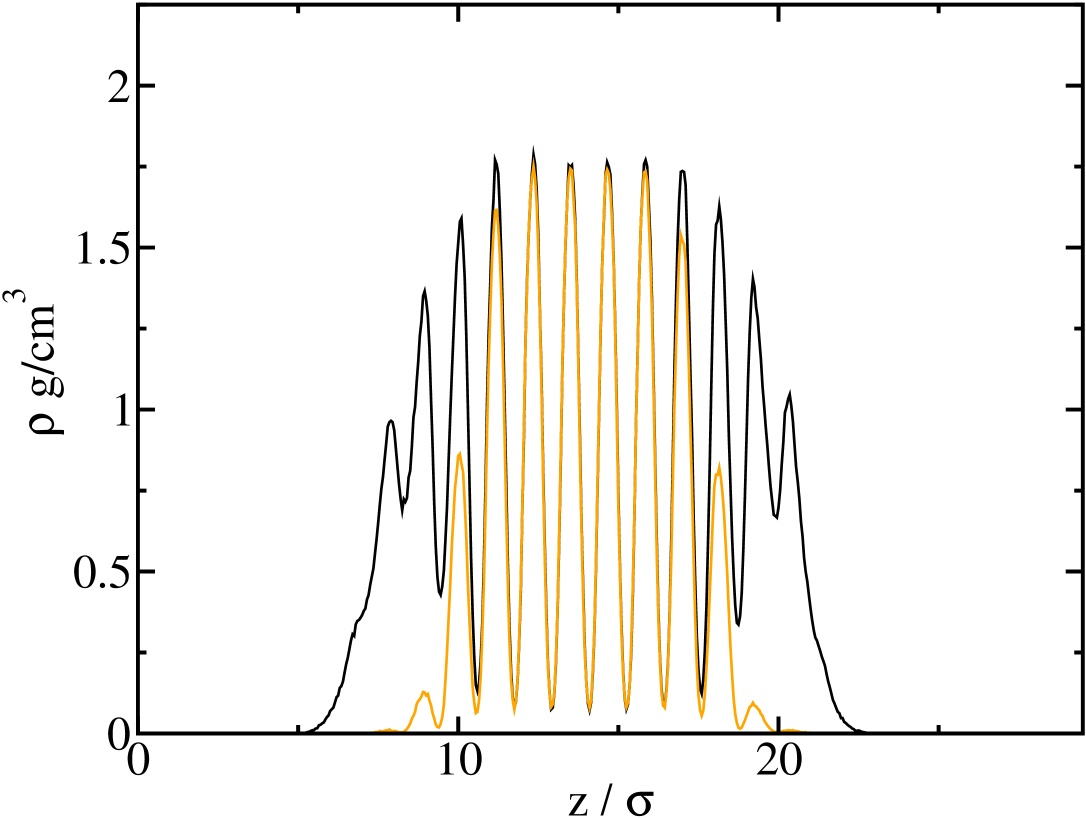
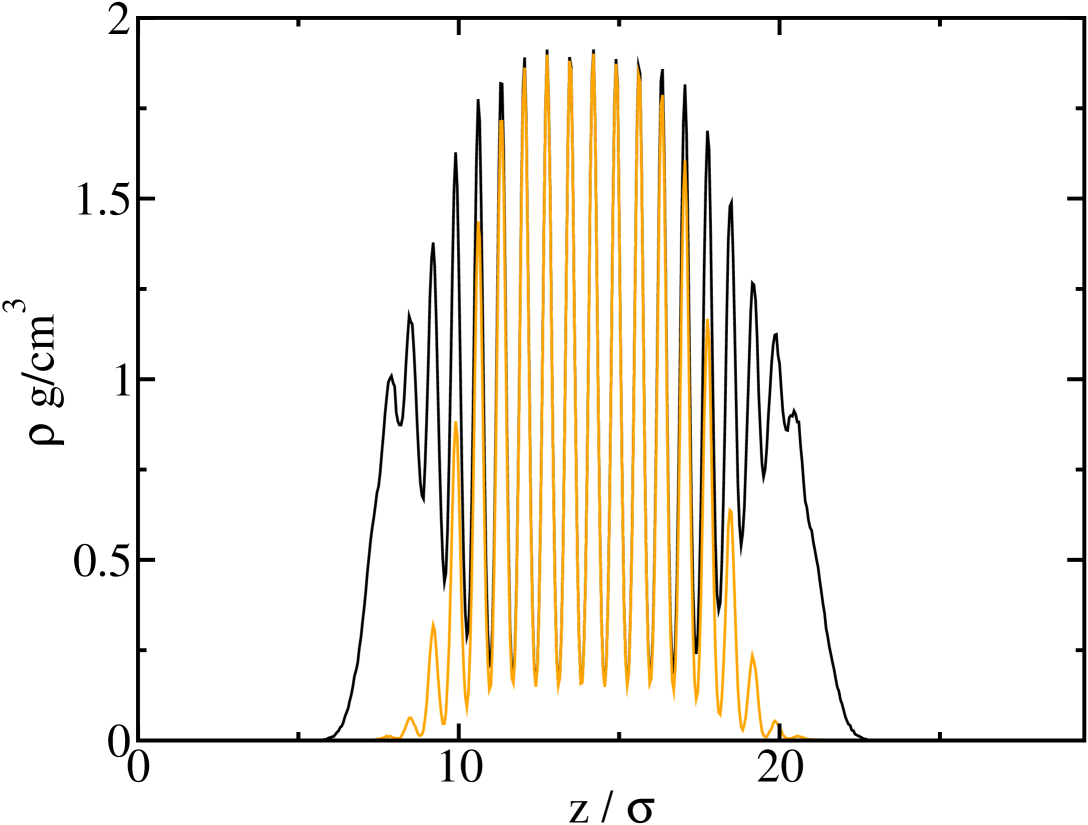
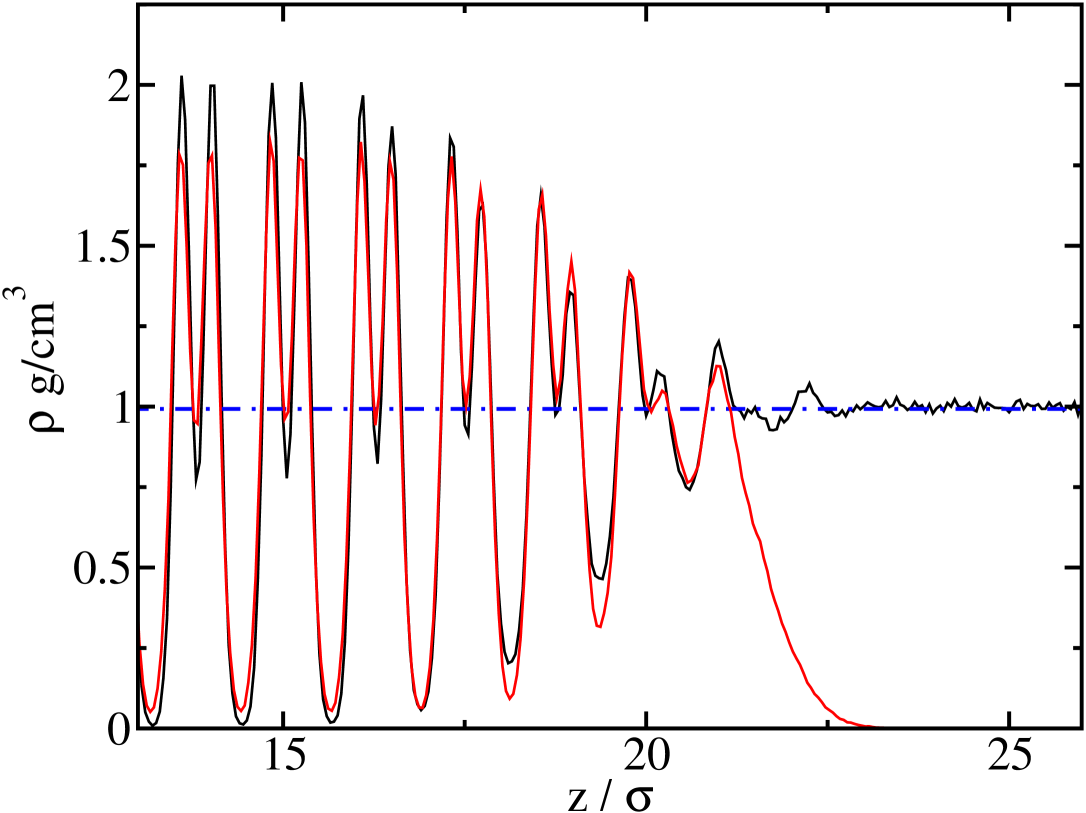
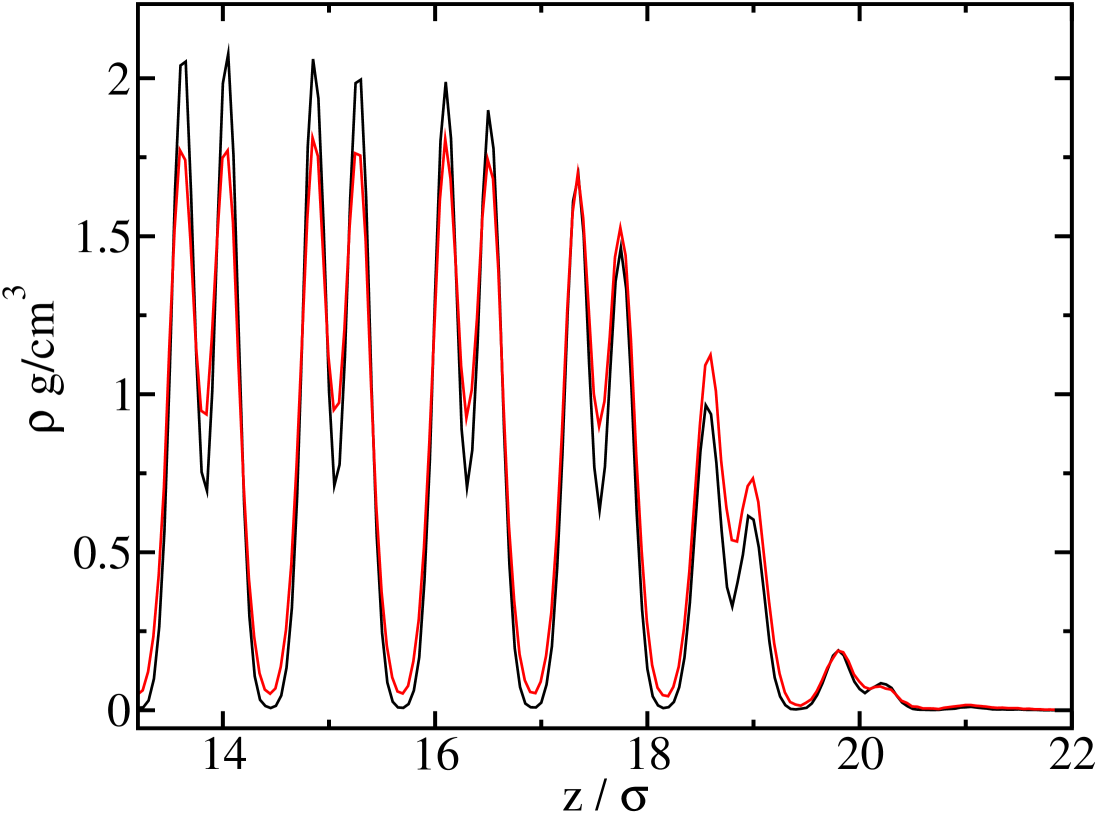
The density profiles of the ice/vapor interface are shown in Fig. 2 for the same planes and geometries studied previously.Benet (2015) Again it is possible to identify a bulk solid phase several layers thick, and a vapor phase of very small density (essentially zero density in the scale of the figure). Compared to the ice/water interface, however, the presence of a third liquid phase protruding between the bulk solid and vapor phases is fairly apparent, as indicated by the high density regions with damped oscillations corresponding to water molecules labeled as liquid phase. Whence, it is concluded that the ice/vapor interface is best described as an ice/film/vapor system, with a premelted liquid film between the vapor and the solid. A full characterization of the fluctuating interface then requires to distinguish between the ice/film and the film/vapor surfaces, which could in principle, exhibit different correlations, at least at large wave-vectors.
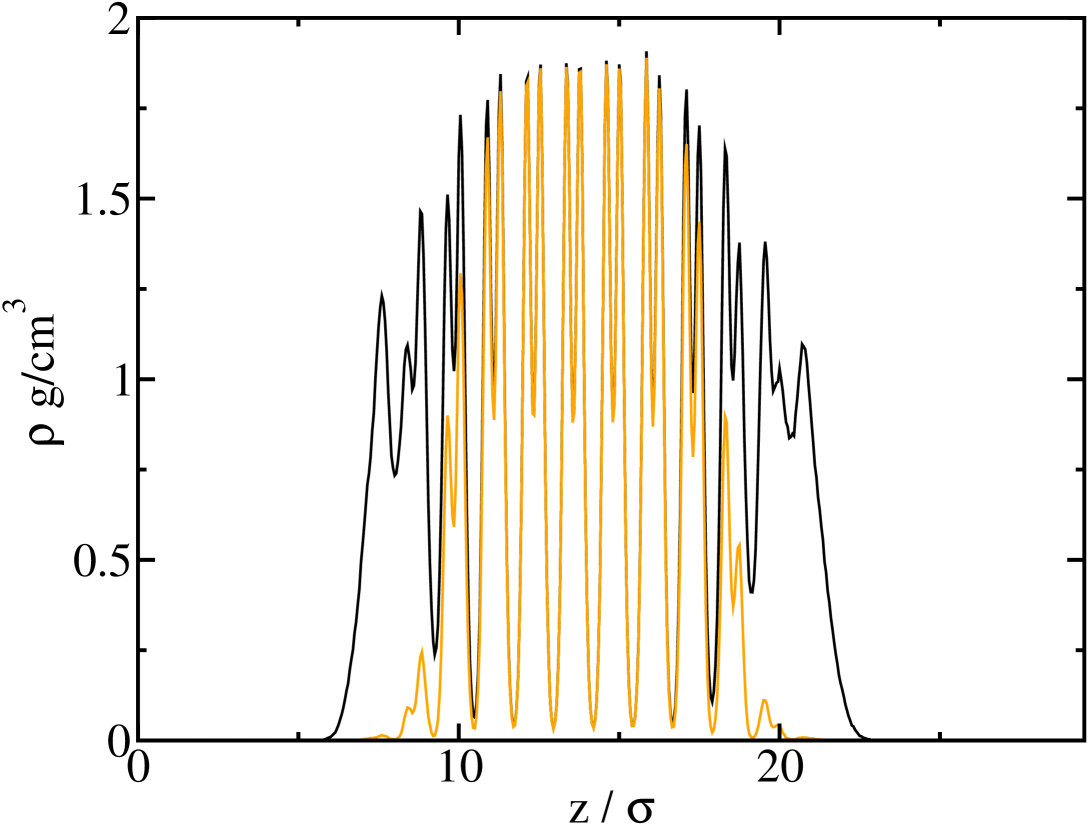
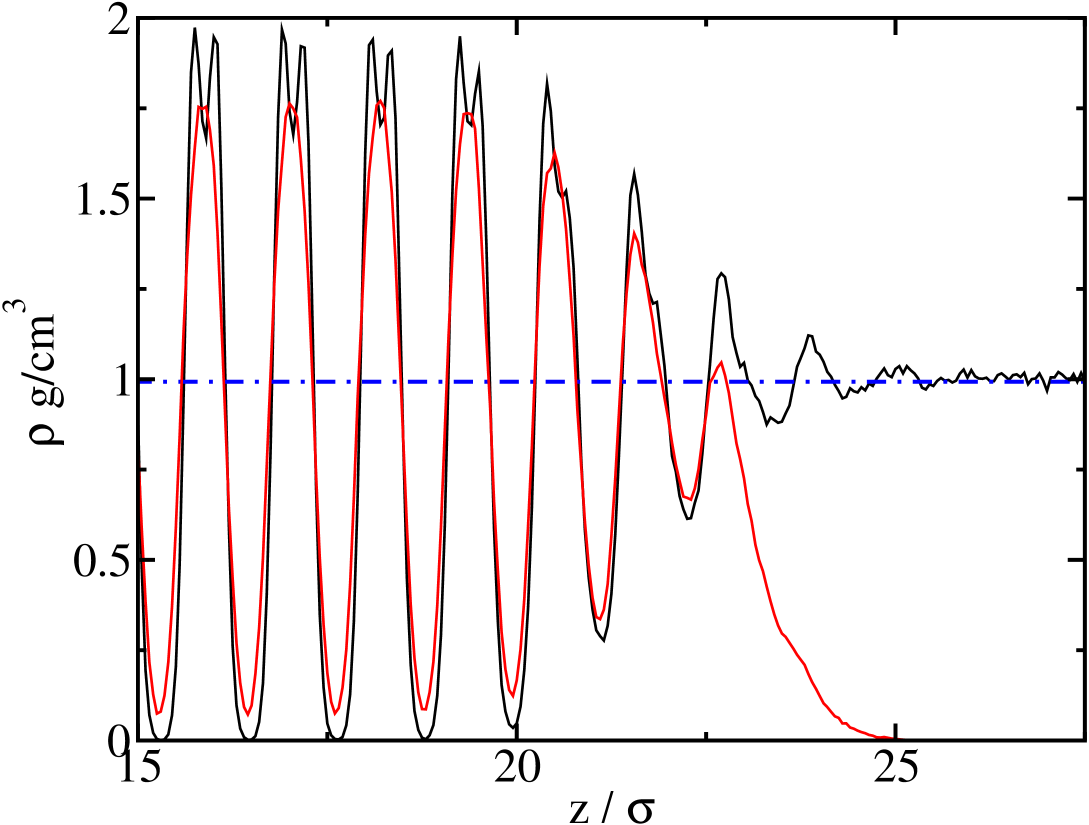
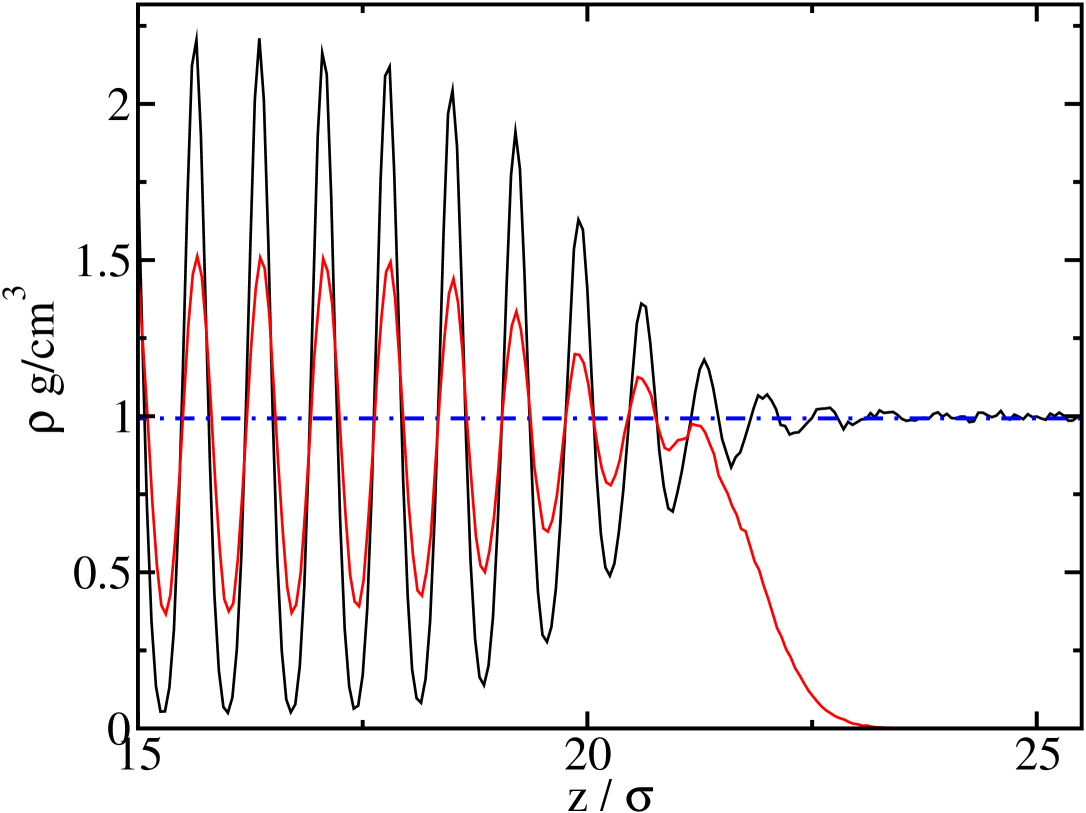
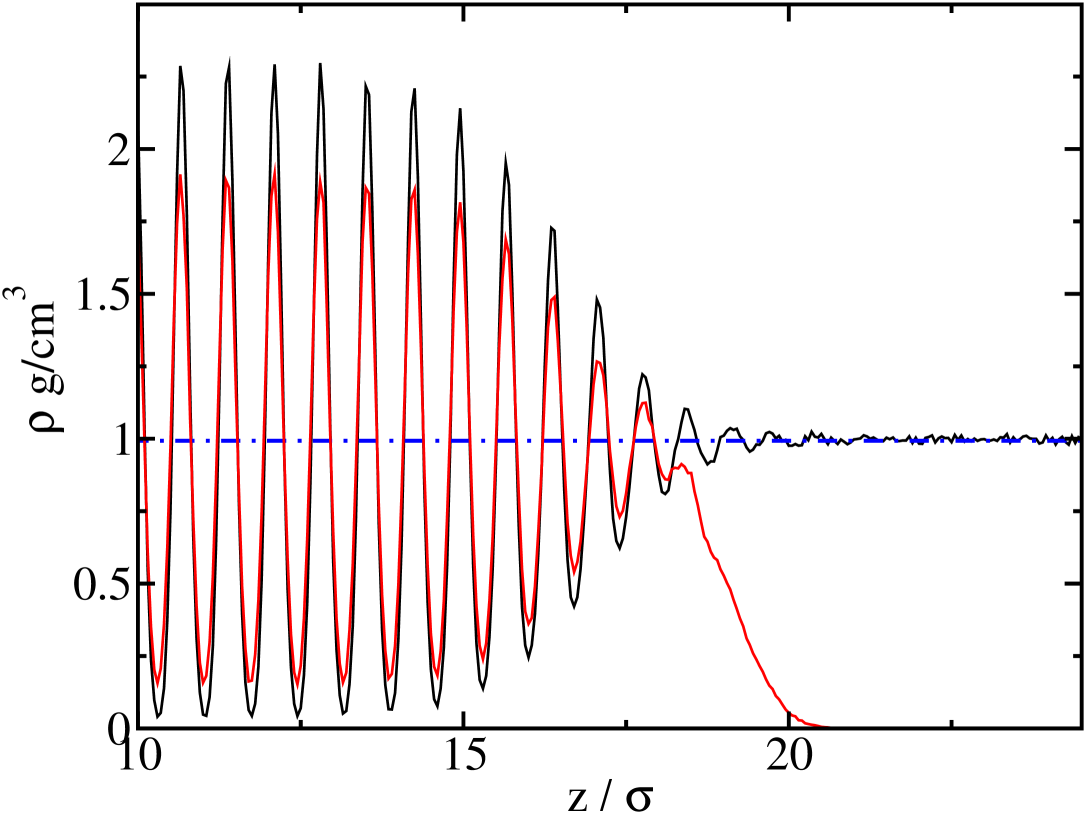
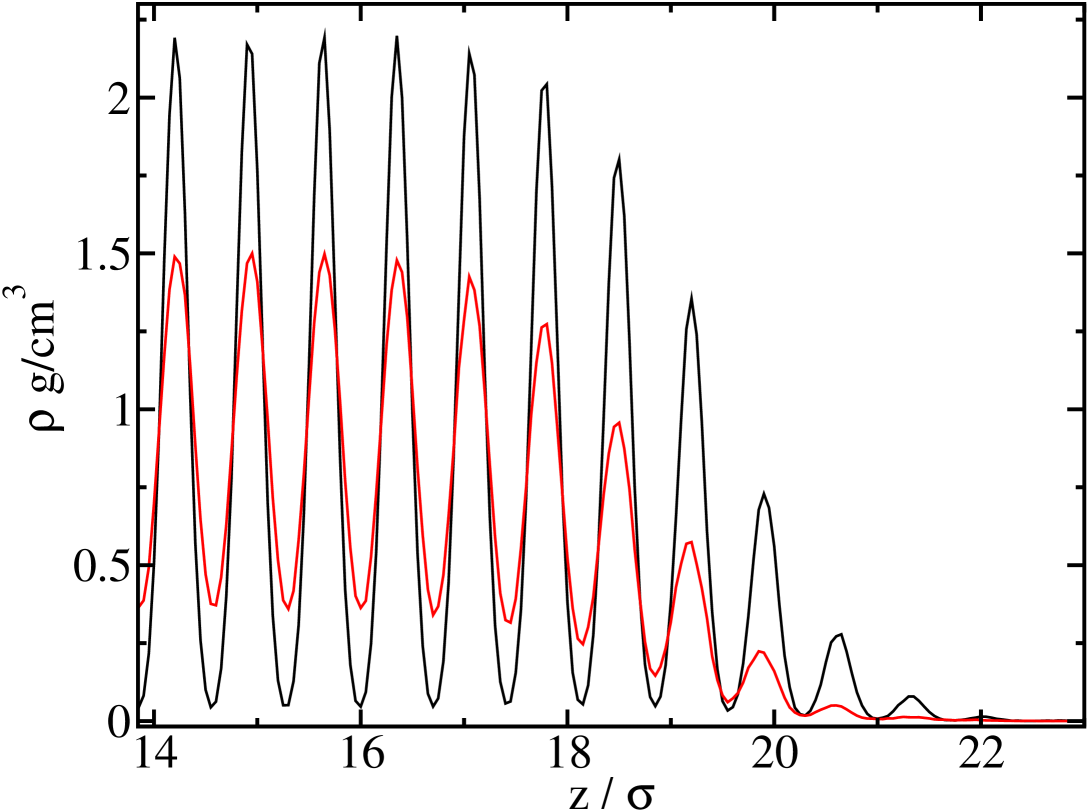
Interestingly, a comparison of the decaying oscillations of the premelted film and the ice/water interface reveals a rather similar structure. This is best seen in Fig.3, where the total density profile of the ice/water and ice/vapor interfaces is compared for all planes studied. The figure clearly shows that the ice/vapor interface is nearly equal to the ice/water interface. Not only it follows the oscillations expected for the bulk solid phase, but also mimics accurately the damped oscillations of the decaying water profile, up to a point where the density suddenly falls to the bulk vapor density.
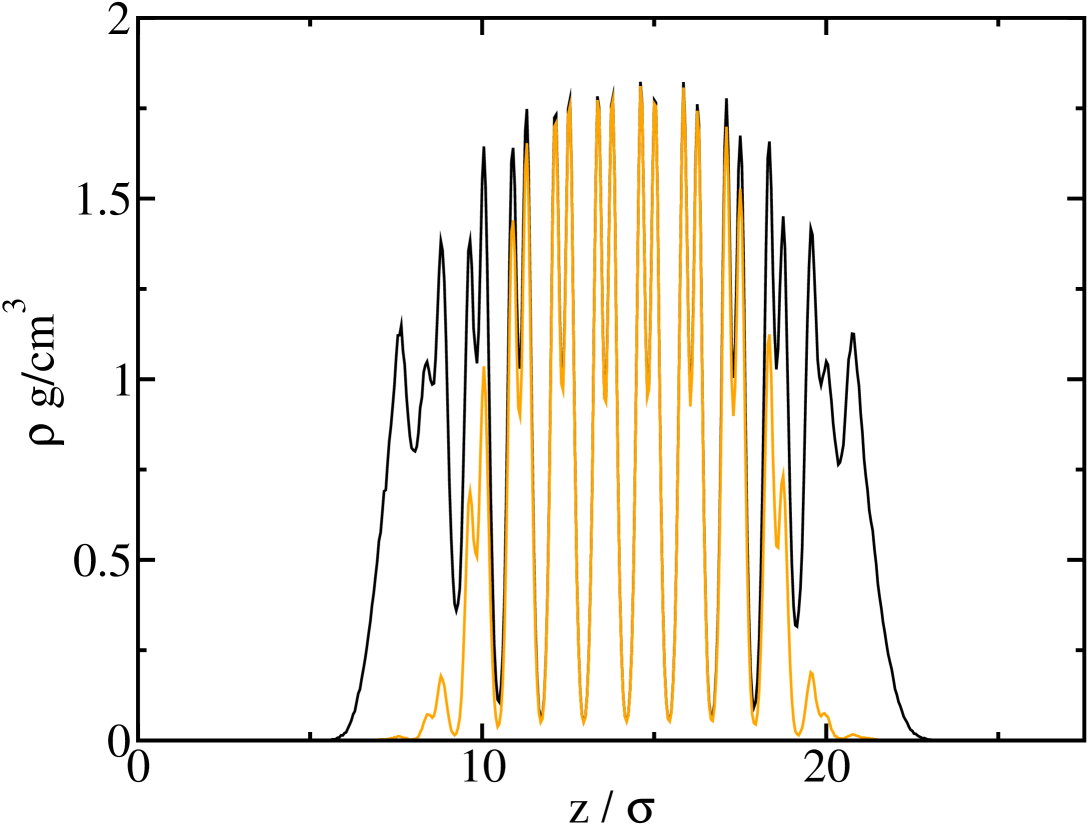
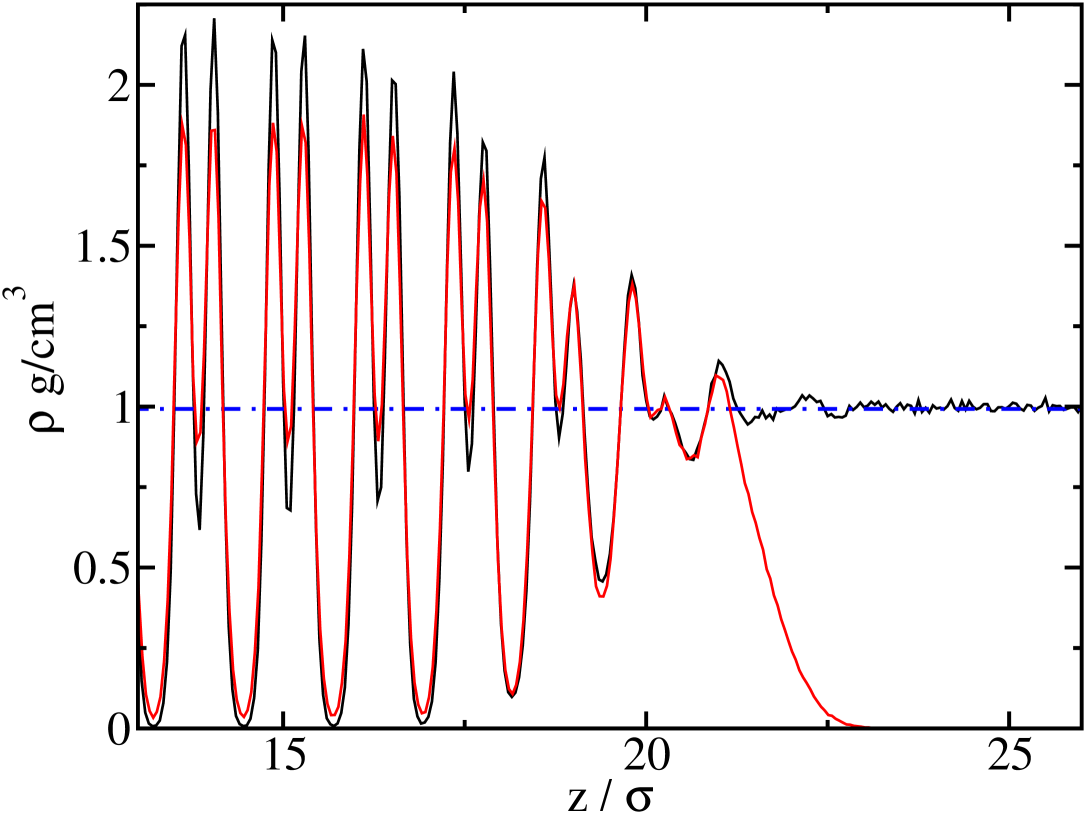
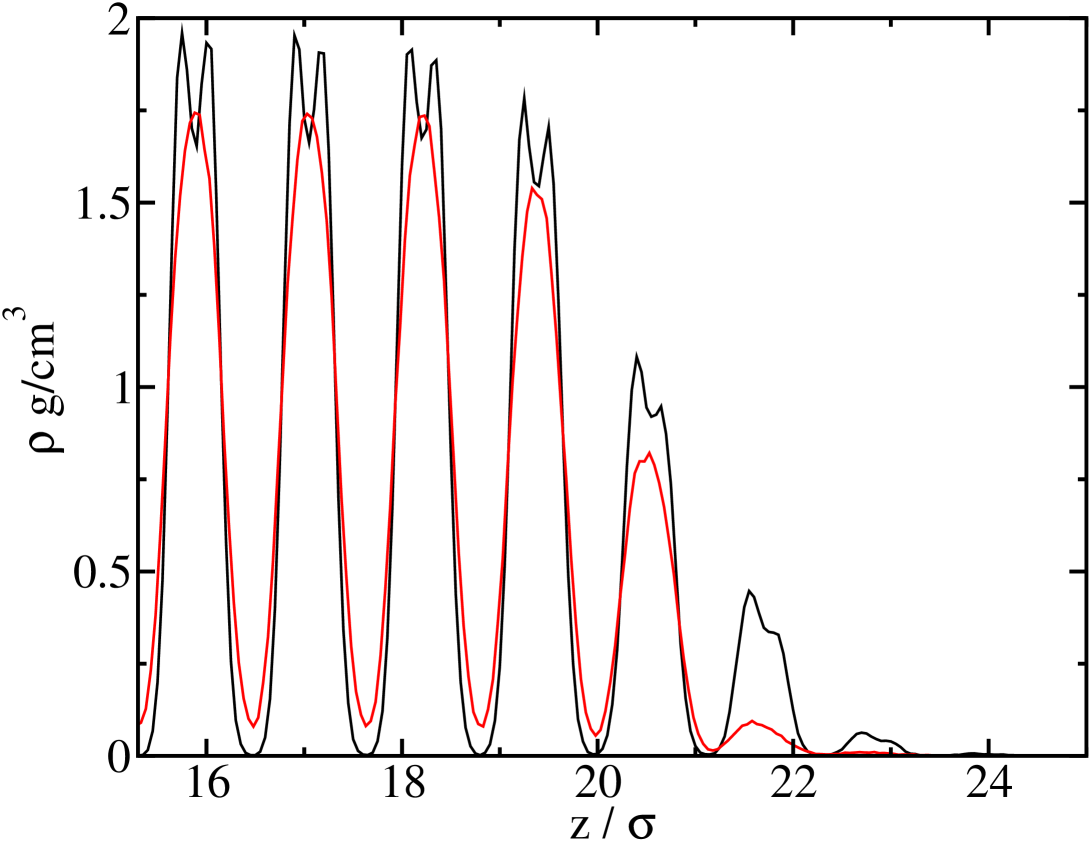
Similarly, the density profile of solid like atoms is the same in both the ice/water and ice/vapor interfaces, both within the bulk solid slab, and in the decaying density profile. We test this in Fig. 4, where the density profiles of solid like molecules for the ice/water and ice/vapor interfaces are compared. Clearly, the structure of the density oscillations is nearly equal, with only somewhat smaller solid molecule densities in the ice/vapor system. Such differences are obviously a result of the somewhat smaller chemical potential that is imposed along the sublimation line, as compared to that of the melting line.
Finally, we see from Fig. 4 that the structure of the film formed at the ice/vapor interface is the same as that of the liquid phase of the ice/water interface.
These set of figures clearly indicate that the ice/film boundary of the ice/vapor interface is very similar to that of the ice/water boundary, at least at temperatures a few degrees below the triple point. Interestingly, this observation is quite consistent with recent measurement of ice growth, which revealed an activated mechanism with equal molecular step energies for ice crystallites grown in water or vapor bulk phases, and supports the hypothesis that the rate determining step of crystal growth, whether from the liquid or the vapor phase, is the stacking of crystal planes at the liquid/ice boundary.Libbrecht (2014); Murata et al. (2018)
IV.2 Roughness
As discussed previously, the density profiles of the ice/water and the ice/vapor interface clearly reveal a considerable degree of surface disorder. This is apparent in the ice/vapor interface by the presence of a premelted film, but also, by the inter-penetration of the liquid profile into the solid profile across several solid layers (Fig 4). This implies that the ice/film surface is either rough or has a large density of surface steps.
We note at this stage that our previous study of the ice/water interface for the TIP4P/2005 model,Benet et al. (2014a) revealed that all three basal, pI and pII planes where rough at least up to the largest length scale of our simulation box, i.e., about nm.
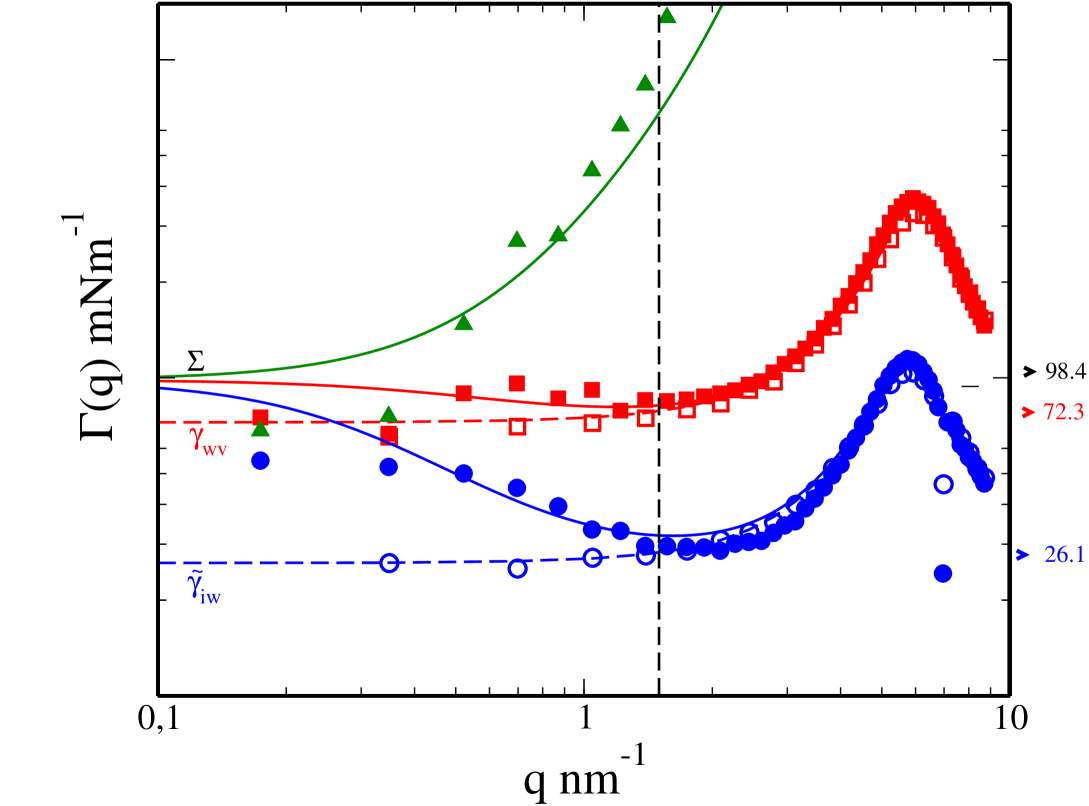
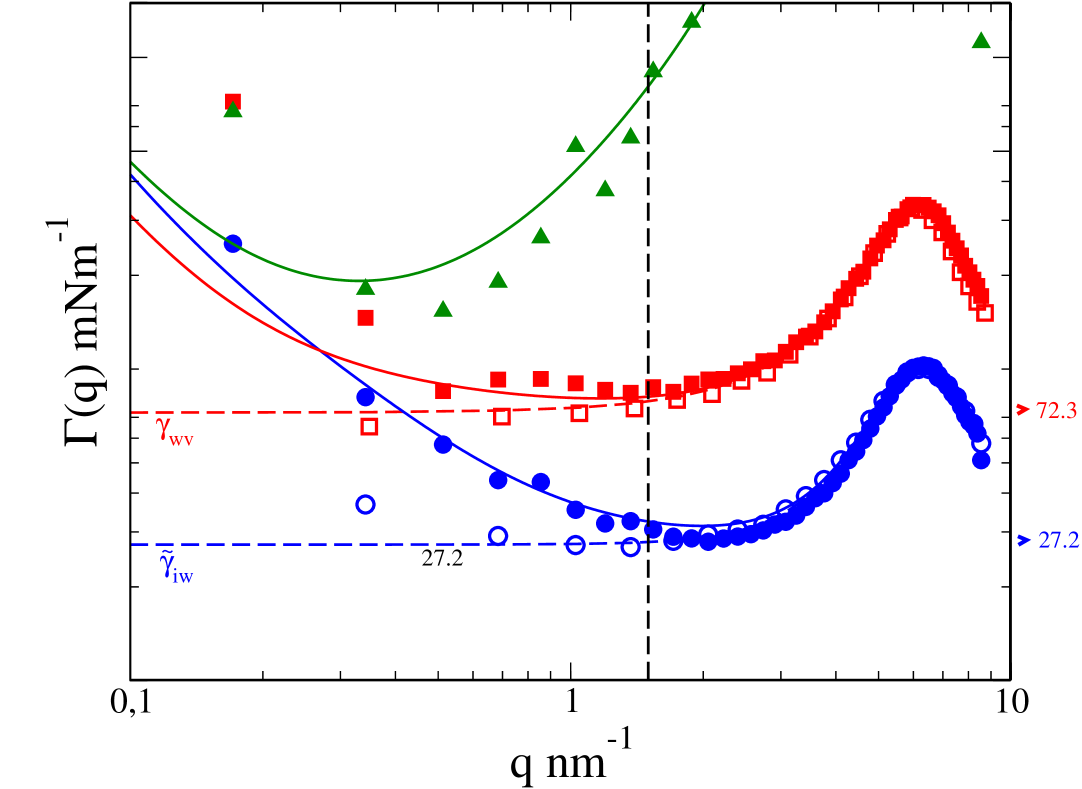
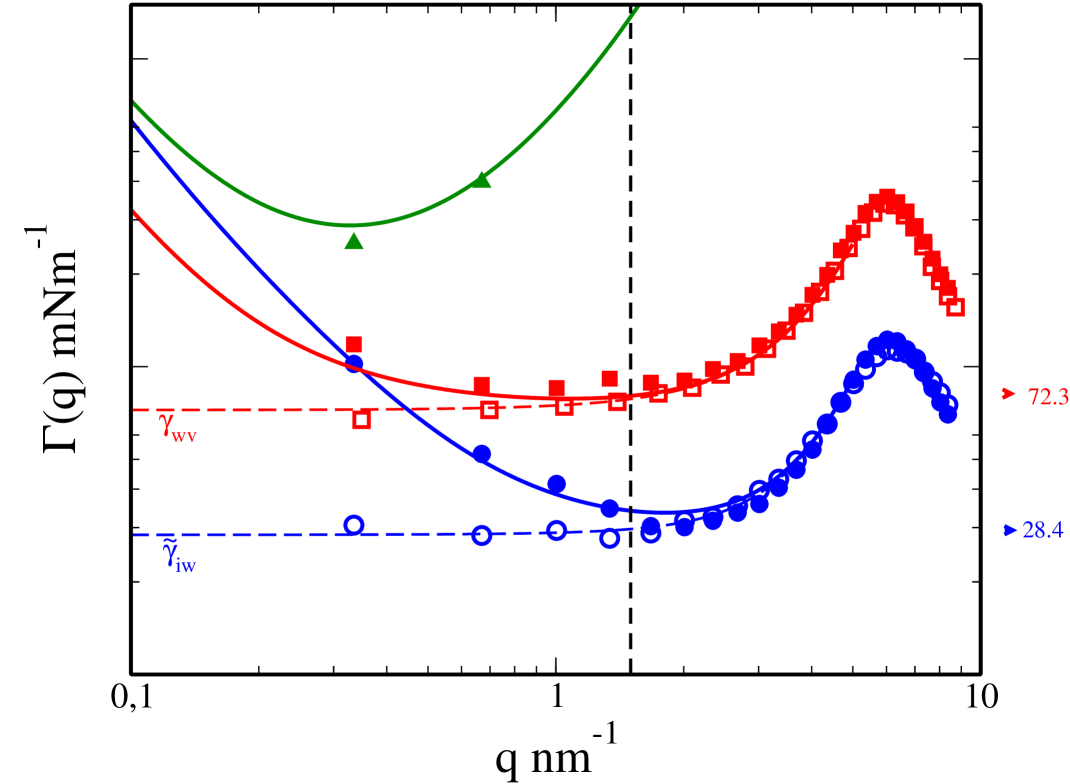
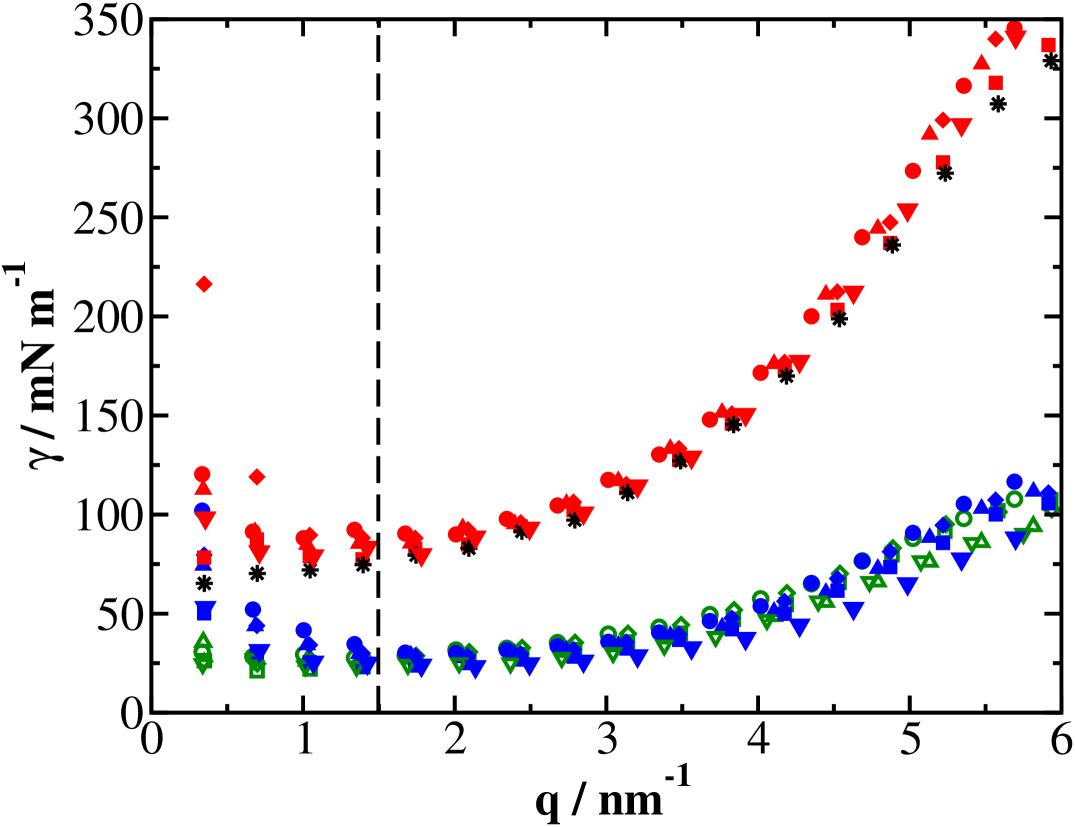
In Fig. 5 we plot the effective stiffnesses for the ice/film and film/vapor surfaces, , , as well as the stiffness coefficient for the crossed correlations . For short, we name these , and , respectively. Results are shown for the pI, basal and pII facets. Results for the ice/water surface from our previous study are also shown for comparison.Benet et al. (2014a)
According to the model of section II.2, for small wave-vectors the remain finite for a rough interface (vanishing ), but diverge if the interface is smooth (finite ), as indicated in Table.1 Our results for the primary prismatic facet (pI) illustrate this clearly. The stiffness coefficients obtained from fluctuations along the basal direction (Fig.5.a) seem to converge to a finite constant value equal to the sum of and , as expected for a rough surface (the rough and pinned scenario). On the contrary, the coefficients obtained from fluctuations along the pII direction appear to diverge, as expected for a smooth interface in the smooth and pinned scenario (Fig.5.b). In our previous work,Benet et al. (2016) we interpreted this observation as revealing the neighborhood of a roughening transition on the pI face of ice very near to the triple point. The difficulty to stabilize the temperature to less than tenths of K over the very large simulation runs of about half a microsecond could explain the differences observed when studying the fluctuations on the pI facet along different directions. We can, however, not discard a very complicated dependence of the results on the system size. The roughening transition is a fluctuation dominated process which is highly geometry dependent. The need to study quasi-one-dimensional systems to access the low q regime at an affordable price could potentially have an impact on the results. However, since in experiments the pI facet has been observed to undergo a roughening transition very close to the triple point,Elbaum (1991); Asakawa et al. (2015) we interpret the results obtained for the (pI)[basal] direction as indicative of a roughening transition for the TIP4P/2005 model.
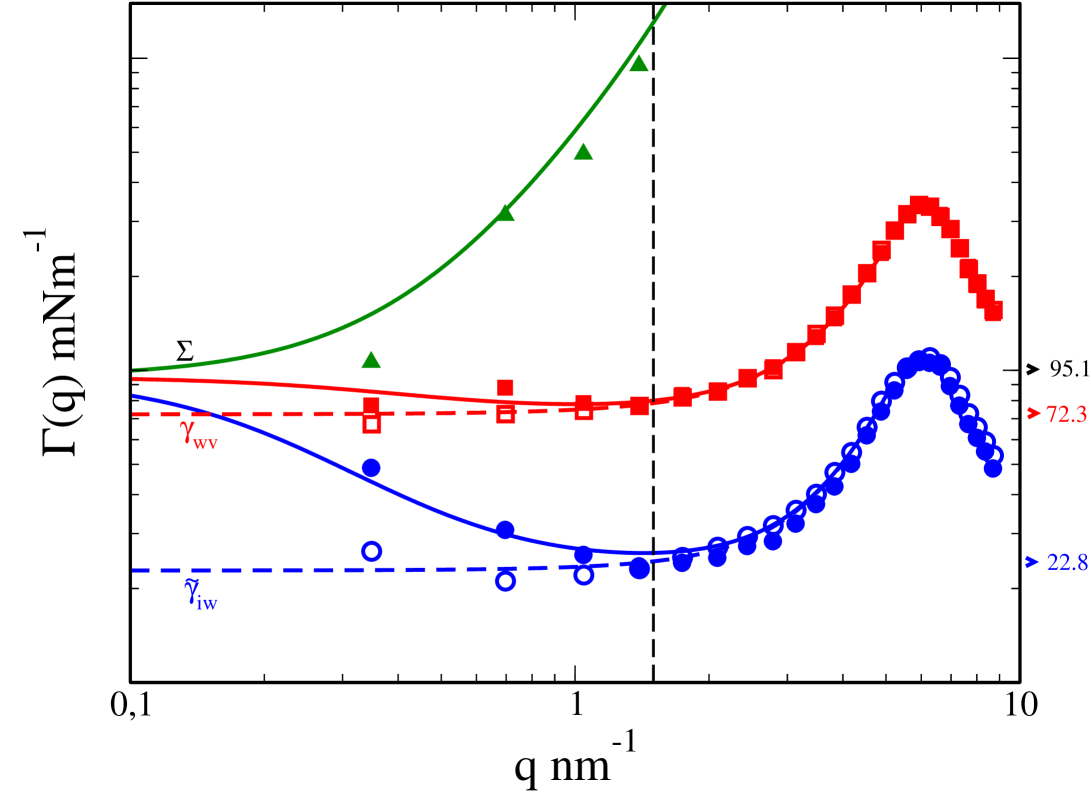
Together with the results of the pI facet, we show results for the the stiffness on the basal facet along the pII direction (basal)[pII] (Fig.5.c) and the secondary prismatic facet along the basal direction (pII)[basal] (Fig.5.d). The results in this case are also difficult to interpret, because we have studied smaller system sizes which are only starting to exhibit the low q regime. However, subject to some reservations the results seem to indicate a divergence of the stiffness coefficients for the basal facet (smooth and pinned scenario) and convergence to a constant value for the pII facet (rough and pinned scenario). To help interpret these results, we have indicated with an arrow in the figures the limit expected from the model for a rough interface (i.e., ). A smooth extrapolation of the simulated data (as performed by visual inspection), would seem to indicate that the results for (Basal)[pII] are larger than this limit, while those for (pII)[Basal] seem to favor the hypothesis of a completely rough interface. This is very much consistent with experimental observations. Indeed, indications of nucleated or spiral growth on the basal facet have been reported in recent years,Inomata et al. (2018); Murata et al. (2018, 2019) confirming the expectations from crystal growth measurements that the basal face of ice is smooth up to the triple point.Beckmann and Lacmann (1982); Libbrecht (2014) On the contrary, the absence of pII facets in ice crystallites suggests a roughening transition for this face well below the triple point.Herring (1951); Rottman and Wortis (1984); Chaikin and Lubensky (1995)
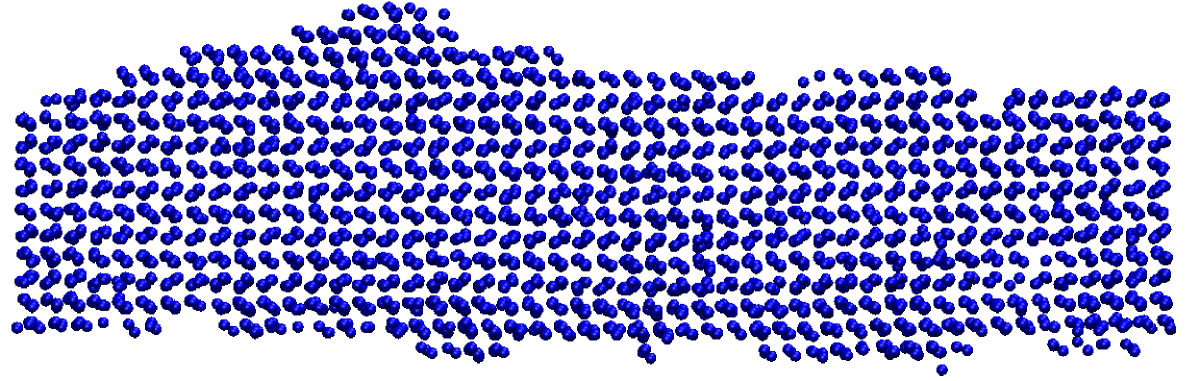
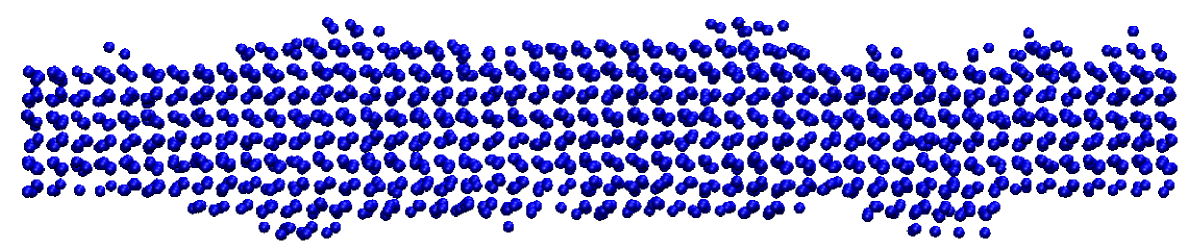
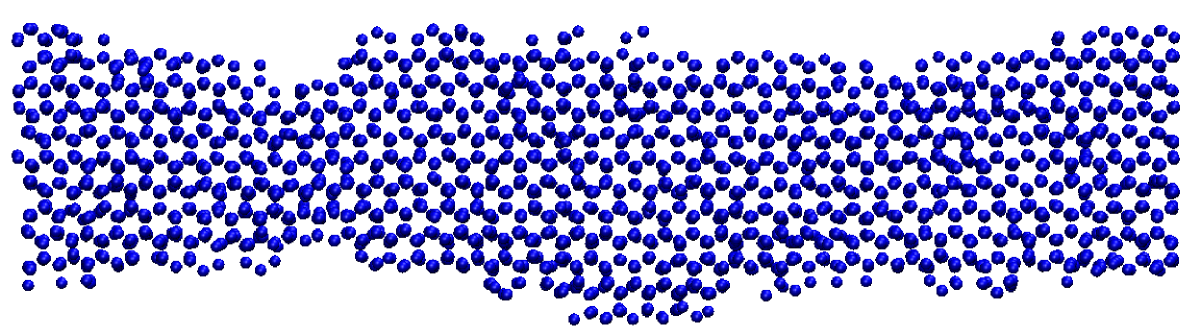
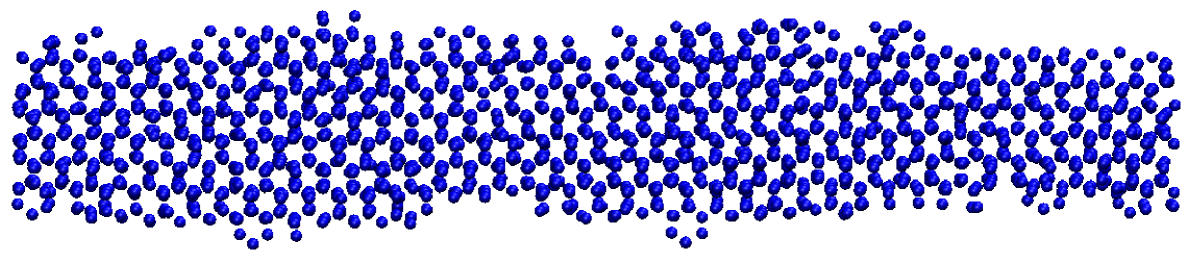
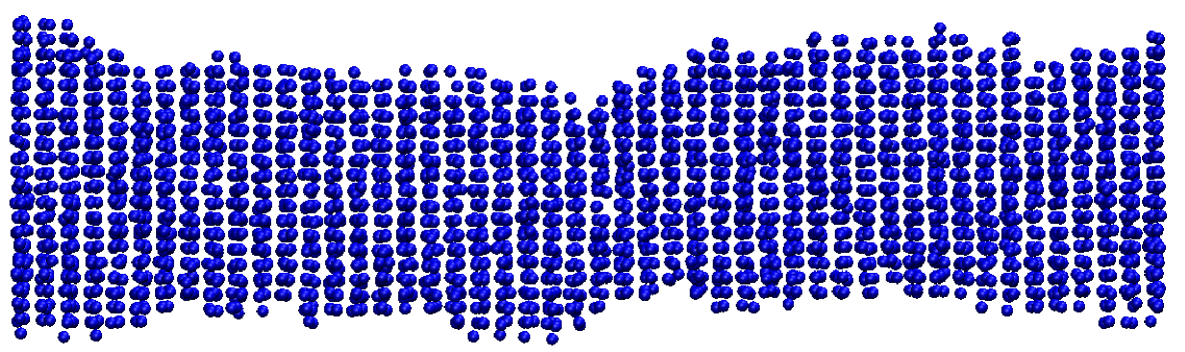
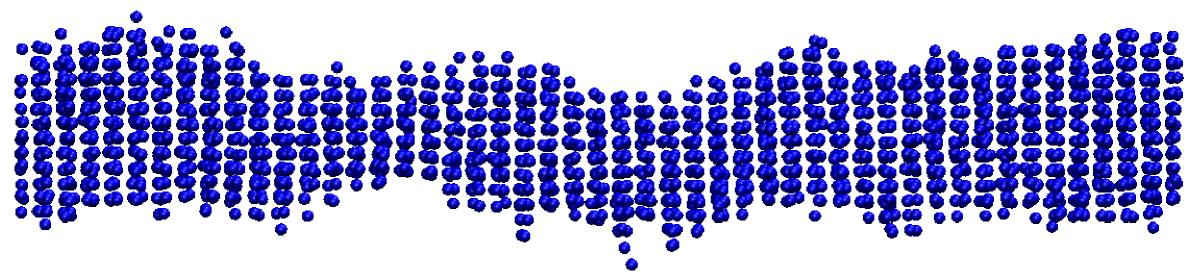
To see the difference in surface structure in a more intuitive way, we accompany our results with snapshots taken from the simulations in Fig. 6. The results seem to support clearly the presence of terraces on the basal face, and appear clearly rough for the pII face, with the pI facet exhibiting a structure somewhat in between these limits.
Despite these indications, it must be noted that observation of a regime with apparently rough behavior does not allow to rule out the appearance of a smooth behavior at length scales larger than the size of our simulation box, as indicated in Table.1. Indeed, in the event that the ice/water correlation length is much larger than the water/vapor correlation length, it is possible to observe a correlated rough behavior of the full surface before the attainment of smooth behavior at wave-lengths larger than . In fact, Libbrecht has suggested that the ice interface remains rough up to fairly large length scales of about 20 unit cells, but that could eventually become smooth at larger length scales.Libbrecht (2014)
IV.3 Structure at small wave-lengths
In the previous section we have interpreted the spectrum of fluctuations at low wave-vectors on the basis of the SG-CW model of section II.2. We have concluded that at a temperature two Kelvin below the triple point, the basal facet is smooth, the pII facet is rough and the pI facet is likely very close to a roughening transition.
We now test whether the model serves as a qualitative description of the ice/vapor interface at large wave-vectors. We note that, according to the model, the effective stiffnesses for the ice/film and film/vapor surfaces should become equal to those of the ice/water and water/vapor surfaces, respectively, for large enough wave vectors (c.f. Table 1).
We test this hypothesis by comparing and with the stiffness coefficients, and obtained in our previous work for the ice/water and water/vapor interface,Benet et al. (2014c) as shown with open symbols in Fig.5.
The results show that the stiffness coefficients of the premelting film are indeed very similar to those of water for wave-vectors beyond about nm-1, as summarized for all surface directions studied in Fig. 7. Thus, for wavelengths smaller than about nm, the ice surface cannot tell the difference between the bulk liquid phase or the thin premelted film. Similarly, the liquid/vapor surface cannot tell whether it limits a bulk liquid phase or a thin premelted film in contact with bulk ice. Whence, at this length-scale, surface properties of the bounding premelting film are hardly distinguishable from those of water. This behavior is consistent with experimental findings, which report clear signatures of bulk water on the premelting film at small scales.Smit and Bakker (2017)
In terms of surface fluctuations, what this means is that for such wavelengths, the ice/film and film/vapor surfaces behave independently from each other, and are therefore uncorrelated. For that reason, the cross correlations decay very fast and the corresponding stiffness diverges, as is observed in Fig.5 (triangles) and is predicted from the analysis of Eq.10 and Eq.11 in Table.1
| Orientation | |||
|---|---|---|---|
| (Basal)[pII] | 28.4 | 30.8 | 88.7 |
| (pI)[Basal] | 26.1 | 30.3 | 87.1 |
| (pI)[pII] | 27.2 | 29.2 | 84.6 |
| (pII)[Basal] | 22.8 | 24.2 | 79.3 |
| (pII)[pI] | 24.8 | 25.3 | 79.2 |
In order to stress this point in a quantitative manner, we fit and for nm-1 to the expression given by the capillary wave theory Meunier (1987); Mecke and Dietrich (1999); Blokhuis (2009):
| (12) |
where is known as the bending rigidity coefficient, and a fitting parameter with no particular physical significance.
Table 3 collects the data obtained this way, together with the corresponding results obtained for the ice/water interface.Benet (2015) Note that the results reported here correspond to direct extrapolation of to . This provides the interfacial stiffness coefficients and not to the surface tensions. The stiffness coefficients reported in the table are suitably analysed in Ref.Benet (2015) and show very good agreement with interface tension measurements from the mold integration technique.Espinosa et al. (2016)
The estimates obtained from the fluctuations of the premelting film are in reasonable agreement with the data for the independent interfaces, albeit systematically too large.
A closer inspection shows that in fact this could have been expected from our model. Indeed, since the stiffness coefficients are actually not constants, but rather, are dependent, it follows that the bending rigidity coefficients feed into the apparent stiffness so that, in fact, the fits yield the stiffness coefficients up to a constant small factor of:
| (13) |
Since the bending rigidities are positive, and we expect also to be small but positive, this factor is larger than unity, and explains the somewhat larger coefficients obtained in Table 3.
Additionally, this seems to be consistent with claims that the film-vapor surface tension of an adsorbed film is expected to depend on the film thickness by a factor that is proportional to (with the bulk correlation length), as shown recently,MacDowell et al. (2013); Benet et al. (2014a); MacDowell et al. (2014, 2018). Since , this term could account for an enhancement of with respect to the water-vapor surface tension pertaining to semi-infinite amounts of bulk phase. Notice that the need for a film thick dependent surface tension was also suggested recently.Murata et al. (2016)
V Quantitative test
In the two preceding sections we have shown that the qualitative results of the phenomenological SG-CW model allow us to interpret the results obtained from simulations. A crucial issue as regards the surface structure is whether the interface is overall smooth ( finite) or rough (), which can be elucidated from the behavior of the effective stiffnesses in the limit. Unfortunately, the low wave-vector regime is achieved very slowly, so there remains some uncertainty as to the conclusions reached from visual extrapolation of the limited simulation data.
In our study, we have found that the SG-CW model not only provides a qualitative framework to interpret the interfacial behavior; it also provides a rather reasonable quantitative account of the simulation results. This allows us to provide estimates of the phenomenological parameters and , and also allows us to exploit the intermediate wave-vector data in order to determine whether the surface is rough or smooth in a consistent and controlled manner. To show this, we performed fits of the stiffness coefficients to the SG-CW, with used either as a fitting parameter or fixed at . For (pI)[Basal] and (pII)[Basal], the constrained fit with provided the smallest squared deviations, while for (pI)[pII] and (Basal)[pII], the smallest deviations were obtained using a finite value for . Best fits to the simulation data are shown in Fig.5. As illustrated in the figure (notice the double logarithmic scale of the plot), the model provides a systematic means for extrapolation of the results into the low region, and supports the conclusions obtained previously by visual inspection.
Table 4 collects the model parameters of the best fits displayed on Fig.5. The data can be exploited to provide estimates for very relevant surface properties that are otherwise extremely difficult to obtain from computer simulation. Firstly, we can trivially estimate the parallel correlation length of ice/film and film/vapor surfaces, since and . For smooth surfaces on a mono-crystal, growth proceeds by birth and spread of 2-d critical nuclei that are just one lattice spacing higher than the flat facet. The parallel correlation length dictates the range of decay of the ice/film profile, so that the average slope of this profile at the edge of a pancake like nucleus is given by . In order to clearly identify a terrace in a molecular simulation, we would need a simulation box which is several times larger than in the lateral direction. The table shows that the Basal facet has a parallel correlation length of about two nanometers, so that properly formed terraces can only be identified in a simulation box with lateral dimensions of about 10 nanometers. This explains why it appears to be so difficult to identify such structures in computer simulations of the Basal facet. Also is a relevant property, since it determines the length-scales over which defects on the ice-film surface are healed by the premelting film.de Gennes et al. (2004) Particularly, the liquid-film heals irregularities of the ice surface with a length-scale smaller than , but will adapt to irregularities which occur on a length-scale larger than . For smooth realizations of the ice surface, Table 4 shows that is somewhat larger but of the same order of magnitude as , so we expect that the profile of terraces formed on the ice-film surface will be followed rather faithfully by the film-vapor surface. This explains why steps are observed consistently on the basal surface of ice by optical microscopy, despite the presence of a premelting film.Sazaki et al. (2012); Inomata et al. (2018); Murata et al. (2018, 2019)
Of even greater significance is the possibility to estimate step free energies. Indeed, we expect that the step free energy, , describing the free energy cost of the edge on a terrace will be of the order . For the sine-Gordon model, in fact, .Noziéres and Gallet (1987) As seen in Table 4, estimates using this formula are found to be about J/m, which is the same order of magnitude as results reported by Libbrecht from crystal growth measurements, J/m,Libbrecht and Rickerby (2013) and a factor of 10 smaller than very recent estimates by Murata et al. by direct observation of 2-d nucleation rates, J/m.Murata et al. (2019)
| Surface | /nm | /Jm-4 | /Jm-4 | /nm | /Jm-1 | /nm |
|---|---|---|---|---|---|---|
| (Basal)[pII] | 0.37 | 6.5 | 6.0 | 2.1 | 0.37 | 3.5 |
| (pI)[Basal] | 0.40 | 0 | 8.7 | 0 | 2.9 | |
| (pI)[pII] | 0.40 | 3.3 | 7.3 | 2.9 | 0.30 | 3.2 |
| (pII)[Basal] | 0.22 | 0 | 3.6 | 0 | 4.5 |
VI Surface Melting?
Whereas it is quite clear from our simulations that there is a thin premelting layer of about one nanometer thickness, it is far more difficult to confirm whether this surface film diverges as the triple point is approached, i.e., whether the system undergoes surface melting or not. In principle, this could be elucidated by measuring the premelting thickness as a function of temperature, followed by suitable extrapolation.Conde et al. (2008); Limmer and Chandler (2014) However, the test requires large systems, a very precise knowledge of the triple point and also a fine control of the temperature, which is difficult to achieve for inhomogeneous systems.
In practice, the existence of a surface melting transition will depend essentially on the behavior of the interface potential, , at large film thickness. An interface potential decaying to zero with negative slope, implies a repulsion of the film/vapor interface from the ice/film surface, and a propensity to surface melt. On the contrary, if decays with positive slope, then an increase in film thickness is penalized, and the film will remain finite at coexistence.Schick (1990) In the absence of an explicit interface potential calculated for this system, we can nevertheless make a discussion based on general concepts of wetting and intermolecular forces.
Exactly how does decay will depend on the nature of the long range dispersion interactions. A precise account of such interactions in computer simulations is actually completely beyond present state of the art, because they result from quantum fluctuations of the electromagnetic field all the way from x-ray to infrared frequencies, plus static contributions as well. Accordingly, an accurate representation of the van der Waals forces would require to account for polarization effects in this whole range. A more appropriate theoretical framework is the quantum field theory of Dzyaloshinskii, Lifshitz and Pitaevskii (DLP), which allows us to describe these interactions from the known dielectric response of the media involved.Dzyaloshinskii et al. (1961); Safran (1994); Parsegian (2006)
Because the full expression of the DLP theory is fairly difficult to interpret qualitatively, it is best to discuss the results separately for film thickness that are either small (non-retarded interactions) or large (retarded interactions) compared to the distance traveled by light at ultraviolet frequencies.
For non-retarded interactions, the long range contribution to the interface potential has the form:Parsegian (2006); Safran (1994); Israelachvili (1991)
| (14) |
where and are thermal and athermal contributions to the total Hamaker constant, . The first term depends only on the static dielectric response of the media. It includes purely classical thermal averaging of the dipole fluctuations, such as Keesom plus Debye type interactions between the molecules. It reads:
| (15) |
where , , are the static dielectric constants of the ice, water and vapor phases.
The second term stems from the frequency dependent dielectric response and has a purely quantum mechanical origin:
| (16) |
where know, the integrand involves the dielectric response as a function of imaginary frequencies.
The static dielectric response of ice is larger than that of water,Israelachvili (1991) , and , so that is negative, and favors wetting of water on ice at the triple point.Elbaum and Schick (1991) At finite imaginary frequencies, the dielectric constant of ice is smaller than that of water from the micro-wave to the visible, but becomes larger again in the extreme-ultraviolet.Elbaum and Schick (1991) In practice, the high frequency dielectric response dominates the behavior of the Hamaker constant at small distances. Using DLP theory, with dielectric data reported by Elbaum and Schick as input, we find J, with a static contribution J that accounts for about 10% of the total Hamaker constant (c.f. Ref.(Limmer and Chandler, 2014; Limmer, 2016)).
Actually, the above results are only appropriate for film lengths that are smaller than the typical distance traveled by the electromagnetic field in the extreme ultraviolet region. For thicker films, at the nanometer range, retardation effects cause the intermolecular forces to decay at a faster rate which asymptotically is of the order . More importantly, the constant governing this decay depends on the visible and infra-red dielectric response of the material and can have completely different sign from .Dzyaloshinskii et al. (1961) Elbaum and Schick carried a detailed analysis of the high frequency dielectric response, and concluded that, because of retardation effects, the interface potential at large distances takes a positive slope, and therefore develops a very shallow minimum at about 36 Å, so that, under the action of long range forces alone, water does not wet ice at the triple point.Elbaum and Schick (1991)
Whence, contrary to erroneous claims by Limmer,Limmer (2016) the origin of incomplete surface melting of ice is not at all related to the static Hamaker constant , which is used with the erroneous sing convention in Ref.(Limmer and Chandler, 2014; Limmer, 2016), but rather, to retarded interactions that are dominated by the visible and infrared terms of the dielectric response and decay as .
Yet, these arguments leave completely aside the possibility of pure Coulombic interactions that could result from a net charge at the ice/water and water/vapor surface.Wilen et al. (1995) This can occur even in pure water, because the broken symmetry of the interface promotes a small but significant net charge transfer between molecules.Lee and Rick (2012)
This discussion serves to understand how difficult it is to clarify the issue of surface melting by using standard computer simulations. In all such studies to date, rigid point charge models have been employed at best.Conde et al. (2008); Limmer and Chandler (2014); Pickering et al. (2018) Unfortunately, such models are not polarizable and do not properly account for the dielectric response, as they usually predict a smaller static dielectric constant for ice than for water.Rick and Haymet (2003); Rick (2005); MacDowell and Vega (2010); Aragones et al. (2011) As a result, the sign of is inverted with respect to expectations based on the experimental dielectric constant.
This issue cannot be remedied by considering the contribution. Indeed, that term, which stems from quantum mechanical fluctuations of the electric field at extreme ultraviolet frequencies, is accounted in classical simulations by the dispersive contribution of the Lennard-Jones potential. Whence, depends only on the difference between the bulk densities of the phases involved, and is given by:Dietrich and Schick (1986); Dietrich and Napiórkowski (1991)
| (17) |
For water, it is well known that , so that is also positive and accordingly does not favor surface melting either.
In fact, the latter contribution cannot be described accurately in computer simulations, since, in practice, dispersive interactions are truncated beyond a nanometer or so. Whence, long range dispersive interactions are replaced by short range truncated interactions, which produce an exponential rather than an algebraic decay, and correspond to the complete neglect of beyond the cutoff distance.
A plausible assumption is that rigid point charge models will therefore not yield surface melting, since they are dominated by the incorrect term stemming from the permanent dipoles. Unlike dispersive terms, such long range contribution is indeed taken into account explicitly in simulations via the Ewald summation. Possibly, however, the presence of a nanometer thick premelting film close to the triple point growing as temperature is raised towards the triple point,Conde et al. (2008) indicates that the short range structural forces in water do promote surface melting. This hypothesis is further supported by recent simulations, where a coarse grained model of water that only enforces short range tetrahedral correlations, but ignores charges and dispersion, has shown convincingly to exhibit (short range) surface melting.Limmer and Chandler (2014) Assuming that point charge models exhibit short range structural forces of similar nature, one then concludes that a thick premelting film must form at the triple point. Whether such film exhibits a divergence or not in real water will be then dictated by the nature of the long range dispersive interactions, which, at best, can be described within the DLP framework and seem to indicate incomplete surface melting.Elbaum and Schick (1991) Computer simulations do seem to indicate reliably from the extent of the prewetting films of our model, that the range where short range structural forces dominate over the Hamaker contribution is at least at the nanometer range. This implies that the minimum estimated from consideration of long range forces alone at about 36 Å,Elbaum and Schick (1991) is most likely located at longer distances, and will play a significant role at temperatures very close to the triple point.
This scenario is supported by recent experimental observations, which indicate that thick but bound films of up to 9 nm can form on saturated ice surfaces close to the triple point.Sazaki et al. (2012); Asakawa et al. (2015, 2016); Murata et al. (2016) Unexpectedly, the experiments have also revealed that these thick films grow discontinuously, as in a first order thin-to-thick surface phase transition, of the kind observed previously for alkanes adsorbed on water and polymer on silicium.Shahidzadeh et al. (1998); Bertrand et al. (2000); Müller et al. (2001); MacDowell and Müller (2005) This scenario implies the presence of two minima of the interface potential,Murata et al. (2016) and currently, there is no known theoretical explanation to account for the origin of this additional minimum. Clearly, much greater efforts will be needed to fully elucidate the intriguing surface behavior of ice close to the triple point.
VII Conclusions
In this paper we have studied the structure of the solid/vapor interfaces of water in the neighborhood of the triple point for the TIP4P/2005 model. Our results show that the three most important planes of ice, basal, primary prismatic and secondary prismatic exhibit a thin premelted liquid layer of about 0.9 nm. This implies that the ice/vapor interface may be described in terms of two additional surfaces, separating the premelting layer from the bulk solid and bulk vapor phases. We have studied the fluctuations of these two surfaces, and analyzed them in terms of a simple phenomenological model of coupled surface fluctuations.
Our results suggest that the ice/film surface is smooth for the basal facet, it is rough for the secondary prismatic facet, and very close to the roughening transition 2 K away from the triple point for the primary prismatic facet. The basal facet has a step free energy of about , in reasonable agreement with experiments.Libbrecht (2013); Murata et al. (2019) The film/vapor surface at large wave-lengths is strongly correlated to the ice/film surface, and exhibits qualitatively similar fluctuations. Our study reveals that it is possible to have a highly disordered outer layer of premelted molecules below a smooth and faceted surface. Furthermore, it shows that the liquid like premelting film can adapt to the shape of the steps on the surface, thus explaining why a premelting film can be consistent with the observation of steps and terraces in experiments.Sazaki et al. (2012); Asakawa et al. (2015, 2016); Murata et al. (2016)
We test the phenomenological model by comparing the ice/film and film/vapor fluctuations with those obtained from independent simulations of the ice/water and water/vapor interfaces. The results clearly demonstrate a crossover from a microscopic regime of length scales smaller than about 4.5 nm, where the premelted surfaces fluctuate independently, and nearly as those of the ice/water and water/vapor interfaces. For larger wavelengths, on the contrary, the two surfaces become correlated and behave as a single interface. When the facet becomes rough, fluctuations become governed by a stiffness which is close to, but somewhat larger than the sum of the ice/water stiffness and the water/vapor surface tension, whence, about .
Our results lend support to a recent study, which indicates that the crystal growth of ice crystallites in either bulk water or bulk vapor follows a similar mechanism Libbrecht (2014); Murata et al. (2018). This implies, for the crystal growth in the vapor phase, a process that is limited by the crystallization of water molecules within the premelted liquid film.
On the contrary, we note that present state of the art computer simulations have not reached the level of accuracy required to elucidate accurately the problem of surface melting on ice.
VIII Acknowledgments
The authors would like to thank A. Michaelides and B. Slater for providing us a copy of Ref.(Slater and Michaelides, 2019) prior to publication, as well as Eva G. Noya for helpful discussions. We also wish to thank the Agencia Estatal de Investigación and Fondo Europeo de Desarrollo Regional (FEDER) for research grant FIS-89361-C3-2-P. P.L. wishes to acknowledge additional support under grant FIS2015-72946-EXP.
References
- Libbrecht (2005) K. G. Libbrecht, “The physics of snow crystals,” Rep. Prog. Phys. 68, 855–895 (2005).
- Pfalzgraff et al. (2010) W. C. Pfalzgraff, R. M. Hulscher, and S. P. Neshyba, “Scanning electron microscopy and molecular dynamics of surfaces of growing and ablating hexagonal ice crystals,” Atmos. Chem. Phys. 10, 2927–2935 (2010).
- Ball (2016) P. Ball, “Material witness: Close to the edge,” Nature Mat. 15, 1060 (2016).
- Demange et al. (2017) G. Demange, H. Zapolsy, R. Patte, and M. Brunel, “A phase field model for snow crystal growth in three dimensions,” npj Comp. Mat. 3, 15 (2017).
- Burton et al. (1951) W. K. Burton, N. Cabrera, and F. C. Frank, “The growth of crystals and the equilibrium structure of their surfaces,” Phil. Trans. R. Soc. Lond. A. Math. Phys. 243, 299–358 (1951).
- van Beijeren (1977) Henk van Beijeren, “Exactly solvable model for the roughening transition of a crystal surface,” Phys. Rev. Lett. 38, 993–996 (1977).
- Abraham (1980) D. B. Abraham, “Solvable model with a roughening transition for a planar ising ferromagnet,” Phys. Rev. Lett. 44, 1165–1168 (1980).
- Lipowsky (1982) R. Lipowsky, “Critical surface phenomena at first-order bulk transitions,” Phys. Rev. Lett. 49, 1575–1578 (1982).
- Fisher and Weeks (1983) Daniel S. Fisher and John D. Weeks, “Shape of crystals at low temperatures: Absence of quantum roughening,” Phys. Rev. Lett. 50, 1077–1080 (1983).
- Rommelse and den Nijs (1987) Koos Rommelse and Marcel den Nijs, “Preroughening transitions in surfaces,” Phys. Rev. Lett. 59, 2578–2581 (1987).
- Ball and Evans (1988) P. C. Ball and R. Evans, “Structure and adsorption at gas-solid interfaces: Layering transitions from a continuum theory,” J. Chem. Phys. 89, 4412–4423 (1988), https://doi.org/10.1063/1.454827 .
- Lipowsky (1990) R. Lipowsky, “Surface-induced disorder and surface melting,” in Magnetic Properties of Low-Dimensional Systems II, Springer Proceedings in Physics, Vol. 50, edited by L. M. Falicov, F. Mejia-Lira, and J. L. Moran-Lopez (Springer-Verlag, Heidelberg, 1990) pp. 158–166.
- Evans (1992) R. Evans, “Density functionals in the theory of nonuniform fluids,” in Fundamentals of Inhomogenous Fluids, edited by D. Henderson (Marcel Dekker, New York, 1992) Chap. 3, pp. 85–175.
- Herring (1951) Conyers Herring, “Some theorems on the free energies of crystal surfaces,” Phys. Rev. 82, 87–93 (1951).
- Rottman and Wortis (1984) Craig Rottman and Michael Wortis, “Equilibrium crystal shapes for lattice models with nearest-and next-nearest-neighbor interactions,” Phys. Rev. B 29, 328–339 (1984).
- Chaikin and Lubensky (1995) P. M. Chaikin and T. C. Lubensky, Principles of Condensed Matter Physics (Cambridge University Press, Cambridge, 1995).
- Kuroda and Lacmann (1982) T. Kuroda and R. Lacmann, “Growth kinetics of ice from the vapour phase and its growth forms,” J. Cryst. Growth 56, 189–205 (1982).
- Jayaprakash et al. (1983) C. Jayaprakash, W. F. Saam, and S. Teitel, “Roughening and facet formation in crystals,” Phys. Rev. Lett. 50, 2017–2020 (1983).
- Conde et al. (2008) M. M. Conde, C. Vega, and A. Patrykiejew, “The thickness of a liquid layer on the free surface of ice as obtained from computer simulation,” J. Chem. Phys. 129, 014702 (2008), https://doi.org/10.1063/1.2940195 .
- Yang et al. (2013) A. J. Yang, M. Asta, and B. B. Laird, “Solid–liquid interfacial premelting,” Phys. Rev. Lett. 110, 096102 (2013).
- Limmer and Chandler (2014) David T. Limmer and David Chandler, “Premelting, fluctuations, and coarse-graining of water-ice interfaces,” J. Chem. Phys. 141, 18C505 (2014).
- Kling et al. (2018) Tanja Kling, Felix Kling, and Davide Donadio, “Structure and dynamics of the quasi-liquid layer at the surface of ice from molecular simulations,” J. Phys. Chem. C 122, 24780–24787 (2018), https://doi.org/10.1021/acs.jpcc.8b07724 .
- Pickering et al. (2018) Ignacio Pickering, Martin Paleico, Yamila A. Perez Sirkin, Damian A. Scherlis, and Matías H. Factorovich, “Grand canonical investigation of the quasi liquid layer of ice: Is it liquid?” J. Phys. Chem. B 122, 4880–4890 (2018), pMID: 29660281, https://doi.org/10.1021/acs.jpcb.8b00784 .
- Mohandesi and Kusalik (2018) Ali Mohandesi and Peter G. Kusalik, “Probing ice growth from vapor phase: A molecular dynamics simulation approach,” J. Cryst. Growth 483, 156 – 163 (2018).
- Qiu and Molinero (2018) Yuqing Qiu and Valeria Molinero, “Why is it so difficult to identify the onset of ice premelting?” J. Phys. Chem. Lett. 9, 5179–5182 (2018), https://doi.org/10.1021/acs.jpclett.8b02244 .
- Schick (1990) M. Schick, “Introduction to wetting phenomena,” in Liquids at Interfaces, Les Houches Lecture Notes (Elsevier, Amsterdam, 1990) pp. 1–89.
- Dosch et al. (1995) H. Dosch, A. Lied, and J. H. Bilgram, “Glancing angle x-ray scattering studies of the premelting of ice surfaces,” Surf. Sci. 327, 145–164 (1995).
- Cao and Conrad (1990) Yijian Cao and Edward H. Conrad, “Approach to thermal roughening of ni(110): A study by high-resolution low-energy electron diffraction,” Phys. Rev. Lett. 64, 447–450 (1990).
- Gibbs et al. (1988) Doon Gibbs, B. Ocko, D. Zehner, and S. Mochrie, “Absolute x-ray reflectivity study of the au(100) surface,” Phys. Rev. B 38, 7303–7310 (1988).
- Mei and Lu (2007) Q. S. Mei and K. Lu, “Melting and superheating of crystalline solids: From bulk to nanocrystals,” Prog. Materials Sci. 52, 1175–1262 (2007).
- Jasnow (1984) D. Jasnow, “Critical phenomena at interfaces,” Rep. Prog. Phys. 47, 1059 (1984).
- Chernov and Mikheev (1988) A. A. Chernov and L. V. Mikheev, “Wetting of solid surfaces by a structured simple liquid: Effect of fluctuations,” Phys. Rev. Lett. 60, 2488–2491 (1988).
- Chernov and Mikheev (1989) A. A. Chernov and L. V. Mikheev, “Wetting and surface melting: Capillary fluctuations vs. layerwise short-range order,” Physica. A 157, 1042–1058 (1989).
- Henderson (1994) J. R. Henderson, “Wetting phenomena and the decay of correlations at fluid interfaces,” Phys. Rev. E 50, 4836–4846 (1994).
- Dash et al. (2006) J. G. Dash, A. W. Rempel, and J. S. Wettlaufer, “The physics of premelted ice and its geophysical consequences,” Rev. Mod. Phys. 78, 695–741 (2006).
- Elbaum (1991) Michael Elbaum, “Roughening transition observed on the prism facet of ice,” Phys. Rev. Lett. 67, 2982–2985 (1991).
- Elbaum and Schick (1991) Michael Elbaum and M. Schick, “Application of the theory of dispersion forces to the surface melting of ice,” Phys. Rev. Lett. 66, 1713–1716 (1991).
- Elbaum et al. (1993) Michael Elbaum, S. G. Lipson, and J. G. Dash, “Optical study of surface melting on ice,” J. Cryst. Growth 129, 491–505 (1993).
- Lied et al. (1994) A. Lied, H. Dosch, and J. H. Bilgram, “Surface melting of ice Ih single crystals revealed by glancing angle x-ray scattering,” Phys. Rev. Lett. 72, 3554–3557 (1994).
- Bluhm et al. (2002) H. Bluhm, D. F. Ogletree, C. S. Fadley, Z. Hussain, and M. Salmeron, “The premelting of ice studied with photoelectron spectroscopy,” J. Phys.: Condens. Matter 14, L227–L233 (2002).
- Sazaki et al. (2012) Gen Sazaki, Salvador Zepeda, Shunichi Nakatsubo, Makoto Yokomine, and Yoshinori Furukawa, “Quasi-liquid layers on ice crystal surfaces are made up of two different phases,” Proc. Natl. Acad. Sci. U.S.A. 109, 1052–1055 (2012), http://www.pnas.org/content/109/4/1052.full.pdf .
- Asakawa et al. (2015) Harutoshi Asakawa, Gen Sazaki, Ken Nagashima, Shunichi Nakatsubo, and Yoshinori Furukawa, “Prism and other high-index faces of ice crystals exhibit two types of quasi-liquid layers,” Crystal Growth & Design 15, 3339–3344 (2015), http://dx.doi.org/10.1021/acs.cgd.5b00438 .
- Asakawa et al. (2016) Harutoshi Asakawa, Gen Sazaki, Ken Nagashima, Shunichi Nakatsubo, and Yoshinori Furukawa, “Two types of quasi-liquid layers on ice crystals are formed kinetically,” Proc. Natl. Acad. Sci. U.S.A. 113, 1749–1753 (2016), http://www.pnas.org/content/113/7/1749.full.pdf .
- Murata et al. (2016) Ken-ichiro Murata, Harutoshi Asakawa, Ken Nagashima, Yoshinori Furukawa, and Gen Sazaki, “Thermodynamic origin of surface melting on ice crystals,” Proc. Natl. Acad. Sci. U.S.A. 113, E6741–E6748 (2016).
- Sánchez et al. (2017) M. Alejandra Sánchez, Tanja Kling, Tatsuya Ishiyama, Marc-Jan van Zadel, Patrick J. Bisson, Markus Mezger, Mara N. Jochum, Jenée D. Cyran, Wilbert J. Smit, Huib J. Bakker, Mary Jane Shultz, Akihiro Morita, Davide Donadio, Yuki Nagata, Mischa Bonn, and Ellen H. G. Backus, “Experimental and theoretical evidence for bilayer-by-bilayer surface melting of crystalline ice,” Proc. Natl. Acad. Sci. U.S.A. 114, 227–232 (2017), http://www.pnas.org/content/114/2/227.full.pdf .
- Slater and Michaelides (2019) B. Slater and A. Michaelides, “Surface premelting of water ice,” Nat. Rev. Chem 3, 172–188 (2019).
- Sadtchenko and Ewing (2002) Vlad Sadtchenko and George E. Ewing, “Interfacial melting of thin ice films: An infrared study,” J. Chem. Phys. 116, 4686–4697 (2002), https://doi.org/10.1063/1.1449947 .
- Smit and Bakker (2017) Wilbert J. Smit and Huib J. Bakker, “The surface of ice is like supercooled liquid water,” Angew. Chem. Int. Ed. Engl. 56, 15540–15544 (2017), https://onlinelibrary.wiley.com/doi/pdf/10.1002/anie.201707530 .
- Michaelides and Slater (2017) Angelos Michaelides and Ben Slater, “Melting the ice one layer at a time,” Proc. Natl. Acad. Sci. U.S.A. 114, 195–197 (2017), http://www.pnas.org/content/early/2017/01/01/1619259114.full.pdf .
- Gonda et al. (1999) T. Gonda, T. Arai, and T. Sei, “Experimental study on the melting process of ice crystals just below the melting point.” Polar Meteorol. Glaciol. 13, 38–42 (1999).
- Wettlaufer (1999) J. Wettlaufer, “Impurity effects in the premelting of ice,” Phys. Rev. Lett. 82, 2516–2519 (1999).
- Mitsui and Aoki (2019) Takahisa Mitsui and Kenichiro Aoki, “Fluctuation spectroscopy of surface melting of ice with and without impurities,” Phys. Rev. E 99, 010801 (2019).
- Libbrecht (2013) K. G. Libbrecht, “On the equilibrium shape of an ice crystal,” arXiv:1205.1452 [cond-mat.mtrl-sci] (2013).
- Maruyama et al. (1997) Minoru Maruyama, Takehito Nishida, and Tsutomu Sawada, “Crystal shape of high-pressure ice ih in water and roughening transition of the (10-10) plane,” The Journal of Physical Chemistry B 101, 6151–6153 (1997), http://pubs.acs.org/doi/pdf/10.1021/jp9631745 .
- Gonda and Yamakazi (1978) T. Gonda and T. Yamakazi, “Morphology of ice droxtals grown from supercooled water droplets,” J. Cryst. Growth 45, 66–69 (1978).
- Colbeck (1983) S. C. Colbeck, “Ice crystal morphology and growth rates at low supersaturations and high temperatures,” J. App. Phys. 54, 2677–2682 (1983).
- Benet et al. (2014a) Jorge Benet, Luis G. MacDowell, and Eduardo Sanz, “A study of the ice-water interface using the tip4p/2005 water model,” Phys. Chem. Chem. Phys. 16, 22159–22166 (2014a).
- Furukawa and Nada (1997) Yoshinori Furukawa and Hiroki Nada, “Anisotropic surface melting of an ice crystal and its relationship to growth forms,” J. Phys. Chem. B 101, 6167–6170 (1997), http://dx.doi.org/10.1021/jp9631700 .
- Bishop et al. (2009) C. L. Bishop, D. Pan, L. M. Liu, G. A. Tribello, A. Michaelides, E. G. Wang, and B. Slater, “On thin ice: surface order and disorder during pre-melting,” Faraday Discuss. 141, 277–292 (2009).
- Pereyra and Carignano (2009) Rodolfo G. Pereyra and Marcelo A. Carignano, “Ice nanocolumns: A molecular dynamics study,” J. Phys. Chem. C 113, 12699–12705 (2009), http://dx.doi.org/10.1021/jp903404n .
- Pan et al. (2011) D. Pan, L-M. Liu, B. Slater, A. Michaelides, and E. Wang, “Melting the ice: On the relation between temerature and size for nanoscale ice crystals,” ACS nano 5, 4562–4569 (2011).
- Benet (2015) Jorge Benet, Estudio por Simulación de Fluctuaciones Capilares: Interfases Fluidas, Adsorbidas y Sólidas, Ph.D. thesis, Universidad Complutense de Madrid (2015).
- Benet et al. (2016) Jorge Benet, Pablo Llombart, Eduardo Sanz, and Luis G. MacDowell, “Premelting-induced smoothening of the ice-vapor interface,” Phys. Rev. Lett. 117, 096101 (2016).
- Abascal et al. (2005) J. L. F. Abascal, E. Sanz, R. G. Fernandez, and C. Vega, “A potential model for the study of ices and amorphous water: TIP4P/Ice,” J. Chem. Phys. 122, 234511 (2005).
- Vega and Abascal (2011) Carlos Vega and Jose L. F. Abascal, “Simulating water with rigid non-polarizable models: a general perspective,” Phys. Chem. Chem. Phys. 13, 19663–19688 (2011).
- MacDowell and Vega (2010) L. G. MacDowell and C. Vega, “Dielectric constant of ice ih and ice v: A computer simulation study,” J. Phys. Chem. B 114, 6089–6098 (2010).
- MacDowell et al. (2014) Luis G. MacDowell, Jorge Benet, Nebil A. Katcho, and Jose M.G. Palanco, “Disjoining pressure and the film-height-dependent surface tension of thin liquid films: New insight from capillary wave fluctuations,” Adv. Colloid Interface Sci. 206, 150–171 (2014).
- Benet et al. (2014b) J. Benet, J. G. Palanco, E. Sanz, and L. G. MacDowell, “Disjoining pressure, healing distance, and film height dependent surface tension of thin wetting films,” J. Phys. Chem. C 118, 22079–22089 (2014b).
- Nelson et al. (2004) D. Nelson, T. Piran, and S. Weinberg, Statistical Mechanics of Membranes and Surfaces (Word Scientific, Singapore, 2004).
- Safran (1994) Samuel A. Safran, Statistical Thermodynamics of Surfaces, Interfaces and Membranes, 1st ed. (Addison-Wesley, Reading, 1994).
- Li et al. (2001) Ming Li, Aleksey M. Tikhonov, David J. Chaiko, and Mark L. Schlossman, “Coupled capillary wave fluctuations in thin aqueous films on an aqueous subphase,” Phys. Rev. Lett. 86, 5934–5937 (2001).
- Fukuto et al. (2006) Masafumi Fukuto, Oleg Gang, Kyle J. Alvine, and Peter S. Pershan, “Capillary wave fluctuations and intrinsic widths of coupled fluid-fluid interfaces: An x-ray scattering study of a wetting film on bulk liquid,” Phys. Rev. E 74, 031607 (2006).
- Pershan and Schlossman (2012) P. S. Pershan and M. Schlossman, Liquid Surfaces and Interfaces: Synchrotron X-ray Methods (Cambridge University Press, Cambridge, 2012) pp. 1–311.
- Lechner and Dellago (2008) Wolfgang Lechner and Christoph Dellago, “Accurate determination of crystal structures based on averaged local bond order parameters,” J. Chem. Phys. 129, 114707 (2008).
- Benet et al. (2014c) J. Benet, L. G. MacDowell, and E. Sanz, “Computer simulation study of surface wave dynamics at the crystal–melt interface,” J. Chem. Phys. 141, 034701 (2014c).
- Rozmanov and Kusalik (2011) Dmitri Rozmanov and Peter G. Kusalik, “Temperature dependence of crystal growth of hexagonal ice (ih),” Phys. Chem. Chem. Phys 13, 15501–15511 (2011).
- Conde et al. (2017) M. M. Conde, M. Rovere, and P. Gallo, “High precision determination of the melting points of water tip4p/2005 and water tip4p/ice models by the direct coexistence technique,” The Journal of Chemical Physics 147, 244506 (2017), https://doi.org/10.1063/1.5008478 .
- Bussi et al. (2007) Giovanni Bussi, Davide Donadio, and Michele Parrinello, “Canonical sampling through velocity rescaling,” J. Chem. Phys. 126, 014101 (2007).
- Mastny and de Pablo (2007) Ethan A. Mastny and Juan J. de Pablo, “Melting line of the lennard-jones system, infinite size, and full poten tial,” J. Chem. Phys. 127, 104504 (2007).
- Libbrecht (2014) K. G. Libbrecht, “Towards a comprehensive model of snow crystal growth: 3. the correspondence between ice growth from water vapor and ice growth from liquid water,” arXiv:1407.0740 [cond-mat.mtrl-sci] (2014).
- Murata et al. (2018) Ken-ichiro Murata, Ken Nagashima, and Gen Sazaki, “In situ observations of spiral growth on ice crystal surfaces,” Phys. Rev. Materials 2, 093402 (2018).
- Inomata et al. (2018) Masahiro Inomata, Ken-ichiro Murata, Harutoshi Asakawa, Ken Nagashima, Shunichi Nakatsubo, Yoshinori Furukawa, and Gen Sazaki, “Temperature dependence of the growth kinetics of elementary spiral steps on ice basal faces grown from water vapor,” Cryst. Growth Des. 18, 786–793 (2018), https://doi.org/10.1021/acs.cgd.7b01251 .
- Murata et al. (2019) Ken-ichiro Murata, Ken Nagashima, and Gen Sazaki, “How do ice crystals grow inside quasiliquid layers?” Phys. Rev. Lett. 122, 026102 (2019).
- Beckmann and Lacmann (1982) W. Beckmann and R. Lacmann, “Interface kinetics of the growth and evaporation of ice single crystals from the vapour phase: Ii. measurements in a pure water vapour environment,” J. Cryst. Growth 58, 433–442 (1982).
- Meunier (1987) J. Meunier, “Liquid interfaces: Role of the fluctuations and analysis of ellipsometry and reflectivity measurements,” J. Phys.(Paris) 48, 1819–1831 (1987).
- Mecke and Dietrich (1999) K. R. Mecke and S. Dietrich, “Effective hamiltonian for liquid-vapor interfaces,” Phys. Rev. E 59, 6766–6784 (1999).
- Blokhuis (2009) Edgar M. Blokhuis, “On the spectrum of fluctuations of a liquid surface: From the molecular scale to the macroscopic scale,” J. Chem. Phys. 130, 014706 (2009).
- Espinosa et al. (2016) Jorge R. Espinosa, Carlos Vega, and Eduardo Sanz, “Ice-water interfacial free energy for the tip4p, tip4p/2005, tip4p/ice, and mw models as obtained from the mold integration technique,” J. Phys. Chem. C 120, 8068–8075 (2016), https://doi.org/10.1021/acs.jpcc.5b11221 .
- MacDowell et al. (2013) Luis G. MacDowell, Jorge Benet, and Nebil A. Katcho, “Capillary fluctuations and film-height-dependent surface tension of an adsorbed liquid film,” Phys. Rev. Lett. 111, 047802 (2013).
- MacDowell et al. (2018) Luis G. MacDowell, Pablo Llombart, Jorge Benet, Jose G. Palanco, and Andrés Guerrero-Martinez, “Nanocapillarity and liquid bridge-mediated force between colloidal nanoparticles,” ACS Omega 3, 112–123 (2018), http://dx.doi.org/10.1021/acsomega.7b01650 .
- de Gennes et al. (2004) P. G. de Gennes, F. Brochard-Wyart, and D. Quéré, Capillarity and Wetting Phenomena (Springer, New York, 2004) pp. 1–292.
- Noziéres and Gallet (1987) P. Noziéres and F. Gallet, “The roughening transition of crystal surfaces. i. static and dynamic renormalization theory, crystal shape and facet grwoth,” J. Phys.(Paris) 48, 353–367 (1987).
- Libbrecht and Rickerby (2013) K. G. Libbrecht and M. E. Rickerby, “Meassurements of surface attachment kinetics for faceted ice crystal growth,” J. Cryst. Growth 377, 1–8 (2013).
- Dzyaloshinskii et al. (1961) I. E. Dzyaloshinskii, E. M. Lifshitz, and Lev. P. Pitaevskii, “General theory of van der waals forces,” Soviet Physics Uspekhi 4, 153.175 (1961).
- Parsegian (2006) V. A. Parsegian, Van der Waals Forces (Cambridge University Press, Cambridge, 2006) pp. 1–311.
- Israelachvili (1991) J. N. Israelachvili, Intermolecular and Surfaces Forces, 2nd ed. (Academic Press, London, 1991).
- Limmer (2016) David T. Limmer, “Closer look at the surface of ice,” Proc. Natl. Acad. Sci. U.S.A. 113, 12347–12349 (2016).
- Wilen et al. (1995) L. A. Wilen, J. S. Wettlaufer, M. Elbaum, and M. Schick, “Dispersion-force effects in interfacial premelting of ice,” Phys. Rev. B 52, 12426–12433 (1995).
- Lee and Rick (2012) Alexis J. Lee and Steven W. Rick, “Characterizing charge transfer at water ice interfaces,” J. Phys. Chem. Lett. 3, 3199–3203 (2012), http://dx.doi.org/10.1021/jz301411q .
- Rick and Haymet (2003) S. W. Rick and A. D. J. Haymet, “Dielectric constant and proton order and disorder in ice Ih: Monte Carlo computer simulations,” J. Chem. Phys. 118, 9291–9296 (2003).
- Rick (2005) S. W. Rick, J. Chem. Phys. 122, 094504 (2005).
- Aragones et al. (2011) J. L. Aragones, L. G. MacDowell, J. I. Siepmann, and C. Vega, “Phase diagram of water under an applied electric field,” Phys. Rev. Lett. 107, 155702 (2011).
- Dietrich and Schick (1986) S. Dietrich and M. Schick, “Order of wetting transitions,” Phys. Rev. B 33, 4952–4968 (1986).
- Dietrich and Napiórkowski (1991) S. Dietrich and M. Napiórkowski, “Analytic results for wetting transitions in the presence of van der waals tails,” Phys. Rev. A 43, 1861–1885 (1991).
- Shahidzadeh et al. (1998) N. Shahidzadeh, D. Bonn, K. Ragil, D. Broseta, and J. Meunier, “Sequence of two wetting transitions induced by tuning the hamaker constant,” Phys. Rev. Lett. 80, 3992–3995 (1998).
- Bertrand et al. (2000) E. Bertrand, H. Dobbs, D. Broseta, J. Indekeu, D. Bonn, and J. Meunier, “First–order and critical wetting of alkanes on water,” Phys. Rev. Lett. 85, 1282–1285 (2000).
- Müller et al. (2001) M. Müller, L. G. MacDowell, P. Müller-Buschbaum, O. Wunnike, and M. Stamm, “Nano-dewtting: Interplay between van-der-Waals and short range interactions,” J. Chem. Phys. 115, 9960–9969 (2001).
- MacDowell and Müller (2005) L. G. MacDowell and M. Müller, “Observation of autophobic dewetting on polymer brushes from computer simulation,” J. Phys.: Condens. Matter 17, S3523–S3528 (2005).