Evidence for Disk Truncation at Low Accretion States of the Black Hole Binary
MAXI J1820+070 Observed by NuSTAR and XMM-Newton
Abstract
We present results from NuSTAR and XMM-Newton observations of the new black hole X-ray binary MAXI J1820+070 at low accretion rates (below 1% of the Eddington luminosity). We detect a narrow Fe K emission line, in contrast to the broad and asymmetric Fe K line profiles commonly present in black hole binaries at high accretion rates. The narrow line, with weak relativistic broadening, indicates that the Fe K line is produced at a large disk radius. Fitting with disk reflection models assuming standard disk emissivity finds a large disk truncation radius (a few tens to a few hundreds of gravitational radii, depending on the disk inclination). In addition, we detect a quasi-periodic oscillation (QPO) varying in frequency between mHz and mHz. The very low QPO frequencies suggest a large size for the optically-thin Comptonization region according to the Lense-Thirring precession model, supporting that the accretion disk recedes from the ISCO and is replaced by advection-dominated accretion flow at low accretion rates. We also discuss the possibility of an alternative accretion geometry that the narrow Fe K line is produced by a lamppost corona with a large height illuminating the disk.
Subject headings:
Accretion (14), Black hole physics (159), X-ray binary stars (1811), X-ray transient sources (1852)1. Introduction
Low-mass black hole X-ray binaries contain stellar-remnant black holes accreting from donor stars with a mass of that transfer mass by Roche lobe overflow. Most known Galactic black hole X-ray binaries are low-mass X-ray binaries (LMXBs) and are discovered as transients. These systems exhibit recurrent outbursts on year to decade timescales, during which their flux increases by several orders of magnitude in the optical and X-ray bands (e.g., Corral-Santana et al., 2016). During a typical outburst, lasting for a few months, a black hole binary transitions between different X-ray spectral states, and displays distinct X-ray spectral and timing properties (see Remillard & McClintock, 2006, for a review).
MAXI J1820+070 (=ASASSN-18ey) is a new transient black hole X-ray binary discovered in 2018. The outburst was first reported in optical by the All-Sky Automated Survey for SuperNovae on UT 2018 March 06.58 (ASAS-SN; Tucker et al., 2018), and subsequently in the X-ray band by MAXI a week later (Kawamuro et al., 2018). The source reached a peak X-ray luminosity (2–20 keV) of about 2 Crab, becoming one of the brightest X-ray nova discovered. Its outburst was well covered by multi-wavelength observations from the radio to the gamma-ray band (e.g., Bright et al., 2018; Shidatsu et al., 2018; Paice et al., 2019; Hoang et al., 2019). The distance of MAXI J1820+070 is estimated as kpc or kpc (Atri et al., 2020), and 3.46 kpc (Gandhi et al., 2019) based on different distance priors from the Gaia DR2 parallax (Gaia Collaboration et al., 2018). From radio parallax, the distance is measured to be kpc (Atri et al., 2020). MAXI J1820+070 is recently dynamically confirmed as a black hole binary (BHB) accreting from a K3-5 type donor star with a 0.68 day orbit, and the mass estimate of the central black hole is 7–8 (Torres et al., 2019). Due to its high X-ray flux, MAXI J1820+070 is an ideal new target for the study of the inner accretion flow properties around black holes via X-ray spectral and timing analyses. X-ray timing analysis of NICER observations provides clues about the evolution in the coronal geometry (Kara et al., 2019). NuSTAR observations of MAXI J1820+070 during the bright phases of the hard state display relativistic disk reflection features, including a broad Fe K line that is nearly invariant in the line profile over multiple observations at different fluxes. Detailed modeling of the reflection spectra reveals that the inner edge of the accretion disk remains stable at about 5 gravitational radii, which indicates that the central black hole is likely to have a low spin (Bharali et al., 2019; Buisson et al., 2019). In addition, a low-frequency QPO varying in frequency is detected in MAXI J1820+070 in both optical and X-ray bands (e.g., Yu et al., 2018; Buisson et al., 2019).
Black hole accretion is generally studied in two regimes, cold accretion flows of optically-thick material at high mass accretion rates; and optically-thin hot accretion flows at low accretion rates. The latter is thought to contain an advection-dominated accretion flow (ADAF and its variants, see Yuan & Narayan 2014 for a review). The ADAF model explains the hard X-ray emission from black holes accreting at low accretion rates, e.g., BHBs in quiescence and low/hard states, low luminosity AGNs (LLAGNs), and also Sgr A*. In BHBs, the accretion geometry is deduced to be in the form of an optically-thick accretion disk at large disk radii, which evaporates and is replaced by ADAF close to the black hole (e.g., Esin et al., 1997). The transitional radius, or the truncation radius of the optically-thick accretion disk, is predicted to increase with decreasing accretion rate (e.g., Meyer et al., 2000; Taam et al., 2012).
Observationally, the inner radius of the accretion disk in BHBs can be measured by modeling the strength and temperature of the thermal disk emission component (Zhang et al., 1997), or modeling the profile of Fe K emission line that originates from reflection of hard X-ray photons from the corona by the accretion disk (Fabian et al., 1989). The line profile becomes broad and asymmetric, with an extended red wing originating from the vicinity of the black hole due to combinational effects of Doppler shift, relativistic beaming and gravitational redshift (see Miller, 2007, for a review). Recent observations of several bright BHBs by NuSTAR reveal clearly broad Fe K lines, indicating that the accretion disk extends all the way down to the ISCO in the bright hard state (BHS) (e.g., Miller et al., 2015; Xu et al., 2018a, b; Buisson et al., 2019). In the low hard state (LHS), the detection of a narrow Fe K line, the evidence for disk truncation, is usually hindered by the faintness of the targets, the weakness of the reflection features, and the limited instrumental spectral resolution. So far, narrow Fe K emission has only been convincingly detected in the BHB candidate GX 339–4 from a long Suzaku observation taken in 2008 (Tomsick et al., 2009).
2. Observation and Data Reduction
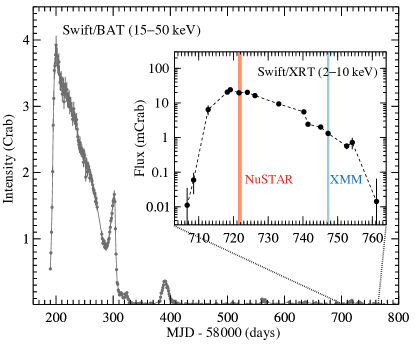
We triggered NuSTAR (Harrison et al., 2013) and XMM-Newton (Jansen et al., 2001) observations of MAXI J1820+070 during the second rebrightening period after the the end of its 2018 main outburst (Xu et al., 2019). During this rebrightening period, the source stayed in the LHS at a low accretion rate (below 1% of the Eddington limit), but reached an X-ray flux level high enough to enable the detection of the Fe K emission line.
We show the time of the NuSTAR and XMM-Newton observations in the Swift/BAT (Barthelmy et al., 2005) and XRT (Burrows et al., 2005) monitoring light curves of MAXI J1820+070, see Figure 1. The Swift/BAT light curve was obtained from the Swift/BAT Hard X-ray Transient Monitor111https://swift.gsfc.nasa.gov/results/transients/ (Krimm et al., 2013). We reduced the Swift/XRT data using xrtpipeline v.0.13.5 with CALDB v20190910. We extracted source spectra from a circular region with a radius of 60″, and the background was extracted from an annulus with inner and outer radii of 160″and 300″. The X-ray flux in 2–10 keV measured by XRT was estimated by fitting the spectra in the energy range of 0.3–10 keV with an absorbed power-law model.
2.1. NuSTAR
NuSTAR observed MAXI J1820+070 on Aug 26, 2019 starting from UT 07:16:09 (ObsID: 90501337002). We reduced the data using NuSTARDAS pipeline v.1.8.0 and CALDB v20191008. The source spectra were extracted from a circular region with the radius of 180″ from the two focal plane modules (FPMA and FPMB). Corresponding background spectra were extracted using polygonal regions from source-free areas. We also extracted spectra from mode 06 data to maximize the available exposure time following the method outlined in Walton et al. (2016). The resulting exposure times are 48.6 ks and 48.4 ks for FPMA and FPMB, respectively. We coadded the FPMA and FPMB spectra using the addspec tool in HEASOFT. The NuSTAR spectra were grouped to have a signal-to-noise ratio (S/N) of at least 10 per bin. We applied barycenter corrections to the event files, transferring the photon arrival times to the barycenter of the solar system using JPL Planetary Ephemeris DE-200, and extracted source light curve from the same region as the energy spectra.
2.2. XMM-Newton
The XMM-Newton observation of MAXI J1820+070 (ObsID: 0851181301) started on September 20, 2019 from UT 22:45:46. Data reduction is performed using the XMM-Newton Science Analysis System v17.0.0 following standard procedures. EPIC-MOS1, MOS2 and EPIC-pn operated in the timing mode, but EPIC-MOS1 experienced full scientific buffer during the whole observation. EPIC-pn (Strüder et al., 2001) is the prime instrument we use due to its large effective area in the Fe K band. The net exposure time of EPIC-pn is 56 ks after filtering out periods of high background flaring activity. The data is free from pile-up effects at a mean count rate of 20 cnts s-1. We selected events with pattern 4 (singles and doubles) and quality flag = 0. The source spectrum and light curve were extracted from the columns of 27 RAWX 47, and the corresponding background was extracted from 58 RAWX 60. We used rmfgen and arfgen to generate the redistribution matrix files and ancillary response files. We grouped the EPIC-pn spectrum to have a minimum S/N of 10 for spectral modeling. The collected source light curve was barycenter corrected using the barycen tool, and corrected for instrumental effects by epiclccorr.
3. Spectral Analysis
In this work, we perform all spectral modeling in XSPEC v12.10.1f (Arnaud, 1996). We use the cross-sections from Verner et al. (1996) and abundances from Wilms et al. (2000) in the TBabs neutral absorption model. All uncertainties are reported at the 90% confidence level unless otherwise clarified. We fit NuSTAR spectra from 3.5–79 keV, and XMM-Newton EPIC-pn spectrum from 0.6–10 keV.
We first model the NuSTAR (=EPOCH 1) and XMM-Newton (=EPOCH 2) spectra with an absorbed power-law model, TBabs*powerlaw, in XSPEC. The NuSTAR and XMM-Newton observations were taken in two epochs separated by 25 days, thus we fit the spectra individually with no linked parameters. We freeze the absorption column density, , at zero when modeling the NuSTAR spectra, as the small amount of absorption towards MAXI J1820+070 does not affect energies above 3 keV.
| Parameter | EPOCH 1 | EPOCH 2 |
|---|---|---|
| Fe K line modeled with Gaussian: TBabs*(powerlaw+gauss) | ||
| () | ||
| EFe (keV) | ||
| (keV) | ||
| EWFe (eV) | ||
| 1173.4/939=1.25 | 1160.3/1124=1.03 | |
| Best-fit model: TBabs*relxill | ||
| () | ||
| (keV) | ||
| (∘) | ||
| () | ||
| log (log []) | ||
| (solar) | ||
| 1033.8/936=1.10 | 1135.4/1121=1.01 | |
| (erg cm-2 s-1) | ||
| (erg s-1) | ||
| (%) | ||
Note. — Fixed parameters are marked with the superscript . In this work, we adopt the distance estimate of 3 kpc and black hole mass estimate of 8 when calculating the source luminosity and Eddington ratio of MAXI J1820+070.
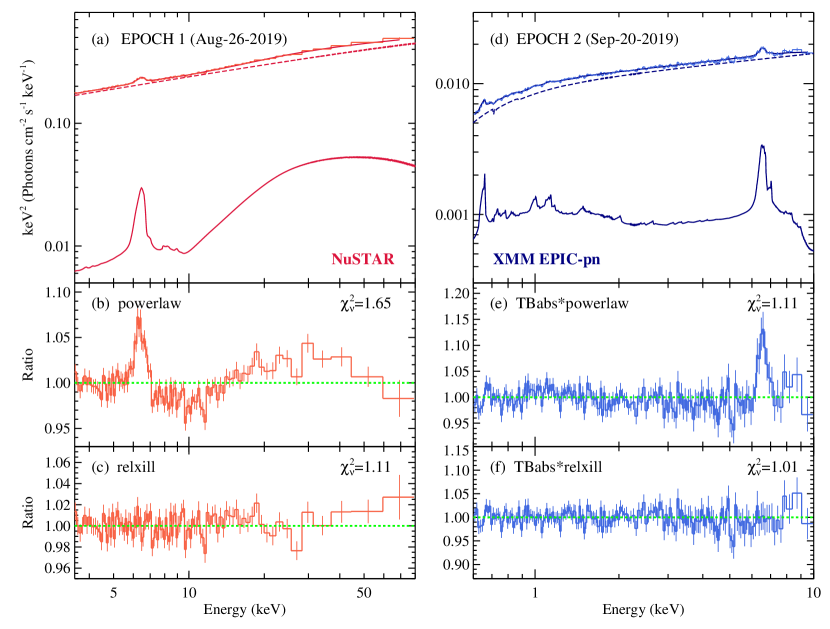
The absorbed power-law model leaves systematic residuals, with a reduced chi-squared of and . Reflection features are evident in the spectral residuals (see Figure 2, panel (b) and (e)): an Fe K emission line is clearly detected by both NuSTAR and XMM-Newton centered around 6.4–6.5 keV, and a Compton reflection hump is evident in the NuSTAR spectra peaking around 30 keV. The prominent Compton reflection hump confirms that the Fe K line originates from reflection by cold optically-thick gas (e.g., Lightman & White, 1988). Accounting for the Fe K line with a Gaussian model improves the fit by for the NuSTAR spectrum, and for XMM-Newton. The best-fit Gaussian model indicates that the Fe K line is narrow, with a line width of keV measured by NuSTAR and keV measured by XMM-Newton, and equivalent width (EW) is constrained to be eV and eV (see Table 1 for details). The line width and EW are significantly smaller than those measured with XMM-Newton EPIC-pn during the BHS ( keV and eV; Kajava et al. 2019). The narrow and symmetric line profile we observe here indicates weak relativistic effects, which is direct evidence for the Fe K line being produced far from the central black hole.
In order to physically model the reflection features, and to get a constraint of the disk truncation radius, we fit the spectra with the relxill relativistic disk reflection model (relxill v1.3.3, Dauser et al. 2014; García et al. 2014). We fix the disk emissivity indices, at 3, the value expected for the outer part of a Shakura & Sunyaev disk (Laor, 1991; Dauser et al., 2013). This is a reasonable assumption, considering that the reflection features are produced at a large distance from the black hole. The emissivity indices cannot be constrained if left free. We fix the black hole spin, , at the default value of 0.998. This parameter is irrelevant here as the inner disk is truncated outside of the ISCO. The outer disk radius, , is fixed at the maximum value of the model at 1000 ( is the gravitational radius). As the majority of the X-ray flux comes from the inner part of the accretion disk, the spectral modeling is not sensitive to . The relxill model includes a coronal illuminating continuum in the shape of a power-law with an exponential cutoff at high energies, parameterized by the power-law index, , and the high energy cutoff, . Other free model parameters are the inner disk radius, , the disk inclination, , the ionization parameter, , the iron abundance, , and the reflection fraction, .
The model, TBabs*relxill in XSPEC notation, describes the data well, leaving no systematic structures in the residuals with and (see Figure 2(c) and (f)). We measure a low absorption column density, cm-2 with XMM-Newton, consistent with the value obtained early-on during the outburst (Shidatsu et al., 2018; Kajava et al., 2019). The spectral continuum is well described by a power-law with a hard photon-index of , with no prominent high energy cutoff required (see Table 1 for best-fit parameters). The observed flux of MAXI J1820+070 in 2–10 keV decreased from erg cm-2 s-1 to erg cm-2 s-1 between EPOCH 1 and EPOCH 2, corresponding to a change in Eddington ratio of % to %. Adding an extra thermal disk component modeled by diskbb does not improve the fit, implying that thermal emission from the accretion disk is either too weak to be detected, or the disk is sufficiently cool that the peak of the disk blackbody distribution moves below the XMM-Newton band.
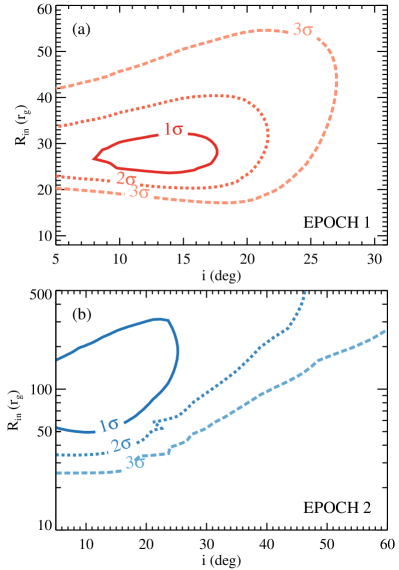
The fitting results indicate that the disk is moderately ionized, with an ionization parameter of log. We measure the truncation radius of the optically-thick accretion disk to be , and . Based on the definition of the ionization parameter222 is defined as , where is the X-ray luminosity, is the distance between the gas and the X-ray source, and is the gas density (hydrogen nucleus density)., we estimate the density of the accretion disk, , at the radius where the Fe K line is generated, decreases from cm-3 to cm-3 from EPOCH 1 to EPOCH 2. The best fit prefers a low inclination angle of the accretion disk, and only upper limits are obtained: and . This is expected given the presence of a narrow Fe K line, as line broadening caused by relativistic effects would become less apparent when the disk is viewed close to face-on (Laor, 1991). and are degenerate, as they are both related to the width of the Fe K line. Without a more complicated line profile like the broad and asymmetric lines detected during the BHS, the two parameters cannot be uniquely constrained. To investigate the correlation between and , we plot the contour in Figure 3. As shown in panel (b), similar to case of GX 339–4 discussed in Tomsick et al. (2009), the model tends to prefer a larger inner disk radius with increasing disk inclination. Therefore, we note that by letting both and vary freely, we are quoting a conservatively small value for the disk truncation radius.
In addition, the best fit leads to a super-solar iron abundance, similar to that found in the BHS (Bharali et al., 2019; Buisson et al., 2019). It is currently uncertain whether the high iron abundance, frequently found when performing spectral modeling with ionized disk reflection models represents the true elemental abundance in the accretion disk, or is an overestimation resulting from physical processes overlooked in the calculation of the reflection models. There is evidence that this issue might be mitigated by using reflection models assuming high disk density (e.g., Tomsick et al., 2018; Jiang et al., 2019). We note that the iron abundance is known to be mostly related to the line strength rather than the line width, thus it is unlikely to have a significant effect on the estimate of the disk truncation radius here.
The best-fit reflection fraction is , significantly lower than that measured in the BHS of BHBs, which often requires a reflection fraction greater than unity. This reflection fraction in the BHS is believed to be enhanced by strong light-bending effects near the black hole (e.g., Miniutti & Fabian, 2004; Reis & Miller, 2013; Xu et al., 2018a, b). The reflection fraction parameter in the relxill model is defined as the ratio of the coronal intensity illuminating the disk to that reaching the observer. The extremely low value we find here in the LHS of MAXI J1820+070 indicates that solid angle extended by the reflector is small, which is consistent with the scenario that the inner accretion disk is significantly truncated.
4. Timing Analysis
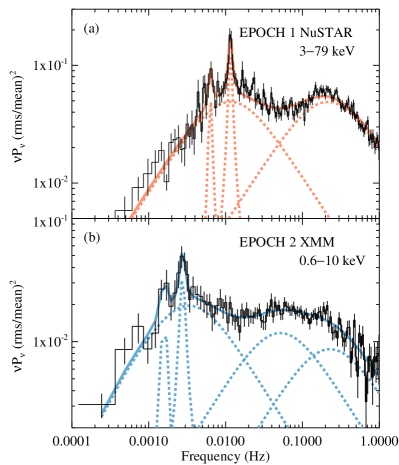
We produced the power spectral density (PSD) from the NuSTAR (EPOCH 1) and XMM-Newton EPIC-pn (EPOCH 2) light curves, in the energy band of 3–79 keV and 0.6–10 keV. The NuSTAR light curves of FPMA and FPMB are added using the lcmath tool in XRONOS. We produce the PSD from light curves with the time bins of 0.5 s, averaged in intervals of bins. The PSD is calculated in the rms normalization using powspec, with white noise subtracted. The NuSTAR and XMM-Newton PSD is geometrically rebinned by a factor of 1.03 and 1.05, respectively, to reach nearly equally spaced frequency bins in logarithmic scale. We fit the PSD in XSPEC with a multi-Lorentzian model using a unity response file: several zero-centered broad Lorentzians for the band-limited noise continuum, one narrow Lorentzian for the QPO and one for its possible sub-harmonic.
As shown in Figure 4, we find a QPO in the NuSTAR and XMM-Newton PSD at the frequency of mHz and mHz, detected at and via the F-test. The QPO has rms variability of % and % in EPOCH 1 and EPOCH 2, respectively. The QPO is detected in the mHz range, lower than the typical frequency range of low-frequency QPOs found in BHBs (0.1–30 Hz). But the shape of the noise continuum and the fact that QPO is located close to the low-frequency break are consistent with type-C QPOs commonly found in BHBs (Belloni & Motta, 2016). The PSD is similar to that detected in MAXI J1820+070 during the BHS (Buisson et al., 2019), only with the QPO and the low-frequency break extending to even lower frequencies in the LHS.
5. Discussion and Conclusion
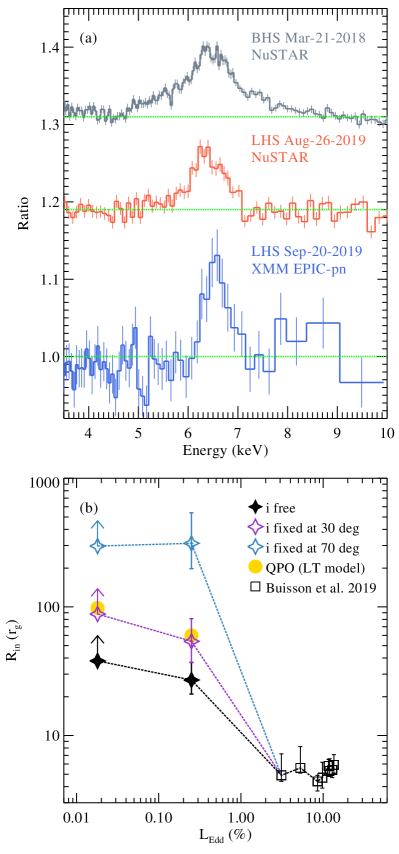
We detect a narrow Fe K emission line with high S/N from NuSTAR and XMM-Newton observations of the black hole X-ray binary MAXI J1820+070 during the second rebrightening period after its 2018 main outburst. The X-ray spectral and timing properties indicate that the source was in the LHS during the time of the observations. Spectral modeling reveals a very low absorption column density, combined with the moderate ionization state of the reflection material, confirming that the Fe K line is produced from reflection by the accretion disk rather than that by torus-like Compton thick obscuring material commonly found in AGNs (Hickox & Alexander, 2018) and in the BHB V404 Cygni (Motta et al., 2017). The line is visibly narrow and lacks significant relativistic broadening, in contrast to the broad line profile observed during the BHS (see Figure 5(a) for a comparison of the line profile333We choose the representative Fe K line profile of MAXI J1820+070 in the BHS from the NuSTAR observation on March 21, 2018 (ObsID: 90401309006), detailed analysis of this dataset is published in Buisson et al. 2019.), providing direct evidence for significant truncation of the inner accretion disk at low accretion rates in a BHB.
There are disparities in the literature about the estimate of the disk inclination in MAXI J1820+070. X-ray dips were observed during early phases of the outburst (Kajava et al., 2019), and a sharp increase in the H emission line EW was reported and interpreted as a grazing eclipse of the accretion disk (Torres et al., 2019), suggesting a high inclination of for the outer part of the accretion disk. We note that the inclination of this system is also unlikely to be very low (e.g, ) because radial velocity (RV) measurements are significant in amplitude (Torres et al., 2019). The measured jet inclination angle of also indicates that the system is viewed at high inclination (Atri et al., 2020). In contrast, modeling the relativistic reflection spectra during the BHS yields a low inclination of for the inner part of the accretion disk (Buisson et al., 2019; Bharali et al., 2019). If both inclination estimates are robust, this implies a strong disk warp of . Our spectral fitting of the narrow Fe K line in the LHS also prefers a very low inclination. However, as discussed above, it is expected for the spectral modeling to bias towards low inclinations in the presence of a narrow line profile. Without strong relativistic distortion effects, the inclination is poorly constrained as only upper limits are obtained. Therefore, we tried fitting the spectra with a fixed disk inclination angle instead, and still assuming a disk emissivity index of . This results in a larger disk truncation radius and slightly degraded quality of the fits: when is frozen at 30∘, we get and with and ; when is fixed at , the constraint on the inner disk radius becomes and with and . These fits, although statistically slightly worse, leave no clear residuals with physical implications, thus may still be considered acceptable within calibration uncertainties.
There have been a number of observational campaigns aiming at investigating the evolution of the inner disk radius with the accretion rate in BHBs via the reflection method (e.g., Petrucci et al., 2014; Fürst et al., 2016). However, the results are often poorly constrained or highly model dependent due to low statistics, especially at low flux states. In this work, we find evidence for a large inner disk radius in MAXI J1820+070 at low accretion rates (a few tens to a few hundreds of , depending on the disk inclination). Combined with earlier measurements during the BHS by NuSTAR (Buisson et al., 2019; Bharali et al., 2019), it suggests that the inner edge of the accretion disk remains stable around the ISCO when the accretion rate is high, and starts to recede from the ISCO as the luminosity drops below % of the Eddington luminosity (see Figure 5(b)). The critical accretion rate when significant disk truncation occurs is consistent with that measured in the well studied source GX 339–4 via the reflection method (Tomsick et al., 2009), and that found based on the study of several BHBs by systematically modeling their thermal disk components (Cabanac et al., 2009). In terms of the disk recessing with accretion rate, the results agree well with the theoretical prediction that the inner part of accretion disk becomes replaced by ADAF at low accretion rates (¡ 1% of the Eddington limit; Esin et al. 1997, although the model predicts that the optically-thick accretion disk should be truncated in all hard states.
In addition, we a detected QPO at mHz and mHz. The QPO and low-frequency break are found at lower frequencies than those in the BHS. Qualitatively, the longer time scales imply a physically larger size for the hot optically-thin Comptonization regions around black holes, where the QPO is believed to be generated. In the propagating mass accretion rate fluctuations model, the low-frequency break marks the viscous timescale at the outer edge of the Comptonization region (e.g., Ingram & Done, 2010; Ingram & van der Klis, 2013). There have been various theoretical models put forward to explain the low-frequency QPOs in BHBs, but the exact mechanism is still highly uncertain. One of the currently promising models is the Lense-Thirring (LT) precession model. Adopting the simplified assumption that the QPO is caused by the effect of the Lense–Thirring precession of a test particle orbiting a spinning black hole at the disk truncation radius (Motta et al., 2018), we calculate the inner disk radius inferred from the QPO frequencies using the black hole mass of 8 and the spin of . This leads to the characteristic truncation radius of and . As a crude estimate, these are broadly similar to the spectral modeling results, in support of the inner accretion disk being significantly truncated in the LHS. During the BHS, however, we note that there is usually disagreement in the measurements from the two methods (e.g., Fürst et al., 2016; Xu et al., 2017; Buisson et al., 2019), especially, Buisson et al. (2019) find that the QPO frequency and the disc inner radius are not connected. As discussed in Ingram & Done (2011), it is possible that the discrepancy is related to physical complexities currently not well understood and thus not included in the QPO models, or complexities related to intrinsic properties of the corona.
Additional uncertainties in the measurement of the inner disk radius come from the poorly known nature of the corona, which affects the illumination pattern of disk (Fabian et al., 2014). During the above analysis, we assume the disk emissivity of (), which is expected for a standard accretion disk in the Newtonian regime. An alternative explanation for the narrow Fe K line that does not involve disk truncation is a low disk emissivity index (), so that most of the contribution to the reflection features come from the outer disk. One possible accretion geometry that yields such a low emissivity index is a large lamppost height for the corona, which is believed to be associated with the base of a jet (Dauser et al., 2013). The emissivity expected for a lamppost geometry in Newtonian gravity is for , and for (Vaughan et al., 2004). The spectra can be equally well fitted by the reflection model assuming a lamppost geometry, relxilllp, with a lamppost height of and , without the need to invoke disk truncation. But the model cannot self-consistently explain the low reflection fraction, unless significant beaming away from the accretion disk is involved. For a reflection fraction of , it requires bulk motion with a Lorentz factor of when viewed at the inclination of 30∘, and at the inclination of 60∘ (Beloborodov, 1999). It is uncertain whether strong beaming and the accretion geometry of a compact corona with a large lamppost height above the accretion disk are realistic descriptions of the system. There is evidence that significant beaming is absent in X-ray emission of BHBs in the LHS (Narayan & McClintock, 2005). Although the case at low accretion rates is less clear, previous successful applications of the lamppost model to X-ray spectra of bright BHBs and AGNs measures a low lamppost height of , or a steep disk emissivity profile (Fabian et al., 2015). Thus the physical implications of such a large lamppost height or low emissivity index required by the spectral fitting here are currently unclear and requires further investigation. The extended disk-corona model and the lamppost corona model are two competing coronal geometries that have been proposed (Chauvin et al., 2018). The QPO frequency and low-frequency break in the PSD suggest that a physically large size for the Comptonization region, consistent with the extended corona and receding accretion disk scenario. The inner disk being truncated at a large radius also naturally explains the non-detection of any thermal disk emission. Disk truncation provides a straightforward and physically reasonable explanation for the narrow Fe K line we detected in MAXI J1820+070. However, we note that an alternative accretion geometry of a high lamppost corona cannot be ruled out by our dataset and may also be plausible.
References
- Arnaud (1996) Arnaud, K. A. 1996, in Astronomical Society of the Pacific Conference Series, Vol. 101, Astronomical Data Analysis Software and Systems V, ed. G. H. Jacoby & J. Barnes, 17
- Atri et al. (2020) Atri, P., Miller-Jones, J. C. A., Bahramian, A., et al. 2020, MNRAS, 493, L81
- Barthelmy et al. (2005) Barthelmy, S. D., Barbier, L. M., Cummings, J. R., et al. 2005, Space Sci. Rev., 120, 143
- Belloni & Motta (2016) Belloni, T. M., & Motta, S. E. 2016, Astrophysics and Space Science Library, Vol. 440, Transient Black Hole Binaries, ed. C. Bambi, 61
- Beloborodov (1999) Beloborodov, A. M. 1999, ApJ, 510, L123
- Bharali et al. (2019) Bharali, P., Chauhan, J., & Boruah, K. 2019, MNRAS, 487, 5946
- Bright et al. (2018) Bright, J., Fender, R., & Motta, S. 2018, The Astronomer’s Telegram, 11420, 1
- Buisson et al. (2019) Buisson, D. J. K., Fabian, A. C., Barret, D., et al. 2019, MNRAS, 490, 1350
- Burrows et al. (2005) Burrows, D. N., Hill, J. E., Nousek, J. A., et al. 2005, Space Sci. Rev., 120, 165
- Cabanac et al. (2009) Cabanac, C., Fender, R. P., Dunn, R. J. H., & Körding, E. G. 2009, MNRAS, 396, 1415
- Chauvin et al. (2018) Chauvin, M., Florén, H. G., Friis, M., et al. 2018, Nature Astronomy, 2, 652
- Corral-Santana et al. (2016) Corral-Santana, J. M., Casares, J., Muñoz-Darias, T., et al. 2016, A&A, 587, A61
- Dauser et al. (2014) Dauser, T., García, J., Parker, M. L., Fabian, A. C., & Wilms, J. 2014, MNRAS, 444, L100
- Dauser et al. (2013) Dauser, T., Garcia, J., Wilms, J., et al. 2013, MNRAS, 430, 1694
- Esin et al. (1997) Esin, A. A., McClintock, J. E., & Narayan, R. 1997, ApJ, 489, 865
- Fabian et al. (2015) Fabian, A. C., Lohfink, A., Kara, E., et al. 2015, MNRAS, 451, 4375
- Fabian et al. (2014) Fabian, A. C., Parker, M. L., Wilkins, D. R., et al. 2014, MNRAS, 439, 2307
- Fabian et al. (1989) Fabian, A. C., Rees, M. J., Stella, L., & White, N. E. 1989, MNRAS, 238, 729
- Fürst et al. (2016) Fürst, F., Tomsick, J. A., Yamaoka, K., et al. 2016, ApJ, 832, 115
- Gaia Collaboration et al. (2018) Gaia Collaboration, Brown, A. G. A., Vallenari, A., et al. 2018, A&A, 616, A1
- Gandhi et al. (2019) Gandhi, P., Rao, A., Johnson, M. A. C., Paice, J. A., & Maccarone, T. J. 2019, MNRAS, 485, 2642
- García et al. (2014) García, J. A., Dauser, T., Lohfink, A., et al. 2014, ApJ, 782, 76
- Harrison et al. (2013) Harrison, F. A., Craig, W. W., Christensen, F. E., et al. 2013, ApJ, 770, 103
- Hickox & Alexander (2018) Hickox, R. C., & Alexander, D. M. 2018, ARA&A, 56, 625
- Hoang et al. (2019) Hoang, J., Molina, E., Lopez, M., et al. 2019, in International Cosmic Ray Conference, Vol. 36, 36th International Cosmic Ray Conference (ICRC2019), 696
- Ingram & Done (2010) Ingram, A., & Done, C. 2010, MNRAS, 405, 2447
- Ingram & Done (2011) —. 2011, MNRAS, 415, 2323
- Ingram & van der Klis (2013) Ingram, A., & van der Klis, M. 2013, MNRAS, 434, 1476
- Jansen et al. (2001) Jansen, F., Lumb, D., Altieri, B., et al. 2001, A&A, 365, L1
- Jiang et al. (2019) Jiang, J., Fabian, A. C., Wang, J., et al. 2019, MNRAS, 484, 1972
- Kajava et al. (2019) Kajava, J. J. E., Motta, S. E., Sanna, A., et al. 2019, MNRAS, 488, L18
- Kara et al. (2019) Kara, E., Steiner, J. F., Fabian, A. C., et al. 2019, Nature, 565, 198
- Kawamuro et al. (2018) Kawamuro, T., Negoro, H., Yoneyama, T., et al. 2018, The Astronomer’s Telegram, 11399
- Krimm et al. (2013) Krimm, H. A., Holland, S. T., Corbet, R. H. D., et al. 2013, ApJS, 209, 14
- Laor (1991) Laor, A. 1991, ApJ, 376, 90
- Lightman & White (1988) Lightman, A. P., & White, T. R. 1988, ApJ, 335, 57
- Meyer et al. (2000) Meyer, F., Liu, B. F., & Meyer-Hofmeister, E. 2000, A&A, 361, 175
- Miller (2007) Miller, J. M. 2007, ARA&A, 45, 441
- Miller et al. (2015) Miller, J. M., Tomsick, J. A., Bachetti, M., et al. 2015, ApJ, 799, L6
- Miniutti & Fabian (2004) Miniutti, G., & Fabian, A. C. 2004, MNRAS, 349, 1435
- Motta et al. (2018) Motta, S. E., Franchini, A., Lodato, G., & Mastroserio, G. 2018, MNRAS, 473, 431
- Motta et al. (2017) Motta, S. E., Kajava, J. J. E., Sánchez-Fernández, C., Giustini, M., & Kuulkers, E. 2017, MNRAS, 468, 981
- Narayan & McClintock (2005) Narayan, R., & McClintock, J. E. 2005, ApJ, 623, 1017
- Paice et al. (2019) Paice, J. A., Gandhi, P., Shahbaz, T., et al. 2019, MNRAS, 490, L62
- Petrucci et al. (2014) Petrucci, P. O., Cabanac, C., Corbel, S., Koerding, E., & Fender, R. 2014, A&A, 564, A37
- Reis & Miller (2013) Reis, R. C., & Miller, J. M. 2013, ApJ, 769, L7
- Remillard & McClintock (2006) Remillard, R. A., & McClintock, J. E. 2006, ARA&A, 44, 49
- Shidatsu et al. (2018) Shidatsu, M., Nakahira, S., Yamada, S., et al. 2018, ApJ, 868, 54
- Strüder et al. (2001) Strüder, L., Briel, U., Dennerl, K., et al. 2001, A&A, 365, L18
- Taam et al. (2012) Taam, R. E., Liu, B. F., Yuan, W., & Qiao, E. 2012, ApJ, 759, 65
- Tomsick et al. (2009) Tomsick, J. A., Yamaoka, K., Corbel, S., et al. 2009, ApJ, 707, L87
- Tomsick et al. (2018) Tomsick, J. A., Parker, M. L., García, J. A., et al. 2018, ApJ, 855, 3
- Torres et al. (2019) Torres, M. A. P., Casares, J., Jiménez-Ibarra, F., et al. 2019, ApJ, 882, L21
- Tucker et al. (2018) Tucker, M. A., Shappee, B. J., Holoien, T. W. S., et al. 2018, ApJ, 867, L9
- Vaughan et al. (2004) Vaughan, S., Fabian, A. C., Ballantyne, D. R., et al. 2004, MNRAS, 351, 193
- Verner et al. (1996) Verner, D. A., Ferland, G. J., Korista, K. T., & Yakovlev, D. G. 1996, ApJ, 465, 487
- Walton et al. (2016) Walton, D. J., Tomsick, J. A., Madsen, K. K., et al. 2016, ApJ, 826, 87
- Wilms et al. (2000) Wilms, J., Allen, A., & McCray, R. 2000, ApJ, 542, 914
- Xu et al. (2019) Xu, Y., Harrison, F., & Tomsick, J. 2019, The Astronomer’s Telegram, 13025, 1
- Xu et al. (2017) Xu, Y., García, J. A., Fürst, F., et al. 2017, ApJ, 851, 103
- Xu et al. (2018a) Xu, Y., Harrison, F. A., García, J. A., et al. 2018a, ApJ, 852, L34
- Xu et al. (2018b) Xu, Y., Harrison, F. A., Kennea, J. A., et al. 2018b, ApJ, 865, 18
- Yu et al. (2018) Yu, W., Zhang, J., Yan, Z., Wang, X., & Bai, J. 2018, The Astronomer’s Telegram, 11510, 1
- Yuan & Narayan (2014) Yuan, F., & Narayan, R. 2014, ARA&A, 52, 529
- Zhang et al. (1997) Zhang, S. N., Cui, W., & Chen, W. 1997, ApJ, 482, L155