22institutetext: Ruprecht-Karls-Universität, Grabengasse 1, 69117 Heidelberg, Germany
33institutetext: INAF, Osservatorio Astronomico di Trieste, Via G.B. Tiepolo 11, I-34143 Trieste, Italy
44institutetext: IFPU - Institute for Fundamental Physics of the Universe, Via Beirut 2, 34014 Trieste, Italy
55institutetext: The University of New South Wales, School of Science, Australian Defence Force Academy, Northcott Drive, Canberra 2600, Australia
66institutetext: Department of Astrophysics/IMAPP, Radboud University, Heyendaalseweg 135, 6525 AJ Nijmegen, The Netherlands
77institutetext: LUPM, UMR 5299, Université de Montpellier, CNRS, 34095 Montpellier, France
Observational constraints on the origin of the elements
The abundance ratios of manganese to iron in late-type stars across a wide metallicity range place tight constraints on the astrophysical production sites of Fe-group elements. In this work, we investigate the chemical evolution of Mn in the Milky Way galaxy using high-resolution spectroscopic observations of stars in the Galactic disc and halo stars, as well as a sample of globular clusters. Our analysis shows that local thermodynamic equilibrium (LTE) leads to a strong imbalance in the ionisation equilibrium of Mn I and Mn II lines. Mn I produces systematically (up to 0.6 dex) lower abundances compared to the Mn II lines. Non-local thermodynamic equilibrium (NLTE) radiative transfer satisfies the ionisation equilibrium across the entire metallicity range, , leading to consistent abundances from both ionisation stages of the element. We compare the NLTE abundances with Galactic Chemical Evolution models computed using different sources of type Ia and type II supernova (SN Ia and SN II) yields. We find that a good fit to our observations can be obtained by assuming that a significant () fraction of SNe Ia stem from a sub-Chandrasekhar (sub-) channel. While this fraction is larger than that found in earlier studies (), we note that we still require near- SNe Ia to obtain solar [Mn/Fe] at [Fe/H] . Our new data also suggest higher SN II Mn yields at low metallicity than typically assumed in the literature.
Key Words.:
Stars: abundances – Galaxy: abundances – Supernovae: general – Nuclear reactions, nucleosynthesis, abundances1 Introduction
Manganese is one of the key Fe-group elements that have been extensively studied in the astronomical literature. It has only one stable isotope, 55Mn, which is neutron rich (odd-Z), and its cosmic production is thought to be predominantly associated with type Ia supernovae (SNe Ia). Therefore, the evolution of Mn relative to Fe in the Galactic stars is a powerful probe of the epoch when SNe Ia started contributing to the chemical enrichment and, therefore, of star formation history of the Galactic populations (e.g. Nomoto et al. 2013; McWilliam 2016; Barbuy et al. 2018).
For SNe Ia, there are two main channels discussed in the literature. The first is a single-degenerate (SD) channel (Whelan & Iben 1973), in which a white dwarf (WD) accretes material from another star in a binary system and approaches the Chandrasekhar mass (hereafter, near-). The second, so-called sub/super- channel involves two possible scenarios (Iben & Tutukov 1984; Maoz et al. 2014; Levanon et al. 2015; Rebassa-Mansergas et al. 2019). In a close binary system with an initial separation of a few Earth radii, a less massive WD can merge with another WD due to the emission of gravitational waves following a common envelope phase, producing a violent merger in a double-degenerate (DD) system (Iben & Tutukov 1984; Pakmor et al. 2012). Alternatively, the WD obtains He from the companion that eventually triggers a double detonation, first in the outer He layer and subsequently in the CO core, which liberates enough energy to unbind the star; this system can be either SD or DD (e.g. Livne 1990; Fink et al. 2010; Shen et al. 2018; Goldstein & Kasen 2018). Also, a scenario in which two WDs collide due to the Lidov-Kozai mechanism has been proposed (Katz & Dong 2012; Kushnir et al. 2013), although the frequency of the collisions is still debated (Toonen et al. 2018).
There are arguments (e.g. Ruiter et al. 2009; Gilfanov & Bogdán 2010; Shappee et al. 2013; Goldstein & Kasen 2018; Kuuttila et al. 2019; Flörs et al. 2019) supporting the idea that a large fraction of SNe Ia follow from a sub- channel. In this context, both double detonation through He-mass transfer (as SD or DD) and violent merger DD channels are considered as viable. On the other hand, recent X-ray observations of the hot intra-cluster medium (e.g. Mernier et al. 2016; Hitomi Collaboration et al. 2017) and SN Ia light curve properties (Scalzo et al. 2014, 2019) call for a sizeable contribution from near- SNe Ia.
Despite major differences in the explosion physics and progenitor scenarios, different SN Ia channels generally produce relatively similar chemical abundance distributions in explosive nucleosynthesis, with a few exceptions, such as Mn (Seitenzahl et al. 2013). Mn is produced in enhanced, that is, super-solar [Mn/Fe] amounts in normal freeze-out from nuclear statistical equilibrium (NSE), where low entropy prevents the conversion of its parent nucleus 55Co by (p,)-reactions to 56Ni (Jordan et al. 2003). The physical conditions for this low-entropy freeze-out regime require high nuclear fuel densities, in excess of g cm-3 (Thielemann et al. 1986). From the diverse list of explosion models for normal SNe Ia, only near- SD explosion models have sufficiently high fuel densities to allow large production of Mn (e.g. Hillebrandt et al. 2013; Seitenzahl & Townsley 2017). The high Mn yield of near- SNe Ia coupled with core-collapse (CC) type II SNe yields for Fe and Mn may therefore produce a characteristic upturn in the chemical evolution trend of [Mn/Fe] versus [Fe/H] in stellar populations of the Milky Way or in other galaxies. On the other hand, the absence of such an upturn may signify the importance of sub- and super- systems in Galactic Chemical Evolution (GCE). This picture is generally accepted but only qualitatively correct, as it depends, among other parameters, such as the detailed star formation history of the halo and disc, on the details of SN explosion models. For example, the higher metallicity sub- model of Shen et al. (2018) produces super-solar [Mn/Fe] at the low-mass end () of the WD mass distribution, although these events would be too faint to explain spectroscopically normal SNe Ia, which are expected to constitute the dominant SN Ia channel. Nevertheless, this qualitative argument has commonly been employed in the literature to explore the contribution of different SN Ia types to enrichment of Fe-peak elements in different stellar populations (e.g. Kirby et al. 2019; Kobayashi et al. 2019; de los Reyes et al. 2020).
In recent years, several studies have investigated [Mn/Fe] abundance ratios in the Galactic stars (e.g. Spite et al. 2013; Battistini & Bensby 2015; Mishenina et al. 2015). Local Thermodynamic Equilibrium (LTE) models suggest that the [Mn/Fe] ratio is highly sub-solar in low-metallicity stars (Bonifacio et al. 2009; Mishenina et al. 2015), dropping to [Mn/Fe] dex at [Fe/H] . However, evidence for departures from LTE stems from the strong excitation imbalance (Cayrel et al. 2004; Bergemann & Gehren 2008; Spite et al. 2013), as well as from a significant systematic difference between the Mn abundances measured in turn-off stars and in red giants in the same Galactic population (Bonifacio et al. 2009). Detailed NLTE studies show that Mn i lines are severely affected by NLTE effects. In particular, Bergemann & Gehren (2008) showed that a strong depletion of [Mn/Fe] in metal-poor stars is a bias caused by assumption of LTE, and the NLTE trend of [Mn/Fe] is close to solar in the [Fe/H] range from to .
This is the third paper in our series of studies (Bergemann et al. 2019; Gallagher et al. 2019), in which we aim to provide robust observational constraints on the origins of elements and their detailed chemical evolution in the Galaxy. In this paper, we use our new methods to determine Mn abundances in Galactic stars across a wide metallicity range, , in order to place constraints on SN Ia progenitors and their explosion mechanism. We follow the methods developed in (Bergemann et al. 2019; hereafter, Paper 1). The structure of the paper is as follows. In Sect. 2, we describe the observed spectra and their reduction. Section 3 outlines the methods of the abundance analysis and the main results are summarised in Sect. 4. In particular, we discuss our findings in the context of nucleosynthesis of Mn, its chemical evolution in the Galaxy, and constraints on the progenitors and explosion mechanism of SN Ia systems.
2 Observations
2.1 Main stellar sample
The goals of our study place certain requirements on the properties of the observed sample of stars. Firstly, understanding the chemical evolution of the Galaxy requires a broad metallicity coverage to probe the halo and disc regimes. Secondly, systematic uncertainties, which are the dominant source of error in abundance analyses, must be understood. With one caveat (see section 3.2), the ionisation balance method is a powerful technique to test for such biases. The abundances derived from the lines of neutral species are compared with those obtained from the lines of singly ionised species. Once the surface gravity of a star is fixed using a model-independent method, such as astrometry, the consistency of abundances derived from two ionisation stages represents a powerful diagnostic of the accuracy of abundances. In the case of Mn, the diagnostic lines of Mn i are located in the optical wavelength range, whereas useful Mn ii features are found in the near-UV, such as the 3488 Å line. Therefore, we need spectra covering the entire wavelength window from the near-UV to optical. Owing to extreme line blending in the near-UV, high-resolution, high signal-to-noise ratio (SN) spectra are needed to allow a careful de-blending of the diagnostic absorption features. In addition, stellar parameters must be determined very accurately, employing consistent methods, and validated on detailed NLTE calculations.
| star | vmic | ||||||
|---|---|---|---|---|---|---|---|
| K | dex | km/s | LTE | NLTE | source | ||
| Dwarfs | |||||||
| HD 3567 | 6035 | 4.08 | -1.29 | 1.5 | -0.43 | -0.29 | c |
| HD 6582 | 5387 | 4.45 | -0.83 | 0.9 | -0.21 | -0.13 | a |
| HD 19445 | 5982 | 4.38 | -2.10 | 1.4 | -0.40 | -0.21 | c |
| HD 22879 | 5792 | 4.30 | -0.95 | 1.2 | -0.24 | -0.15 | c |
| HD 84937 | 6350 | 4.10 | -2.15 | 1.4 | -0.34 | -0.16 | b |
| HD 106038 | 5950 | 4.33 | -1.45 | 1.1 | -0.22∗/-0.4 | -0.15 | c |
| HD 121004 | 5711 | 4.46 | -0.71 | 0.7 | 0.28∗ | 0.23 | c |
| HD 122196 | 6048 | 3.89 | -1.75 | 1.2 | -0.45 | -0.28 | c |
| BD 133442 | 6450 | 4.42 | -2.47 | 1.5 | -0.38∗ | -0.32 | c |
| HD 134169 | 5930 | 3.98 | -0.86 | 1.8 | -0.21 | -0.10 | a |
| HD 140283 | 5777 | 3.70 | -2.38 | 1.3 | -0.51 | -0.21 | b,c |
| HD 142267 | 5807 | 4.42 | -0.46 | 1.0 | -0.17 | -0.10 | a |
| HD 144061 | 5815 | 4.44 | -0.31 | 1.2 | -0.01 | 0.04 | a |
| HD 148816 | 5880 | 4.07 | -0.78 | 1.2 | -0.32 | -0.22 | a |
| HD 157466 | 5990 | 4.38 | -0.44 | 1.1 | -0.23 | -0.15 | a |
| HD 158226 | 5805 | 4.12 | -0.56 | 1.1 | -0.18 | -0.09 | a |
| HD 160693 | 5850 | 4.31 | -0.60 | 1.2 | -0.18 | -0.09 | a |
| HD 160933 | 5765 | 3.85 | -0.27 | 1.2 | -0.24 | -0.15 | a |
| HD 170357 | 5665 | 4.07 | -0.50 | 1.2 | -0.24 | -0.14 | a |
| HD 171620 | 6115 | 4.20 | -0.50 | 1.4 | -0.17 | -0.08 | a |
| HD 182807 | 6100 | 4.21 | -0.33 | 1.4 | -0.13 | -0.05 | a |
| HD 184448 | 5765 | 4.16 | -0.43 | 1.2 | 0.01 | 0.07 | a,c |
| HD 186379 | 5865 | 3.93 | -0.41 | 1.2 | -0.20 | -0.10 | a |
| HD 198300 | 5890 | 4.31 | -0.60 | 1.2 | -0.04 | 0.04 | a |
| HD 200580 | 5940 | 3.96 | -0.82 | 1.4 | 0.09 | 0.19 | a |
| HD 204155 | 5815 | 4.09 | -0.66 | 1.2 | -0.34 | -0.21 | a |
| HD 208906 | 6025 | 4.37 | -0.76 | 1.4 | -0.22 | -0.11 | a |
| HD 215257 | 6030 | 4.28 | -0.58 | 1.4 | -0.26 | -0.15 | a |
| HD 218209 | 5665 | 4.40 | -0.60 | 1.1 | -0.05 | 0.04 | a |
| HD 221876 | 5865 | 4.29 | -0.60 | 1.2 | -0.32 | -0.22 | a |
| HD 224930 | 5480 | 4.45 | -0.66 | 0.9 | -0.33 | -0.24 | a |
| G 64-12 | 6464 | 4.30 | -3.12 | 1.5 | -0.40∗ | -0.32 | b,c |
| Giants | |||||||
| HD 74462 | 4590 | 1.98 | -1.43 | 1.1 | -0.36 | -0.07 | c |
| HD 115444 | 4785 | 1.71 | -2.87 | 2.1 | -0.75 | -0.36 | d |
| HD 122563 | 4665 | 1.65 | -2.50 | 1.8 | -0.71 | -0.22 | b,c |
| HD 126238 | 4900 | 2.02 | -1.85 | 1.5 | -0.45 | -0.14 | c |
| HD 126587 | 4950 | 2.36 | -2.86 | 1.7 | -0.70 | -0.27 | c |
| HD 128279 | 5200 | 1.73 | -2.13 | 1.3 | -0.55∗ | -0.52 | d |
| HD 175305 | 5100 | 2.70 | -1.34 | 1.2 | -0.23 | 0.02 | c |
| HD 186478 | 4730 | 1.56 | -2.33 | 1.8 | -0.53 | -0.21 | d |
| BD +541323 | 5213 | 2.20 | -1.55 | 1.5 | -0.55 | -0.25 | d |
| HE 0315+0000 | 5050 | 2.47 | -2.67 | 1.6 | -0.55 | -0.11 | c |
| a: Gehren et al. (2004), b: Bergemann et al. (2012), c: Hansen et al. (2013), d: Hansen et al. (2012); Hansen & Primas (2011) | |||||||
With these considerations in mind, we compiled our stellar sample from several sources, including Gehren et al. (2004), Bergemann et al. (2012), Hansen & Primas (2011), Hansen et al. (2012), and Hansen et al. (2013), to cover a broad range in metallicity, from to solar (Table 1). The sample comprises 42 stars. Only 10 of them are red giants, but most stars are FG dwarfs. The spectra of 10 stars in the sample were taken with the UVES spectrograph on the ESO Very Large Telescope (VLT, Dekker et al. 2000) between 2000 and 2002 with high- resolution and high-SN per pixel at 3200 Å. These spectra cover a broad wavelength range from 3050 to 6800 Å with a few gaps owing to the various settings of the spectrograph. Another 8 stars were observed at high resolution with HIRES/Keck. For further details of these spectra we refer to Hansen & Primas (2011) and Hansen et al. (2012, 2013). For the remaining 24 stars, we used the high-quality FOCES data (see e.g. Gehren et al. 2004, for more details ). These spectra have a resolving power of and a typical SN at 6000 Å (Gehren et al. 2004, 2006). The spectra of HD 84937, HD 122563, and HD 140283 were taken from the UVES-POP database (Bagnulo et al. 2003).
Stellar parameters of the chosen stars were adopted from the aforementioned studies. The and rely on photometry and astrometry. Metallicity and micro-turbulence values were computed using NLTE analysis of Fe I and Fe II lines (Bergemann et al. 2012; Hansen et al. 2013). The metallicities of stars adopted from the sample of Gehren et al. (2004, 2006) rely on the LTE analysis of Fe II lines, but LTE is a reliable assumption for the lines of singly ionised iron (e.g. Bergemann et al. 2012; Lind et al. 2012, 2017). Finally, four stars (HD 115444, HD 128279, HD 186478, BD) have metallicities based on LTE Fe abundances. We include them in the LTE analysis of [Mn/Fe], but do not use them in the NLTE calculations.
2.2 Additional datasets
To complement our sample at low metallicity, we add 19 metal-poor main-sequence stars from Bonifacio et al. (2009), who provide metallicities and Mn abundances measured assuming LTE. However, we correct this sample for NLTE, using the abundance corrections determined as described in Section 3.1.
In addition, we include [Mn/Fe] abundances for seven Galactic globular clusters, obtained from integrated-light observations with UVES at VLT (Larsen et al. 2017) and 15 extragalactic GCs observed with UVES and with HIRES on the Keck I telescope (Larsen et al. 2018). These abundance measurements were made by fitting custom-computed simple stellar population models to the integrated-light spectra, adjusting the input abundances in the models until the best fits to the data were obtained. The synthetic spectra used in these latter models were computed with the ATLAS9 and SYNTHE codes (Sbordone et al. 2004; Kurucz 2005). Abundances for Mn were measured from fits to two spectral windows, from 4750 to 4790 Å and 6010 to 6030 Å. For further details we refer to Larsen et al. (2017). The NLTE corrections for the integrated light were computed as described in our recent study (Eitner et al. 2019).
3 Methods
3.1 Determination of Mn abundances
The Mn abundances are computed as follows. For most stars in the sample, we first use the MOOG code (Sneden et al. 2016, version 2014) to obtain LTE abundances via spectrum synthesis and then we correct these estimates for NLTE effects. MARCS model atmospheres (Gustafsson et al. 2008) are employed. The MOOG code is capable of synthesising larger wavelength regions, which is needed in crowded regions, where line blends may occur (especially in the more metal-rich stars). This allows us to take all known blends into consideration, as well as to check the local placement of the continuum, which is difficult in the blue wavelength region. The list of diagnostic Mn lines is provided in Table 2. All atomic data were taken from Paper 1. We note that owing to the limited spectral coverage and gaps in the observed spectra, only a subset of these lines were used for every star.
| [Å] | [eV] | |
|---|---|---|
| 3488.68 | 1.85 | –0.937 |
| 3496.81 | 1.83 | –1.779 |
| 3497.53 | 1.85 | –1.418 |
| 4030.76 | 0.00 | –0.497 |
| 4033.07 | 0.00 | –0.647 |
| 4034.49 | 0.00 | –0.843 |
| 4055.54 | 2.14 | –0.077 |
| 4070.28 | 2.19 | –1.039 |
| 4451.58 | 2.89 | 0.278 |
| 5394.67 | 0.00 | –3.503 |
| 5407.42 | 2.13 | –1.743 |
| 5420.35 | 2.13 | –1.462 |
| 5432.54 | 0.00 | –3.795 |
| 6013.49 | 3.06 | –0.251 |
| 6016.64 | 3.06 | –0.216 |
| 6021.79 | 3.06 | 0.034 |
The NLTE corrections to abundances, , were computed with MULTI2.3 code (Carlsson 1986) as described in Eitner et al. (2019). The LTE and NLTE grids were constructed for a grid of different Mn abundances for each star in the sample. By calculating the equivalent widths (EW) of the lines and applying linear interpolation, we obtained theoretical curves-of-growth as a function of Mn abundance. We then employed the measured LTE abundance values to find the closest matching NLTE EW for each Mn I line and to extract the corresponding NLTE abundances.
For four metal-poor stars, which are not affected by blending, we used the measured EWs of Mn lines directly to infer the LTE and NLTE abundances using the LTE and NLTE grids computed as described above. The EWs were measured in IRAF by fitting Gaussian functions to the Mn lines. The integration and interpolation procedures were taken from the scipy library (Oliphant 2007).
In both cases, we used the same model atmospheres and atomic data to ensure consistency in the calculations. We also verified that both procedures return the same abundance values for a spectrum, which is not affected by blending.
3.2 Systematic and statistical uncertainties
There are several sources of abundance uncertainties (e.g. Bergemann et al. 2012). Systematic uncertainties are caused by approximations used to model physics of stellar atmospheres and radiation transfer. These have an impact on the estimates of stellar parameters and abundances. Statistical uncertainties usually reflect the imperfections of the observed data, which stem from instrumental effects and data reduction procedures. We also take into account the statistical fluctuations in the EW measurement process. All these effects result into dex statistical uncertainty for our sample (see Hansen et al. 2013). In what follows, we explore the sensitivity of our Mn abundances to the uncertainties in stellar parameters. We also assess the systematic error caused by adopting 1D hydrostatic models and LTE in line formation. To the best of our knowledge, this is the first study of the Galactic chemical evolution of [Mn/Fe], in which both sources of error are treated in detail.
| Parameter | 3488Å | 3497Å | 3498Å | 6021Å | |
|---|---|---|---|---|---|
| K | |||||
| g | dex | ||||
| Vmic | kms-1 | 0.10 | 0.04 | 0.06 | |
| dex |
A comprehensive analysis of the uncertainties of , , , and [Fe/H] is given in Gehren et al. (2004), Gehren et al. (2006), Bergemann et al. (2012), and Hansen et al. (2013). We adopt their errors to carry out a systematic analysis of their impact on the Mn abundance estimates. The changes of Mn abundance caused by the variation of stellar parameters within their uncertainty ranges are given in Table 3. We have chosen a main-sequence star HD 106038 for this test, as this star is representative of the majority of our targets and it has a relatively low metallicity ([Fe/H] dex). Our tests suggest that Mn i and Mn ii lines are relatively insensitive to the variation of stellar parameters within their uncertainty margins. For example, the variation of by 100 K causes a maximum change of the Mn abundance by dex, whereas the sensitivity of Mn lines to surface gravity and metallicity is even lower than that. The variation of microturbulence by kms-1 is only significant for the Mn ii 3488 Å line, which yields a dex higher or lower abundance.
Sensitivities of Mn abundance measurements to the uncertainties of stellar parameters are also discussed in Cayrel et al. (2004, Tables 6,7) and in Bonifacio et al. (2009, Table 4). The results of these latter authors are very similar to our estimates for HD 106038, although their estimates refer to very metal-poor giants and dwarfs with metallicity [Fe/H] . Combining the errors in quadrature, we estimate the uncertainty of Mn abundance caused by the uncertainty of stellar parameters to be 0.06 dex for Mn I lines and 0.05 dex for Mn II lines. One of our objects, HD 22879, was recently analysed by Mishenina et al. (2015). Their stellar parameters are somewhat different from our values. We therefore re-computed the ratios for HD 22879 using two different model atmospheres: one (our study) with K, dex, [Fe/H], and km/s. For the other model, we assumed K, dex, [Fe/H], and km/s, as recommended by Mishenina et al. (2015). We found that the Mn abundances derived using both sets of parameters are consistent to dex. This confirms that our results are robust to the uncertainties in stellar parameters.
A detailed discussion of the differences between 1D LTE, 1D NLTE, 3D LTE, and 3D NLTE abundances of Mn can be found in Paper 1. Generally, the differences between 1D NLTE and 3D NLTE Mn abundances are not large and do not exceed dex for dwarfs and giants with (see Fig. 18 in Paper 1). However, some Mn i lines, in particular the 403 nm resonance triplet, are significantly affected by convection, especially at low metallicity. Is not yet possible for us to perform 3D NLTE calculations for a large stellar sample, as such calculations are very computationally costly. Hence, in order to reduce the influence of convection as far as possible, we exclude the 403 nm triplet lines from the abundance analysis. Abundances derived from the higher-excitation Mn lines are subject to a minor systematic bias only. However, this systematic bias is larger for stars with dex and dex. In the extreme case of HD 122563, which has a surface gravity of dex, the bias amounts to dex. In addition, we showed that for very metal-poor RGB stars both ionisation stages are very sensitive to 3D NLTE, meaning that even a seemingly satisfactory ionisation balance is not a guarantee of unbiased abundances. However, our present sample contains only five such very metal-poor RGB stars (Table 1). For them, our 1D NLTE Mn estimates are underestimated and are expected to be closer to the scaled solar value. Our conclusions do not change regardless of whether these stars are included in the sample or not, as the Galactic chemical evolution trend is set by the bulk population of main-sequence stars in our sample.
Our final estimates of uncertainties were computed by summing up the errors caused by the uncertainties of stellar parameters and the statistical errors of the abundance measurements in quadrature. In addition, we account for the systematic errors caused by using imperfect models (1D LTE) or neglecting effects of 3D convection. The systematic error component is strictly positive, as 3D NLTE and 1D NLTE abundances are always larger than 1D LTE abundance. We therefore provide two estimates of uncertainties for each [Mn/Fe] value that correspond to the lower and upper error estimates. The systematic error component is added only to the upper error estimate. As discussed above, we adopt a systematic error of 0.1 dex for our 1D NLTE measurements, whereas the bias caused by 1D LTE amounts to 0.25 dex for dwarfs () and 0.4 dex for giants (). These estimates correspond to our detailed estimates of 3D NLTE and 1D NLTE abundance corrections in Paper 1 (in particular, Fig. 18). For the very metal-poor giants with [Fe/H] dex, we assume a conservative systematic error due to the lack of 3D convection of dex. This yields the maximum upper error estimate of 0.17 dex for 1D NLTE abundances, 0.28 dex for 1D LTE abundances measured in the spectra of dwarfs (), and 0.42 dex for those of giants ().
4 Results
Our LTE and NLTE Mn abundances for every star in the main sample are listed in Table 1. Figure 1 compares the differences between the abundances derived from the Mn i and Mn ii lines. These are available in the UVES spectra only, and therefore only 15 stars are shown. LTE modelling reveals a strong ionisation imbalance, with abundances derived from Mn i lines being significantly lower compared to the those obtained from Mn ii lines: the systematic difference ranges from dex to dex. On the other hand, the agreement of two ionisation stages in NLTE is better than dex. This confirms our previous findings in Bergemann et al. (2019). One-dimensional NLTE modelling leads to significantly increased abundances derived from Mn I lines, which largely solves the problem of ionisation imbalance.
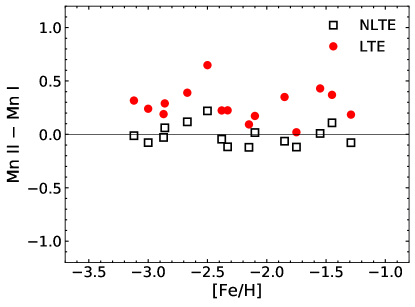
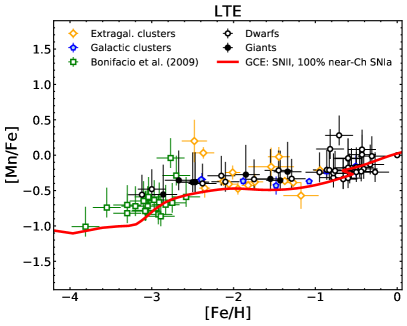
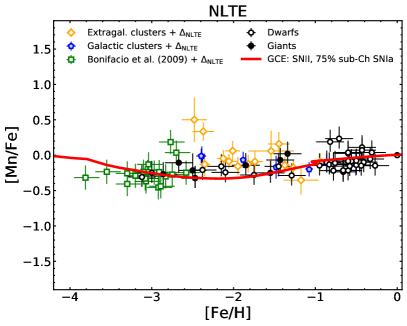
Figure 2 shows the measured abundances as a function of metallicity. The abundances in NLTE are averaged over Mn i and Mn ii lines. We also include the sample of very metal-poor stars from Bonifacio et al. (2009) in order to extend our data to very low metallicities. The Mn results from Bonifacio et al. (2009) show the typical signature of the LTE bias, which we correct for NLTE effects using our new Mn model. Our results generally corroborate the findings by Bergemann & Gehren (2008): in NLTE, the overall [Mn/Fe] trend remains almost flat and [Mn/Fe] ratios do not deviate significantly from the scaled solar values.
We find a very different picture from our LTE measurements. In line with other LTE studies, we find that the abundances based on the Mn i lines suggest a strong [Mn/Fe] depletion at low [Fe/H], with abundance ratios dropping to at [Fe/H] and approaching dex at [Fe/H] . On the other hand, we also find that the LTE abundances derived from the Mn ii lines are very similar to the results we find from these lines in NLTE. In other words, in LTE there is a strong mismatch between the [Mn/Fe] abundance ratios derived from Mn i and Mn ii lines. This severe ionisation imbalance, which increases with decreasing metallicity and , generally renders 1D LTE modelling of Mn abundances useless and, therefore, negates the astrophysical analysis of 1D LTE [Mn/Fe] ratios for any accurate study of stellar physics or Galactic chemical evolution.
5 Discussion
Our revision of Mn abundances implies that [Mn/Fe] ratios across the full metallicity range are much closer to solar (Fig. 2, bottom panel) compared to the results obtained under the un-physical assumption of LTE (Fig. 2, top panel). Moreover, we only see a weak dependence of [Mn/Fe] ratios on metallicity. Even at the [Mn/Fe] abundance ratios do not fall below dex. Adding the sample of very metal-poor stars from Bonifacio et al. (2009) does not change this conclusion. This sample is in excellent agreement with our measurements when corrected for NLTE.
The data from Galactic and extragalactic globular clusters (Larsen et al. 2017, 2018) also follow the [Mn/Fe] trends seen in data of field stars. This is interesting because globular clusters probe different star formation environments and ex-situ origin has been proposed for a substantial fraction, namely one quarter, of the Galactic GC systems (Pritzl et al. 2005; Forbes & Bridges 2010). In addition, the similarity of the abundances for Galactic and extra-galactic GC systems suggests that the trend of [Mn/Fe] with metallicity is universal, which provides strong evidence against the diversity of stellar explosion mechanisms contributing to the chemical enrichment of Fe-group elements.
Our results have important implications for understanding the sources of Fe-group elements and GCE. The nucleosynthesis of Fe-group elements, and therefore the chemical enrichment of Mn, is determined by CC SNe and by SNe Ia. There is a general consensus surrounding the qualitative production of Mn and Fe in both sites (e.g. McWilliam et al. 2018). At metallicities [Fe/H]1, the main sources of these elements in the Milky Way are CC SNe (Cescutti et al. 2008; Seitenzahl et al. 2013), whereas SNe Ia, which have longer delay times, dominate the production of both elements at higher metallicity. Quantitatively, however, the picture is still open for debate (e.g. Travaglio et al. 2004; Goldstein & Kasen 2018; Kirby et al. 2019). The explosion mechanism of SNe II is not fully understood (e.g. Janka 2012) and there is no consensus on the progenitors of SNe Ia (e.g. Hillebrandt et al. 2013; Maoz et al. 2014). As a consequence, the detailed evolution of [Mn/Fe] ratio with metallicity in the Galaxy is still largely unknown.
In the top panel of Fig. 2, we compare the LTE abundances to a GCE model computed in Cescutti et al. (2008). This model employs the Woosley & Weaver (1995) yields for SNe II and Iwamoto et al. (1999) yields (W7 model) for SNe Ia. According to this model, the [Mn/Fe] ratio is extremely low at [Fe/H]3, but it gradually increases with [Fe/H] owing to the metallicity-dependent yields of CC SNe. At [Fe/H], SNe Ia start contributing to the chemical enrichment and the [Mn/Fe] ratio quickly approaches the solar value. The same behaviour is seen in the LTE data. It should also be noted that the data lie slightly above the model results. Indeed, Seitenzahl et al. (2013) had to increase the CC SN yield of Mn predicted by the Woosley & Weaver (1995) models by to match the LTE abundances at [Fe/H].
Our new NLTE data suggest that the [Mn/Fe] trend is flat and the Mn/Fe abundance ratios are close to the scaled solar value at all metallicities (lower panel of Fig. 2). This can be accommodated within the available GCE model by increasing the Woosley & Weaver (1995) CC SN yields for Mn by . On the other hand, a GCE model that adopts the Kobayashi et al. (2011) yields for normal CC SNe leads to good agreement with our NLTE data. The differences are possibly connected to the different explosion mechanism imposed in the two studies: the piston mechanism in Woosley & Weaver (1995) and the thermal bomb mechanism in Kobayashi et al. (2011).
Some studies (Romano et al. 2010; Kobayashi et al. 2011) also suggest that a fraction of hypernovae might be necessary to explain the observed super-solar [Zn/Fe] abundance ratios at very low metallicities, [Fe/H] . However, we abstain from this possibility for two reasons. Firstly, the Zn abundances in metal-poor stars rely on the LTE assumption. The NLTE analysis of Zn line formation by Takeda et al. (2005) suggests that the NLTE abundance corrections for Zn I lines are small and positive, but these authors used Drawin’s formula to compute the rates of H collisions and the hydrogenic (Kramer’s) approximation to compute the rates of photo-ionisation in the statistical equilibrium equations. Both formulae are known to yield woefully inadequate cross-sections and rates for every element that has been studied with detailed quantum-mechanical methods (e.g. Barklem 2016; Belyaev & Voronov 2017). For Mn, for example, Drawin’s formula under- or overestimates the rates by up to seven orders of magnitude (Bergemann et al. 2019). Also, Kramer’s opacity formula fails to reproduce the overall photoionisation cross-section and its complex frequency structure (e.g. Bautista et al. 2017). Therefore, it is not clear yet whether Zn abundances can be trusted, especially at low metallicity. Secondly, hypernovae tend to severely underproduce Mn compared to Fe. However, their fraction and Galactic population properties are virtually unknown, and must, in turn, be calibrated on the observed abundances in metal-poor stars. It is also worth pointing out that the yields of rapidly rotating massive stars exploding as CC SNe are different from those of non-rotating objects (Limongi & Chieffi 2018), but owing to poorly constrained rotation rates of supernova progenitors, detailed quantitative statements on the effect of those are not yet possible.
The larger production of Mn at low metallicity required to explain the nearly solar-like [Mn/Fe] ratios at [Fe/H] also has an impact on the expected contribution from SNe Ia. Our NLTE data suggest only a mild up-turn in the [Fe/H] - [Mn/Fe] plane above compared to previous literature estimates. As a result, the GCE models computed with purely near- SNe do not fit our NLTE data. It is also not possible to reproduce the trend assuming a mix of 50% near- and 50% sub- SNe Ia, which was assumed in the favoured model of Seitenzahl et al. (2013). Our NLTE data (Fig.2) suggest that the optimal GCE model for [Mn/Fe] has to assume only 25% near- and over 75% sub- SNe Ia. Only in this case can the flat trend of [Mn/Fe] with [Fe/H] and the solar abundance of Mn be reproduced simultaneously.
We also find that although there are a few outliers in the [Fe/H]-[Mn/Fe] plane, the scatter of [Mn/Fe] ratios at any metallicity is relatively small and does not change with [Fe/H]. However, our sample is not large enough to draw conclusions on the real astrophysical spread in the disc or halo. Such a spread has been proposed by Cescutti & Kobayashi (2017) as a consequence of multiple types of SNe Ia.
6 Conclusions
In this study we calculated NLTE abundances of Mn for stars covering a broad range of metallicities, from solar to the extremely metal-poor regime of . We analysed the results with respect to the NLTE effects on the Mn ionisation balance. Our new NLTE abundances derived from Mn i and Mn ii lines show good consistency, contrary to LTE abundances from previous studies, providing strong evidence that these inconsistencies are mainly due to the assumption of LTE.
Additionally, we investigated the [Mn/Fe] trend with metallicity in the Milky Way galaxy, in Galactic and in extragalactic globular clusters. We found that the NLTE Mn/Fe ratios are close to solar across the full metallicity range, [Fe/H] . These findings contrast those reported from LTE studies. Also, with our NLTE abundances, no steep rise of [Mn/Fe] is visible above .
A good fit to our data can be obtained by assuming that a significant fraction of SNe Ia () stem from the sub- channel. While this fraction is larger than the found by Seitenzahl et al. (2013), we note that we still require near- SNe Ia to obtain solar [Mn/Fe] at [Fe/H] . In summary, we suggest that the contribution by SN II and SN Ia to Mn/Fe yields has to be different from what is commonly assumed in the literature. Our data indicate that core-collapse SNe produce significant Mn/Fe at lower metallicity (), whereas at higher metallicity a significant contribution by sub- SNe Ia is necessary to simultaneously reproduce the Mn/Fe ratios in the Sun and in the Galactic disc stars.
Acknowledgements.
IRS was supported by the Australian Research Council grant FT160100028. GC acknowledges financial support from the European Union Horizon 2020 research and innovation programme under the Marie Sklodowska-Curie grant agreement No. 664931. This work has been partially supported by the EU COST Action CA16117 (ChETEC). BP is partially supported by the CNES, Centre National d’Etudes Spatiales. We acknowledge support by the Collaborative Research centre SFB 881 (projects A5, A10), Heidelberg University, of the Deutsche Forschungsgemeinschaft (DFG, German Research Foundation).References
- Bagnulo et al. (2003) Bagnulo, S., Jehin, E., Ledoux, C., et al. 2003, The Messenger, 114, 10
- Barbuy et al. (2018) Barbuy, B., Chiappini, C., & Gerhard, O. 2018, ArXiv e-prints [arXiv:1805.01142]
- Barklem (2016) Barklem, P. S. 2016, A&A Rev., 24, 9
- Battistini & Bensby (2015) Battistini, C. & Bensby, T. 2015, A&A, 577, A9
- Bautista et al. (2017) Bautista, M. A., Lind, K., & Bergemann, M. 2017, A&A, 606, A127
- Belyaev & Voronov (2017) Belyaev, A. K. & Voronov, Y. V. 2017, A&A, 606, A106
- Bergemann et al. (2019) Bergemann, M., Gallagher, A. J., Eitner, P., et al. 2019, A&A, 631, A80
- Bergemann & Gehren (2008) Bergemann, M. & Gehren, T. 2008, A&A, 492, 823
- Bergemann et al. (2012) Bergemann, M., Lind, K., Collet, R., Magic, Z., & Asplund, M. 2012, MNRAS, 427, 27
- Bonifacio et al. (2009) Bonifacio, P., Spite, M., Cayrel, R., et al. 2009, A&A, 501, 519
- Carlsson (1986) Carlsson, M. 1986, Upps. Astron. Obs. Rep., No. 33, 2+39+117 pp., 33
- Cayrel et al. (2004) Cayrel, R., Depagne, E., Spite, M., et al. 2004, A&A, 416, 1117
- Cescutti & Kobayashi (2017) Cescutti, G. & Kobayashi, C. 2017, A&A, 607, A23
- Cescutti et al. (2008) Cescutti, G., Matteucci, F., Lanfranchi, G. A., & McWilliam, A. 2008, A&A, 491, 401
- de los Reyes et al. (2020) de los Reyes, M. A. C., Kirby, E. N., Seitenzahl, I. R., & Shen, K. J. 2020, arXiv e-prints, arXiv:2001.01716
- Dekker et al. (2000) Dekker, H., D’Odorico, S., Kaufer, A., Delabre, B., & Kotzlowski, H. 2000, in Society of Photo-Optical Instrumentation Engineers (SPIE) Conference Series, Vol. 4008, Proc. SPIE, ed. M. Iye & A. F. Moorwood, 534–545
- Eitner et al. (2019) Eitner, P., Bergemann, M., & Larsen, S. 2019, A&A, 627, A40
- Fink et al. (2010) Fink, M., Röpke, F. K., Hillebrandt, W., et al. 2010, A&A, 514, A53
- Flörs et al. (2019) Flörs, A., Spyromilio, J., Taubenberger, S., et al. 2019, Monthly Notices of the Royal Astronomical Society, 491, 2902
- Forbes & Bridges (2010) Forbes, D. A. & Bridges, T. 2010, MNRAS, 404, 1203
- Gallagher et al. (2019) Gallagher, A. J., Bergemann, M., Collet, R., et al. 2019, arXiv e-prints, arXiv:1910.03898
- Gehren et al. (2004) Gehren, T., Liang, Y. C., Shi, J. R., Zhang, H. W., & Zhao, G. 2004, A&A, 413, 1045
- Gehren et al. (2006) Gehren, T., Shi, J. R., Zhang, H. W., Zhao, G., & Korn, A. J. 2006, A&A, 451, 1065
- Gilfanov & Bogdán (2010) Gilfanov, M. & Bogdán, Á. 2010, Nature, 463, 924
- Goldstein & Kasen (2018) Goldstein, D. A. & Kasen, D. 2018, ApJ, 852, L33
- Gustafsson et al. (2008) Gustafsson, B., Edvardsson, B., Eriksson, K., et al. 2008, A&A, 486, 951
- Hansen et al. (2013) Hansen, C. J., Bergemann, M., Cescutti, G., et al. 2013, A&A, 551, A57
- Hansen & Primas (2011) Hansen, C. J. & Primas, F. 2011, A&A, 525, L5
- Hansen et al. (2012) Hansen, C. J., Primas, F., Hartman, H., et al. 2012, A&A, 545, A31
- Hillebrandt et al. (2013) Hillebrandt, W., Kromer, M., Röpke, F. K., & Ruiter, A. J. 2013, Frontiers of Physics, 8, 116
- Hitomi Collaboration et al. (2017) Hitomi Collaboration, Aharonian, F., Akamatsu, H., et al. 2017, Nature, 551, 478
- Iben & Tutukov (1984) Iben, I., J. & Tutukov, A. V. 1984, ApJ, 284, 719
- Iwamoto et al. (1999) Iwamoto, K., Brachwitz, F., Nomoto, K., et al. 1999, ApJS, 125, 439
- Janka (2012) Janka, H.-T. 2012, Annual Review of Nuclear and Particle Science, 62, 407
- Jordan et al. (2003) Jordan, G. C., Gupta, S. S., & Meyer, B. S. 2003, Phys. Rev. C, 68, 065801
- Katz & Dong (2012) Katz, B. & Dong, S. 2012, arXiv e-prints, arXiv:1211.4584
- Kirby et al. (2019) Kirby, E. N., Xie, J. L., Guo, R., et al. 2019, ApJ, 881, 45
- Kobayashi et al. (2011) Kobayashi, C., Karakas, A. I., & Umeda, H. 2011, MNRAS, 414, 3231
- Kobayashi et al. (2019) Kobayashi, C., Leung, S.-C., & Nomoto, K. 2019, arXiv e-prints, arXiv:1906.09980
- Kurucz (2005) Kurucz, R. L. 2005, Memorie della Societa Astronomica Italiana Supplementi, 8, 14
- Kushnir et al. (2013) Kushnir, D., Katz, B., Dong, S., Livne, E., & Fernández, R. 2013, ApJ, 778, L37
- Kuuttila et al. (2019) Kuuttila, J., Gilfanov, M., Seitenzahl, I. R., Woods, T. E., & Vogt, F. P. A. 2019, MNRAS, 484, 1317
- Larsen et al. (2017) Larsen, S. S., Brodie, J. P., & Strader, J. 2017, A&A, 601, A96
- Larsen et al. (2018) Larsen, S. S., Brodie, J. P., Wasserman, A., & Strader, J. 2018, A&A, 613, A56
- Levanon et al. (2015) Levanon, N., Soker, N., & García-Berro, E. 2015, MNRAS, 447, 2803
- Limongi & Chieffi (2018) Limongi, M. & Chieffi, A. 2018, ApJS, 237, 13
- Lind et al. (2017) Lind, K., Amarsi, A. M., Asplund, M., et al. 2017, MNRAS, 468, 4311
- Lind et al. (2012) Lind, K., Bergemann, M., & Asplund, M. 2012, MNRAS, 427, 50
- Livne (1990) Livne, E. 1990, ApJ, 354, L53
- Maoz et al. (2014) Maoz, D., Mannucci, F., & Nelemans, G. 2014, ARA&A, 52, 107
- McWilliam (2016) McWilliam, A. 2016, PASA, 33, e040
- McWilliam et al. (2018) McWilliam, A., Piro, A. L., Badenes, C., & Bravo, E. 2018, ApJ, 857, 97
- Mernier et al. (2016) Mernier, F., de Plaa, J., Pinto, C., et al. 2016, A&A, 595, A126
- Mishenina et al. (2015) Mishenina, T., Gorbaneva, T., Pignatari, M., Thielemann, F.-K., & Korotin, S. A. 2015, MNRAS, 454, 1585
- Nomoto et al. (2013) Nomoto, K., Kobayashi, C., & Tominaga, N. 2013, ARA&A, 51, 457
- Oliphant (2007) Oliphant, T. E. 2007, Computing in Science & Engineering, 9, 10
- Pakmor et al. (2012) Pakmor, R., Kromer, M., Taubenberger, S., et al. 2012, ApJ, 747, L10
- Pritzl et al. (2005) Pritzl, B. J., Venn, K. A., & Irwin, M. 2005, AJ, 130, 2140
- Rebassa-Mansergas et al. (2019) Rebassa-Mansergas, A., Toonen, S., Korol, V., & Torres, S. 2019, MNRAS, 482, 3656
- Romano et al. (2010) Romano, D., Karakas, A. I., Tosi, M., & Matteucci, F. 2010, A&A, 522, A32
- Ruiter et al. (2009) Ruiter, A. J., Belczynski, K., & Fryer, C. 2009, ApJ, 699, 2026
- Sbordone et al. (2004) Sbordone, L., Bonifacio, P., Castelli, F., & Kurucz, R. L. 2004, Memorie della Societa Astronomica Italiana Supplementi, 5, 93
- Scalzo et al. (2019) Scalzo, R. A., Parent, E., Burns, C., et al. 2019, MNRAS, 483, 628
- Scalzo et al. (2014) Scalzo, R. A., Ruiter, A. J., & Sim, S. A. 2014, MNRAS, 445, 2535
- Seitenzahl et al. (2013) Seitenzahl, I. R., Cescutti, G., Röpke, F. K., Ruiter, A. J., & Pakmor, R. 2013, A&A, 559, L5
- Seitenzahl & Townsley (2017) Seitenzahl, I. R. & Townsley, D. M. 2017, Nucleosynthesis in Thermonuclear Supernovae, ed. A. W. Alsabti & P. Murdin, 1955
- Shappee et al. (2013) Shappee, B. J., Kochanek, C. S., & Stanek, K. Z. 2013, ApJ, 765, 150
- Shen et al. (2018) Shen, K. J., Kasen, D., Miles, B. J., & Townsley, D. M. 2018, ApJ, 854, 52
- Sneden et al. (2016) Sneden, C., Cowan, J. J., Kobayashi, C., et al. 2016, ApJ, 817, 53
- Spite et al. (2013) Spite, M., Caffau, E., Bonifacio, P., et al. 2013, A&A, 552, A107
- Takeda et al. (2005) Takeda, Y., Hashimoto, O., Taguchi, H., et al. 2005, PASJ, 57, 751
- Thielemann et al. (1986) Thielemann, F.-K., Nomoto, K., & Yokoi, K. 1986, A&A, 158, 17
- Toonen et al. (2018) Toonen, S., Perets, H. B., & Hamers, A. S. 2018, A&A, 610, A22
- Travaglio et al. (2004) Travaglio, C., Hillebrandt, W., Reinecke, M., & Thielemann, F.-K. 2004, A&A, 425, 1029
- Whelan & Iben (1973) Whelan, J. & Iben, Icko, J. 1973, ApJ, 186, 1007
- Woosley & Weaver (1995) Woosley, S. E. & Weaver, T. A. 1995, ApJS, 101, 181