Electrical Double Layer Capacitance of Curved Graphite Electrodes
Abstract
To improve the understanding of the relation between electrode curvature and energy storage mechanisms, a systematic investigation of the correlation between convex and concave electrode surfaces and the differential capacitance of an electrochemical double layer capacitor using molecular dynamics simulations is presented. Each electrode consists of three layers of curved graphene sheets with a convex and concave surface to which the constant potential method was applied. The differential capacitance shows a fluctuating behavior with respect to the curvature radius of the convex and concave areas of the electrode. The reasons identified for this are differences in the geometric arrangement and solvation of the adsorbed ions as well as a steric hindrance prohibiting further charge accumulation. Since the total differential capacitance is calculated as a weighted average of contributions from concave and convex surfaces, the influence of individual curvatures on the total capacitance is significantly reduced for the total electrode surface.
keywords:
supercapacitors, electric double layer, curved electrodes, molecular dynamics, constant potential methodHamburg University of Technology]Institute of Polymers and Composites, Hamburg University of Technology, Denickestraße 15, 21073 Hamburg, Germany Fraunhofer IFAM]Fraunhofer-Institut für Fertigungstechnik und Angewandte Materialforschung IFAM - Klebtechnik und Oberflächen, Wiener Straße 12, 28359 Bremen, Germany Scienomics GmbH]Scienomics GmbH, Bürgermeister-Wegele-Straße 12, 86167 Augsburg, Germany Materials Design]Materials Design SARL, 42, Avenue Verdier, 92120 Montrouge, France \alsoaffiliation[Scienomics GmbH]Scienomics GmbH, Bürgermeister-Wegele-Straße 12, 86167 Augsburg, Germany Hamburg University of Technology]Institute of Polymers and Composites, Hamburg University of Technology, Denickestraße 15, 21073 Hamburg, Germany \alsoaffiliation[Helmholtz-Zentrum Geesthacht]MagIC – Magnesium Innovation Centre, Institute of Materials Research Helmholtz-Zentrum Geesthacht, Max-Planck Str. 1, 21502 Geesthacht, Germany \abbreviationsMD
![[Uncaptioned image]](/html/2003.01467/assets/images/toc.png)
This document is the unedited Author’s version of a Submitted Work that was subsequently accepted for publication in Journal of Physical Chemitry C (copyright © American Chemical Society) after peer review. To access the final edited and published work see https://pubs.acs.org/doi/10.1021/acs.jpcc.9b10428.
1 Introduction
Electrochemical double layer capacitors (EDLCs) or supercapacitors are promising energy storage devices characterized by a high power density, short charging times and a long service life. However, their disadvantage is a relatively low energy density compared to traditional batteries.1 The energy storage mechanism in an EDLC is based on an electrostatic field formed at the interface between a conductive electrode and an electrolyte, the so-called Helmholtz double layer, with a separation of charge in the order of a few Ångströms – several orders smaller than in a conventional capacitor. By using organic electrolytes 2, 3, which provide a low viscosity and higher ionic conductivity as compared to ionic liquids at room temperature, EDLCs can be operated in a very large electrochemical window.4, 5, 6, 7 In addition to the electrolyte composition, the efficiency of the EDLC is strongly determined by the electrode material. In particular the chemical and physical properties of carbon-based materials, such as the high specific surface area, the good electric conductivity, the high chemical stability and the wide operating temperature range, make them suitable candidates for electrodes.2, 8 In order to develop new carbon materials with increased capacitance, it is thus crucial to understand how carbon structures affect charge storage mechanisms.4, 2, 5
Capacitances as a function of the mean pore size of several porous carbon-based structures were previously determined experimentally as well as from simulations.9, 10, 11, 12, 13, 14, 15, 16 By limiting the electrolyte contact only to the convex part of an electrode, e.g., by using the outer surfaces of fullerenes or carbon nanotubes (CNT), a reduction in capacitance was observed.17, 18, 19 In all these studies, however, only the influence of either purely concave or convex geometric structures were investigated. In complex porous structures, e.g., amorphous carbons on the contrary, influences from different geometries are always intertwined. Hence, it is practically impossible to allow rigorous conclusions about influences of edges, pores, curvatures and their combination on the differential capacitance from simulations of amorphous carbons alone. Thus, this work attempts to investigate individual contributions of convex and concave electrode curvatures to the differential capacitance of the entire electrode and establish a link to more complex porous structures.
2 Computational Details
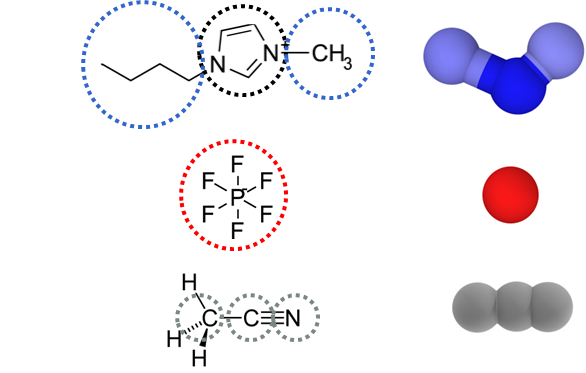
The calculations were carried out within the framework of molecular dynamic simulations using the Large-scale Atomic/Molecular Massively Parallel Simulator (LAMMPS)20. The simulation cell consisted of two curved graphitic electrodes enclosing an electrolyte. The electrolyte was made of a 1.5 M 1-n-butyl-3-methylimidazolium hexafluorophosphate ([BMI]+-[PF6]-) solution in acetonitrile (ACN) and was represented by a coarse grained model as summarized by Merlet et al. 3. Fig. 1 shows schematically the structure of the coarse grained molecules. The corresponding simulation parameters are summarized in Table 1.
| Site | Imi | Met | But | [PF6]- | N | C | Me |
|---|---|---|---|---|---|---|---|
| / | 0.4374 | 0.1578 | 0.1848 | -0.78 | -0.398 | 0.129 | 0.269 |
| / | 67.07 | 15.04 | 57.12 | 144.96 | 14.01 | 12.01 | 15.04 |
| / Å | 4.38 | 3.41 | 5.04 | 5.06 | 3.30 | 3.40 | 3.60 |
| / | 2.56 | 0.36 | 1.83 | 4.71 | 0.42 | 0.42 | 1.59 |
For comparison of the performance, additional simulations with flat graphitic electrodes were carried out as well.
The simulation system was set up in three steps: First, Packmol 21 was used to obtain a statistical distribution of the coarse grained molecules in a bulk electrolyte simulation cell. After a 0.02 ns equilibration run in the NVE ensemble, followed by a 0.02 ns NVT simulation at 300 K, the density of the bulk electrolyte was adjusted by a 2 ns NPT simulation at 300 K and 1.0 bar using the Nosé-Hoover thermostat/barostat. In all simulations the bonds of the ACN as well as bonds and angles of the [BMI]+ were constrained using the SHAKE algorithm, whilst for the bond angle of ACN a stiff spring was used to fix the angle to 180∘. The electrostatic interactions were calculated using the particle-particle particle-mesh method (pppm) along with a cutoff radius of 12 Å for the short ranged potentials.
In the second step, a three layered planar graphitic model served as initial structure for modeling the wave-like electrodes. In order to define the concave and convex radii of the middle layer in the final curved structure the length of the initial simulation cell perpendicular to the zig-zag direction of the planar graphene layers should be equal to the perimeter of a corresponding carbon nanotube (CNT) with the same radius. The wave-like structure resulted from a deformation of that cell dimension to twice the diameter of the CNT equivalent. There is a series of carbon potentials that can be used for the simulation of carbon based electrode structures and are described by de Tomas et al.22. We used the LCBOP 23 potential in a NVT simulation at 300 K for 0.05 ns and a following energy minimization.
The final electrode radii for the middle layer, , as well as for the concave and convex surface areas which are in contact with the electrolyte, and , are presented in Tab. 2.
| / Å | / Å | / Å |
|---|---|---|
| 9.77 | 3.55 | 4.07 |
| 10.33 | 4.19 | 4.75 |
| 10.88 | 4.74 | 5.42 |
| 11.40 | 5.35 | 6.10 |
| 11.95 | 5.79 | 6.78 |
| 13.05 | 6.91 | 8.14 |
| 14.68 | 8.60 | 10.17 |
| 15.76 | 9.76 | 11.53 |
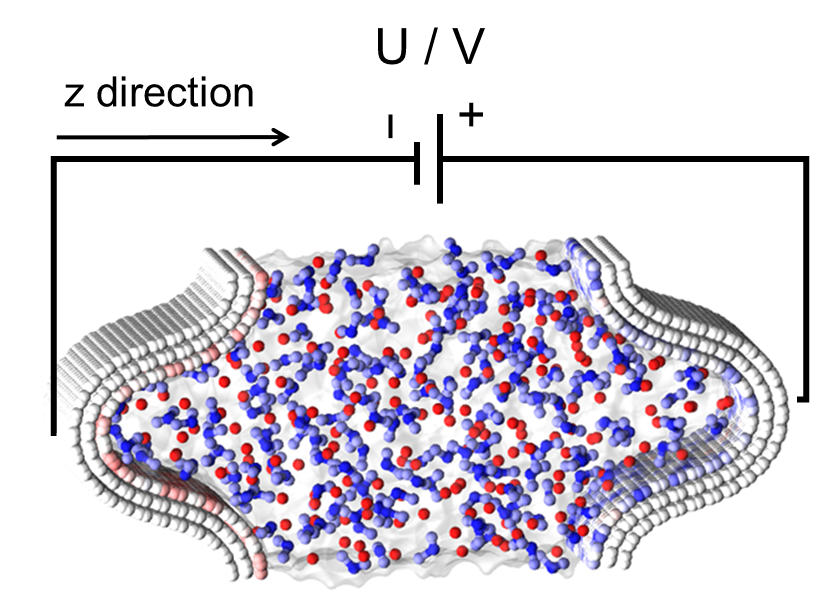
In the third step, the electrolyte has to adapt the contour of the electrodes while a realistic bulk density in the center of the simulation box is preserved. Thus, the curved electrodes have to be pressed against the bulk electrolyte from both sides in order to represent experimental conditions at the given temperature and concentration according to the results of Huo et al. 24. An initial displacement of the electrodes was achieved using a NVT ensemble at 400 K applied to the pure ionic liquid and at 300 K for the organic electrolyte with a simulation time of 100 ps and a time step of 2 fs. After the initial compression, the displacement of the electrodes was coupled to the experimentally determined bulk density of 0.96 g cm-3 in the center of the electrolyte. During the displacement of the electrodes the density was evaluated at each time step. The displacement was successively adjusted during the simulation in order to converge to the experimental density. In this case, a final error of the density of 0.03 g cm-3 was achieved. The final structure of an electrochemical cell with curved electrodes as used in our simulations is illustrated in Fig. 2.
The determination of the differential capacitance was carried out in the NVT ensemble at 300 K for the solvated liquid and at 400 K for the pure ionic liquid. After an equilibration run for 0.2 ns, the data was recorded for 3.8 ns at the respective electrode potential. In order to apply the defined electric potentials (0 V, 1 V, 2 V, 3 V, 4 V and 5 V) the constant potential (CONP) method, as it is described by Wang et al. 25, was used. Under the assumption that the electrode material has an electrical conductivity close to that of metals, the CONP method calculates the partial charge for each electrode atom at a defined potential difference. In contrast to the constant charge method, the results of a CONP simulation are more realistic.19 Furthermore, due to the self-consistent charge determination of this method, the CONP method can be applied to arbitrary electrode geometries.3 A well-established approach to calculate differential capacitances for flat26 electrodes geometries is to solve numerically the Poisson equation along the z-axis to calculate the potential drop. Merlet et al.14 and Lu et al.27 used this approach for the potential drop calculation of supercapacitors with non-planar electrodes as well. By using the time average of the positive or negative surface charge density of the CONP simulations as a function of the potential drop , the differential capacitance of the negative and positive electrode can be calculated with the equation
| (1) |
where the potential drop is defined as the difference of the applied potential at the positive or negative electrode and the potential in the middle of the electrolyte region (). can be obtained by solving the Poisson equation along the direction which passes through both electrodes:
| (2) |
where is the boundary condition and the charge density time average of an infinitesimal thin slab in -direction.
3 Results and Discussion
A linear regression of the time-averaged surface charges on the electrode against the potential drop allows the successive determination of the differential capacitance of each electrode (see SI for a detailed description of the approach). Fig. 3(a) shows the evolution of the differential capacitance as a function of the curvature radius of the middle layer. The curvature of the middle layer is identical in the concave and convex area. Thus can be used as a reference for the capacitance of the entire electrode.
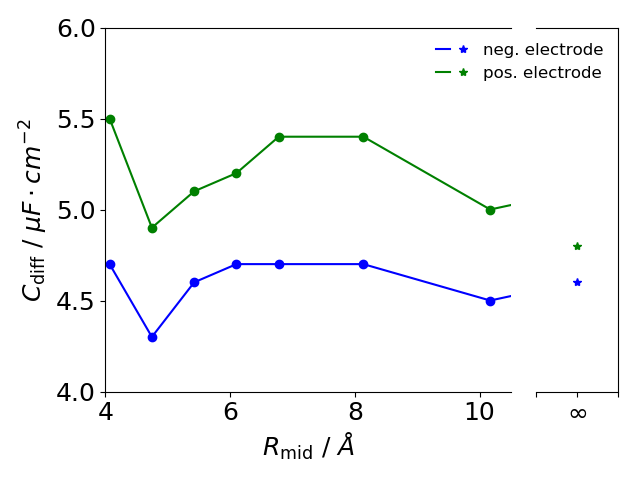
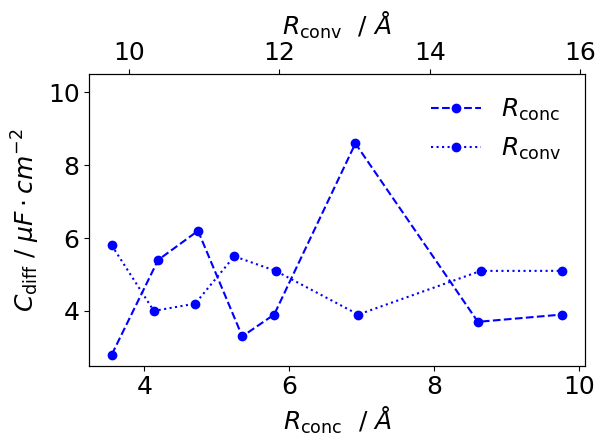

We observed an almost constant difference in the differential capacitance for positive and negative electrodes which can be attributed to the different size of the ions. A decrease of the capacitance from 4.7 to 4.3 for the negative electrode and from 5.5 to 4.9 for the positive electrode with an increase of the radius of curvature, from 4.1 Å to 4.7 Å is observed. The differential capacitance increases by 0.4 for the negative and 0.5 for the positive electrode with a further increase in the curvature radius. Compared to flat electrodes, denoted by stars in Fig. 3(a), positively charged curved electrodes have an overall higher capacitance (with the exception at = 4.7 Å). Negatively charged curved electrodes behave worse or equivalent to the flat electrode equivalent. Due to the fact that the electric potentials for convex and concave areas are the same, the potential drop for both is assumed to be equal. Resulting differential capacitances for individual concave and convex regions of both electrodes using the aforementioned assumption are shown for the negative and positive electrode in Fig. 3(b) and Fig. 3(c), respectively. Generally, higher fluctuations of the differential capacitance for individual curvatures compared to the entire electrode appear. The concave part of the negative electrode (dashed line in Fig. 3(b)) shows two very clear maxima located at 4.7 Å and 6.9 Å and three minima located at 3.6 Å, 5.4 Å and 8.6 Å. The convex part, on the other hand, (dotted line in Fig. 3(b)) shows three maxima at 9.8 Å, 11.4 Å and 14.7 Å and fluctuates with a generally smaller amplitude. A similar behavior is observed for the positive electrode (see Fig. 3(c)). However, a generally higher capacitance is observed for concave positive electrode parts compared to negatively charged electrodes. Whereas for the convex parts of the positive and negative electrodes no pronounced difference is observable. Concave and convex surface contributions to the differential capacitance of the entire electrode depend on the ratio of the respective curved area to the entire electrode surface. By calculating the weighted arithmetic mean from the convex and concave capacitances, in which the respective surface of the concave and convex part is used as weight, the exact differential capacitance of the full electrode is indeed ultimately obtained. The strong signal at = 6.9 Å is thus compensated in the total electrode capacitance by the larger surface area and lower capacitance of the convex region in our particular curved electrode model.
Individual consideration of the convex and concave area allow a more rigorous interpretation of the charge storage mechanisms in these areas, while still maintaining the link to realistic graphitic structures apparent in, e.g., amorphous carbons.28 At a concave radius of 3.6 Å, a 75%-reduction of the solvation shell of both ion types adsorbed on the concave electrode part occurs (see Fig. S6) and a minimum of the differential capacitance is observed. This behavior is similar to the decrease of the differential capacitance observed for flat electrodes when it is switched to the ionic liquid equivalent of the organic electrolyte (Fig. S9). A further increase of the concave radius allows again more solvent molecules to enter the pocket (apparent in the increase of the solvation shell of the adsorbed ions, see Fig. 4), effectively reducing overscreening and eventually resulting in the increase of the differential capacitance observed at 4.7 Å. Multiple capacitance peaks have been also observed experimentally in Vatamanu et al. 29 for nanoporous materials with different pore widths. The occurrence of capacitance peaks for confined organic electrolytes was also found in the simulations of Feng and Cummings 11 using a similar organic electrolyte. Following their argumentation, fluctuations of the differential capacitance of concave pocket-shaped electrodes could be explained as follows: When increasing the curvature radius, pocket sizes occur that have a larger concave surface area, but do not offer additional space for adsorbing new ions. In this case, the surface area is increased but no additional surface charges are induced (or they are even reduced due to the geometric shape of the electrode), leading to a capacitance minimum. Increasing the curvature radius further, additional ions can adsorb at the surface and another capacitance maximum is observed. However, this argumentation is not able to explain some of the features apparent in Fig. 3(b) and (c), e.g., the height and the difference of the second peaks observed at a concave radius of 6.7 Å for negative and positive electrodes. Thus, a more sophisticated investigation of the ionic adsorption structure and the interplay with the solvent is required to address, e.g., the influence of the change of the relative permittivity due to adsorbed ACN between the electrode and the ions on the capacitance. The number of ACN, [PF6]- and [BMI]+ components in the double layer at the positive and negative electrode are considered in more detail in the following to explain the capacitance peaks. The extend of the double layer at the positive and negative electrodes were estimated from the first RDF peak of electrode carbon atoms to imidazole groups (for the negative electrode) and [PF6]- (for the positive electrode). This method was used to determine a double layer thickness of 4.5 Å for the positive and 5.0 Å for the negative electrode of both flat and curved graphitic structures. As an example, Fig. 4 shows the number of ACN and [BMI]+ components as well as [PF6]- ions within the Helmholtz layer of the concave and convex areas of the negative (a and b) and positive electrode (c and d) at 3 V, with respect to the radius of curvature. Results for other electrode potentials are found in the SI.
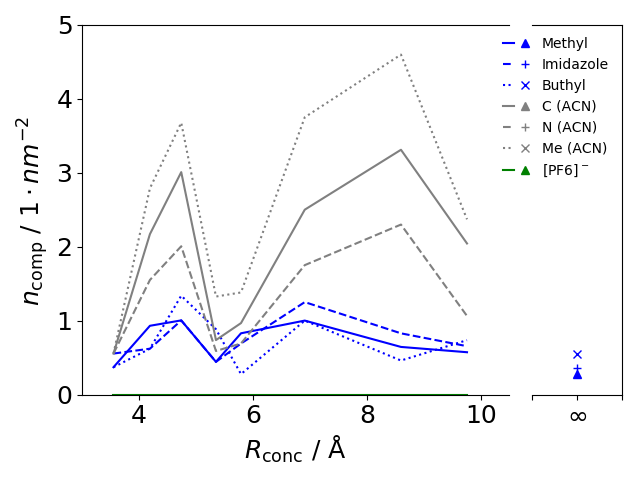
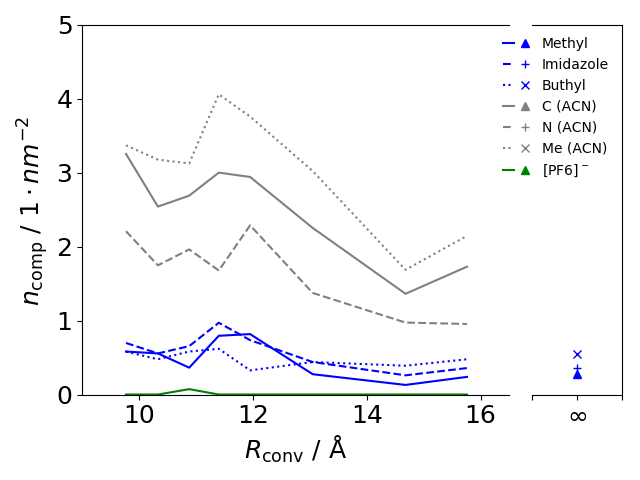
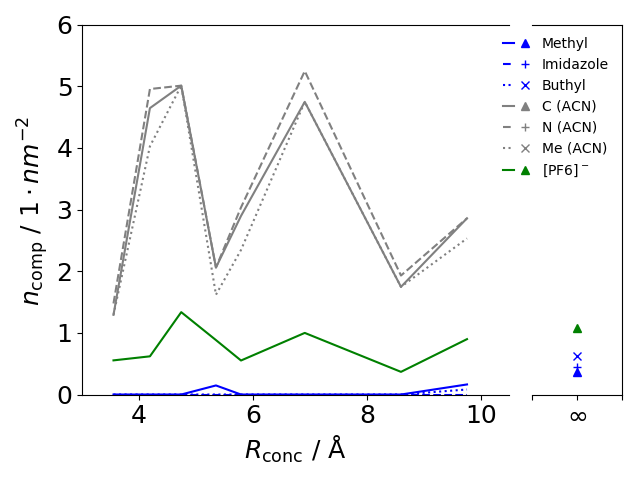
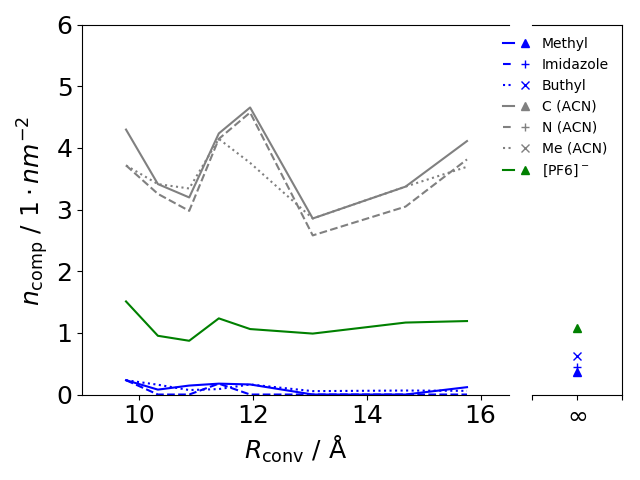
In general, number densities of ACN components show more pronounced peaks for both electrodes than for the ionic components. A correlation between ACN and ionic component peaks in Fig. 4(a) and (c) with the concave capacitance in Fig. 3(b) and (c) is observed. However, the decrease of the ACN number at the negative convex area in Fig. 4(b) at higher curvature radii shows not the same behavior as the convex capacitance in Fig. 3(b) with increasing radii. The dependence of the number density on the curvature becomes more pronounced at higher surface charge densities induced by the applied potential (see Fig. S10-S13). The fluctuations of the number densities of ACN components as well as the changing ratio of [BMI]+ components in the double layer of the electrodes with increasing curvature indicate a possible rearrangement and different adsorption geometries of the ions depending on the curvature of the electrode. Due to the location of the [BMI]+ charge centre between two organic side chains acting as spacers, some adsorption orientations of the [BMI]+ eventually induce a higher charge on the curved electrode surface than others. The change of the adsorption geometry and an associated structural phase transition of the ions has been also previously observed for flat electrodes at different electrode potentials.30
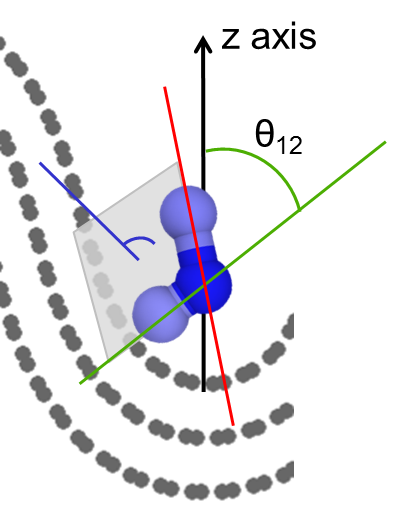
A more rigorous analysis of the orientation of [BMI]+ to the electrode surface is possible by defining three angles, as indicated in Fig. 5a: i) The angle between the line which passes through both the imidazole group and the methyl group and the z-axis of the simulation box (green line in Fig. 5a). ii) The angle between the line which passes through both the imidazole group and the butyl group and the z-axis of the simulation box (red line in Fig. 5a). iii) The angle between the normal of the plane in which the three components of [BMI]+ are located and the z-axis (blue line in Fig. 5a). Only [BMI]+, whose imidazole groups are in the double layer of the negative electrode, are regarded in this calculations. Fig. 5 shows exemplary the probability density histograms of the angles calculated from the production run for three curvatures (for histograms of other curvatures see Fig. S15).
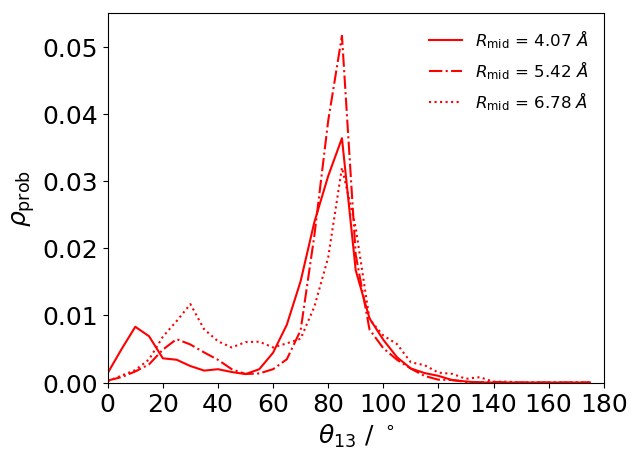
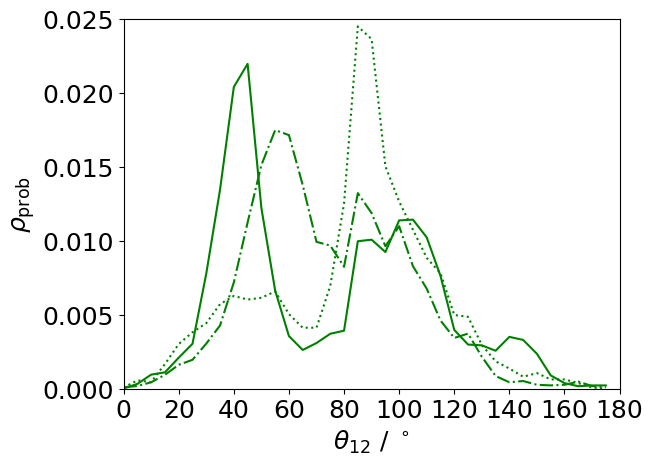
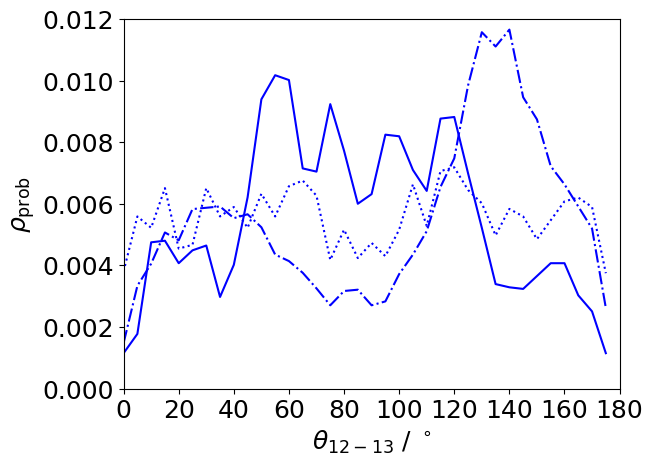
Different preferred angles for [BMI]+ indicate a correlation between the adsorption orientation and the curvature radius. Distinguishing between concave and convex area (Fig. S16 and Fig. S17) illustrates that the dependence is significantly influenced by the concave area. The stronger dependence from concave areas could also be an explanation for the more pronounced fluctuations of the concave differential capacitance. Thus, the [BMI]+ adsorption orientations can be correlated with the number of [BMI]+ molecules adsorbing on the electrode surface, explaining to some extent a capacitance increase by crowding.31 Some orientations favors a higher number of imidazole groups in the double layer, leading to a higher induced charge on the electrode and increased differential capacitance. However, in order to analyze this more accurately, a more sophisticated analysis of the double layer structure at the electrode surface is necessary. For this purpose, free energy changes associated with a change of the ion adsorption motif with varying electrode potential and curvature need to be taken into account. Analyzing the structure of the ions and solvent at different curvatures and electrode potentials using advanced sampling techniques, e.g., umbrella sampling and a weighted histogram analysis, would enable further insights into the mechanisms of the energy storage apparent in realistic carbon electrodes. However, this goes along with an immense computational effort and would require flexible electrodes which are not (yet) possible using the CONP method in LAMMPS.
4 Conclusion
In this work, the influence of convex and concave electrode geometries, that are typically present in electrode materials of modern supercapacitors, on the differential capacitance has been investigated. For this purpose, MD simulations employing a constant potential method were performed on models of electrochemical cells with curved graphitic electrodes and a commonly used organic electrolyte between them. It was observed that the total electrode capacitance fluctuations origin from concave and convex areas of the electrode and their individual differences in their capacitance amplitudes. Furthermore, the total differential capacitance of the entire electrode surface is calculated as the weighted average of both electrode geometries and consequently the impact of the concave area on the total differential capacitance is greater than that of the concave area. For this reason, differential capacitance fluctuations of the total electrode is generally attenuated. However, the higher capacitance of the positive electrode is due to the larger influence of the concave part compared to the negative electrode.
In general, a correlation of the differential capacitance with the total number of ions and solvent in the Helmholtz layer of the electrodes was observed. In more detail, capacitance fluctuations are furthermore explained by a geometric reorientation of the [BMI]+ and to some extent an increase or decrease of the solvation shell. This work aims to improve the performance of supercapacitors by providing a fundamental understanding of the energy storage mechanisms in curved graphitic structures. Thus, by favoring certain electrode geometries in the production process of amorphous carbons, cf. the structure of negatively curved schwarzites32, it is expected to increase the capacitance of supercapacitors with this new generation electrode materials. In this context, design criteria for the structure of electrode surfaces, e.g., a favorable mean curvature radius for a specific organic electrolyte, can be developed.
Funded by the Deutsche Forschungsgemeinschaft (DFG, German Research Foundation) – Projektnummer 192346071 – SFB 986 and – Projektnummer 390794421 – GRK 2462. Furthermore, the authors gratefully acknowledge financial support by the German Ministry of Education and Research in the AktivCAPs project (grant no. 03SF0430B).
The supporting information provides details about the solvation shell calculation as well as further graphic representations for comparison with the presented data.
References
- Simon and Gogotsi 2008 Simon, P.; Gogotsi, Y. Materials for electrochemical capacitors. Nature Materials 2008, 7, 845–854
- Wang et al. 2012 Wang, G.; Zhang, L.; Zhang, J. A review of electrode materials for electrochemical supercapacitors. Chemical Society Reviews 2012, 41, 797–828
- Merlet et al. 2013 Merlet, C.; Rotenberg, B.; Madden, P. A.; Salanne, M. Computer simulations of ionic liquids at electrochemical interfaces. Physical Chemistry Chemical Physics 2013, 15, 15781–15792
- Forse et al. 2016 Forse, A. C.; Merlet, C.; Griffin, J. M.; Grey, C. P. New perspectives on the charging mechanisms of supercapacitors. Journal of the American Chemical Society 2016, 138, 5731–5744
- González et al. 2016 González, A.; Goikolea, E.; Barrena, J. A.; Mysyk, R. Review on supercapacitors: Technologies and materials. Renewable and Sustainable Energy Reviews 2016, 58, 1189–1206
- Lin et al. 2009 Lin, R.; Huang, P.; Ségalini, J.; Largeot, C.; Taberna, P. L.; Chmiola, J.; Gogotsi, Y.; Simon, P. Solvent effect on the ion adsorption from ionic liquid electrolyte into sub-nanometer carbon pores. Electrochimica Acta 2009, 54, 7025–7032
- Merlet et al. 2013 Merlet, C.; Salanne, M.; Rotenberg, B.; Madden, P. A. Influence of solvation on the structural and capacitive properties of electrical double layer capacitors. Electrochimica Acta 2013, 101, 262–271
- Zhang et al. 2009 Zhang, Y.; Feng, H.; Wu, X.; Wang, L.; Zhang, A.; Xia, T.; Dong, H.; Li, X.; Zhang, L. Progress of electrochemical capacitor electrode materials: A review. International Journal of Hydrogen Energy 2009, 34, 4889–4899
- Largeot et al. 2008 Largeot, C.; Portet, C.; Chmiola, J.; Taberna, P. L.; Gogotsi, Y.; Simon, P. Relation between the ion size and pore size for an electric double-layer capacitor. Journal of the American Chemical Society 2008, 130, 2730–2731
- Huang et al. 2008 Huang, J.; Sumpter, B. G.; Meunier, V. A universal model for nanoporous carbon supercapacitors applicable to diverse pore regimes, carbon materials, and electrolytes. Chemistry - A European Journal 2008, 14, 6614–6626
- Feng and Cummings 2011 Feng, G.; Cummings, P. T. Supercapacitor Capacitance Exhibits Oscillatory Behavior as a Function of Nanopore Size. J. Phys. Chem. Lett. 2011, 2, 2859
- Youngseon Shim 2010 Youngseon Shim, H. J. K. Nanoporous Carbon Supercapacitors in an Ionic Liquid. ACS Nano 2010, 4, 2345–2355
- Kondrat et al. 2012 Kondrat, S.; Pérez, C. R.; Presser, V.; Gogotsi, Y.; Kornyshev, A. A. Effect of pore size and its dispersity on the energy storage in nanoporous supercapacitors. Energy and Environmental Science 2012, 5, 6474–6479
- Merlet et al. 2012 Merlet, C.; Rotenberg, B.; Madden, P. A.; Taberna, P.-L.; Simon, P.; Gogotsi, Y.; Salanne, M. On the Molecular Origin of Supercapacitance in Nanoporous Carbon Electrodes. Nat. Mater. 2012, 11, 306
- Jiang et al. 2012 Jiang, D.-e.; Jin, Z.; Henderson, D.; Wu, J. Solvent Effect on the Pore-Size Dependence of an Organic Electrolyte Supercapacitor. The Journal of Physical Chemistry Letters 2012, 3, 1727–1731
- Schweizer et al. 2019 Schweizer, S.; Landwehr, J.; Etzold, B. J.; Meißner, R. H.; Amkreutz, M.; Schiffels, P.; Hill, J. R. Combined Computational and Experimental Study on the Influence of Surface Chemistry of Carbon-Based Electrodes on Electrode-Electrolyte Interactions in Supercapacitors. Journal of Physical Chemistry C 2019, 123, 2716–2727
- Vatamanu et al. 2013 Vatamanu, J.; Hu, Z.; Bedrov, D.; Perez, C.; Gogotsi, Y. Increasing Energy Storage in Electrochemical Capacitors with Ionic Liquid Electrolytes and Nanostructured Carbon Electrodes. The Journal of Physical Chemistry Letters 2013, 4, 2829–2837
- Feng et al. 2013 Feng, G.; Li, S.; Atchison, J. S.; Presser, V.; Cumming, P. T. Molecular Insights into Carbon Nanotube Supercapacitors: Capacitance Independent of Voltage and Temperature. J. Phys. Chem. C 2013, 117, 9178
- Bo et al. 2018 Bo, Z.; Li, C.; Yang, H.; Ostrikov, K.; Yan, J.; Cen, K. Design of Supercapacitor Electrodes Using Molecular Dynamics Simulations. Nano-Micro Letters 2018, 10, 1–23
- Plimpton 1995 Plimpton, S. Fast parallel algorithms for short-range molecular dynamics. Journal of computational physics 1995, 117, 1–19
- Szalay 2010 Szalay, F. I. A. Fast Calculation of DNMR Spectra on CUDA-Enabled Graphics Card. Journal of Computational Chemistry 2010,
- de Tomas et al. 2016 de Tomas, C.; Suarez-Martinez, I.; Marks, N. A. Graphitization of amorphous carbons: A comparative study of interatomic potentials. Carbon 2016, 109, 681–693
- Los and Fasolino 2003 Los, H.; Fasolino, A. Intrinsic long-range bond-order potential for carbon: Performance in Monte Carlo simulations of graphitization. Physical Review B - Condensed Matter and Materials Physics 2003, 68, 24107
- Huo et al. 2007 Huo, Y.; Xia, S.; Ma, P. Densities of Ionic Liquids, 1-Butyl-3-methylimidazolium Hexafluorophosphate and 1-Butyl-3-methylimidazolium Tetrafluoroborate, with Benzene, Acetonitrile, and 1-Propanol at T = (293.15 to 343.15) K. Journal of Chemical & Engineering Data 2007, 52, 2077–2082
- Wang et al. 2014 Wang, Z.; Yang, Y.; Olmsted, D. L.; Asta, M.; Laird, B. B. Evaluation of the constant potential method in simulating electric double-layer capacitors. Journal of Chemical Physics 2014, 141
- Merlet et al. 2011 Merlet, C.; Salanne, M.; Rotenberg, B.; Madden, P. A. Imidazolium ionic liquid interfaces with vapor and graphite: Interfacial tension and capacitance from coarse-grained molecular simulations. Journal of Physical Chemistry C 2011, 115, 16613–16618
- Lu et al. 2017 Lu, P.; Dai, Q.; Wu, L.; Liu, X. Structure and Capacitance of Electrical Double Layers at the Graphene–Ionic Liquid Interface. Applied Sciences 2017, 7
- Yang et al. 2019 Yang, P. Y.; Ju, S. P.; Hsieh, H. S.; Lin, J. S.; Hsieh, J. Y. Electrolytic molecule in-pore structure and capacitance of supercapacitors with nanoporous carbon electrodes: A coarse-grained molecular dynamics study. Computational Materials Science 2019, 166, 293–302
- Vatamanu et al. 2015 Vatamanu, J.; Vatamanu, M.; Bedrov, D. Non-Faradaic Energy Storage by Room Temperature Ionic Liquids in Nanoporous Electrodes. ACS Nano 2015, 9, 5999–6017
- Merlet et al. 2014 Merlet, C.; Limmer, D. T.; Salanne, M.; Van Roij, R.; Madden, P. A.; Chandler, D.; Rotenberg, B. The Electric Double Layer Has a Life of Its Own. Journal of Physical Chemistry C 2014, 118, 18291–18298
- Bazant et al. 2011 Bazant, M. Z.; Storey, B. D.; Kornyshev, A. A. Double layer in ionic liquids: Overscreening versus crowding. Physical Review Letters 2011, 106, 6–9
- Braun et al. 2018 Braun, E.; Lee, Y.; Moosavi, S. M.; Barthel, S.; Mercado, R.; Baburin, I. A.; Proserpio, D. M.; Smit, B. Generating carbon schwarzites via zeolite-templating. Proceedings of the National Academy of Sciences 2018, 115, E8116–E8124