The Koala: A Fast Blue Optical Transient with Luminous Radio Emission from a Starburst Dwarf Galaxy at
Abstract
We present ZTF18abvkwla (the “Koala”), a fast blue optical transient discovered in the Zwicky Transient Facility (ZTF) One-Day Cadence (1DC) Survey. ZTF18abvkwla has a number of features in common with the groundbreaking transient AT 2018cow: blue colors at peak ( mag), a short rise time from half-max of under two days, a decay time to half-max of only three days, a high optical luminosity ( mag), a hot (K) featureless spectrum at peak light, and a luminous radio counterpart. At late times () the radio luminosity of ZTF18abvkwla ( at 10 , observer-frame) is most similar to that of long-duration gamma-ray bursts (GRBs). The host galaxy is a dwarf starburst galaxy (, ) that is moderately metal-enriched (), similar to the hosts of GRBs and superluminous supernovae. As in AT2018cow, the radio and optical emission in ZTF18abvkwla likely arise from two separate components: the radio from fast-moving ejecta () and the optical from shock-interaction with confined dense material ( in ). Compiling transients in the literature with and mag, we find that a significant number are engine-powered, and suggest that the high peak optical luminosity is directly related to the presence of this engine. From 18 months of the 1DC survey, we find that transients in this rise-luminosity phase space are at least two to three orders of magnitude less common than CC SNe. Finally, we discuss strategies for identifying such events with future facilities like the Large Synoptic Survey Telescope, and prospects for detecting accompanying X-ray and radio emission.
1 Introduction
Historically, the cadence of optical time-domain surveys was tuned to detecting Type Ia supernovae (SNe), whose optical light curves rise from first light to peak in 15–20 days (Miller et al., 2020). Recognizing that this observing strategy resulted in “gaps” in timescale-luminosity phase-space, surveys such as the Palomar Transient Factory (Law et al., 2009; Rau et al., 2009) and the Pan-STARRS1 Medium Deep Survey (Drout et al., 2014) sought to systematically chart the landscape of short-timescale (day) phenomena. These efforts delineated populations of fast transients spanning many orders of magnitude in peak luminosity, from faint calcium-rich transients (Kasliwal et al., 2012) to luminous relativistic explosions (Cenko et al., 2013).
A population of particular recent interest is “fast evolving luminous transients” (Rest et al., 2018) or “fast blue optical transients” (Margutti et al., 2019). A consistent definition of this “class” does not yet exist; these terms typically refer to transients with rise times and peak luminosities too fast and too luminous, respectively, to be explained by the radioactive decay of . Although they likely arise from a variety of progenitors, fast-luminous transients are primarily found in star-forming galaxies (Drout et al., 2014; Pursiainen et al., 2018) and therefore are thought to represent a variety of poorly understood endpoints of massive-star evolution. As summarized in Kasen (2017), fast and luminous light curves may be powered by shock breakout or shock-cooling emission from material that is closely confined to the progenitor star at the time of explosion, or alternatively by a “central engine:” accretion onto a black hole, or the rotational spindown of a magnetar.
Most fast-luminous optical transients have been found in archival searches of optical-survey data, including PS1 (Drout et al., 2014), the Dark Energy Survey (Pursiainen et al., 2018), Kepler (Rest et al., 2018), and the Supernova Legacy Survey (Arcavi et al., 2016). A handful have been discovered while the transient was still active, enabling prompt follow-up observations. For example, spectroscopic monitoring of the fast-luminous transients iPTF16asu and ZTF18abukavn (SN 2018gep) revealed that as the optical emission faded, the spectrum developed features typical of broad-lined Ic SNe (Whitesides et al., 2017; Wang et al., 2019; Ho et al., 2019b).
The discovery of the fast-luminous transient AT2018cow (Prentice et al., 2018) generated considerable excitement because of its proximity () and therefore the opportunity for detailed observations. AT2018cow had several remarkable features: (1) near-relativistic ejecta velocities at early times, from optical spectroscopy (Perley et al., 2019a); (2) luminous and fast-varying X-ray emission suggesting an exposed central engine (Rivera Sandoval et al., 2018; Ho et al., 2019a; Margutti et al., 2019); (3) high-velocity emission lines of hydrogen and helium emerging at late times (Perley et al., 2019a); (4) no second peak that would indicate a significant role for radioactive ejecta in powering the light curve (Perley et al., 2019a); and (5) luminous submillimeter emission indicating a large explosion energy injected into a shell of very dense material (Ho et al., 2019a; Huang et al., 2019). Despite extensive observations across the electromagnetic spectrum, the progenitor of AT2018cow is unknown. One suggestion is a massive-star explosion that resulted in the formation of an accreting black hole or magnetar, which drove a mildly relativistic jet or wind (Perley et al., 2019a; Margutti et al., 2019; Ho et al., 2019a). Other suggestions include an electron-capture SN (Lyutikov, & Toonen, 2019) and a tidal disruption event (TDE; Vinkó et al. 2015; Perley et al. 2019a; Kuin et al. 2019). If AT2018cow was a massive-star explosion, the dense confined CSM points to eruptive mass-loss shortly before core-collapse (Ho et al., 2019a), and indeed Fox & Smith (2019) pointed out the similarity between AT2018cow and interaction-powered Type Ibn SNe.
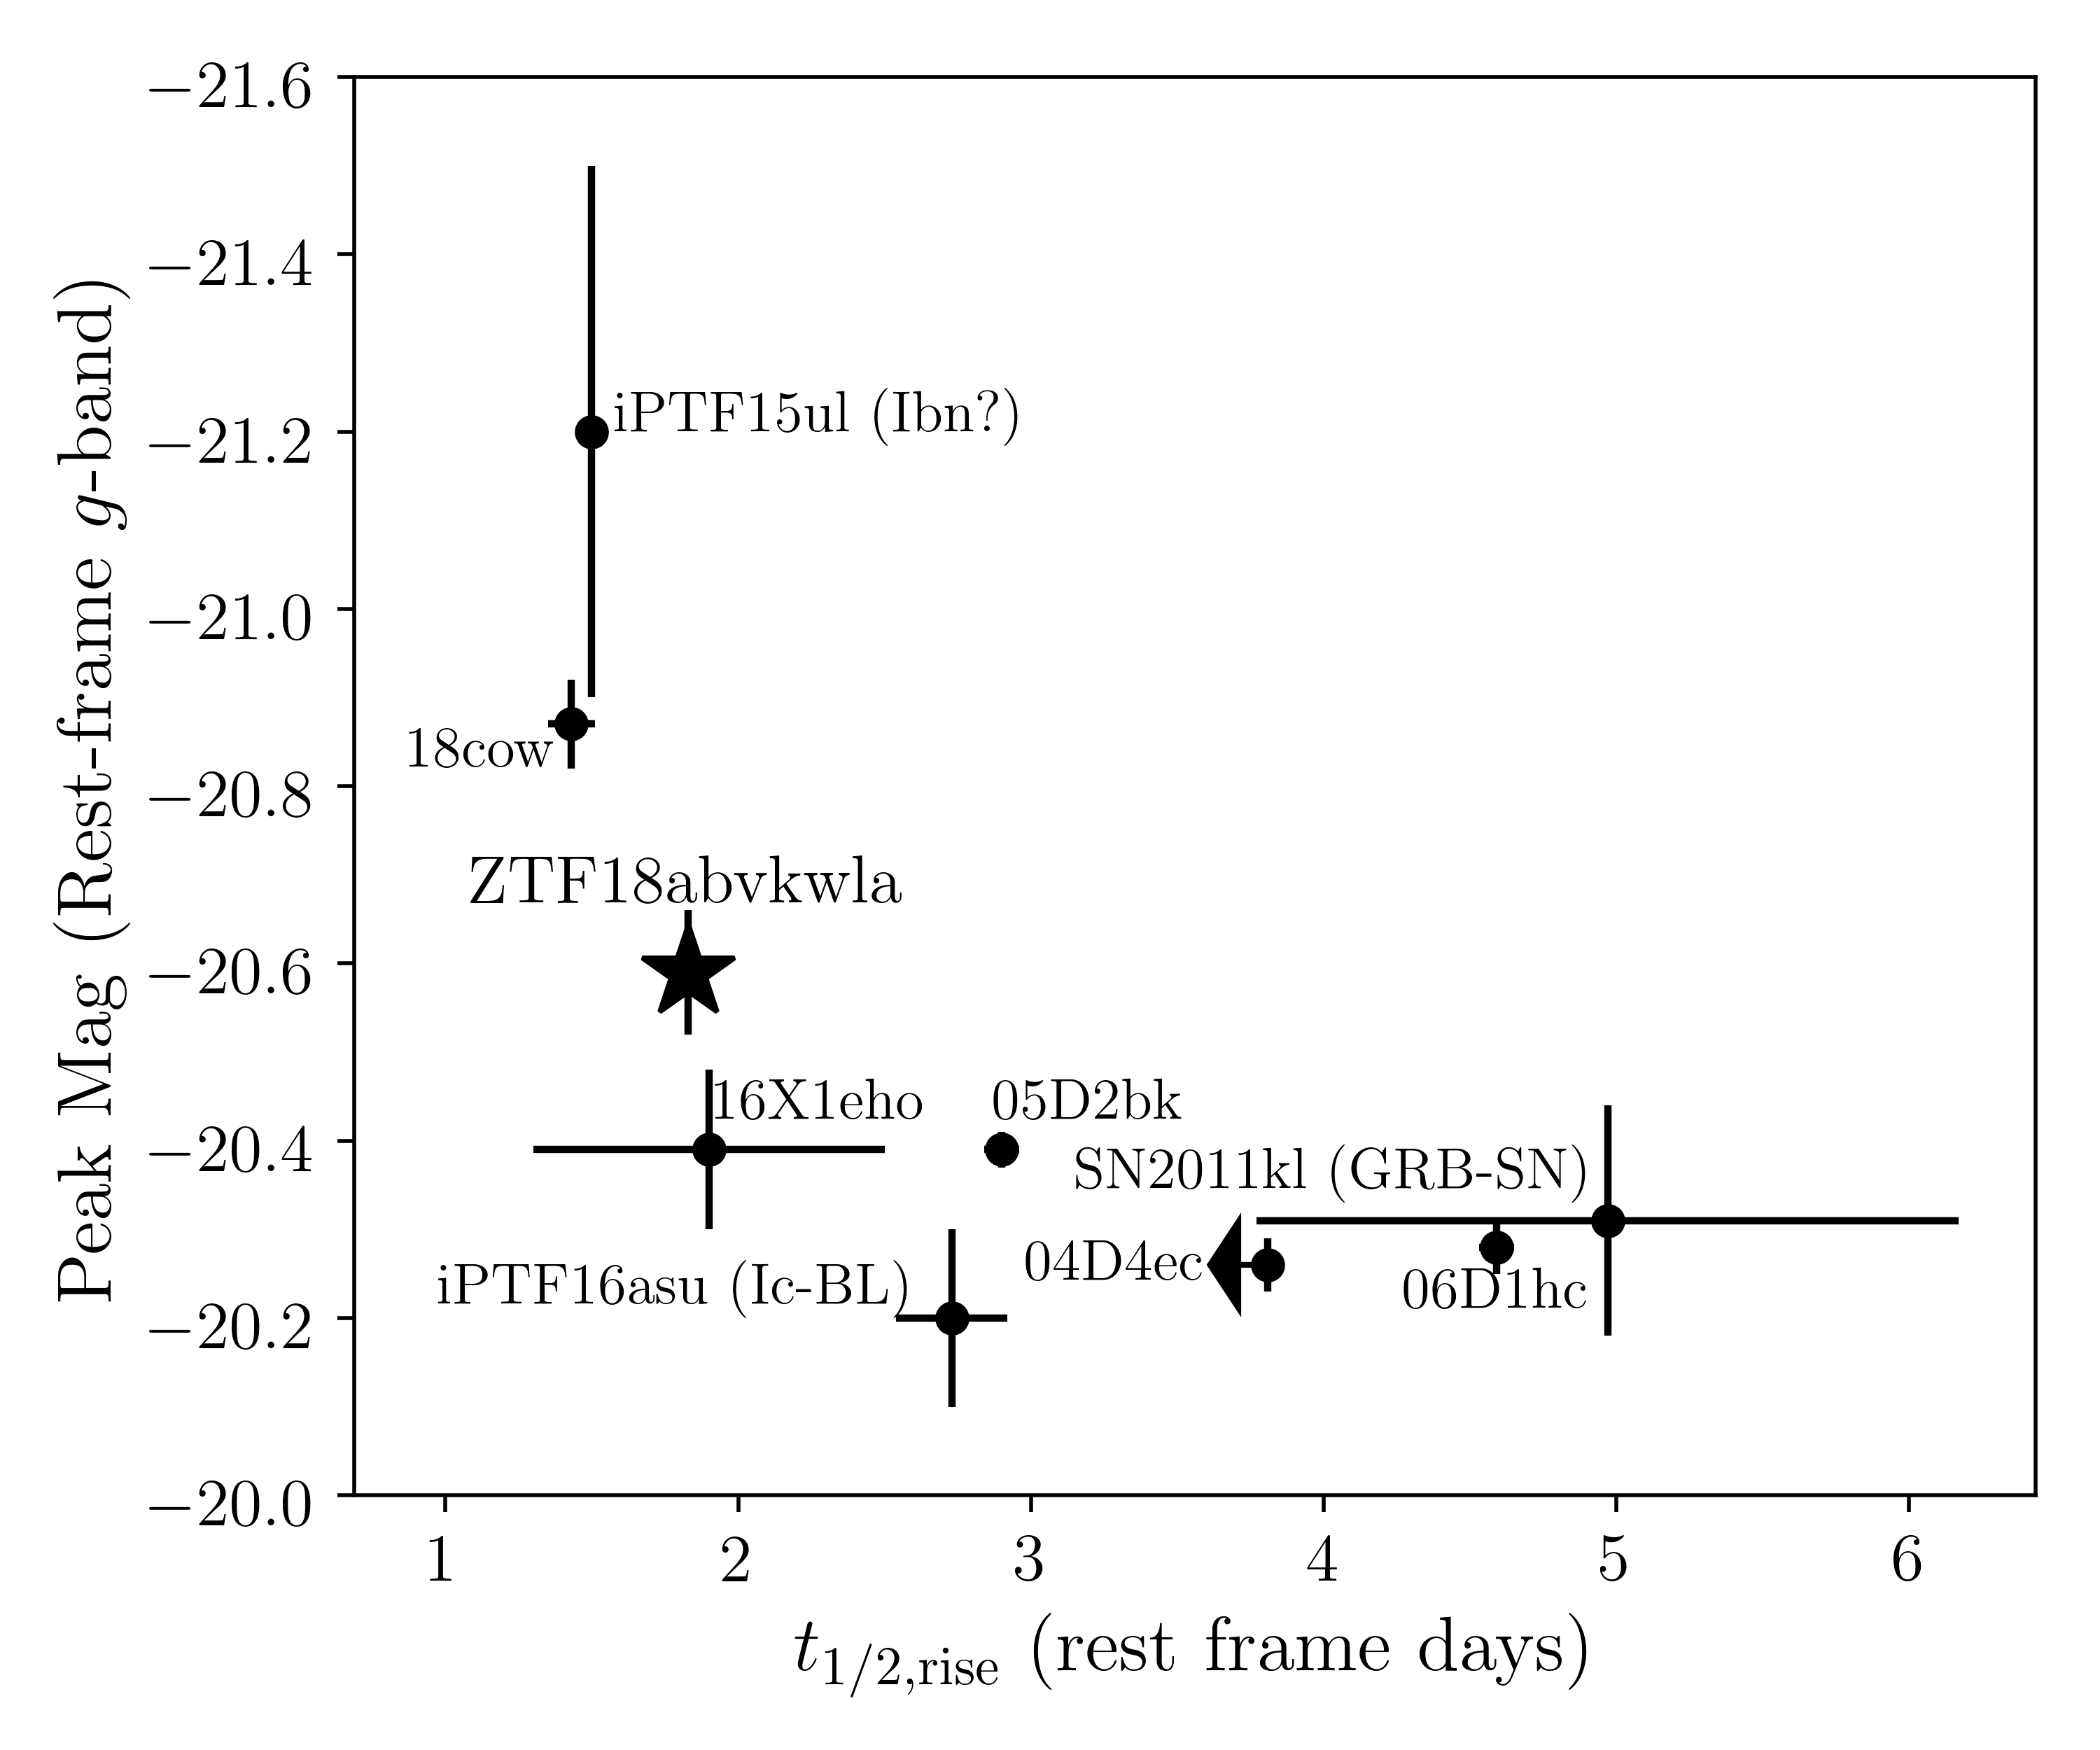
Here we report the discovery in Zwicky Transient Facility (ZTF) data of ZTF18abvkwla111nicknamed “Koala” on account of the last four letters of its ZTF ID, a fast-rising luminous optical transient at .222After the submission of our paper, Coppejans et al. (2020) published radio and X-ray observations of CSS161010, another transient in a dwarf galaxy with properties similar to AT2018cow. In §2 we present the key observational features of ZTF18abvkwla—a rest-frame -band light curve similar to that of AT2018cow, a luminous radio counterpart similar to gamma-ray burst (GRB) afterglows, and a starburst dwarf host galaxy. In §3 we compare ZTF18abvkwla to transients in the literature that have and mag, where is defined from 0.75 mag below peak to peak (half-max to max in flux space). We use a cut of mag to exclude “normal” Type Ibn SNe (Hosseinzadeh et al., 2017) and we exclude the hundreds of optical afterglows discovered in GRB follow-up observations (Kann et al., 2010). The comparison sample is shown in Table 1 and Figure 1. Note that the Table 1 transients have thermal spectra at peak, unlike GRB afterglows which arise from synchrotron radiation.
| Dougie | 0.19 | [1] | |||
| SN 2011kl | 0.677 | [2,3] | |||
| SNLS04D4ec | 0.593 | [4] | |||
| SNLS05D2bk | 0.699 | [4] | |||
| SNLS06D1hc | 0.555 | [4] | |||
| iPTF15ul | 0.066 | [5] | |||
| DES16X1eho | 0.76 | 1.28–2.53 | [6] | ||
| iPTF16asu | 0.187 | [7] | |||
| AT2018cow | 0.0141 | [8,9] |
In §4.1 we model the optical emission from ZTF18abvkwla as thermal emission from shock breakout in dense confined material, and in §4.2 we use the radio emission to estimate properties of the forward shock (velocity, shock energy) and the ambient medium. In §4.3, we discuss possible progenitor systems. Finally, in §5 we use 18 months of survey observations to estimate the rate of transients in the phase-space of Figure 1, and find that the rate is 2–3 times smaller than the CC SN rate.
Throughout this paper, we use a standard CDM cosmology (Planck Collaboration et al., 2016) and times are reported in UT. Optical magnitudes are reported in the AB system (Oke, & Gunn, 1983), and corrected for foreground Galactic extinction using reddening measurements in Schlafly & Finkbeiner (2011) and the extinction law from Fitzpatrick (1999).
2 Discovery and Basic Analysis
2.1 Optical
2.1.1 Photometry
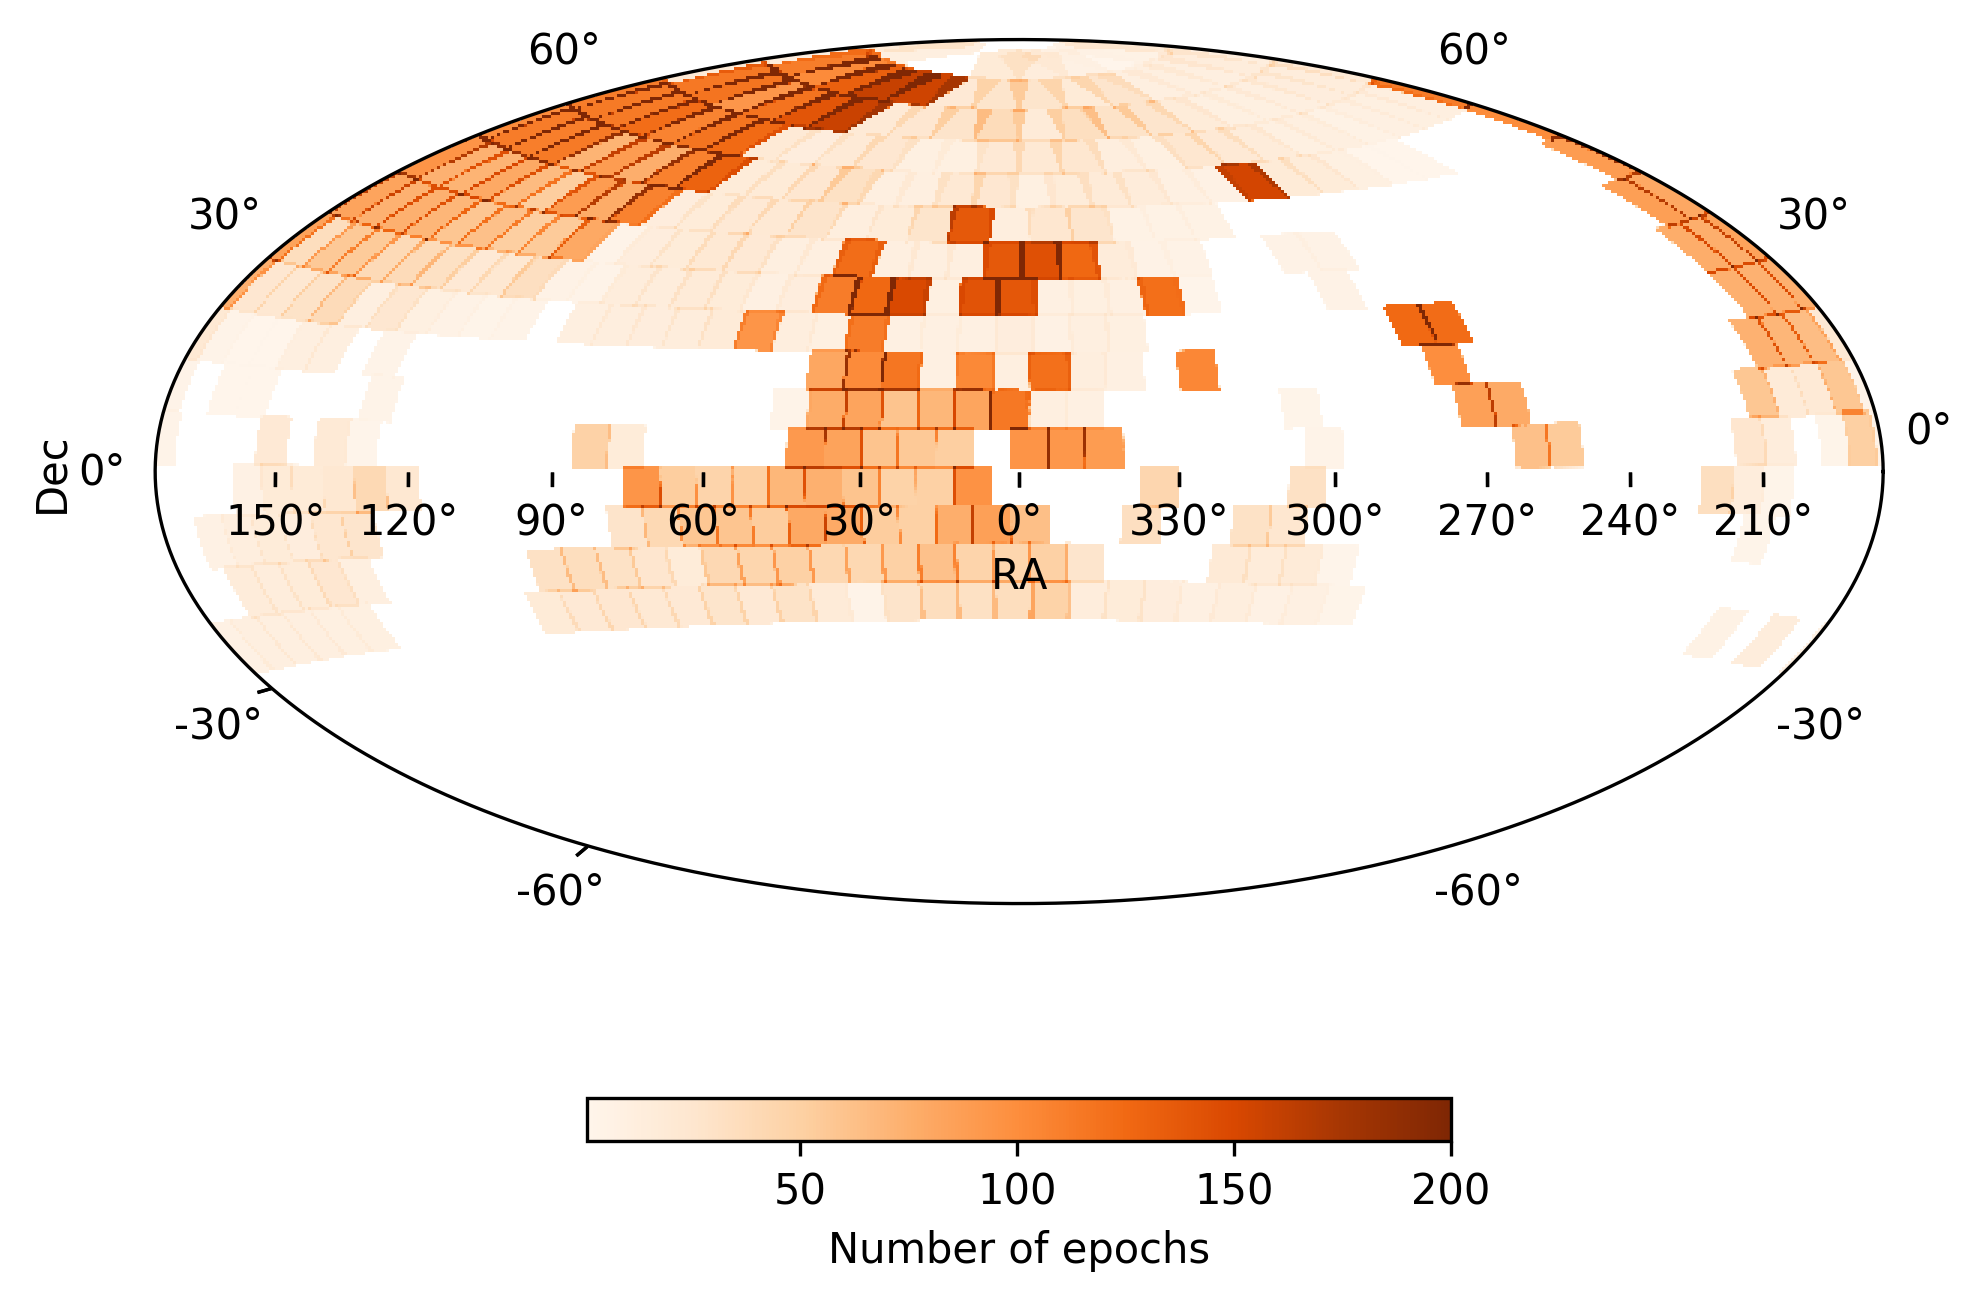
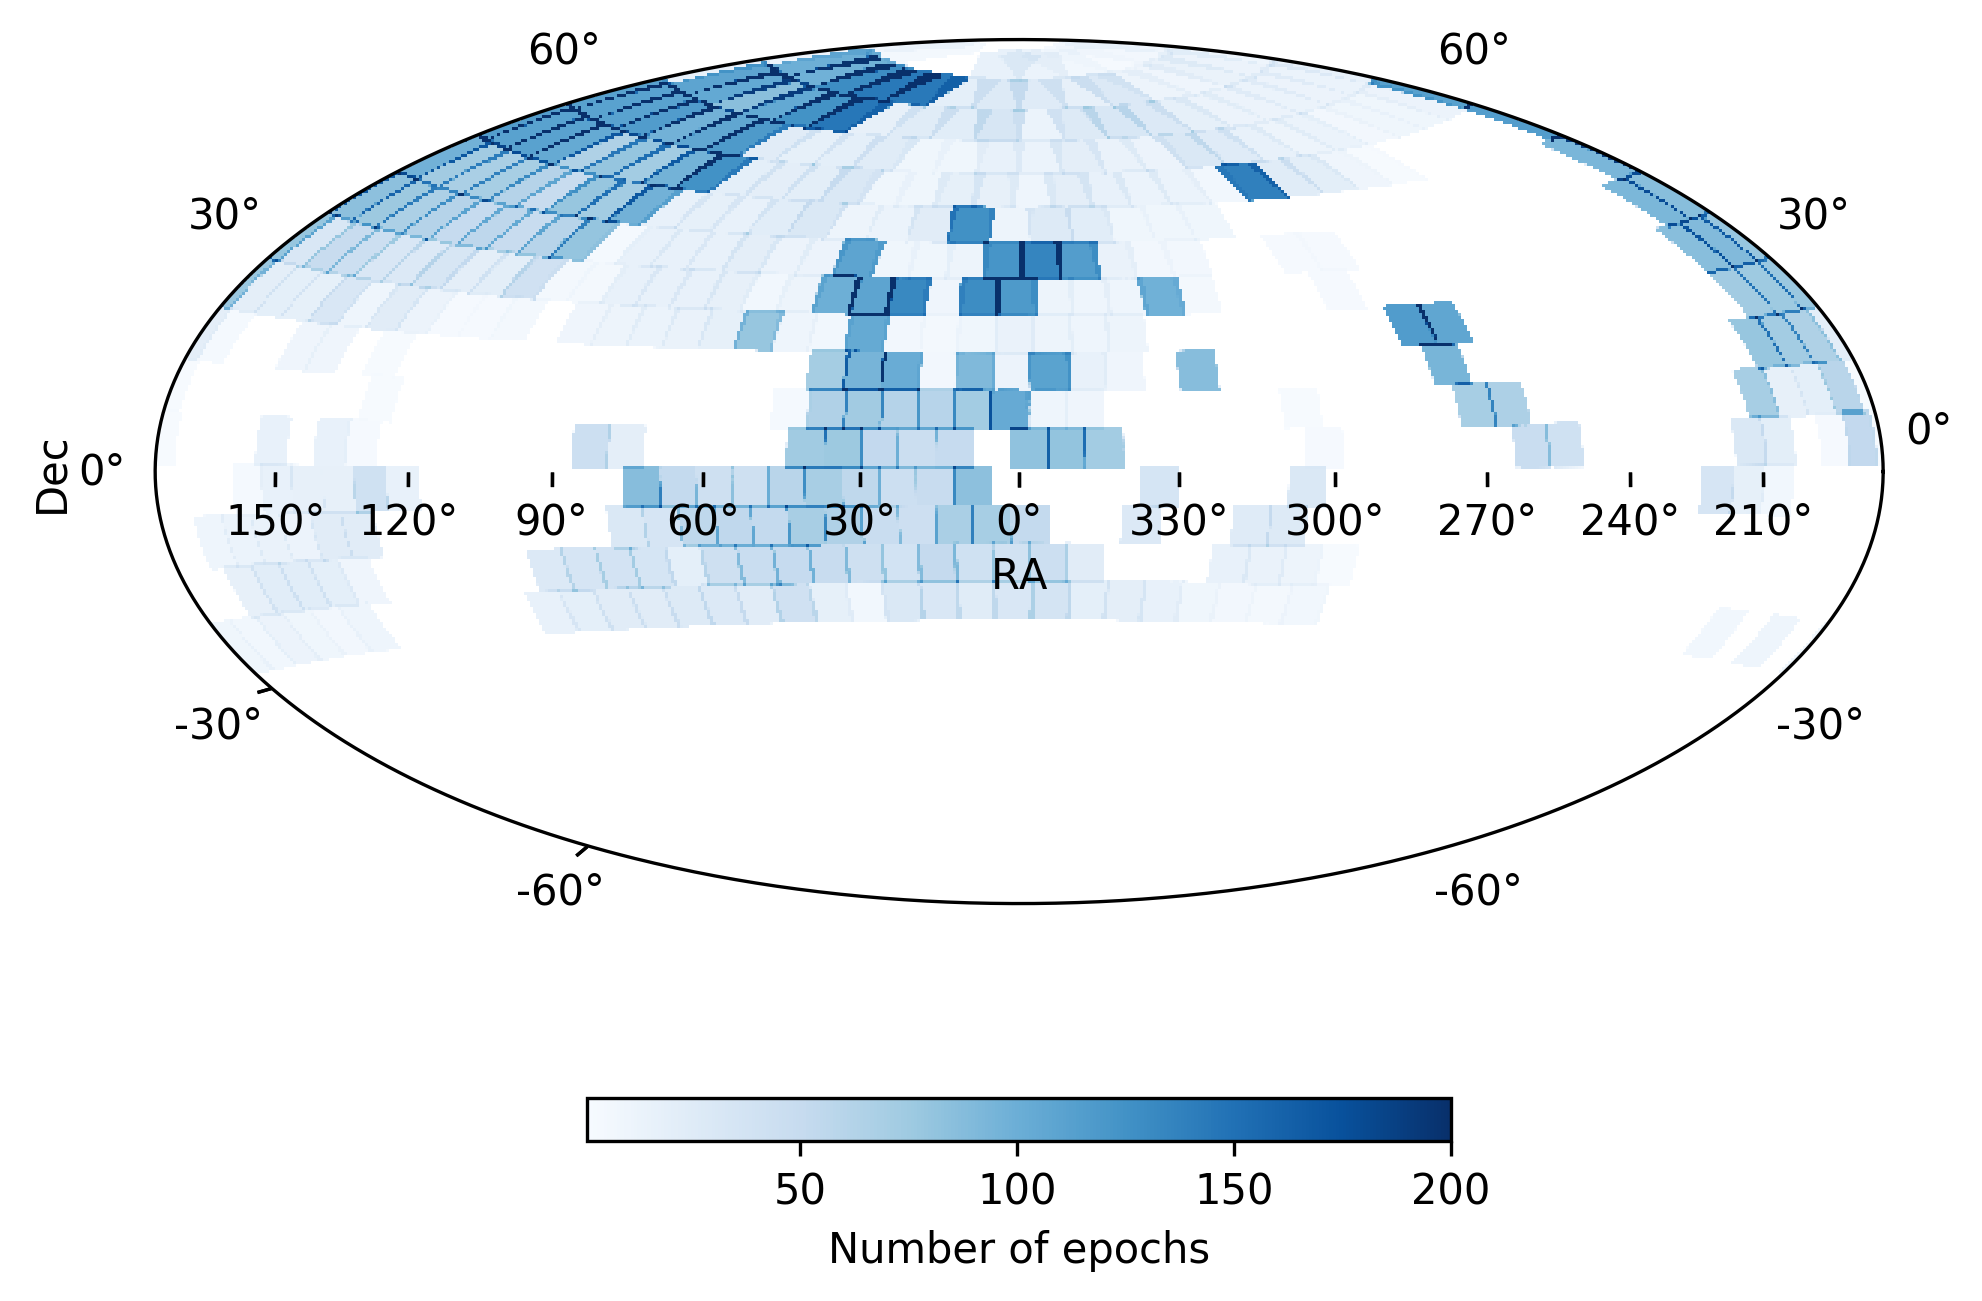
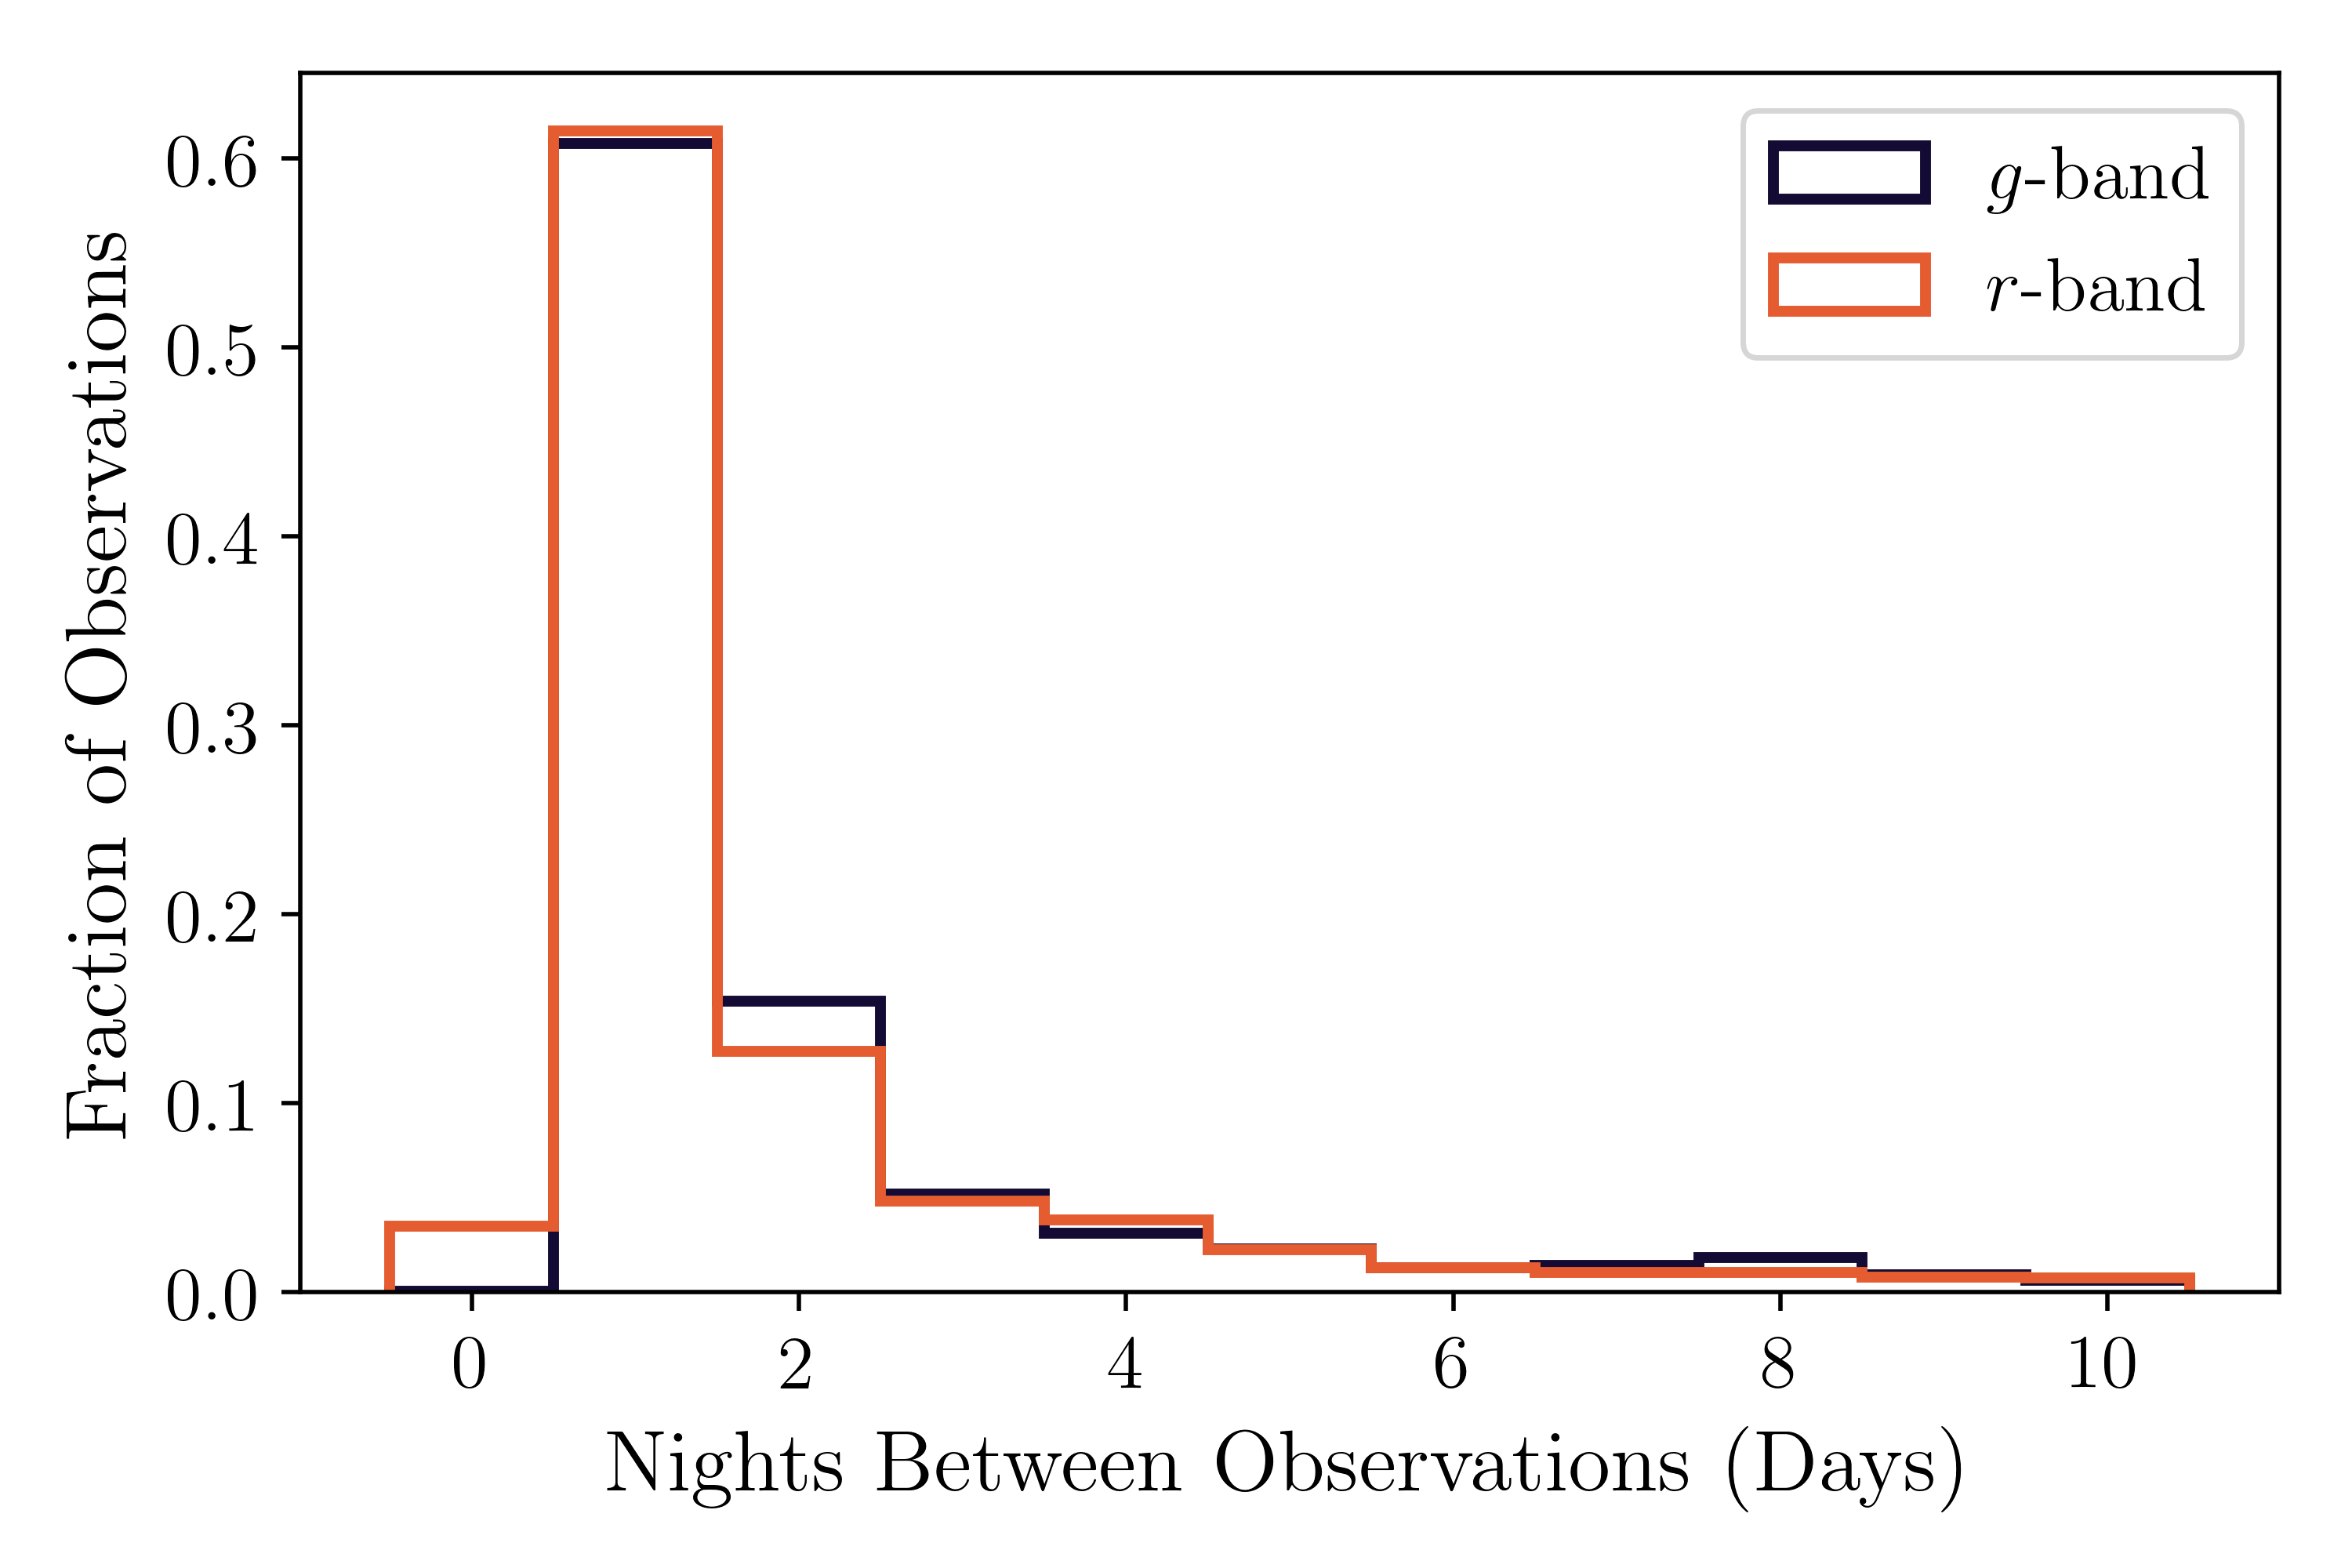
Since April 2018, ZTF (Bellm et al., 2019a; Graham et al., 2019) has been conducting a wide-area (2000–3000 ) one-day cadence (1DC) survey in and (Bellm et al., 2019). The sky coverage of the 1DC survey is shown in Figure 2 and a histogram of the typical time between exposures is shown in Figure 3.
The IPAC ZTF pipeline (Masci et al., 2019) uses the method described in Zackay et al. (2016) to generate difference images using a coadded reference image. Every 5 point-source detection is assigned a score based on a machine learning real-bogus metric (Mahabal et al., 2019; Duev et al., 2019), and is cross-matched against external catalogs to search for resolved and extended counterparts (Tachibana & Miller, 2018). Alerts are distributed in Avro format (Patterson et al., 2019) and are filtered by the ZTF collaboration using a web-based system called the GROWTH Marshal (Kasliwal et al., 2019).
ZTF18abvkwla was discovered in an image obtained on 12 Sept 2018. The alert passed a filter designed to look for rapidly-evolving transients, and as a result we obtained a follow-up spectrum 24 hours later (§2.1.2). The discovery magnitude was mag and the last non-detection was one day prior, with a limiting magnitude .
The source position was measured to be , (J2000), which is from the nucleus of a blue (mag) extended source that has a photometric redshift of 0.11 (68 percentile confidence interval 0.08–0.29) in the eighth data release of LegacySurvey (DR8; Dey et al. 2019). At (§2.1.2) this offset corresponds to . The host is approximately (14 ) across.
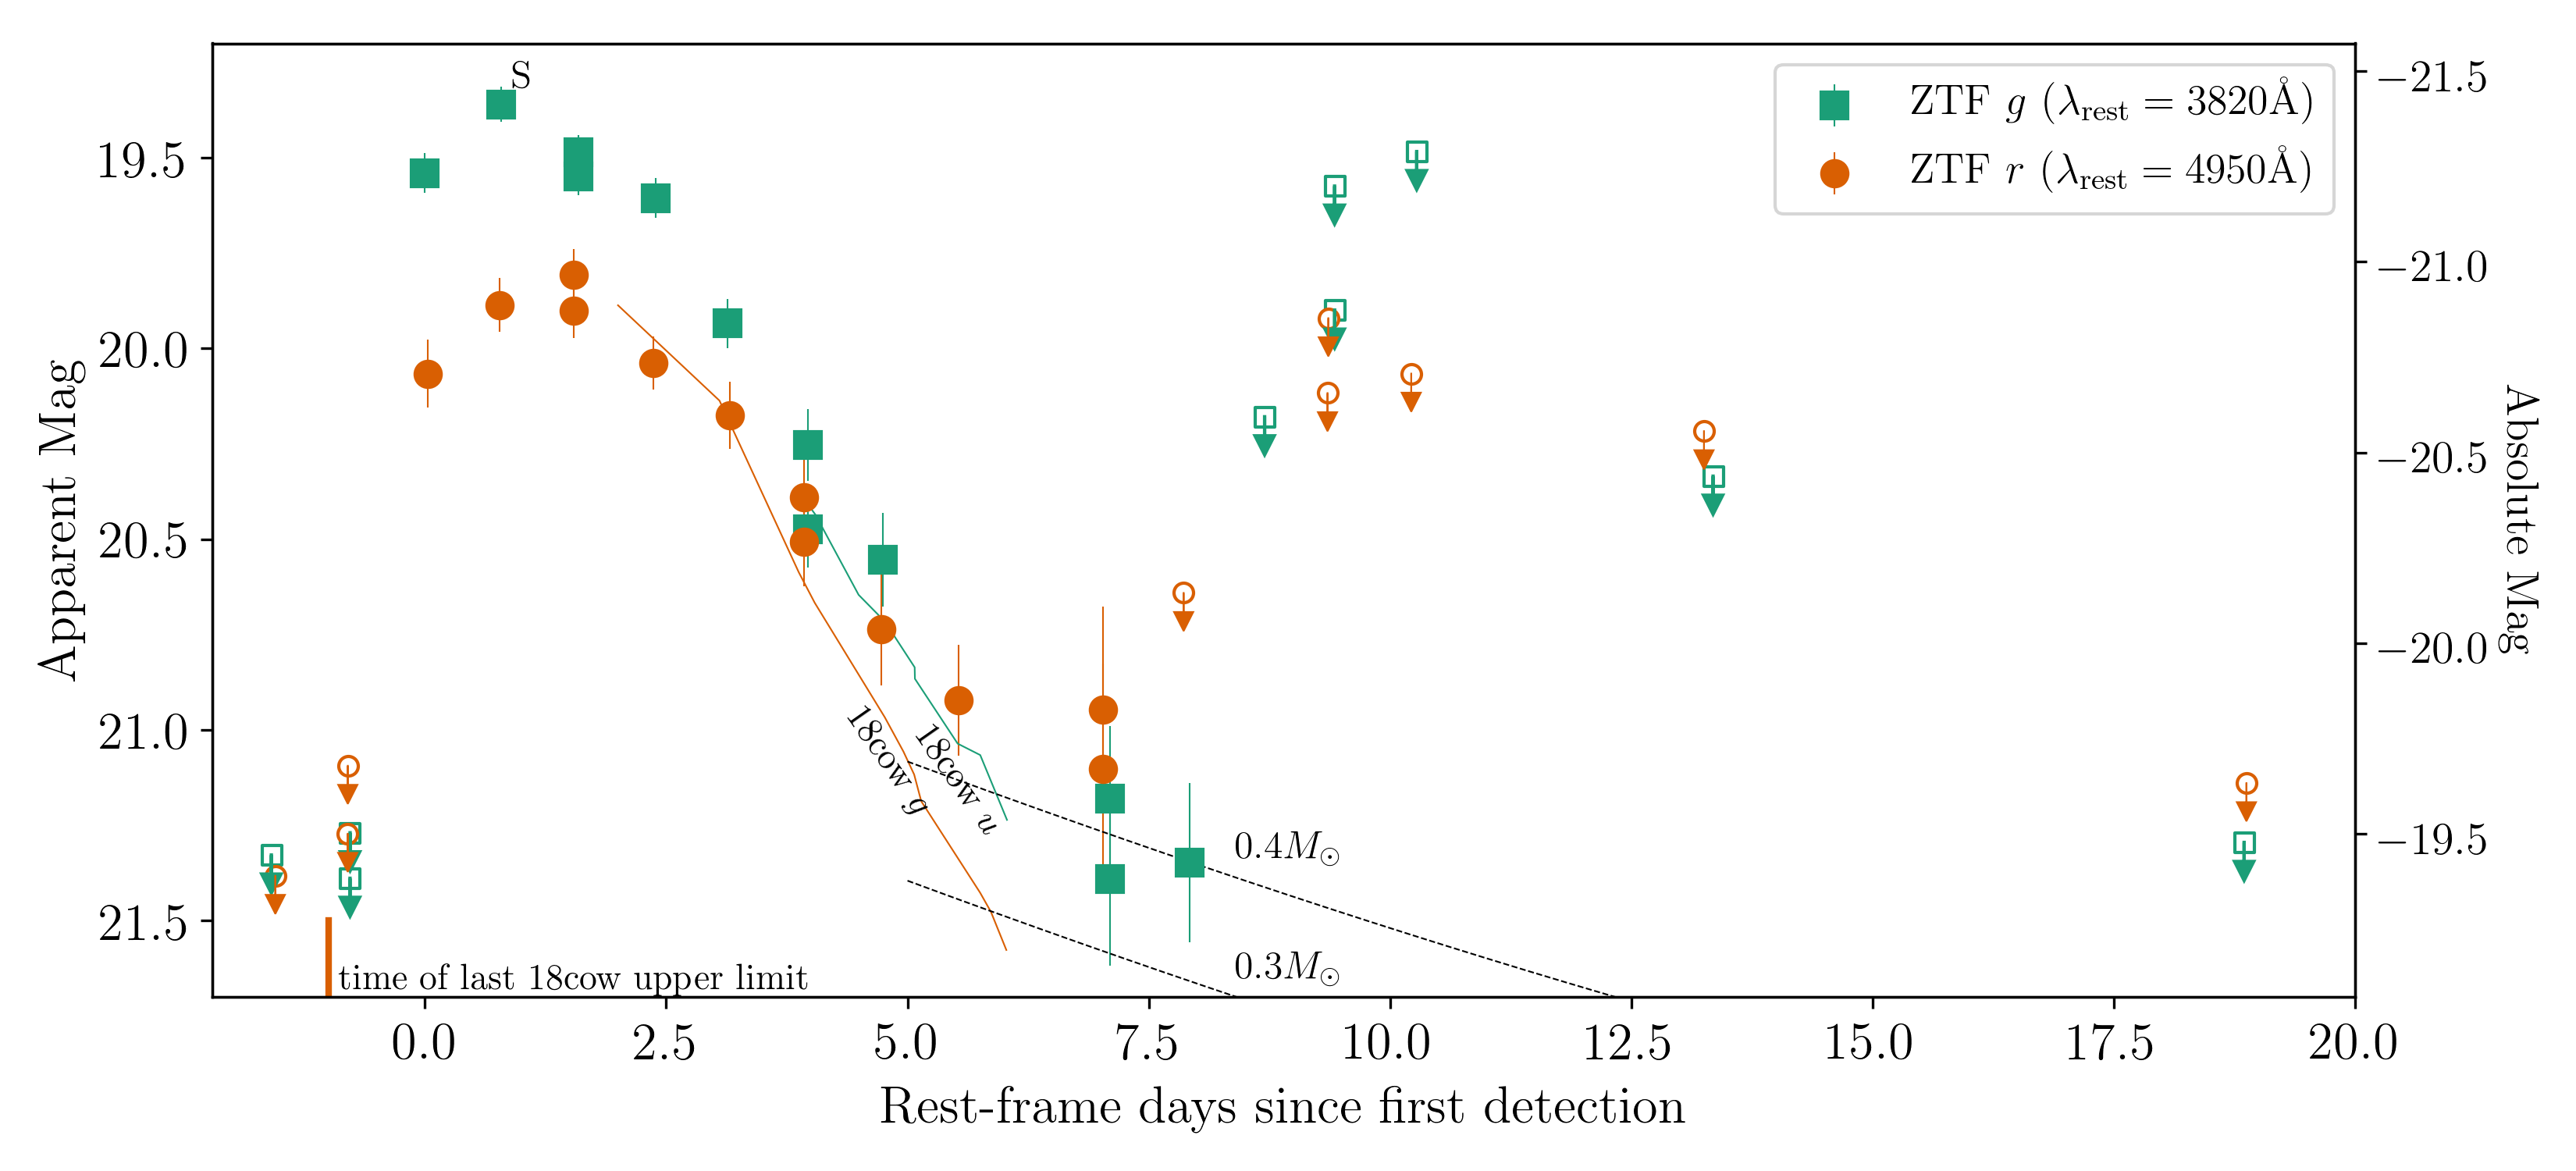
The light curve (Figure 4; Table 2) has a similar timescale and peak luminosity to that of AT2018cow. In rest-frame -band, the rise time is , the fade time is , and the peak magnitude is mag.
| Date (MJD) | Filter | AB Mag | |
|---|---|---|---|
| 58372.39 | |||
| 58372.42 | |||
| 58373.41 | 0.00 | ||
| 58373.45 | 0.04 | ||
| 58374.39 | 0.98 | ||
| 58374.41 | 1.00 | ||
| 58375.37 | 1.96 | ||
| 58375.37 | 1.96 | ||
| 58375.43 | 2.03 | ||
| 58375.43 | 2.03 | ||
| 58376.42 | 3.01 | ||
| 58376.44 | 3.04 | ||
| 58377.39 | 3.98 | ||
| 58377.43 | 4.02 | ||
| 58378.40 | 4.99 | ||
| 58378.40 | 4.99 | ||
| 58378.45 | 5.04 | ||
| 58378.45 | 5.05 | ||
| 58379.42 | 6.02 | ||
| 58379.44 | 6.04 | ||
| 58380.43 | 7.03 | ||
| 58382.34 | 8.93 | ||
| 58382.34 | 8.93 | ||
| 58382.43 | 9.03 | ||
| 58382.43 | 9.03 | ||
| 58383.48 | 10.07 |
We estimate that the onset of the optical emission was around the time of the last non-detection ( JD) and use this as a reference epoch for the remainder of the paper.
2.1.2 Spectroscopy and Host Galaxy Properties
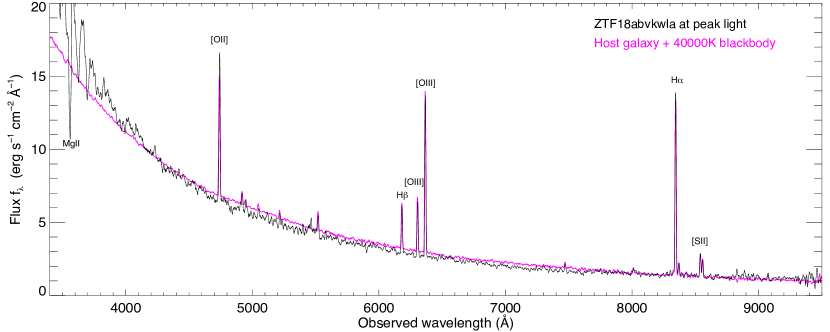
One day after discovery, we obtained a spectrum of ZTF18abvkwla using the Double Beam Spectrograph (DBSP; Oke & Gunn 1982) on the 200-inch Hale telescope at Palomar Observatory. We used the D55 dichroic, a slit width of 1.5 arcseconds, the 600/4000 blue grating, and the 316/7500 red grating. The spectrum was reduced using a PyRAF-based pipeline (Bellm & Sesar, 2016). As shown in Figure 5, the spectrum shows a hot blue continuum with no broad features in emission or absorption. Superimposed on the spectrum are a variety of narrow emission lines typical of a star-forming galaxy (H, H, O III, S II, O II) at a redshift of plus the Mg II UV doublet in absorption at consistent redshift.
A blackbody fit to the continuum (after subtracting a host-galaxy continuum model, discussed later in this section) indicates an effective temperature K, although we caution that it could be significantly higher as the bulk of the energy was clearly emitted in the UV (Å in the rest frame) and we have no firm constraint on the host-galaxy extinction. Together with the peak absolute magnitude of the -band light curve, we derive a bolometric luminosity of . Assuming K, the photospheric radius is . Since the peak is 2 after first light, assuming gives .
On 4 Jan 2019 (+115 ), we obtained a spectrum of the host galaxy of ZTF18abvkwla using the Low Resolution Imaging Spectrometer (Oke et al., 1995; McCarthy et al., 1998) on the Keck I 10-m telescope, with the 400/3400 grism in the blue camera and the 400/8500 grating in the red camera. Exposure times were 940 and 900 seconds for the blue and red camera respectively. The spectrum was reduced and extracted using Lpipe (Perley, 2019). The absolute calibration was established independently for each camera (red vs. blue) by calculating synthetic photometry of the output spectra in the blue and red cameras in the and bands, respectively, and rescaling to match the and photometry from SDSS DR14 (Abolfathi et al., 2018). The SDSS magnitudes (AB, converted to Pogson) are , , , , and .
The host-galaxy spectrum (Figure 6) consists of a weak continuum and a series of very strong emission lines. Line fluxes were extracted using an identical procedure as in Perley et al. (2016). We first fit a model to the spectral energy distribution (SED). We used a custom IDL routine based on the templates of Bruzual & Charlot (2003) to fit the SDSS photometry, including the contribution of nebular lines. As only SDSS photometry is available to fit the host-galaxy SED it is difficult to constrain the nature of the stellar population of the host galaxy in detail, and we were only able to fit the simplest possible model (a continuous star-formation history). However, the stellar mass is unambiguously low (, comparable to the SMC),
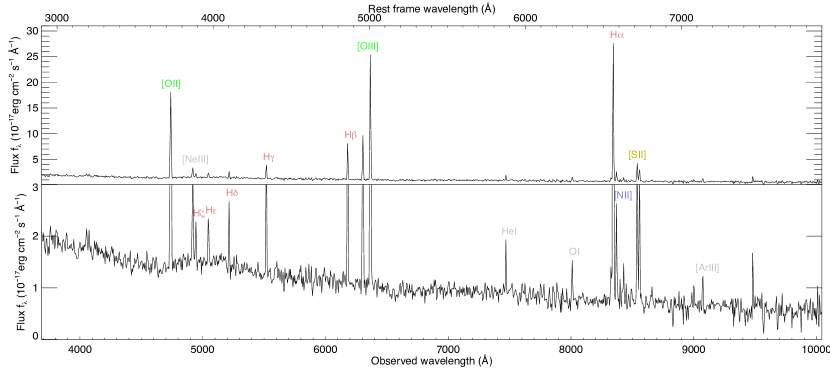
This model was then used to produce a synthetic galaxy continuum spectrum, which was subtracted from the observed one (this correction is significant only for higher-order Balmer lines, which overlay strong galaxy absorption features). Emission line fluxes were then measured by fitting a Gaussian function to each emission line (plus a linear baseline to fit any continuum residuals). Lines that were blended or very nearby were fit in groups, and lines whose ratios are fixed from theory were tied together in fitting. A list of all measured line fluxes is given in Table 3.
| Species | Wavelength | Flux | Eq. Width |
|---|---|---|---|
| (Å) | (erg cm-2s | (Å) | |
| H | 6562.82 | 214.74 2.71 | 205.9 7.0 |
| H | 4861.33 | 57.57 1.07 | 41.3 1.1 |
| H | 4340.47 | 26.98 1.03 | 17.6 0.8 |
| H | 4101.74 | 13.92 0.91 | 7.2 0.5 |
| H | 3970.08 | 11.44 0.86 | 5.9 0.4 |
| H | 3889.06 | 9.72 0.88 | 5.0 0.5 |
| [O ii] | 3727 | 159.44 1.72 | 89.0 2.4 |
| [Ne iii] | 3868.76 | 16.00 0.94 | 8.3 0.5 |
| [O iii] | 4363.21 | 3.31 | 2.1 |
| [O iii] | 4958.91 | 66.35 1.37 | 47.6 1.4 |
| [O iii] | 5006.84 | 196.88 1.60 | 141.3 3.1 |
| He i | 5875.62 | 6.76 0.72 | 5.7 0.6 |
| [N ii] | 6548.06 | 4.90 0.69 | 4.7 0.7 |
| [N ii] | 6583.57 | 13.91 0.82 | 13.3 0.9 |
| [S ii] | 6716.44 | 27.86 0.95 | 29.3 1.2 |
| [S ii] | 6730.82 | 21.81 0.71 | 22.9 0.9 |
| O i | 6300.30 | 6.76 0.71 | 7.2 0.8 |
| [Ar iii] | 7135.79 | 5.49 0.53 | 6.8 0.7 |
The SED fitting and the emission-line analysis produce consistent estimates of for the star-formation rate, and a very high specific star-formation rate of 10. This implies a stellar population dominated by young stars formed in a recent triggered star-formation burst episode.
We used the host galaxy spectrum (Figure 6) to calculate standard emission-line diagnostics, including metallicity estimates on a variety of scales using the Monte-Carlo code of Bianco et al. (2016). These metallicity measurements are provided in Table 4. The basic properties of the host galaxy are listed in Table 5.
| SFR | |
|---|---|
| E(B-V) | |
| logR23 | |
| D02 | |
| Z94 | |
| M91 | |
| PP04_N2Ha | |
| PP04_O3N2 | |
| P10_ONS | |
| P10_ON | |
| M08_N2Ha | |
| M08_O3O2 | |
| M13_O3N2 | |
| M13_N2 | |
| KD02_N2O2 | |
| KK04_N2Ha | |
| KK04_R23 | |
| KD02comb |
| Stellar mass | M | 5.1 |
|---|---|---|
| Star-formation rate | SFR | 6.8 |
| Maximum age | age | 7.5 yr |
| Extinction | Av | 0.72 mag |
| /dof | 1.6 / 2 | |
| Metallicity | 12+log[O/H] | 8.5 |
2.2 Radio Observations
We obtained four epochs of observations of ZTF18abvkwla using the Karl G. Jansky Very Large Array (VLA; Perley et al. 2011) under the program VLA/18B-242 (PI: D. Perley), listed in Table 6. The first epoch was at at X-band, while the VLA was in C configuration. We used 3C138 as our flux density and bandpass calibrator, and J0204+1514 as our complex gain calibrator. The next three epochs were at , , and , all while the VLA was in A configuration. We continued to use 3C138 but switched to J0238+1636 as our complex gain calibrator. For each observation, we ran the standard VLA calibration pipeline available in the Common Astronomy Software Applications (CASA; McMullin et al. 2007). After calibration, we inspected the data manually for further flagging. We imaged the data using the CLEAN algorithm (Högbom, 1974) available in CASA, using a cell size that was 1/5 of the synthesized beamwidth. The field size was set to be the smallest magic number () larger than the number of cells needed to cover the primary beam.
| Facility | Obs. Date | Config. | Flux Density | ||
|---|---|---|---|---|---|
| days | (UT) | (GHz) | (mJy) | ||
| 81 | VLA | 2018-12-01 | C | 10 | |
| 188 | VLAa | 2019-03-19 | B | 3 | |
| 310 | VLA | 2019-07-19 | BnA | 10 | |
| 343 | VLA | 2019-08-21 | A | 6 | |
| 346 | VLA | 2019-08-24 | A | 3 | |
| 351 | VLA | 2019-08-29 | A | 1.5 | |
| 352 | VLA | 2019-08-30 | A | 10 | |
| 364 | GMRT | 2019-09-11 | – | 0.6 | |
| 396 | VLA | 2019-10-13 | A | 10 | |
| 397 | VLA | 2019-10-14 | A | 6 |
In addition, the position of ZTF18abvkwla was serendipitously covered by the VLA Sky Survey (VLASS; Lacy et al. 2019), which has been mapping the entire sky visible to the VLA at low frequencies (2–4 GHz) in three epochs at a cadence of 32 months. The Quicklook images are now available for the first epoch (17,000 deg-2). We searched the existing Quicklook data using code available on Github333https://github.com/annayqho/Query_VLASS that locates the appropriate VLASS tile and subtile for a given RA and Dec and extracts a cutout 12 arcsec on a side. Given a non-detection we estimated an upper limit on the flux density by taking the standard deviation of the pixel values in this cutout, after performing initial 3 clipping (removing pixels with a value greater than the standard deviation). The VLASS observation of ZTF18abvkwla is also listed in Table 6.
We obtained one epoch of observations with the upgraded Giant Metrewave Radio Telescope (GMRT; Gupta et al. 2017; Swarup et al. 1991) under a proposal for Director’s Discretionary Time (Proposal # ddtC086; PI: A. Ho). For our GMRT observations, we used 3C147 and 3C48 as our flux density and bandpass calibrators and 0238+166 for our phase calibrator. We calibrated the GMRT data manually using commands in CASA, with 6 rounds of phase-only self-calibration and 2 rounds of amplitude and phase self-calibration.
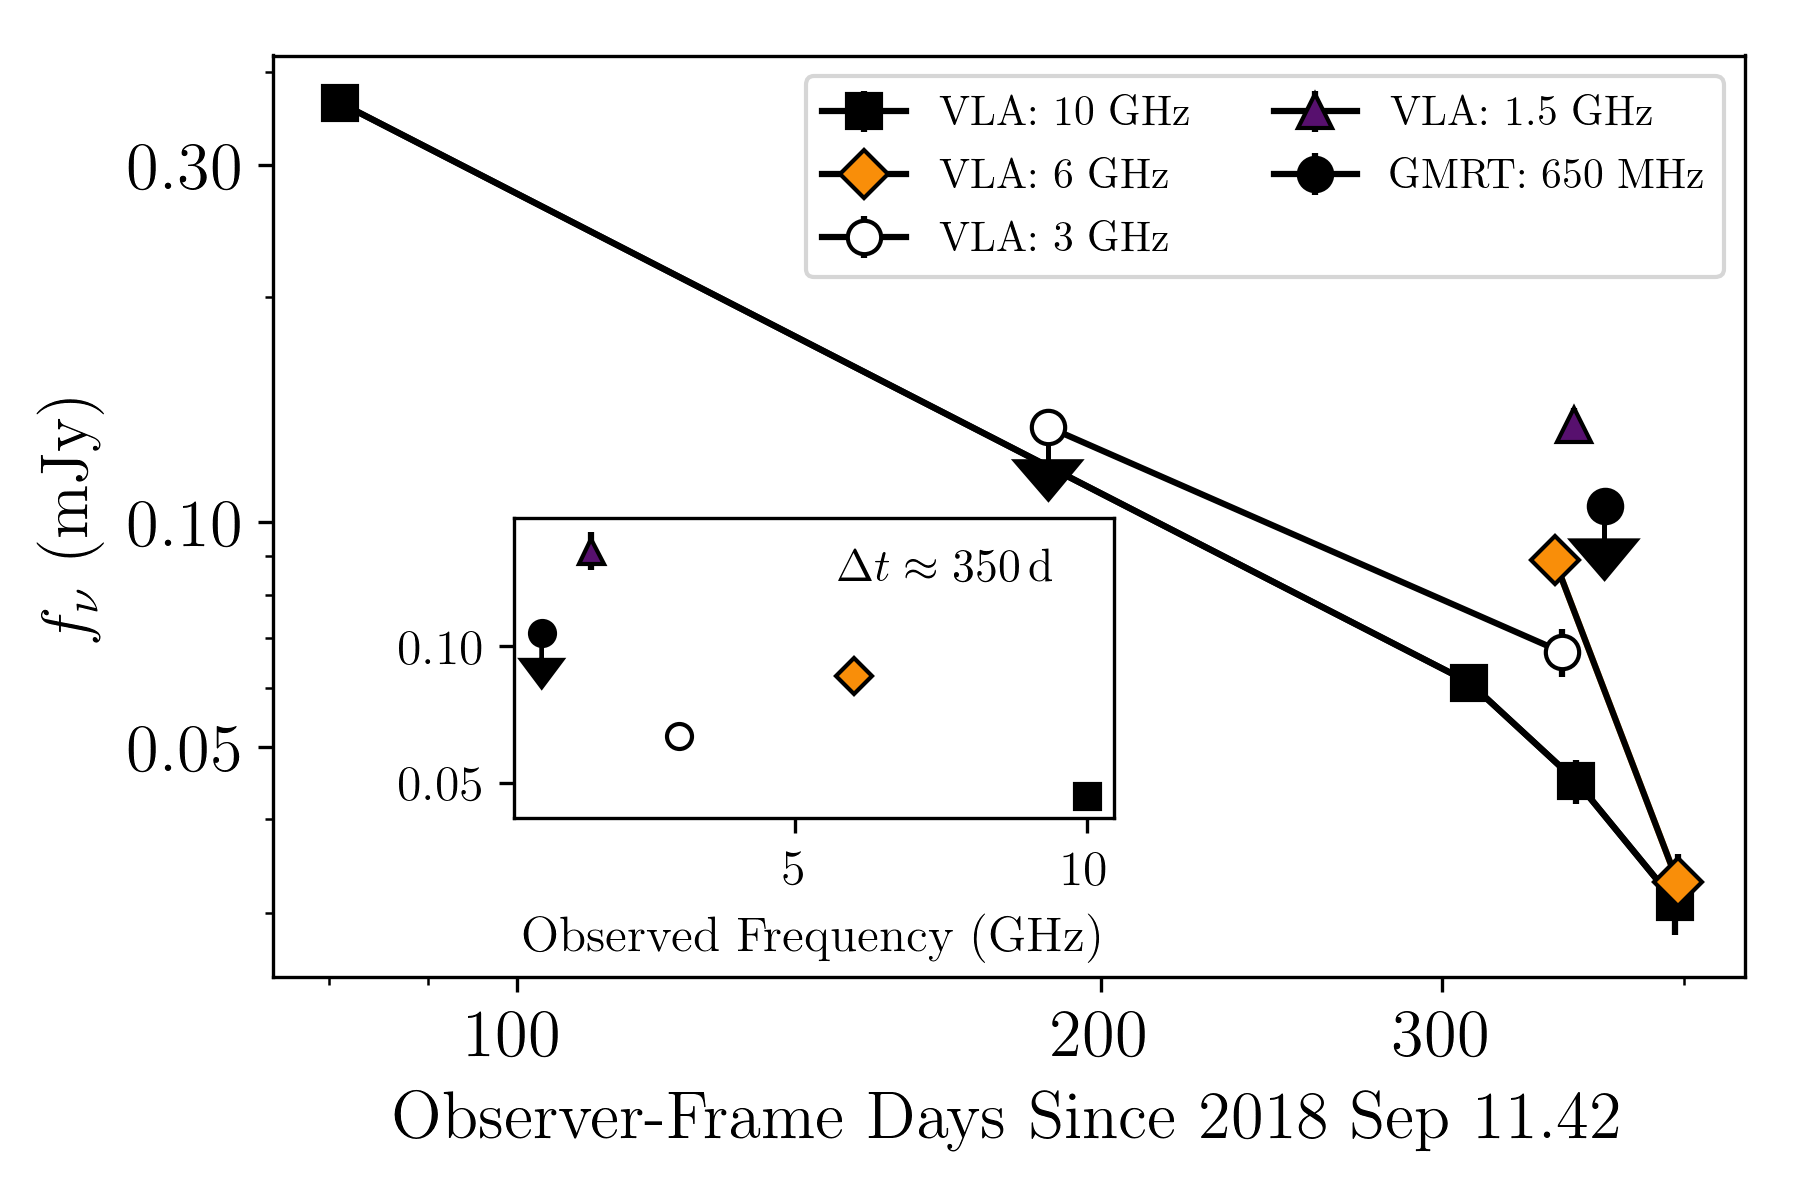
The radio light curve from the VLA is shown in Figure 7. At the time of our first observation, the 10 (rest-frame 12 ) luminosity was , and the in-band spectral index was where . At late times () the decline is very steep: at 6 we find , and at 10 we find .
To estimate the contribution to the radio emission from the host galaxy, we use the relation in Greiner et al. (2016), adapted from Murphy et al. (2011):
| (1) |
In the final epoch of our radio observations, assuming (Condon, 1992) where , the 10 flux density of mJy predicts a SFR of 20 . So, we conclude that during the final observation the radio emission is still dominated by the transient, but the host may contribute a non-trivial fraction of the flux.
3 Comparison With Extragalactic Explosions
3.1 Optical Light Curve and Spectrum
As shown in §1, the fast rise time and high peak luminosity of ZTF18abvkwla is shared by only a handful of transients in the literature. In this section we compare the optical properties of ZTF18abvkwla to the transients in Table 1. We exclude Dougie because it resided in an old stellar population with no signs of enhanced star formation (Vinkó et al., 2015); the dominance of absorption features and much lower star-formation rate were confirmed by additional LRIS spectroscopy (Arcavi et al., 2016).
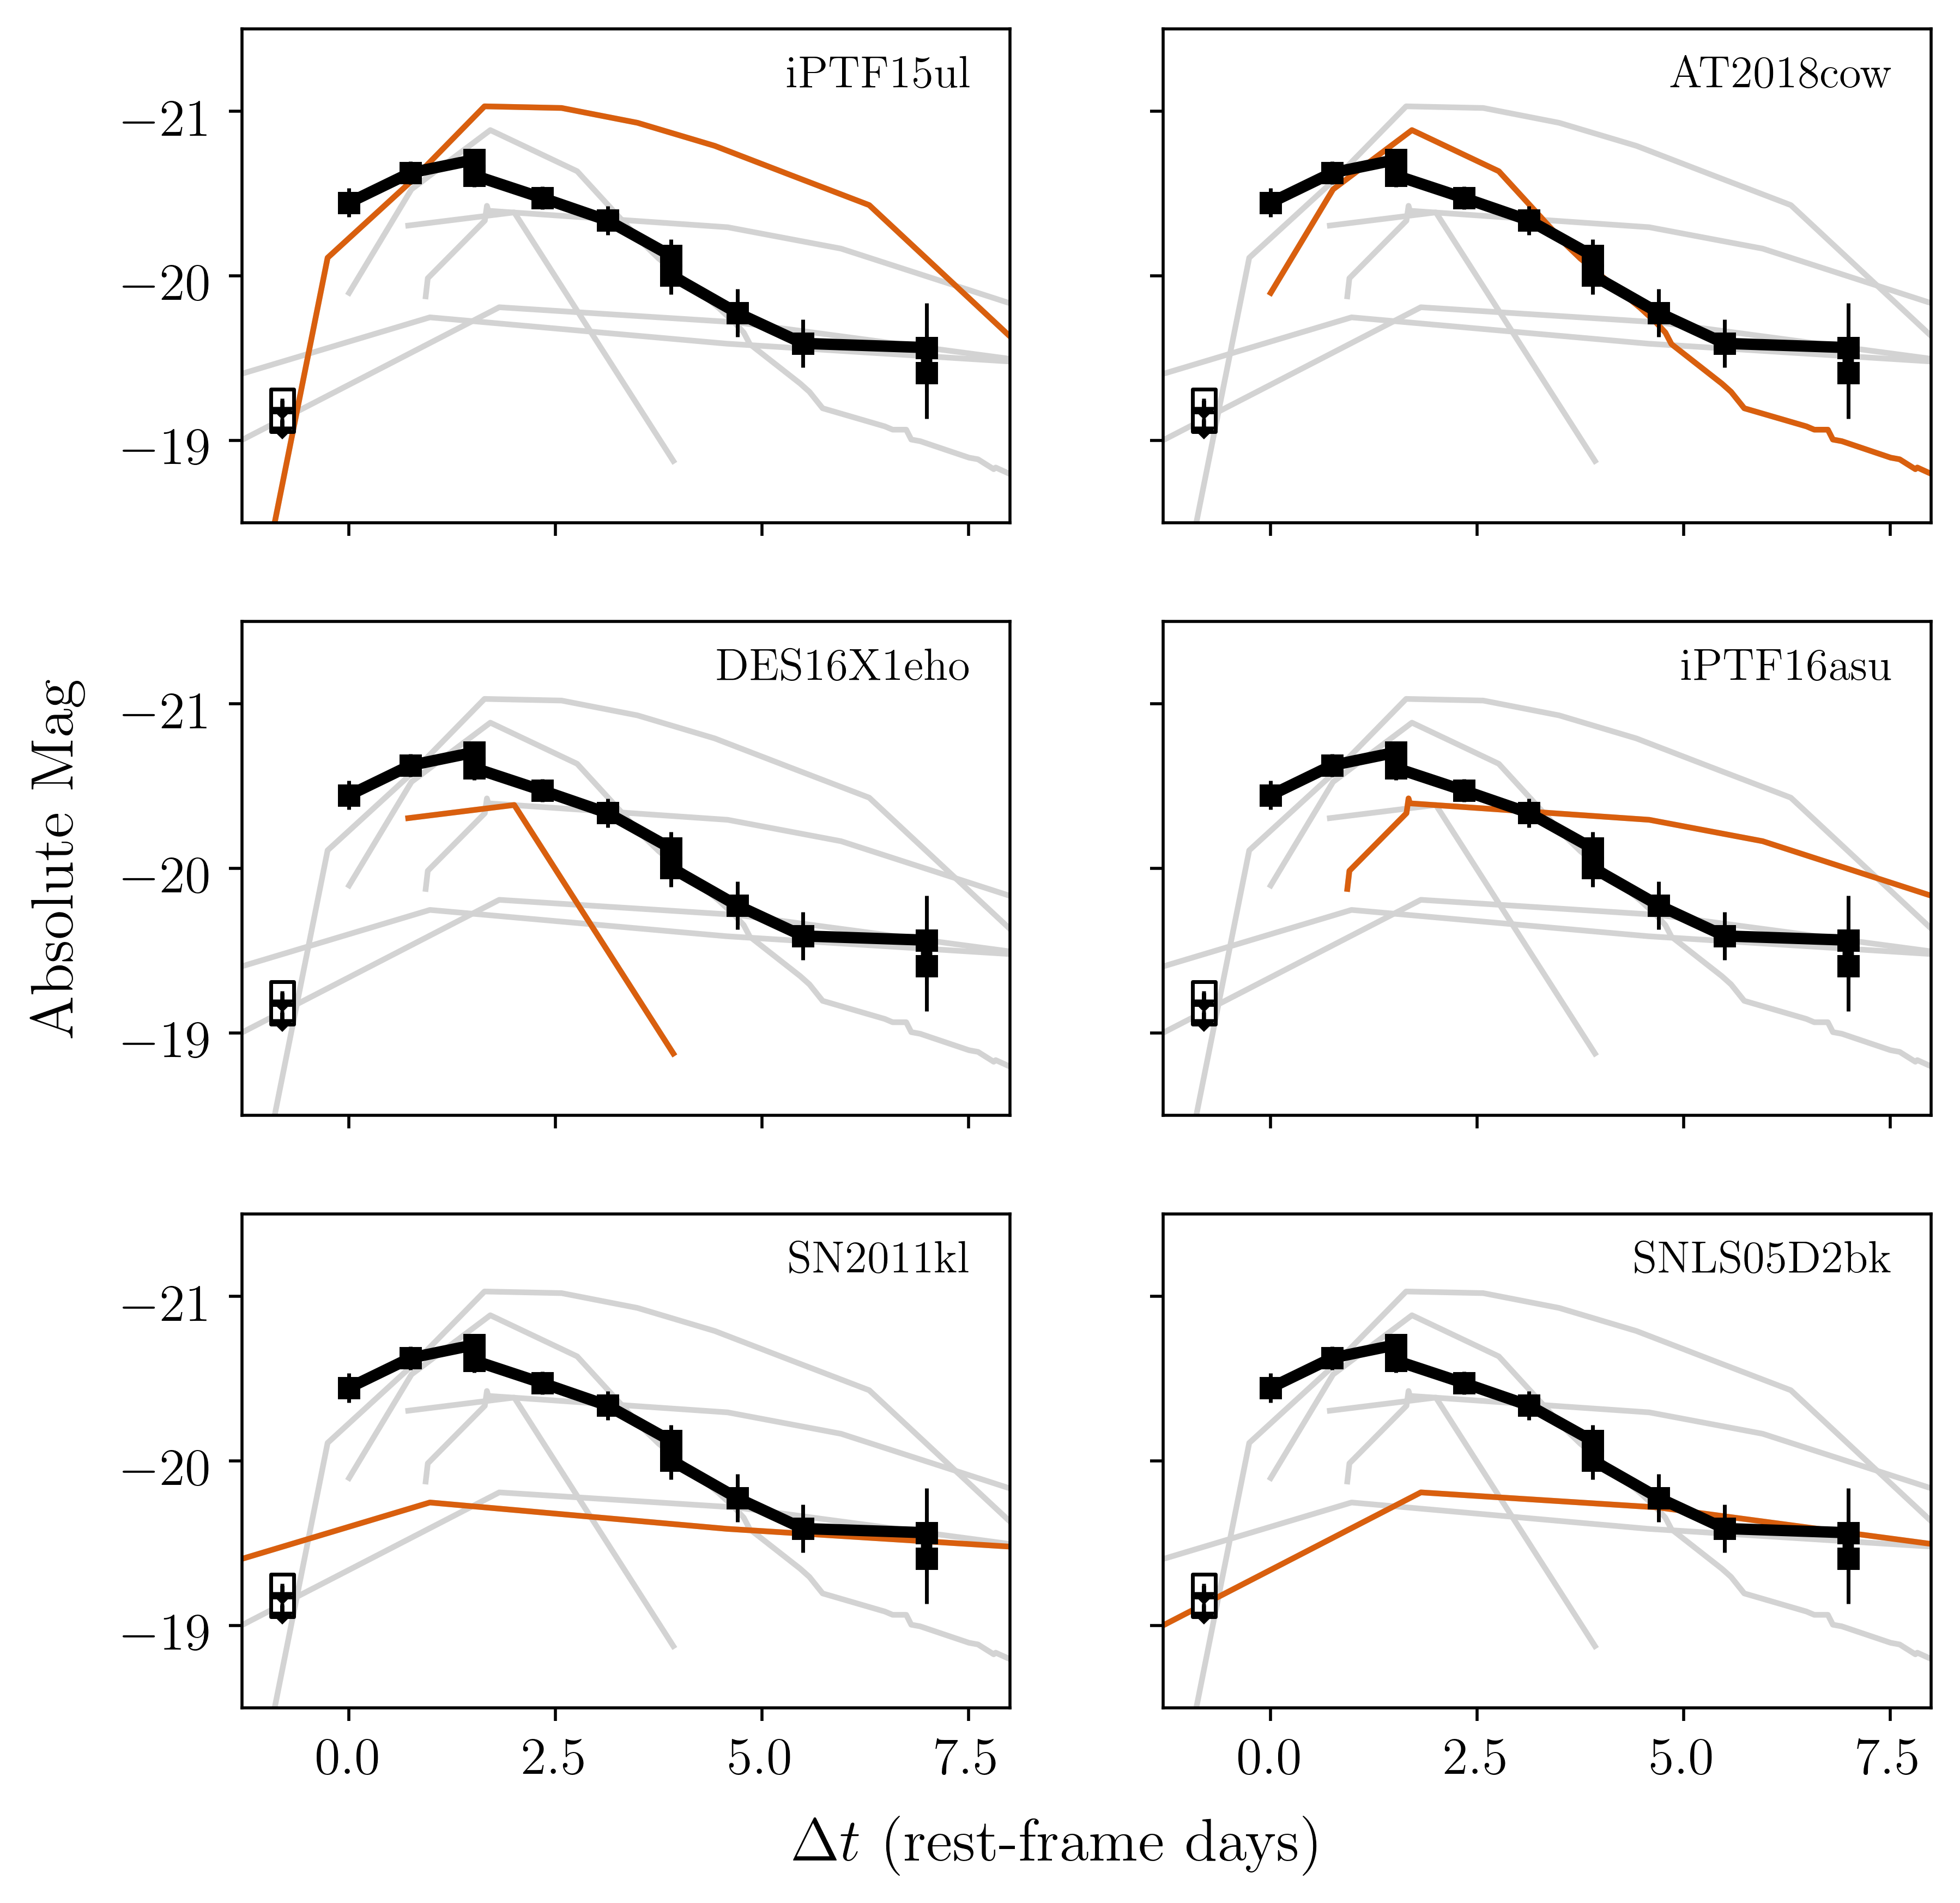
To compare light curves, we selected the light curve in a filter closest to rest-frame (the same filters used in constructing Figure 1). Following Whitesides et al. (2017), we calculated absolute magnitudes using
| (2) |
We cannot perform a true -correction because most objects lack sufficient spectroscopic coverage. These equations will introduce systematic errors on the order of 0.1 mag.
In Figure 8 we show the rest-frame -band light curve of ZTF18abvkwla compared to the light curves of transients in Table 1. The fast rise time of ZTF18abvkwla is most similar to that of iPTF15ul, AT2018cow, and perhaps iPTF16asu: it is faster than SN 2011kl and the SNLS transients. ZTF18abvkwla fades much more quickly than iPTF16asu (which spectroscopically evolved into a Ic-BL SN) and in this sense is more similar to iPTF15ul and AT2018cow. In terms of peak luminosity, ZTF18abvkwla is close to iPTF15ul, AT2018cow, DES16X1eho, and iPTF16asu, and brighter than SN 2011kl and the SNLS transients. However, we caution that the high peak luminosity of iPTF15ul results from a large host-galaxy extinction inferred in Hosseinzadeh et al. (2017), without which the peak magnitude would be .
Next we consider color evolution. ZTF18abvkwla showed tentative evidence for reddening over time, from mag at peak to mag in the final epoch a week later; however, this is only a 2 change. AT2018cow, iPTF15ul, and DES16X1eho remained very blue throughout the evolution of their optical light curves, whereas iPTF16asu reddened significantly as the SN became the dominant component.
Finally, we consider the spectral evolution of the transients in Table 1. Peak-light spectra were not obtained for DES16X1eho (Pursiainen et al., 2018) or the SNLS transients (Arcavi et al., 2016). The peak-light spectra of iPTF16asu, AT2018cow, and SN 2011kl were featureless (Whitesides et al., 2017; Perley et al., 2019a; Greiner et al., 2015), and iPTF15ul444iPTF15ul was classified as Type Ibn in Hosseinzadeh et al. (2017), but the lack of distinct He I at peak make this classification uncertain.) had a weak emission feature attributed to C III (Hosseinzadeh et al., 2017). After peak, iPTF16asu developed features of a Ic-BL SN (Whitesides et al., 2017), and AT2018cow had a complex spectral evolution, with a broad feature () that appeared and disappeared over several days following peak light and a variety of emission lines that appeared one week later (Perley et al., 2019a). Unfortunately we do not have any spectra of ZTF18abvkwla after peak.
3.2 Radio Light Curve
In the previous section (§3.1) we compared the optical properties of ZTF18abvkwla to the transients in Table 1: the light curve shape, the color evolution, and the spectrum. In this section we compare the radio properties of ZTF18abvkwla to the same set of transients.
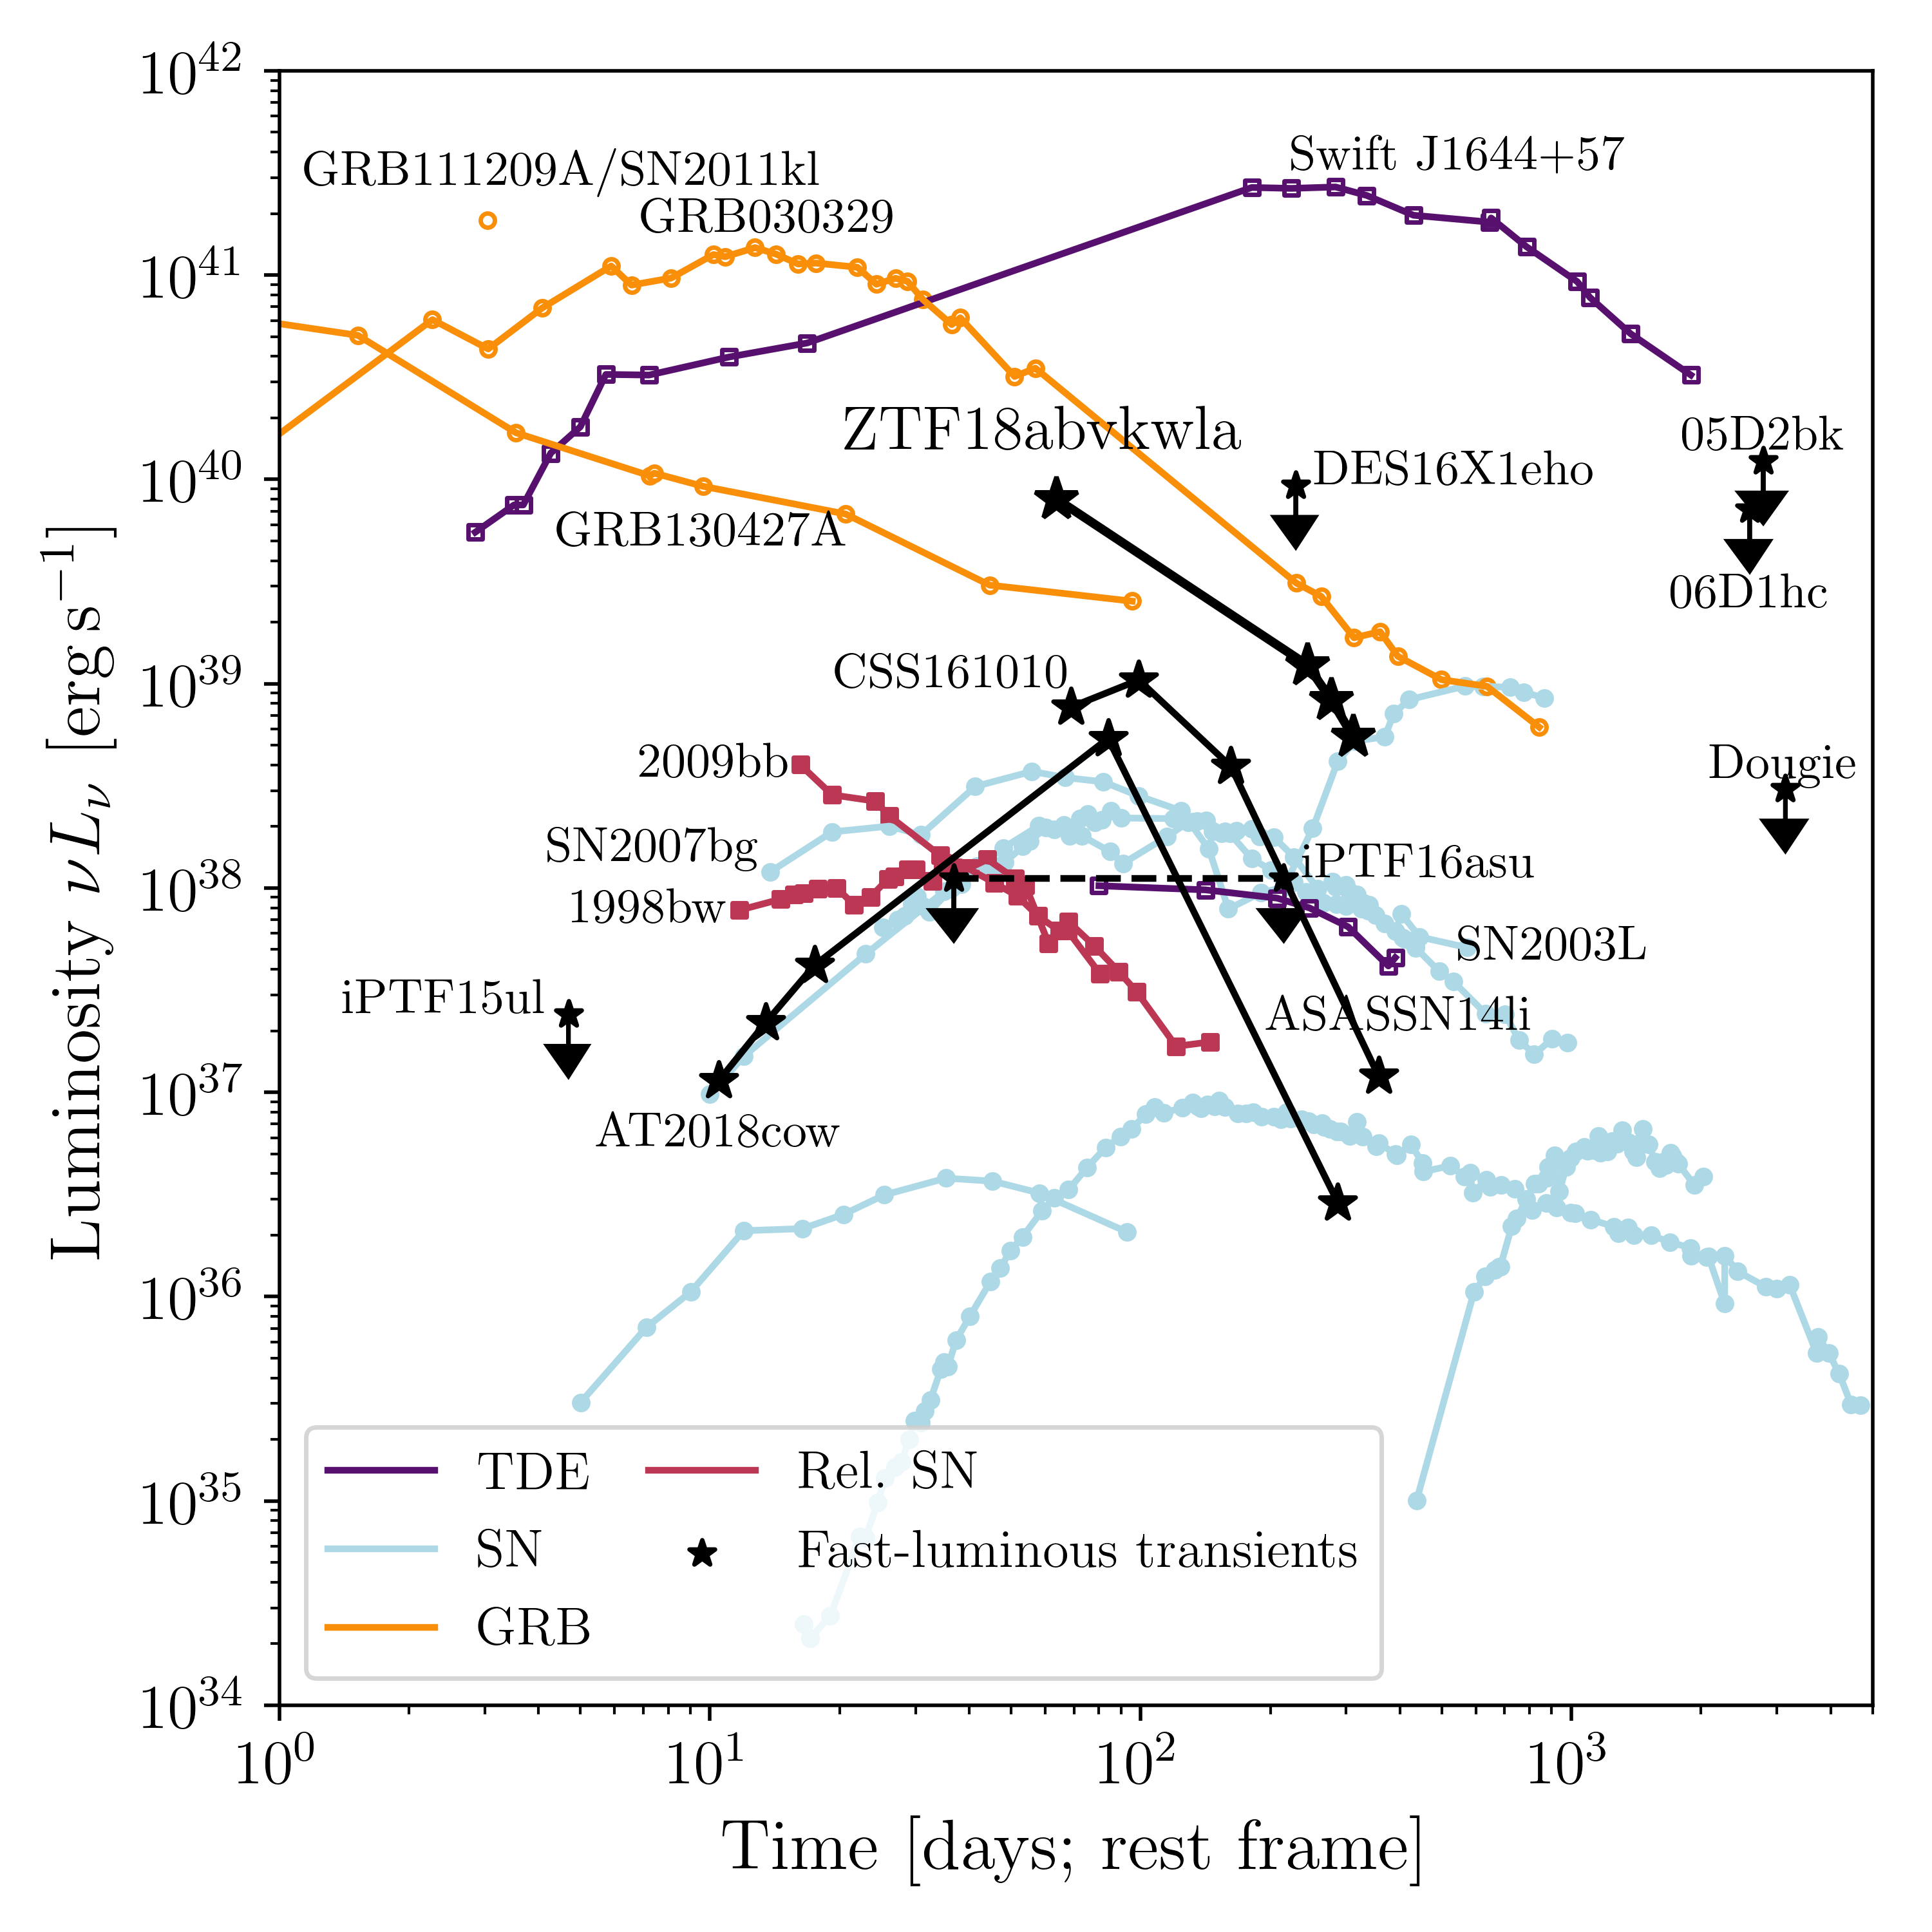
Of the transients in Table 1, only AT2018cow and GRB 111209A/SN 2011kl had a detected radio counterpart.555In the case of GRB 111209A/SN 2011kl, the radio emission was likely from the GRB afterglow itself (Kann et al., 2018). Prompt radio follow-up observations were also obtained for iPTF15ul666Observations of iPTF15ul were obtained within five days of the optical discovery, two observer-frame days after peak optical light, at 6 and 22 with the VLA, at 15 with the Arcminute Microkelvin Imager (Zwart et al., 2008), and at 95 with the Combined Array for Research in Millimeter-wave Astronomy (Bock et al., 2006). There was no detection at any frequency, with an RMS of 0.235 mJy with CARMA and an RMS of 0.03 mJy with AMI. and iPTF16asu, but neither was detected. To our knowledge, Dougie, the SNLS transients, and DES16X1eho did not have deliberate radio follow-up observations; we searched the VLASS archive and found that all except SNLS04D4ec were observed but none were detected. In Figure 9 we show the radio measurements of the Table 1 transients compared to stellar explosions and tidal disruption events. For completeness, we also searched the positions of all of the transients in the two largest collections of unclassified fast-rising luminous optical transients reported to date, PS1 (Drout et al., 2014) and the Dark Energy Survey (Pursiainen et al., 2018). None were detected, and the limits are listed in Table 7.
| ID | RA | Dec | Limit | ||
|---|---|---|---|---|---|
| [hh:mm:ss] | [dd:mm:ss] | (days) | (Jy) | ||
| PS1-10ah | 0.074 | 10:48:15.784 | +57:24:19.48 | 2836 | 102 |
| PS1-11qr | 0.324 | 09:56:41.767 | +01:53:38.25 | 2467 | 130 |
| PS1-12bb | 0.101 | 09:57:23.866 | +03:11:04.47 | 2174 | 149 |
| PS1-12bv | 0.405 | 12:25:34.602 | +46:41:26.97 | 2642 | 129 |
| PS1-12brf | 0.275 | 22:16:06.892 | -00:58:09.81 | 1892 | 124 |
| PS1-11bbq | 0.646 | 08:42:34.733 | +42:55:49.61 | 2731 | 159 |
| PS1-13duy | 0.27 | 22:21:47.929 | -00:14:34.94 | 1505 | 127 |
| PS1-13dwm | 0.245 | 22:20:12.081 | +00:56:22.35 | 1422 | 155 |
| PS1-10iu | – | 16:11:34.886 | +55:08:47.91 | 2689 | 103 |
| PS1-13aea | – | 12:18:14.320 | +47:20:12.60 | 2199 | 88 |
| PS1-13bit | – | 16:12:00.765 | +54:16:08.16 | 1618 | 104 |
| PS1-13cgt | – | 16:18:56.245 | +54:19:33.71 | 1552 | 123 |
| DES15S1fli | 0.45 | 02:52:45.15 | -00:53:10.21 | 826 | 150 |
| DES13X3gms | 0.65 | 02:23:12.27 | -04:29:38.35 | 1520 | 139 |
| DES15S1fll | 0.23 | 02:51:09.36 | -00:11:48.71 | 826 | 139 |
| DES14S2anq | 0.05 | 02:45:06.67 | -00:44:42.77 | 1199 | 118 |
| DES14X3pkl | 0.3 | 02:28:50.64 | -04:48:26.44 | 1100 | 105 |
| DES15C3lpq | 0.61 | 03:30:50.89 | -28:36:47.08 | 849 | 145 |
| DES16S1dxu | 0.14 | 02:50:43.53 | -00:42:33.29 | 385 | 154 |
| DES15C3mgq | 0.23 | 03:31:04.56 | -28:12:31.74 | 835 | 99 |
| DES16X1eho | 0.76 | 02:21:22.87 | -04:31:32.64 | 365 | 152 |
| DES16X3cxn | 0.58 | 02:27:19.32 | -04:57:04.27 | 393 | 128 |
| DES15C3lzm | 0.33 | 03:28:41.86 | -28:13:54.96 | 839 | 106 |
| DES13C3bcok | 0.35 | 03:32:06.47 | -28:37:29.70 | 1513 | 98 |
| DES15C3nat | 0.84 | 03:31:32.44 | -28:43:25.06 | 810 | 108 |
| DES15C3opk | 0.57 | 03:26:38.76 | -28:20:50.12 | 777 | 125 |
| DES15C3opp | 0.44 | 03:26:57.53 | -28:06:53.61 | 781 | 112 |
| DES13X3npb | 0.5 | 02:26:34.11 | -04:08:01.96 | 1411 | 122 |
| DES16C3axz | 0.23 | 03:31:14.15 | -28:40:00.25 | 523 | 100 |
| DES16C3gin | 0.35 | 03:31:03.06 | -28:17:30.98 | 391 | 107 |
| DES14X1bnh | 0.83 | 02:14:59.79 | -04:47:33.32 | 1172 | 145 |
| DES16X3ega | 0.26 | 02:28:23.71 | -04:46:36.18 | 357 | 111 |
| DES15C3mfu | – | 03:28:36.08 | -28:44:20.00 | 835 | 187 |
| DES13C3abtt | – | 03:30:28.91 | -28:09:42.12 | 1513 | 107 |
| DES15C3pbi | – | 03:28:56.68 | -28:00:07.98 | 772 | 182 |
| DES15X3atd | – | 02:23:21.64 | -04:17:28.95 | 830 | 146 |
| DES13C3nxi | – | 03:27:51.22 | -28:21:26.21 | 1559 | 75 |
| DES13C3smn | – | 03:27:53.08 | -28:05:00.93 | 1564 | 124 |
| DES13X3aakf | – | 02:22:50.84 | -04:41:57.01 | 1441 | 108 |
| DES13X3afjd | – | 02:28:00.31 | -04:34:59.39 | 1411 | 123 |
| DES13X3kgm | – | 02:26:00.92 | -04:51:59.29 | 1508 | 103 |
| DES16S2fqu | – | 02:47:05.94 | -00:20:50.40 | 356 | 139 |
| DES16X1ddm | – | 02:15:18.88 | -04:21:52.07 | 386 | 111 |
| DES16X3ddi | – | 02:21:45.39 | -04:41:08.95 | 393 | 127 |
| DES16X3erw | – | 02:24:49.31 | -04:30:51.45 | 357 | 117 |
As shown in Figure 9, ZTF18abvkwla is most similar in luminosity to long-duration GRB afterglows (Berger et al., 2003; Perley et al., 2014). The SED is also similar: in §2.2 we found that the SED of ZTF18abvkwla peaked near 10 at , while the SED of GRB 030329 () peaked at 5 (Berger et al., 2003) at 67 days post-explosion, and the SED of GRB 130427A () peaked at 10 (Perley et al., 2014) at a similar epoch post-explosion.
3.3 A Starburst Host Galaxy
In Sections 3.1 and 3.2 we compared the optical and radio properties of ZTF18abvkwla, respectively, to other transients in the literature. Here we put its host galaxy properties into context.
Galaxies with very high specific star-formation rates (e.g., sSFR yr-1, our operational definition of a “starburst”) contribute a small fraction of star-formation in the low-redshift Universe (Lee et al., 2009), so the appearance of ZTF18abvkwla in such a galaxy (sSFR yr-1) is notable. However, their contribution to low-metallicity star-formation is more significant, as they are typically low-mass and therefore low-metallicity (Tremonti et al., 2004). They are also promising candidates to experience a top-heavy IMF (Dabringhausen et al., 2009) and potential sites of enhanced binary or dynamical stellar interactions (van den Heuvel & Portegies Zwart, 2013). Each of these mechanisms have been appealed to in attempts to interpret the relatively high abundance of exotic transients of other types found in these systems, including superluminous SNe (SLSNe; Lunnan et al. 2014; Leloudas et al. 2015; Perley et al. 2016; Schulze et al. 2018), broad-lined Ic SNe (Modjaz et al., 2019), GRBs (Fruchter et al., 2006; Krühler et al., 2015; Schulze et al., 2015; Vergani et al., 2015), and at least some fast radio bursts (Katz, 2016; Tendulkar et al., 2017).
Based on our measurements in §2.1.2 we conclude the following about the host of ZTF18abvkwla:
The host is not an AGN — We confirm the lack of any evidence for an optical AGN based on the very weak [NII] emission. The host falls squarely in the star-forming locus of the BPT diagram (Figure 10a).
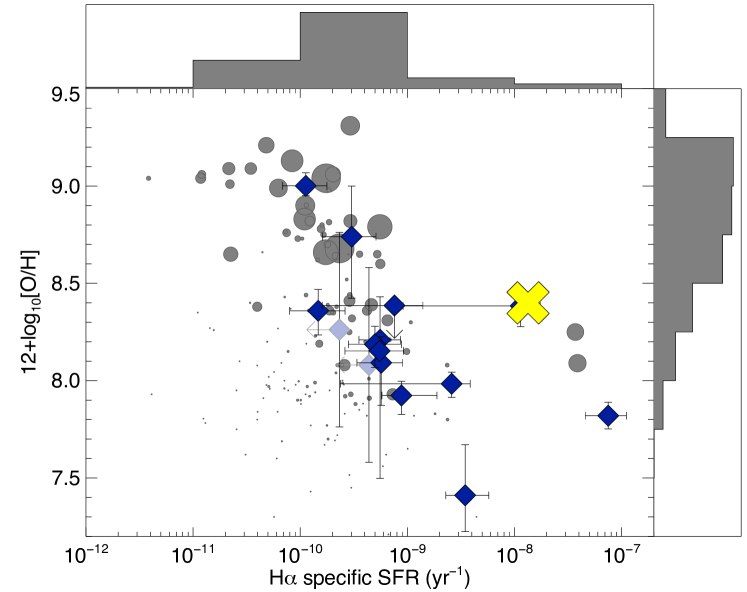
The host metallicity is typical for its mass — The host is relatively metal-poor: the precise number is of course scale-dependent, but using the Z94 scale we calculate [O/H] of 8.45, or about 0.6Solar. This is a lower metallicity than the majority of star-formation in the local Universe, but not an outlier and unexceptional for low-mass galaxies in particular (Figure 10b).
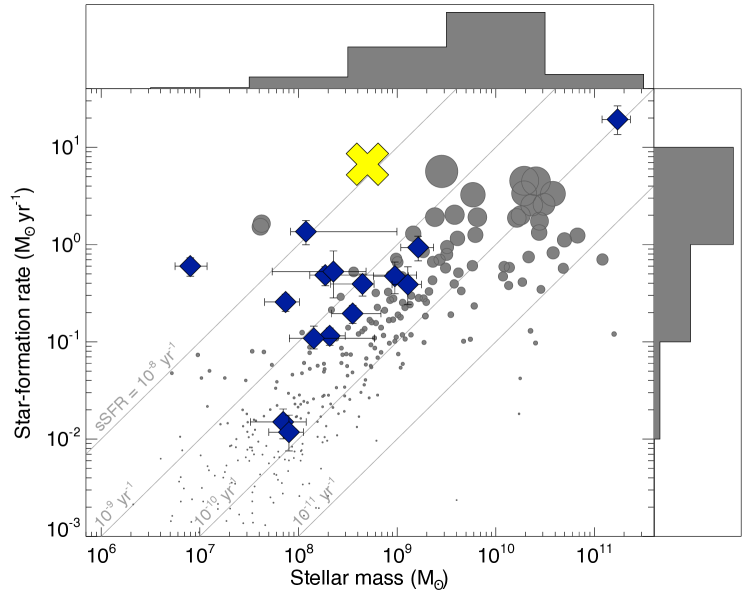
The star-formation intensity is similar to extreme SLSN and GRB hosts — The most striking nature of the host galaxy is its very high specific star-formation rate, which is evident in Figure 10c and 10d.
The host of AT 2018cow was also a dwarf galaxy, although it was more massive than that of ZTF18abvkwla and not starbursting, with a mass and star-formation rate of and respectively (Perley et al., 2019a). The host galaxy of DES16X1eho had a stellar mass and a specific SFR of (Pursiainen et al., 2018). The host galaxy of iPTF16asu had a stellar mass and an H SFR of 0.7 , corresponding to a sSFR of 1.4 (Whitesides et al., 2017). Finally, the host galaxies of the SNLS transients harbored relatively evolved stellar populations, and were noted to be markedly different from starburst galaxies (Arcavi et al., 2016).


4 Interpretation
Even with the small number of events in the Table 1 menagerie, the diversity of optical and radio properties (§3.1, §3.2) suggests that there are several progenitor systems involved. In this section we model the optical and radio light curves of ZTF18abvkwla and discuss the implications for the progenitor.
4.1 Modeling the Optical Light Curve
Shock-interaction with extended low-mass material is an efficient mechanism for producing a fast-peaking luminous optical light curve. Shock breakout occurs when the photon diffusion time drops below the shock crossing time (, where is the optical depth and is the shock velocity). For normal stellar progenitors, this emission is primarily at X-ray and UV wavelengths and lasts for seconds to a fraction of an hour. In the wake of this shockwave, the outer stellar material is heated to high temperatures, and as it cools it radiates on the timescale of a day (“cooling envelope” emission). See Waxman & Katz (2017) for a review.
Prior to core-collapse, massive stars can undergo mass-loss via steady winds or eruptive episodes (Smith, 2014). As a result, a star can be surrounded by dense, recently-expelled material at the time of explosion. If this material is optically thick, it increases the effective radius of the star and prolongs the light curve from shock breakout. If the light curve of ZTF18abvkwla arises from shock breakout in a shell, we can estimate the radius of this extended material (CSM) assuming a rise to peak bolometric luminosity , a peak luminosity and a typical SN shock velocity of . The rise timescale is
| (3) |
For ZTF18abvkwla, we find .
We can also estimate the mass in the shell, assuming that the shock deposits half its kinetic energy and that this deposited energy is where the energy density reflects the amount of thermal energy in the layer. The luminosity scales as
| (4) |
Assuming , we find . In this framework, the differences in the light curves of different objects corresponds to differences in the shell mass, shell radius, and shock velocity. The luminosity is most sensitive to the velocity, so it is possible that the transients in Table 1 are distinguished by fast velocities, which would naturally explain the inclusion of a Ic-BL SN. For a fixed shock velocity, a fast rise time corresponds to a small shell radius, which in turn requires a large shell mass to produce a high luminosity.
Another possibility is that the light curve is powered not by shock breakout in a shell, but by post-shock envelope-cooling emission. For example, this was the model invoked for iPTF16asu (Whitesides et al., 2017), which led to an inferred shell mass of 0.45 and a shell radius of . The light curve of ZTF18abvkwla has a similar rise time but a higher peak luminosity than that of iPTF16asu, and the effective temperature at peak is significantly higher. According to the one-zone analytic formalism in Nakar, & Piro (2014) and Piro (2015), a higher peak temperature for a fixed rise time and a fixed opacity arises from a larger shell radius. A larger shell radius can also explain the higher bolometric luminosity, although that could also arise from a larger explosion energy or faster ejecta velocity.
Another mechanism suggested to explain the optical light curve of AT2018cow was reprocessing by dense outer ejecta (Margutti et al., 2019). In this picture, a central source (such as an accretion disk or magnetar) emits high-energy (i.e. X-ray) emission, which is reprocessed by surrounding material to produce lower-energy (i.e. optical) radiation. This is one setup for tidal disruption events, in which case the surrounding material is unbound stellar debris (Strubbe & Quataert, 2009). Indeed, several properties of ZTF18abvkwla and AT2018cow are similar to TDEs in the literature, such as the photospheric radius of –, the effective temperature of K, and high radio luminosities attributed to jets (for reviews of TDE observations, see Gezari (2012) and Komossa (2015)).
Regardless of the power source at peak, we also use the optical light curve to put an upper limit on the mass of that could have been synthesized in the explosion. Using Equation (16) in Kasen (2017), the luminosity from the radioactive decay of is
| (5) |
where d and d. Using the final -band measurement () at ( rest-frame) , so the amount of that could power the light curve at this epoch is (Figure 4). From a compilation of CC SNe, Lyman et al. (2016) found nickel masses of for Type IIb SNe, for Type Ib SNe, for Type Ic SNe, and for Type Ic-BL SNe. So, we cannot rule out an underlying nickel-powered light curve for ZTF18abvkwla.
4.2 Modeling the Radio Light Curve
The high luminosity and fast variability timescale of the 10 light curve implies a high brightness temperature K, so we conclude that the emission is synchrotron radiation. In the first epoch, the 10 observation is declining and has an in-band (8–12 ) spectral index of where . This is much shallower than the optically thick () or the optically thin () regimes of a synchrotron self-absorption (SSA) spectrum, which suggests that the peak of the SED is near 10 (observer-frame) at this epoch. In what follows, we assume that the SSA spectrum has a rest-frame peak frequency (the bottom of the band) and a rest-frame peak flux density mJy.
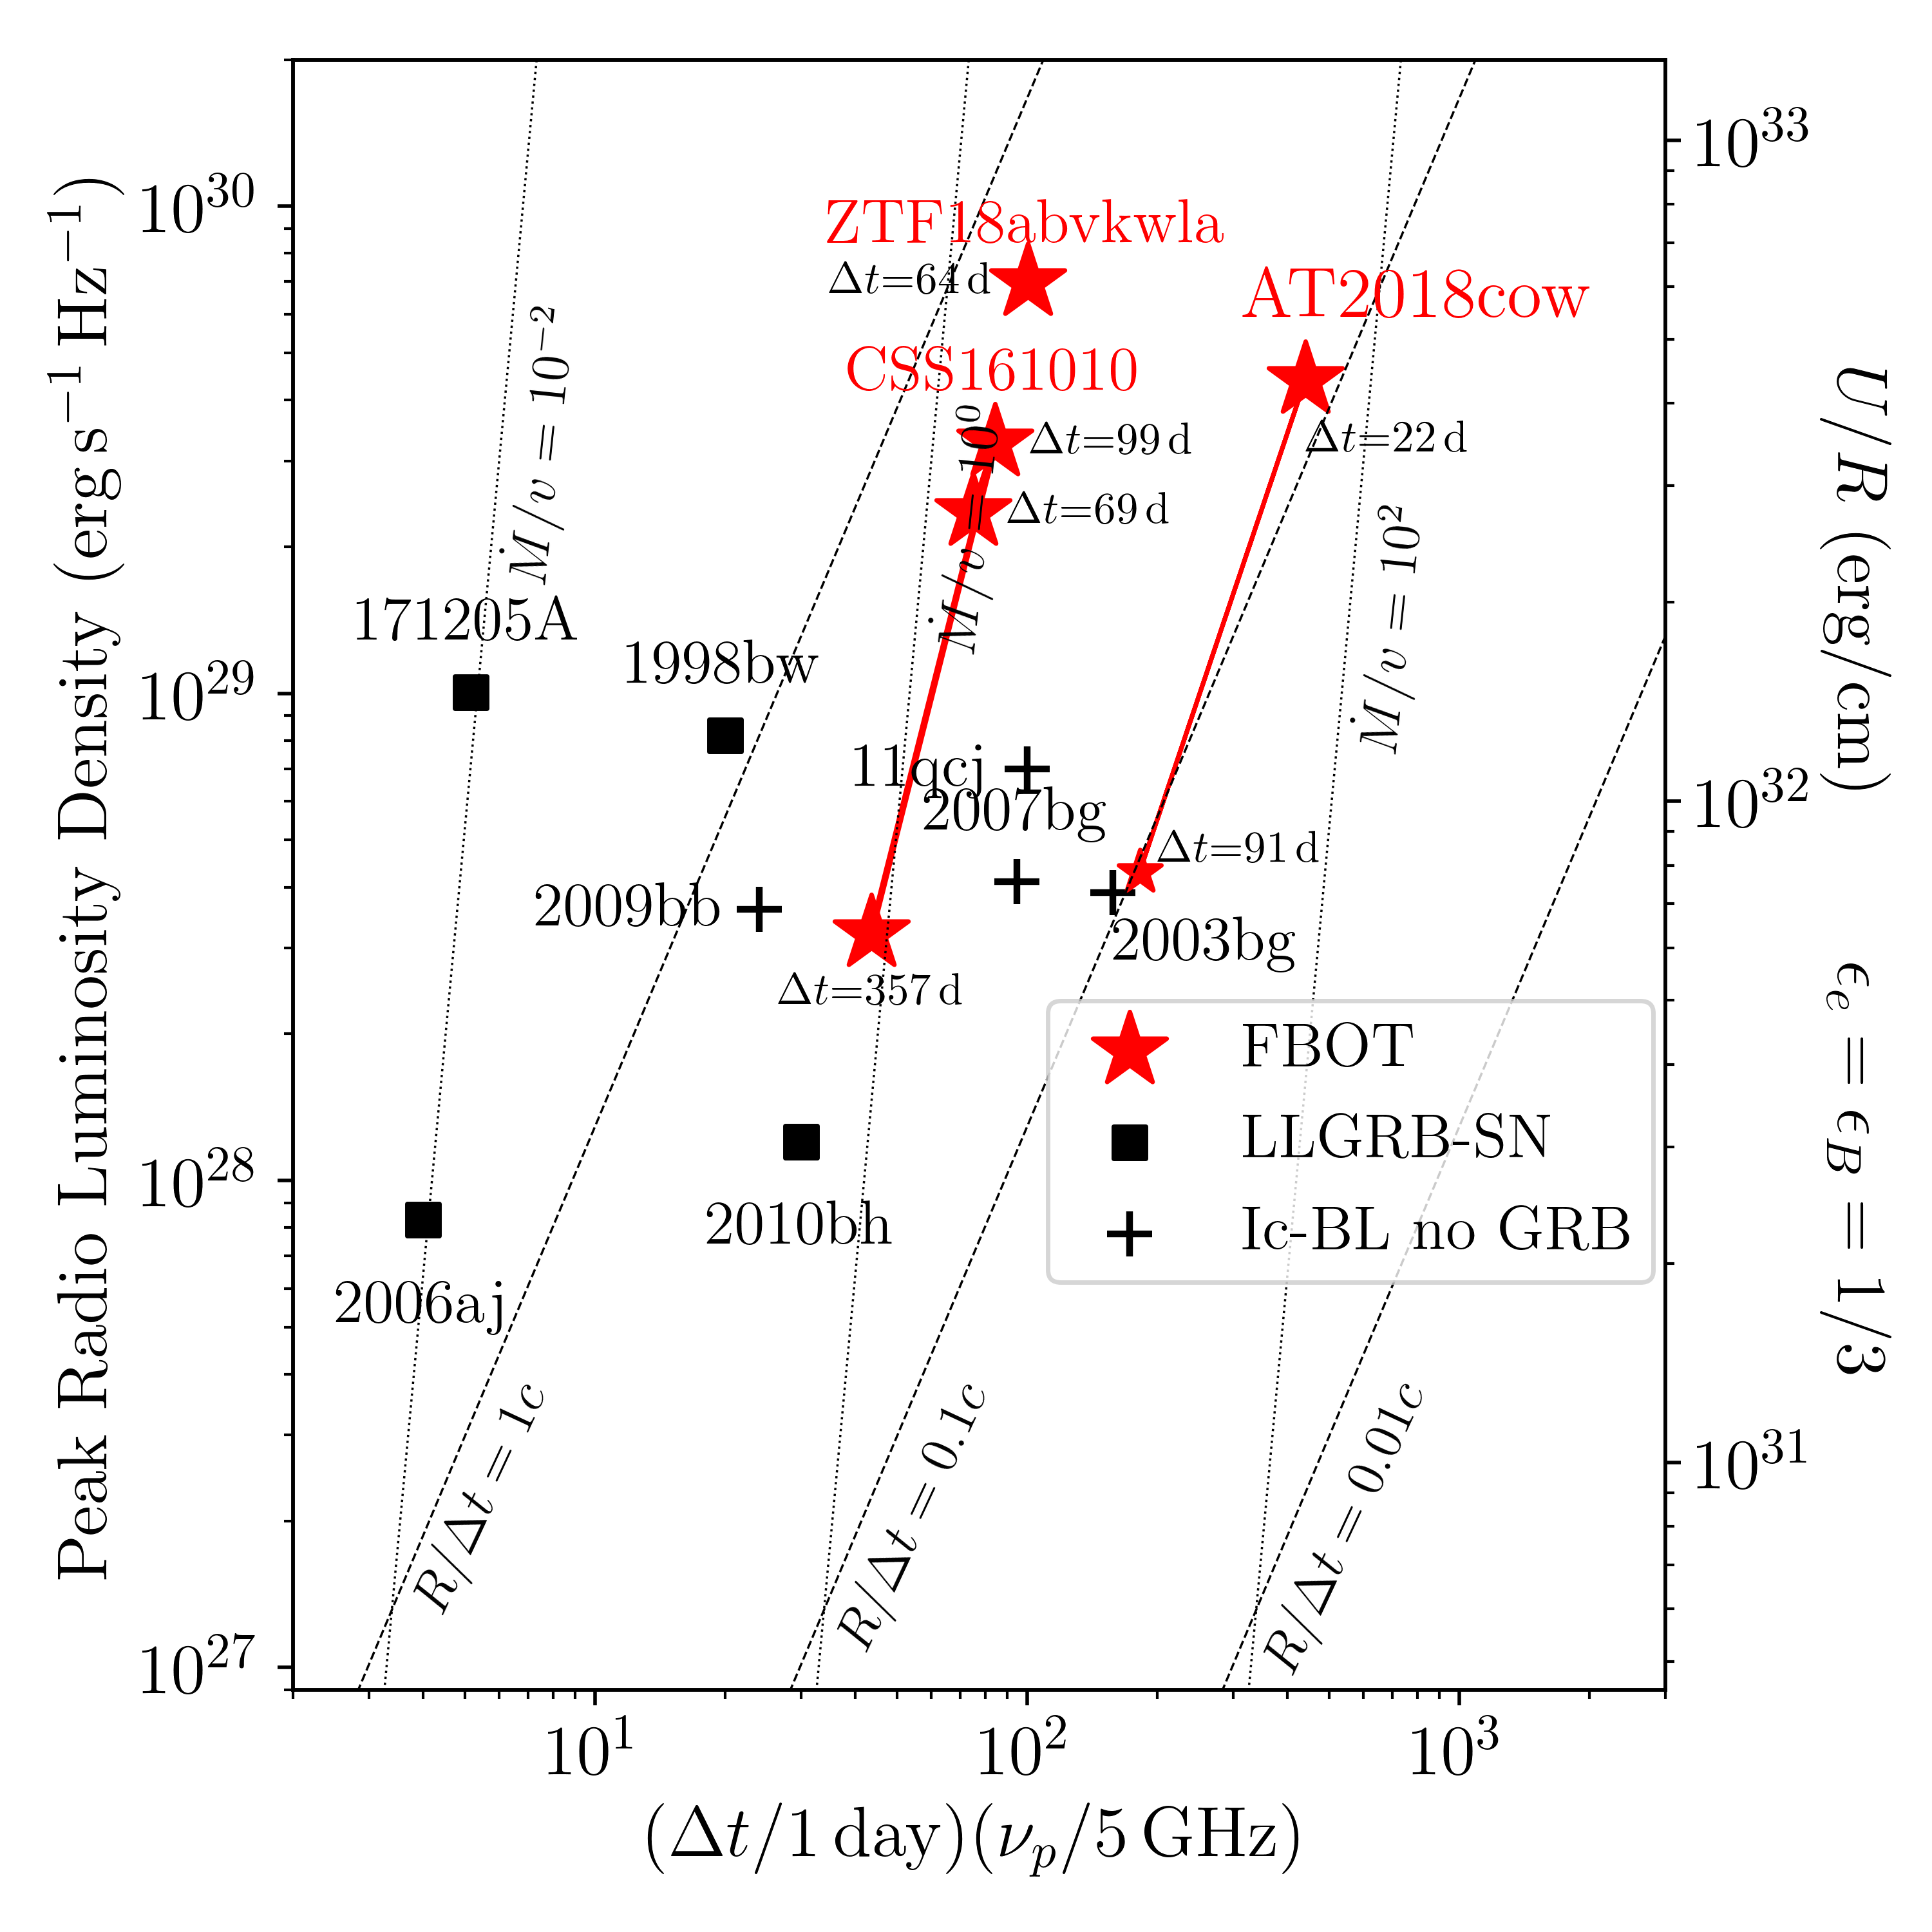
When the SSA peak is known, the outer shock radius and magnetic field strength can be derived assuming that energy is equally partitioned into magnetic fields and relativistic electrons (Scott & Readhead, 1977; Readhead, 1994). We use the equations for and for radio SNe in Chevalier (1998) (Equations 11 and 12). Assuming an optically thin spectral index of and a filling factor , we find and G. So, the mean velocity until is . Using Equations 12, 16, and 23 in Ho et al. (2019a), and assuming , we find that the shock has swept up energy into an ambient medium of density , corresponding to a mass-loss rate of assuming a wind velocity . In Figure 11 we show these quantities compared to those of other energetic explosions. The peak radio luminosity density is directly proportional to , the energy swept up by the shock divided by the shock radius (right-hand side of Figure 11). So, the fact that ZTF18abvkwla, AT2018cow, and CSS161010 are distinguished by high radio luminosities is primarily a consequence of a large explosion energy.
4.3 Progenitor Systems and a Search for an Associated Gamma-ray Burst
The physical setups outlined in §4.1 — a shock driven through a shell, reprocessing of a high-energy compact source by optically thick material — could arise in a variety of different progenitor systems. An additional clue for ZTF18abvkwla is the host galaxy, which experienced a very recent burst of star-formation activity. In that sense, a massive-star origin seems most natural.
AT2018cow was suggested to have two distinct components: a shock driven through dense equatorial material (producing the optical emission), and a faster polar outflow (producing the radio emission; Margutti et al. 2019). As shown by early millimeter observations (Ho et al., 2019a), later radio observations (Margutti et al., 2019), and Very Long Baseline Interferometry (Bietenholz et al., 2020; Mohan et al., 2020), the fast outflow was subrelativistic with a near-constant velocity of . In ZTF18abvkwla, the radio-emitting ejecta is faster: at the same epochs when the outflow from AT2018cow was . As shown in Figure 11, the higher luminosity at late times arises from this faster velocity; the explosion energy of the two events appears to have been similar.
Because the late-time radio light curve is similar of that of GRBs, we searched for potential GRB counterparts to ZTF18abvkwla in the period between the last non-detection (MJD 58372.4206; 2018-09-11 10:05:39.84) and the first detection (MJD 58373.4075; 2018-09-12 09:46:48.00). There were two bursts detected by the interplanetary network (IPN; Hurley et al. 2010, 2016), one by the Gamma-ray Burst Monitor (GBM) aboard the Fermi spacecraft (Gruber et al., 2014; von Kienlin et al., 2014; Bhat et al., 2016) and one detected by the Konus-Wind experiment aboard the Wind spacecraft (Aptekar et al., 1995). The positions of both bursts are inconsistent with that of ZTF18abvkwla.
Due to the lack of detected GRB, we can set a limit on the fluence and corresponding isotropic equivalent energy of a prompt burst associated with ZTF18abvkwla. The IPN has essentially a 100% duty cycle across the sky, and detects GRBs with down to at 50% efficiency (Hurley et al., 2010, 2016). At , the estimated 20–1500 limiting peak flux at the position of ZTF18abvkwla was for a Band model that has in the 50–500 range. At the distance of ZTF18abvkwla, this corresponds to a limit on the isotropic peak luminosity of . Therefore we strongly disfavor an on-axis classical GRB (which is also consistent with the lack of observed optical afterglow emission).
Among GRBs, two events have shown evidence for a luminous optical blackbody component at early times: GRB 060218 (; Soderberg et al. 2006; Mirabal et al. 2006; Pian et al. 2006; Sollerman et al. 2006; Ferrero et al. 2006) and GRB 101225A (; Thöne et al. 2011). GRB 060218 was a very long-duration (s) low-luminosity () GRB associated with the Ic-BL SN 2006aj (Cano et al., 2017). A GRB with these properties cannot be ruled out by our limits. GRB 101225A also had a very long duration , and a candidate faint () SN counterpart.
As in the case of AT2018cow, we cannot rule out a TDE origin. In that case, the similarity to the light curve of AT2018cow would suggest a similar kind of system, i.e. an intermediate-mass black hole (; Perley et al. 2019a) with a white dwarf (Kuin et al., 2019) or a Solar-type (Perley et al., 2019a) stellar companion. In the case of AT2018cow, the main argument against a TDE hypothesis was the large ambient density () from millimeter (Ho et al., 2019a) and radio (Margutti et al., 2019) observations. For ZTF18abvkwla, assuming that the flat spectral index indicates a 10 peak at , we find a much lower density (). Among TDEs, the radio light curve of ZTF18abvkwla is most similar to that of the TDE candidate IGR J12580+0134 (Irwin et al., 2015), which had a nearly identical (and fade rate) one year post-discovery. The radio emission from IGR J12580+0134 has been attributed to an off-axis relativistic jet (Irwin et al., 2015; Lei et al., 2016) but interpretation is complicated by the coincidence of the source with a known AGN.
5 Rate Estimate
An important clue to the progenitor of sources like ZTF18abvkwla is the cosmological rate. Furthermore, three fast-luminous transients – SN 2011kl (associated with GRB 111209A), AT2018cow, and ZTF18abvkwla – have detected luminous radio emission, although the radio emission from SN 2011kl likely arose from the GRB afterglow. Clearly, being able to recognize additional members of this phase-space in optical surveys would be valuable for radio follow-up observations. In this section, we conduct an archival search of 18 months of the 1DC survey (2018 Apr 3 – 2019 Oct 18 UT) to estimate the rate of transients in the phase-space of Figure 1 and delineate false positives.
First we selected field-nights in the survey for which the 1-night coverage was approximately maintained. Specifically, we require
-
•
at least one observation the night before (days)
-
•
at least one observation two nights before (days)
-
•
at least three observations in the next five nights (days)
We find 8064 fields satisfying these criteria. Of these, 6854 fields (85%) have limiting magnitude mag and 4596 fields (57%) have limiting magnitude mag. The dominant effect is lunation, with some night-to-night variations due to weather.
For each of the 8064 field-nights, we searched for fast transients. To detect a fast transient, we require that the peak of the light curve be “resolved:” that is, that there are measurements both before and after peak light that are mag fainter than the peak magnitude. We then measure the time from 0.75 mag below peak to peak by linearly interpolating the light curve. If this rise time is d, we include the transient in our sample. More specifically, we filtered sources as summarized in Table 8. We scanned the remaining 659 sources by eye and removed sources with very noisy light curves or flaring behavior.
| Criteria | # sources remaining |
|---|---|
| Reala, brightb, pos. sub.c, not stard | 758,528 |
| Short duratione and peak resolvedf | 659 |
Note. — a b c isdiffpos=‘t’ or ’1’ d not( and ) e Duration between 1 and 100 days f Peak has preceding or subsequent detection/non-detection in a window that is at least 0.75 mag fainter
In Table 9 we list all 27 sources with rise times faster than 5 , including ZTF18abvkwla itself. Five sources are spectroscopically classified SNe: two Type II, two Type Ibn, and one Type IIb. Three sources are classified as CVs, two spectroscopically and one by cross-matching with the AAVSO International Variable Star Index VSX (Watson et al., 2017). Two are very likely flare stars based on previous detections in Pan-STARRS individual-epoch images, and a third is a likely flare star based on a GALEX counterpart. Nine sources are likely extragalactic (based on proximity to a host galaxy). When redshift estimates for these galaxies were not available, we attempted to obtain them using LRIS on 17 Feb 2020. Two sources remain without definitive redshift estimates, so we provide a photometric redshift from LegacySurvey DR8. One source (ZTF18abxxeai) has a very faint host classified as a PSF in LegacySurvey DR8, and the remaining five sources have no clear host counterpart.
Of the sources with a definitive host redshift measurement, ZTF18abvkwla is the only one that is more luminous than mag. Clearly, the primary interlopers in searches for transients like ZTF18abvkwla are CVs and less luminous SNe. CVs can be ruled out on the basis of repeated flaring, whereas less luminous SNe can only be ruled out if the redshift of the host galaxy is known a priori. Aside from ZTF18abvkwla, eight transients in our sample remain as possibly having , although the lack of an obvious host for six of them suggest that these may be CVs.
| ZTF Name (IAU Name) | Redshift | Peak Mag | Type | Notes | ||
|---|---|---|---|---|---|---|
| 18abvkwla | 0.2714 | FBOT | This paper | |||
| 19aavbjfp (SN2019fkl) | 0.028 | SN II | ||||
| 19abgbdcp (AT2019lbv) | 0.0318 | SN II | ||||
| 18aalrxas | 0.0588 | SN IIb | Fremling et al. (2019) | |||
| 19abuvqgw (AT2019php) | 0.087 | SN Ibn | ||||
| 19aapfmki (SN2019deh) | 0.05469 | SN Ibn | ||||
| 18abskrix | Galactic | CV | Spectroscopic classification | |||
| 18absrffm (AT2018ftw) | Galactic | CV | Spectroscopic classification | |||
| 18abyzkeq | Galactic | CV | AAVSO Name: CSS 151114:224934+375554 | |||
| 18ablxawt | Galactic | Likely flare star | Previous detection in PS1 DR2 at | |||
| 19abpwygn | - | Likely flare star | Previous detection in PS1 DR2 at | |||
| 18abyjgaa | - | Likely flare star | GALEX source, possible flaring in PS1 DR2 | |||
| 18aasaiyp | 0.104 | Unknown | ||||
| 18abuvqgo | 0.155 | Unknown | ||||
| 18abydmfv (AT2018hkr) | 0.042 | Unknown | ||||
| 18acepuyx (AT2018kxh) | 0.0711 | Unknown | ||||
| 19aatoboa (AT2019esf) | 0.0758 | Unknown | ||||
| 19abgbbpx (AT2019leo) | 0.0625 | Unknown | ||||
| 19abiyyhd (AT2019lwj) | 0.07 | Unknown | ||||
| 19aaadfcp | 0.08–0.15 | Unknown | ||||
| 19aanvhyc (AT2019coi) | 0.056–0.076 | Unknown | ||||
| 18abxxeai | Unknown | ‘PSF’ host in LegacySurvey DR8 | ||||
| 18acgnwpo | - | Unknown | No clear host | |||
| 19aanqqzb | - | Unknown | No clear host | |||
| 19aaqfdvu | - | Unknown | No clear host | |||
| 19aaxfqyx | - | Unknown | No clear host | |||
| 19abfzfbs | - | Unknown | No clear host |
We take eight as an upper limit for the number of transients in ZTF that could fall within the phase-space of Figure 1. Of these, three peak brighter than 19 mag, and four have a peak between 19 and 19.75 mag. We now calculate two all-sky rates. First we assume that the transient peaks at mag, in which case we discard field-nights with a limiting magnitude shallower than 19.75 mag. Then we assume that the transient peaks at mag, in which case we discard field-nights with a limiting magnitude shallower than 20.5 mag.
Each ZTF field is 47 deg2, but there is latitude-dependent overlap that has to be taken into account when converting this to a rate per square degrees in the sky. For the primary grid, a rough estimate of the fill factor is 87.5%. For the 1DC survey, the footprint is 10% smaller than the number of fields multiplied by 47 square degrees. So, taking fill factor and overlap into account, we estimate a typical area-per-field of 37 deg2. So for transients brighter than 19 mag we have and for transients brighter than 19.75 mag we have . For transients peaking brighter than 19 mag we have a limiting all-sky rate
| (6) |
For transients peaking brighter than 19.5 mag we have a limiting all-sky rate
| (7) |
Now, we use the limiting magnitude to estimate a volumetric rate. Assuming a transient that peaks at mag, requiring a peak apparent magnitude brighter than 19 mag restricts our sensitivity to 400 Mpc. So, we find a volumetric rate of . Requiring a peak apparent magnitude brighter than 19.75 mag restricts our sensitivity to 560 Mpc, leading to a volumetric rate of . For reference, we provide rates of core-collapse SNe and GRBs in Table 10. The rate of events like ZTF18abvkwla appears to be at least two orders of magnitude smaller than the CC SN rate, and more similar to the rate of GRBs in the local universe.
| Class | Rate/Fraction | References |
|---|---|---|
| SN II | [1] | |
| SN Ibc | [1] | |
| Frac. of Ibc SN that are Ic | [2,3] | |
| Frac. of Ic SN that are Ic-BL | [2,3] | |
| LLGRB | [4] | |
| [5] | ||
| GRB | [6] | |
| [7] | ||
| [8] |
6 Prospects for Detecting X-ray Emission
Clearly, radio observations are an important avenue of follow-up for transients like ZTF18abvkwla. Another valuable avenue is X-ray observations, which were not obtained for ZTF18abvkwla. We can estimate what the predicted X-ray luminosity would be from inverse Compton scattering, using the optical and radio luminosities:
| (8) |
Taking , where , and where G, we find . This is even more luminous than the X-ray emission observed accompanying AT2018cow, which had (Rivera Sandoval et al., 2018; Ho et al., 2019a; Margutti et al., 2019). To our knowledge there were no X-ray follow-up observations of DES16X1eho, while observations of iPTF16asu resulted in an X-ray upper limit of . Hosseinzadeh et al. (2017) report pre-peak UV measurements from Swift for iPTF15ul, but to our knowledge X-ray observations have not been reported. We measured an upper limit of in a single epoch from the publicly available Swift data. Assuming and a power-law source model with a photon index we obtain an upper limit on the unabsorbed 0.3–10 luminosity of .
7 Summary and Conclusions
ZTF18abvkwla is distinguished by two key characteristics: a fast-evolving optical light curve with a hot (K) and featureless thermal spectrum at peak, and a long-lived, fast-fading radio light curve similar to those of jet-powered long-duration GRBs. The host galaxy underwent a recent starforming episode and has a very high specific star-formation rate, similar to that of extreme SLSN and GRB hosts. Events like ZTF18abvkwla are rare: from one year of the ZTF 1DC survey, we estimate that the rate is at least 2–3 orders of magnitude smaller than the CC SN rate.
Due to the lack of late-time photometry, we cannot conclude whether the late-time light curve was powered by the same mechanism as the peak or whether another mechanism such as nickel decay became dominant, and we have only tentative evidence for color evolution (cooling) over time. Furthermore, we cannot determine whether this source developed supernova features and whether it most closely resembles a Ic-BL like iPTF16asu, a continuum with emission lines like the Ibn iPTF15ul or the SN/TDE candidate AT2018cow, or neither.
Among the fast-luminous optical transients in Table 1, only AT2018cow and SN 2011kl had detected radio emission. ZTF18abvkwla thus adds to the very small number of events in the literature established to have fast-blue optical light curves, as well as a separate fast ejecta component that produces luminous radio emission. Interestingly, most of the well-studied transients in Table 1 are associated with a candidate engine-powered explosion. AT2018cow had a long-lived central engine that powered a fast () outflow. The Koala likely had a central engine that powered an even faster () outflow, perhaps a relativistic jet. iPTF16asu was a Ic-BL SN, and therefore by definition had faster ejecta velocities than ordinary core-collapse supernovae, although there was no evidence for a jet. SN 2011kl had a burst of high-energy emission (GRB 111209A) and an associated luminous afterglow. Given the sensitivity of the luminosity to the shock speed (Equation 7), perhaps this apparent relationship between engine-driven supernovae and luminous fast-luminous optical transients should not be surprising.
At , ZTF18abvkwla was much more distant than AT2018cow (), but the lesson from §2.2 and §5 is that we should not be deterred by cosmological distances in pursuing X-ray and radio follow-up observations. The radio emission from ZTF18abvkwla would be easily detectable by the VLA out to (assuming RMS in half an hour of integration time) or even out to (when it would be ). Assuming a Swift/XRT sensitivity limit of , the X-ray emission from ZTF18abvkwla may have been on the detection threshold. For a Chandra sensitivity limit an order of magnitude deeper, this may be on the detection threshold at . At these larger distances () the optical -band magnitude would be 21.1 and 22.3 respectively. This is out of reach for current surveys like ZTF, but standard for LSST. The false positives in such a search are lower-luminosity explosions (Type IIb, II, and Ibn SNe) and CVs. These can be ruled out via knowledge of the host redshift (and therefore intrinsic luminosity), so we emphasize the need for extensive and reliable galaxy-redshift catalogs.
The code used to produce the results described in this paper was written in Python and is available online in an open-source repository777https://github.com/annayqho/Koala.
Appendix A Light-curve measurements
To construct Table 1, we used observed bands as close as possible to rest-frame : -band for , -band for , -band for , and -band for . We excluded transients with . We measured rise and fade times to 0.75 mag below peak by linearly interpolating the single-filter light curve, and measured uncertainties using a Monte Carlo with 1000 realizations of the light curve. Additional notes on each transient are below.
For iPTF15ul (; Hosseinzadeh et al. 2017) the uncertainty on the peak magnitude was dominated by the uncertainty from the host-galaxy extinction estimate. For AT2018cow (; Prentice et al. 2018; Perley et al. 2019a) we used the time between the last non-detection and the first detection as an upper limit on the rise time, although we note that interpolation would give 0.4 , much shorter than 3 . We also corrected for mag of Galactic extinction, which was not applied in Table 3 of Perley et al. (2019a). For a lower limit, we used the -band detection before peak (dominated by -band flux at this epoch), corrected for 0.198 mag of Galactic extinction. We assumed mag and mag.
For SN 2011kl () we used column in Table 2 of Kann et al. (2019). These values are corrected for rest-frame extinction, and the contributions from the GRB afterglow and host galaxy have been subtracted. For SNLS04D4ec (), SNLS05D2bk (), and SNLS06D1hc () we used the -band light curve from Arcavi et al. (2016) and corrected for Milky Way extinction.
For Dougie (; Vinkó et al. 2015) we added an additional 0.1 mag in quadrature to account for the zero-point uncertainty, and corrected for mag of Milky Way extinction. For iPTF16asu (; Whitesides et al. 2017) we could not measure the rise or peak magnitude in rest-frame because observations in the appropriate filter () began only 3 days after peak. We estimated an upper limit to the peak magnitude by assuming that the color at peak was identical to the color during the first -band measurement. We used the first -band measurement as a lower limit. For the time from half-max to max, we used the observed -band light curve instead. We obtained the -band light curve of DES16X1eho (; Pursiainen et al. 2018) from M. Pursiainen (private communication).
References
- Abolfathi et al. (2018) Abolfathi, B., Aguado, D. S., Aguilar, G., et al. 2018, ApJS, 235, 42
- Alexander et al. (2016) Alexander, K. D., Berger, E., Guillochon, J., Zauderer, B. A., & Williams, P. K. G. 2016, ApJ, 819, L25
- Aptekar et al. (1995) Aptekar, R. L., Frederiks, D. D., Golenetskii, S. V., et al. 1995, Space Sci. Rev., 71, 265
- Arcavi et al. (2016) Arcavi, I., Wolf, W. M., Howell, D. A., et al. 2016, ApJ, 819, 35
- Astropy Collaboration et al. (2013) Astropy Collaboration, Robitaille, T. P., Tollerud, E. J., et al. 2013, A&A, 558, A33
- Astropy Collaboration et al. (2018) Astropy Collaboration, Price-Whelan, A. M., Sipőcz, B. M., et al. 2018, AJ, 156, 123
- Barbary et al. (2016) Barbary, K. 2016, extinction, v0.3.0, Zenodo, doi: 10.5281/zenodo.804967, https://github.com/kbarbary/extinction
- Bellm & Sesar (2016) Bellm, E. C., & Sesar, B. 2016, Astrophysics Source Code Library, ascl:1602.002
- Bellm et al. (2019a) Bellm, E. C., Kulkarni, S. R., Graham, M. J., et al. 2019, PASP, 131, 018002
- Bellm et al. (2019) Bellm, E. C., Kulkarni, S. R., Barlow, T., et al. 2019, PASP, 131, 068003
- Berger et al. (2003) Berger, E., Kulkarni, S. R., Pooley, G., et al. 2003, Nature, 426, 154
- Berger et al. (2012) Berger, E., Zauderer, A., Pooley, G. G., et al. 2012, ApJ, 748, 36
- Bhat et al. (2016) Narayana Bhat, P., Meegan, C. A., von Kienlin, A., et al. 2016, ApJS, 223, 28
- Bianco et al. (2016) Bianco, F. B., Modjaz, M., Oh, S. M., et al. 2016, Astronomy and Computing, 16, 54
- Bietenholz et al. (2020) Bietenholz, M. F., Margutti, R., Coppejans, D., et al. 2020, MNRAS, 491, 4735
- Bock et al. (2006) Bock, D. C.-J., Bolatto, A. D., Hawkins, D. W., et al. 2006, Proc. SPIE, 626713
- Bruzual & Charlot (2003) Bruzual, G., & Charlot, S. 2003, MNRAS, 344, 1000
- Campana et al. (2006) Campana, S., Mangano, V., Blustin, A. J., et al. 2006, Nature, 442, 1008
- Cano et al. (2017) Cano, Z., Wang, S.-Q., Dai, Z.-G., & Wu, X.-F. 2017, Advances in Astronomy, 2017, 8929054
- Cenko et al. (2013) Cenko, S. B., Kulkarni, S. R., Horesh, A., et al. 2013, ApJ, 769, 130
- Cenko et al. (2015) Cenko, S. B., Urban, A. L., Perley, D. A., et al. 2015, ApJ, 803, L24
- Chevalier (1998) Chevalier, R. A. 1998, ApJ, 499, 810
- Chevalier & Irwin (2011) Chevalier, R. A., & Irwin, C. M. 2011, ApJ, 729, L6
- Condon (1992) Condon, J. J. 1992, ARA&A, 30, 575
- Coppejans et al. (2020) Coppejans, D. L., Margutti, R., Terreran, G., et al. 2020, arXiv e-prints, arXiv:2003.10503
- Dabringhausen et al. (2009) Dabringhausen, J., Kroupa, P., & Baumgardt, H. 2009, MNRAS, 394, 1529
- De Colle & Lu (2019) De Colle, F., & Lu, W. 2019, arXiv e-prints, arXiv:1911.01442
- Dey et al. (2019) Dey, A., Schlegel, D. J., Lang, D., et al. 2019, AJ, 157, 168
- Drout et al. (2014) Drout, M. R., Chornock, R., Soderberg, A. M., et al. 2014, ApJ, 794, 23
- Duev et al. (2019) Duev, D. A., Mahabal, A., Masci, F. J., et al. 2019, MNRAS, 489, 3582
- Eftekhari et al. (2018) Eftekhari, T., Berger, E., Zauderer, B. A., et al. 2018, ApJ, 854, 86
- Ferrero et al. (2006) Ferrero, P., Kann, D. A., Zeh, A., et al. 2006, A&A, 457, 857
- Firth et al. (2015) Firth, R. E., Sullivan, M., Gal-Yam, A., et al. 2015, MNRAS, 446, 3895
- Fitzpatrick (1999) Fitzpatrick, E. L. 1999, PASP, 111, 63
- Fox & Smith (2019) Fox, O. D., & Smith, N. 2019, MNRAS, 488, 3772
- Frail et al. (2001) Frail, D. A., Kulkarni, S. R., Sari, R., et al. 2001, ApJ, 562, L55
- Fremling et al. (2019) Fremling, C., Ko, H., Dugas, A., et al. 2019, ApJ, 878, L5
- Fruchter et al. (2006) Fruchter, A. S., Levan, A. J., Strolger, L., et al. 2006, Nature, 441, 463
- Gal-Yam (2019) Gal-Yam, A. 2019, ARA&A, 57, 305
- Gezari et al. (2009) Gezari, S., Heckman, T., Cenko, S. B., et al. 2009, ApJ, 698, 1367
- Gezari (2012) Gezari, S. 2012, European Physical Journal Web of Conferences, 03001
- Giannios & Metzger (2011) Giannios, D., & Metzger, B. D. 2011, MNRAS, 416, 2102
- Graham & Schady (2016) Graham, J. F., & Schady, P. 2016, ApJ, 823, 154
- Graham et al. (2019) Graham, M. J., Kulkarni, S. R., Bellm, E. C., et al. 2019, PASP, 131, 078001
- Greiner et al. (2015) Greiner, J., Mazzali, P. A., Kann, D. A., et al. 2015, Nature, 523, 189
- Greiner et al. (2016) Greiner, J., Michałowski, M. J., Klose, S., et al. 2016, A&A, 593, A17
- Gruber et al. (2014) Gruber, D., Goldstein, A., Weller von Ahlefeld, V., et al. 2014, ApJS, 211, 12
- Guetta et al. (2005) Guetta, D., Piran, T., & Waxman, E. 2005, ApJ, 619, 412
- Gupta et al. (2017) Gupta Y., et al., 2017, Current Science, 113, 707
- Hancock et al. (2012) Hancock, P. J., Murphy, T., Gaensler, B., et al. 2012, GRB Coordinates Network 12804, 1
- Ho et al. (2019a) Ho, A. Y. Q., Phinney, E. S., Ravi, V., et al. 2019, ApJ, 871, 73
- Ho et al. (2019b) Ho, A. Y. Q., Goldstein, D. A., Schulze, S., et al. 2019, ApJ, 887, 169
- Högbom (1974) Högbom, J. A. 1974, A&AS, 15, 417
- Horesh et al. (2013) Horesh, A., Stockdale, C., Fox, D. B., et al. 2013, MNRAS, 436, 1258
- Hosseinzadeh et al. (2017) Hosseinzadeh, G., Arcavi, I., Valenti, S., et al. 2017, ApJ, 836, 158
- Huang et al. (2019) Huang, K., Shimoda, J., Urata, Y., et al. 2019, ApJ, 878, L25
- Hunter (2007) Hunter, J. D. 2007, CISE, 9(3), 90
- Hurley et al. (2010) Hurley, K., Golenetskii, S., Aptekar, R., et al. 2010, American Institute of Physics Conference Series, 330
- Hurley et al. (2016) Hurley, K., Svinkin, D. S., Aptekar, R. L., et al. 2016, ApJ, 829, L12
- Irwin et al. (2015) Irwin, J. A., Henriksen, R. N., Krause, M., et al. 2015, ApJ, 809, 172
- Kann et al. (2010) Kann, D. A., Klose, S., Zhang, B., et al. 2010, ApJ, 720, 1513
- Kann et al. (2018) Kann, D. A., Schady, P., Olivares, E. F., et al. 2018, A&A, 617, A122
- Kann et al. (2019) Kann, D. A., Schady, P., Olivares E., F., et al. 2019, A&A, 624, A143
- Kasen (2017) Kasen, D. 2017, Handbook of Supernovae, ISBN 978-3-319-21845-8. Springer International Publishing AG, 2017, p. 939, 939
- Kasliwal et al. (2012) Kasliwal, M. M., Kulkarni, S. R., Gal-Yam, A., et al. 2012, ApJ, 755, 161
- Kasliwal et al. (2019) Kasliwal, M. M., Cannella, C., Bagdasaryan, A., et al. 2019, PASP,131, 038003
- Katz (2016) Katz, J. I. 2016, Modern Physics Letters A, 31, 1630013
- Kelly & Kirshner (2012) Kelly, P. L., & Kirshner, R. P. 2012, ApJ, 759, 107
- Kennicutt et al. (1994) Kennicutt, R. C., Tamblyn, P. C., & Congdon, C. E. 1994, ApJ, 435, 22
- Komossa (2015) Komossa, S. 2015, Journal of High Energy Astrophysics, 7, 148
- Krauss et al. (2012) Krauss, M. I., Soderberg, A. M., Chomiuk, L., et al. 2012, ApJ, 750, L40
- Krühler et al. (2015) Krühler, T., Malesani, D., Fynbo, J. P. U., et al. 2015, A&A, 581, A125
- Kuin et al. (2019) Kuin, N. P. M., Wu, K., Oates, S., et al. 2019, MNRAS, 487, 2505
- Kulkarni et al. (1998) Kulkarni, S. R., Frail, D. A., Wieringa, M. H., et al. 1998, Nature, 395, 663
- Lacy et al. (2019) Lacy, M., Baum, S. A., Chandler, C. J., et al. 2019, arXiv e-prints, arXiv:1907.01981
- Law et al. (2009) Law, N. M., Kulkarni, S. R., Dekany, R. G., et al. 2009, PASP, 121, 1395
- Lee et al. (2009) Lee, J. C., Kennicutt, R. C., Funes, S. J. J. G., et al. 2009, ApJ, 692, 1305
- Lei et al. (2016) Lei, W.-H., Yuan, Q., Zhang, B., et al. 2016, ApJ, 816, 20
- Li et al. (2011) Li, W., Chornock, R., Leaman, J., et al. 2011, MNRAS, 412, 1473
- Liang et al. (2007) Liang, E., Zhang, B., Virgili, F., et al. 2007, ApJ, 662, 1111
- Lien et al. (2014) Lien, A., Sakamoto, T., Gehrels, N., et al. 2014, ApJ, 783, 24
- Lu & Bonnerot (2020) Lu, W., & Bonnerot, C. 2020, MNRAS, 492, 686
- Lunnan et al. (2014) Lunnan, R., Chornock, R., Berger, E., et al. 2014, ApJ, 787, 138
- Leloudas et al. (2015) Leloudas, G., Schulze, S., Krühler, T., et al. 2015, MNRAS, 449, 917
- Lyman et al. (2016) Lyman, J. D., Bersier, D., James, P. A., et al. 2016, MNRAS, 457, 328
- Lyutikov, & Toonen (2019) Lyutikov, M., & Toonen, S. 2019, MNRAS, 487, 5618
- Mahabal et al. (2019) Mahabal, A., Rebbapragada, U., Walters, R., et al. 2019, PASP, 131, 038002
- Margutti et al. (2019) Margutti, R., Metzger, B. D., Chornock, R., et al. 2019, ApJ, 872, 18
- Masci et al. (2019) Masci, F. J., Laher, R. R., Rusholme, B., et al. 2019, PASP, 131, 018003
- Matheson et al. (2000) Matheson, T., Filippenko, A. V., Chornock, R., et al. 2000, AJ, 119, 2303
- McCarthy et al. (1998) McCarthy, J. K., Cohen, J. G., Butcher, B., et al. 1998, Proc. SPIE, 81
- McMullin et al. (2007) McMullin, J. P., Waters, B., Schiebel, D., Young, W., & Golap, K. 2007, Astronomical Data Analysis Software and Systems XVI, 376, 127
- Miller et al. (2020) Miller, A. A., Yao, Y., Bulla, M., et al. 2020, arXiv e-prints, arXiv:2001.00598
- Mirabal et al. (2006) Mirabal, N., Halpern, J. P., An, D., et al. 2006, ApJ, 643, L99
- Modjaz et al. (2019) Modjaz, M., Bianco, F. B., Siwek, M., et al. 2019, arXiv e-prints, arXiv:1901.00872
- Mohan et al. (2020) Mohan, P., An, T., & Yang, J. 2020, ApJ, 888, L24
- Murphy et al. (2011) Murphy, E. J., Condon, J. J., Schinnerer, E., et al. 2011, ApJ, 737, 67
- Nakar, & Piro (2014) Nakar, E., & Piro, A. L. 2014, ApJ, 788, 193
- Nakar (2015) Nakar, E. 2015, ApJ, 807, 172
- Nakar, & Piran (2017) Nakar, E., & Piran, T. 2017, ApJ, 834, 28
- Ofek et al. (2010) Ofek, E. O., Rabinak, I., Neill, J. D., et al. 2010, ApJ, 724, 1396
- Oke & Gunn (1982) Oke, J. B., & Gunn, J. E. 1982, PASP, 94, 586
- Oke, & Gunn (1983) Oke, J. B., & Gunn, J. E. 1983, ApJ, 266, 713
- Oke et al. (1995) Oke, J. B., Cohen, J. G., Carr, M., et al. 1995, PASP, 107, 375
- Oliphant (2006) Oliphant, T. E. 2006, A guide to NumPy, Trelgol Publishing
- Patterson et al. (2019) Patterson, M. T., Bellm, E. C., Rusholme, B., et al. 2019, PASP, 131, 018001
- Pérez & Granger (2007) Pérez, F. & Granger, B. E. 2007, CISE, 9(3), 29
- Perley et al. (2011) Perley, R. A., Chandler, C. J., Butler, B. J., et al. 2011, ApJ, 739, L1
- Perley et al. (2013) Perley, D. A., Levan, A. J., Tanvir, N. R., et al. 2013, ApJ, 778, 128
- Perley et al. (2014) Perley, D. A., Cenko, S. B., Corsi, A., et al. 2014, ApJ, 781, 37
- Perley et al. (2016) Perley, D. A., Quimby, R. M., Yan, L., et al. 2016, ApJ, 830, 13
- Perley et al. (2019a) Perley, D. A., Mazzali, P. A., Yan, L., et al. 2019, MNRAS, 484, 1031
- Perley (2019) Perley, D. A. 2019, PASP, 131, 084503
- Pian et al. (2006) Pian, E., Mazzali, P. A., Masetti, N., et al. 2006, Nature, 442, 1011
- Pietka et al. (2015) Pietka, M., Fender, R. P., & Keane, E. F. 2015, MNRAS, 446, 3687
- Piro (2015) Piro, A. L. 2015, ApJ, 808, L51
- Planck Collaboration et al. (2016) Planck Collaboration, Ade, P. A. R., Aghanim, N., et al. 2016, A&A, 594, A13
- Prentice et al. (2018) Prentice, S. J., Maguire, K., Smartt, S. J., et al. 2018, ApJ, 865, L3
- Pursiainen et al. (2018) Pursiainen, M., Childress, M., Smith, M., et al. 2018, MNRAS, 481, 894
- Quimby et al. (2011) Quimby, R. M., Kulkarni, S. R., Kasliwal, M. M., et al. 2011, Nature, 474, 487
- Rau et al. (2009) Rau, A., Kulkarni, S. R., Law, N. M., et al. 2009, PASP, 121, 1334
- Readhead (1994) Readhead, A. C. S. 1994, ApJ, 426, 51
- Rest et al. (2018) Rest, A., Garnavich, P. M., Khatami, D., et al. 2018, Nature Astronomy, 2, 307
- Rivera Sandoval et al. (2018) Rivera Sandoval, L. E., Maccarone, T. J., Corsi, A., et al. 2018, MNRAS, 480, L146
- Salas et al. (2013) Salas, P., Bauer, F. E., Stockdale, C., & Prieto, J. L. 2013, MNRAS, 428, 1207
- Schlafly & Finkbeiner (2011) Schlafly, E. F., & Finkbeiner, D. P. 2011, ApJ, 737, 103
- Schulze et al. (2015) Schulze, S., Chapman, R., Hjorth, J., et al. 2015, ApJ, 808, 73
- Schulze et al. (2018) Schulze, S., Krühler, T., Leloudas, G., et al. 2018, MNRAS, 473, 1258
- Scott & Readhead (1977) Scott, M. A., & Readhead, A. C. S. 1977, MNRAS, 180, 539
- Shivvers et al. (2017) Shivvers, I., Modjaz, M., Zheng, W., et al. 2017, PASP, 129, 054201
- Slysh (1990) Slysh, V. I. 1990, Soviet Astronomy Letters, 16, 339
- Smith & McCray (2007) Smith, N., & McCray, R. 2007, ApJ, 671, L17
- Smith (2014) Smith, N. 2014, ARA&A, 52, 487
- Soderberg et al. (2004) Soderberg, A. M., Kulkarni, S. R., Berger, E., et al. 2004, Nature, 430, 648
- Soderberg et al. (2005) Soderberg, A. M., Kulkarni, S. R., Berger, E., et al. 2005, ApJ, 621, 908
- Soderberg et al. (2006) Soderberg, A. M., Kulkarni, S. R., Nakar, E., et al. 2006, Nature, 442, 1014
- Soderberg et al. (2010) Soderberg, A. M., Chakraborti, S., Pignata, G., et al. 2010, Nature, 463, 513
- Sollerman et al. (2006) Sollerman, J., Jaunsen, A. O., Fynbo, J. P. U., et al. 2006, A&A, 454, 503
- Stratta et al. (2013) Stratta, G., Gendre, B., Atteia, J. L., et al. 2013, ApJ, 779, 66
- Strubbe & Quataert (2009) Strubbe, L. E., & Quataert, E. 2009, MNRAS, 400, 2070
- Swarup et al. (1991) Swarup, G., Ananthakrishnan, S., Kapahi, V. K., et al. 1991, Current Science, 60, 95
- Tachibana & Miller (2018) Tachibana, Y., & Miller, A. A. 2018, PASP, 130, 128001
- Taggart & Perley (2019) Taggart, K., & Perley, D. 2019, arXiv e-prints, arXiv:1911.09112
- Tendulkar et al. (2017) Tendulkar, S. P., Bassa, C. G., Cordes, J. M., et al. 2017, ApJ, 834, L7
- Thöne et al. (2011) Thöne, C. C., de Ugarte Postigo, A., Fryer, C. L., et al. 2011, Nature, 480, 72
- Tremonti et al. (2004) Tremonti, C. A., Heckman, T. M., Kauffmann, G., et al. 2004, ApJ, 613, 898
- van den Heuvel & Portegies Zwart (2013) van den Heuvel, E. P. J., & Portegies Zwart, S. F. 2013, ApJ, 779, 114
- van der Horst et al. (2014) van der Horst, A. J., Paragi, Z., de Bruyn, A. G., et al. 2014, MNRAS, 444, 3151
- Vergani et al. (2015) Vergani, S. D., Salvaterra, R., Japelj, J., et al. 2015, A&A, 581, A102
- Vinkó et al. (2015) Vinkó, J., Yuan, F., Quimby, R. M., et al. 2015, ApJ, 798, 12
- Virtanen et al. (2019) Virtanen, P., Gommers, R., Oliphant, T. E., et al. 2019, arXiv e-prints, arXiv:1907.10121
- von Kienlin et al. (2014) von Kienlin, A., Meegan, C. A., Paciesas, W. S., et al. 2014, ApJS, 211, 13
- Wang et al. (2019) Wang, L. J., Wang, X. F., Cano, Z., et al. 2019, MNRAS, 489, 1110
- Watson et al. (2017) Watson, C., Henden, A. A., & Price, A. 2017, VizieR Online Data Catalog, B/vsx
- Waxman & Katz (2017) Waxman, E., & Katz, B. 2017, Handbook of Supernovae, 967
- Weiler et al. (1986) Weiler, K. W., Sramek, R. A., Panagia, N., van der Hulst, J. M., & Salvati, M. 1986, ApJ, 301, 790
- Weiler et al. (1991) Weiler, K. W., van Dyk, S. D., Panagia, N., Sramek, R. A., & Discenna, J. L. 1991, ApJ, 380, 161
- Weiler et al. (2007) Weiler, K. W., Williams, C. L., Panagia, N., et al. 2007, ApJ, 671, 1959
- Whitesides et al. (2017) Whitesides, L., Lunnan, R., Kasliwal, M. M., et al. 2017, ApJ, 851, 107
- Yao et al. (2019) Yao, Y., Miller, A. A., Kulkarni, S. R., et al. 2019, arXiv e-prints, arXiv:1910.02967
- Zackay et al. (2016) Zackay, B., Ofek, E. O., & Gal-Yam, A. 2016, ApJ, 830, 27
- Zauderer et al. (2011) Zauderer, B. A., Berger, E., Soderberg, A. M., et al. 2011, Nature, 476, 425
- Zauderer et al. (2013) Zauderer, B. A., Berger, E., Margutti, R., et al. 2013, ApJ, 767, 152
- Zwart et al. (2008) Zwart, J. T. L., Barker, R. W., Biddulph, P., et al. 2008, MNRAS, 391, 1545