Which Pull Requests Get Accepted and Why? A study of popular NPM Packages
Abstract.
Background: Pull Request (PR) Integrators often face challenges in terms of multiple concurrent PRs, so the ability to gauge which of the PRs will get accepted can help them balance their workload. PR creators would benefit from knowing if certain characteristics of their PRs may increase the chances of acceptance. Aim: We modeled the probability that a PR will be accepted within a month after creation using a Random Forest model utilizing 50 predictors representing properties of the author, PR, and the project to which PR is submitted. Method: 483,988 PRs from 4218 popular NPM packages were analysed and we selected a subset of 14 predictors sufficient for a tuned Random Forest model to reach high accuracy. Result: An AUC-ROC value of 0.95 was achieved predicting PR acceptance. The model excluding PR properties that change after submission gave an AUC-ROC value of 0.89. We tested the utility of our model in practical scenarios by training it with historical data for the NPM package bootstrap and predicting if the PRs submitted in future will be accepted. This gave us an AUC-ROC value of 0.94 with all 14 predictors, and 0.77 excluding PR properties that change after its creation. Conclusion: PR integrators can use our model for a highly accurate assessment of the quality of the open PRs and PR creators may benefit from the model by understanding which characteristics of their PRs may be undesirable from the integrators’ perspective. The model can be implemented as a tool, which we plan to do as a future work.
1. Introduction
The source code of an Open Source Software is publicly available and can be modified and reused with limited restrictions by the public. A major upside of this is that the users can and do contribute to and reuse the software. User contributions consist of primarily reporting and fixing bugs and adding or requesting for additional features to the software. The Pull Request based development model, that is prevalent among most OSS version control systems, is a distributed development model that allows other user-developers to make contributions, which can be easily tracked, thus supporting the collaboration between the maintainer and the contributor. The mechanics of the approach is that potential contributors first fork (clone) the original repository they are planning to contribute to, and after making the code changes they create a Pull Request (PR), which is essentially an issue with a patch included. Then a maintainer of the original project (the integrator) inspects the PR’s code changes and decides if it can be merged to the project and interacts via discussion thread associated with the PR, with the submitter and other maintainers and/or potential contributors.
This development model allows developers outside of a project to contribute while not compromising the code of the original project by only merging approved changes to the repository and was found to be associated with shorter review times and larger numbers of contributors compared to mailing list code contribution models (Zhu et al., 2016). However, inspecting PRs is a crucial task requiring a significant amount of effort from the integrator (Rigby et al., 2014). It has been extensively documented (see, e.g. (Xie et al., 2013)) that large numbers of low-quality issues may overwhelm the projects and the same is true for PRs. It was reported in (Gousios et al., 2015), based on a survey of 750 integrators from high volume projects, that the top two challenges they face when working with pull requests are maintaining project quality and prioritizing work in the face of multiple concurrent pull requests. Therefore, having a good estimate of PR quality would be highly desirable and would help the integrator to prioritize the PRs. Moreover, the creators of the pull requests would also benefit from having an indication of the quality of a PR they are about to submit, and knowing what factors affect the quality of the PR could help them improve that PR and the ones they might submit in future. E.g. if they find that having too many commits in their PR is affecting its quality, they might try submitting smaller patches with fewer commits.
However, PR “quality” has no universal definition, it is a highly contextual factor and might mean very different things in different scenarios. To operationalize the measure of quality for PRs, we chose the ultimately pragmatic indicator: whether it is merged (accepted) or not. After all, it should be based on the contextual knowledge of the integrator at the time of acceptance and should take into account a variate of factors the integrator has to consider when accepting a PR. A comprehensive treatment of code contribution theory in Rigby et. al. (Rigby et al., 2014) considers the acceptance rate as one of the most fundamental properties of the peer-review systems. In this paper we, therefore, define the quality of a PR by its probability of getting merged.
To conduct an empirical study investigating PR quality we chose node package manager (NPM) because of the size of the associated ecosystem and availability of data. NPM is a package manager of JavaScript packages, and is one of the largest OSS communities at present, with over 932,000 different packages (Apr, 2019) and millions of users (estimated 4 million in 2016 (Voss, 2016), and about 4000 new users on an average day111https://twitter.com/seldo/status/880271676675547136). NPM is used heavily by companies as well. According to the NPM website222https://www.npmjs.com/, all 500 of the Fortune 500 companies use NPM, and they claim that: “ Every company with a website uses npm, from small development shops to the largest enterprises in the world.” However, most packages in NPM are not widely used and have limited or no issues or PRs. We, therefore, focused on 4218 NPM packages with over 10,000 monthly downloads (the “popular” packages) since January, 2018, that also has an active GitHub repository with at least one Pull Request. All 483,988 PRs, that were filed against these packages (until January, 2019 when the data was collected), were obtained using the GitHub API.
A previous study (v. d. Veen et al., 2015) described a priority inbox type of approach for Pull Request prioritization aimed at helping integrators deal with multiple concurrent PRs. They introduced a prototype tool called PRioritizer, a service-oriented architecture built on top of GHTorrent (Gousios, 2013), that examines all open pull requests and presents the project integrators with the top pull requests that potentially need their immediate attention. They split the time into configurable time windows (by default 1 day) and prioritize the PRs based on whether or not a PR is likely to get a user update in the next time window, with the ones most likely to get an update considered as the most important. The approach was evaluated on the historical data of 475 projects, and gave the best performance using Random Forest model, with an accuracy of 0.85.
While the automatic prioritization is a useful approach for the integrators, it offers little insight to the creators of the PR about the quality of the submitted PR. More importantly, PRioritizer sorts the PRs based on how likely they will have some user activity in the next time window, which may or may not indicate the PR will be merged, i.e. it is not necessarily indicative of the quality of the PR. Keeping these limitations of the earlier approach in mind, our overarching Research Question was: What is the probability that a PR will be accepted within one month from the date of creation? We chose the time period of one month because only around 6.5% of the accepted PRs were accepted more than one month after creation, so this time window is sufficient to approximate the probability that a PR will ever be accepted. Moreover, a period of one month gives the project owners as well as the integrators sufficient time to plan which updates will likely be incorporated in near future.
In this study we want to investigate theoretical and practical
aspects of our overarching research question. We start from
an approximate replication of prior results by investigating how the
predictors listed in (v. d.
Veen et al., 2015) work with this slightly
modified research question on a much larger dataset. Although this
is not an exact replication, the objective of our study is very
similar, and this attempt should put it more firmly in the context
of prior research.
Thus, the first goal of our study is:
G1: How well does a model using the predictors listed
in (v. d.
Veen et al., 2015) perform in predicting PR’s acceptance?
Next, we wanted to understand if the model can be improved if we
take into account more comprehensive information about the PR
itself, the base project to which the PR is submitted, and the
characteristics of the PR creator (contributors’ track record and experience, both of which are indicators of expertise, were seen to have an effect of PR evaluation latency (Yu
et al., 2015) and PR acceptance (Rahman and Roy, 2014)).
These studies looked into the developers’ expertise into the specific project where the PR is submitted. However, we hypothesize that the developers’ activity, another indicator of expertise, across all OSS projects should also have an impact on the quality of PRs they submit.
To test this hypothesis we obtained a much more comprehensive data set representing the
complete history of activities of the contributors and projects,
where we included author activities with all OSS projects, not just the
4218 projects under study (details in Sections 3
and 4). We hypothesize that variables related to the PR
creator’s activity and historical performance, the properties of the
PR, the characteristics of the base repository (to which the PR is being submitted to), and that of the head repository (the fork/clone from which the PR is being submitted) may have an impact on the probability of the PR being accepted.
Therefore, the second goal of our study is:
G2: Can we more accurately predict the acceptance of a PR
using a wide range of predictors characterizing the author, PR, and
the base and forked repositories?
While a well-performing model can predict whether a PR will be
accepted or not with a high degree of confidence, it
does not provide insights to the PR authors who would like to
improve the chances of their PR being accepted. Specifically, we
wanted to illustrate how the probability of a PR of getting merged
may vary as the values the key predictors changes.
This was an insight requested by 86% of the integrators the authors of (v. d.
Veen et al., 2015) interviewed as well. So, the third goal of our study is:
G3: How does the probability of a PR getting merged vary
as the characteristics of the PR change?
It is important to point out that the performance of a model in a
historic context may not represent the actual performance for
certain practical tasks. For example, as an integrator, we may want
to compare a PR opened a few weeks ago, that has an
extensive collection of comments, with a newly opened PR.
Some PR characteristics, such as
the age of the PR or the number of comments it receives changes
after submission. The integrator would like to be able to prioritize PRs
immediately after submission, potentially reducing the time it takes
to accept important PRs. Another goal of our study is, therefore,
about predicting the probability of getting merged for the newly
submitted PRs so that the model would not penalize recently
submitted PRs.
G4: Can we predict the probability of acceptance of a PR
using information available at the time of PR submission?
Finally, we want to illustrate how the model may be used in practice
and how well it would have performed for a specific large software
project. This is motivated by the fact that software projects change
over time and the model fitted on past data may not accurately
predict the acceptance of future PRs. Also, the information
available in practice at the time of PR submission would not include
some of the predictors for the best-performing model as discussed in
G4. The fifth goal of our study is:
G5: How accurate would the PR acceptance model be in a scenario
representing actual use in a large project?
To achieve these goals we obtained the necessary measurements and used a tuned a Random Forest model. Our main findings are: (1) The model using the predictors listed in (v. d. Veen et al., 2015) perform gave an AUC-ROC value of 0.89 predicting PR acceptance rates. (2) Using predictors characterizing the author, PR, and source and base repositories we could achieve a much higher AUC-ROC value of 0.95. (3) We found the response curves to be non-monotonic for most of the predictors (detailed result discussed in Section 5). (4) Excluding variables that change over the lifetime of a PR resulted in an AUC-ROC value of 0.89. (5) Such predictor applied to the NPM package “bootstrap333https://www.npmjs.com/package/bootstrap”, and trained with only past data (prior to 2017-01-01) had AUC-ROC of 0.77 predicting acceptance of post 2017 PRs. If the model was trained with a full set of 14 variables on the same past data, the AUC-ROC increased to 0.94.
Our theoretical contributions include: (1) an approximate replication study using the predictors in prior work to answer a slightly different research question, and with a different and much larger dataset; (2) identification of the different factors that are associated with PR acceptance (quality), and the response curves for these predictors (how different values of each of these predictors affect the chance of a PR getting accepted); (3) result showing that the PR creator’s activity in unrelated projects can also affect the quality of PRs they submit; and (4) identification of the factors that intuitively should affect the chance of a PR getting accepted, but were found to be not necessary to get an accurate predictions.
Our practical contributions include: (1) a highly accurate predictive model relying on a set of predictors that aren’t difficult to calculate; (2) an approximate “sweet spot” in terms of the size of the PR that appears to significantly increase the probability of acceptance of a PR (a potential recommendation for the PR creators); (3) a well-performing model using only predictors available at the time of PR creation; (4) an illustrative example showing the application and performance of the model on a large NPM package.
Our data and code will be made available in our GitHub repository, which would enable other practitioners to use it for their research.
The rest of the paper is organized as follows: In Section 2, we discuss the related works in the topic. In Section 3, we discuss the Methodology. In Section 4, we describe the data collection and data processing steps. In Section 5, we describe the results we found pertaining to our research goals. The implications of the findings are discussed in Section 6. Finally, we discuss the limitations of our study in Section 7 and conclude our paper in Section 8.
2. Related Work
Studies about Pull Requests are abundant both in terms of the number of studies and exploring the different topics associated to the PR based development. While majority of the works explored topics related to PR assignment, a number of studies, including a few case studies, explored the PR quality and PR acceptance scenario.
The PRioritizer (v. d. Veen et al., 2015) study discusses the prioritization of the PRs for helping the integrators deal with multiple concurrent PRs. There are other studies that explore the perspective of the PR creators (Gousios et al., 2016) and the PR integrators (Gousios et al., 2015), and list the challenges and practices in PR creation and merging scenario. These studies highlight that the primary challenges for the integrators are maintaining the project quality and dealing with multiple concurrent PRs, while the contributors face challenges regarding the compliance with the project guidelines for writing code and receiving timely feedback from the project owners.
A number of studies describe various factors that influence the chance of PR getting accepted, like (Soares et al., 2015), which advocates using association rules to find the important factors, and found that the acceptance rates vary with the language the repository is written in, and also that having fewer commits, no additions, some deletions, some changed files, and the author having created a PR before and/or being part of the core team increase the chance of getting a PR accepted; (Weißgerber et al., 2008), which indicates smaller PRs are more likely to get accepted; (Yu et al., 2015), which shows previously established track records of the contributors, availability and workload of the evaluators, and continuous integration based automated testing etc. have an impact on the latency of PR evaluation; (Rahman and Roy, 2014), which examined the effects of developer experience, language, calendar time etc. on the PR acceptance; (Tsay et al., 2014), which analyzed the association of various technical and social measures with the likelihood of PR acceptance..
There are a number of case studies that discuss the PR acceptance scenario in various OSS projects, like the Linux kernel (Jiang et al., 2013), Firefox (Baysal et al., 2012; Mockus et al., 2002), Apache (Mockus et al., 2002) etc.
There are other studies that described various aspects of the Pull Request based development model, like (Gousios et al., 2014; Bleikamp, 2012; Dabbish et al., 2012). A lot of studies about PRs focused on finding the right evaluator for a particular PR, which is an important question as well, like (Yu et al., 2014b, a; Jiang et al., 2017; Yu et al., 2016) to name a few.
The NPM ecosystem is one of the most active and dynamic JavaScript ecosystems and (Wittern et al., 2016) presents its dependency structure and package popularity. Studies on NPM have mostly focused on its dependency networks (Decan et al., 2018), the popularity of NPM packages (Dey and Mockus, 2018), problems associated with library migration (Zapata et al., 2018), user participation patterns (Dey et al., 2019) etc.
3. Methodology
| \cellcolor[HTML]FFFFC7Total no. of PRs submitted by the creator before submitting this PR | \cellcolor[HTML]FFCCC9age of the PR | \cellcolor[HTML]9AFF99No. of PRs submitted to the repository previously | If the head repo is a fork | If the base repo is a fork |
|---|---|---|---|---|
| \cellcolor[HTML]FFFFC7Fraction of the total PRs submitted by the creator that are merged | \cellcolor[HTML]FFCCC9Calendar date of PR creation | \cellcolor[HTML]9AFF99Fraction of PRs submitted to the repository that are accepted | size of the head repo | size of the base repo |
| \cellcolor[HTML]FFFFC7The creator’s association with repository | \cellcolor[HTML]FFCCC9If the PR is marked as Closed | \cellcolor[HTML]9AFF99If the package associated is a direct dependency of any of the PR creator’s repositories | no. of stars of the head repo | no. of stars of the base repo |
| \cellcolor[HTML]FFFFC7If the creator submitted PRs to this repository previously | \cellcolor[HTML]FFCCC9No. of discussion comments | \cellcolor[HTML]9AFF99No. of NPM packages associated with the repository | If the head repo had issues enabled | If the base repo had issues enabled |
| \cellcolor[HTML]FFFFC7If the user had any PR accepted in this repository | No. of code review comments | \cellcolor[HTML]FFCCC9If the PR is from a different branch of the same repository | If the head repo had wiki enabled | If the base repo had wiki enabled |
| \cellcolor[HTML]FFFFC7If the PR creator was the integrator for some other PR previously | No. of lines added | \cellcolor[HTML]FFCCC9If the PR contains fix for some issue | If the head repo had projects enabled | If the base repo had projects enabled |
| \cellcolor[HTML]FFFFC7If this is the first time the creator is submitting a PR | No. of lines deleted | \cellcolor[HTML]FFCCC9If the PR contains any test code | If downloads were enabled for the head repo | If downloads were enabled for the base repo |
| \cellcolor[HTML]FFFFC7Total no. of commits by the PR creator across all Git projects | No. of files touched | \cellcolor[HTML]FFCCC9If the PR description has any HTML tag in it | No. of forks of the head repo | No. of forks of the base repo |
| \cellcolor[HTML]FFFFC7 Total no. of blobs touched by the PR creator across all Git projects | No. of commits in the PR | \cellcolor[HTML]FFCCC9If the PR description has any emoji in it | No. of issues for the head repo | No. of issues for the base repo |
| Total no. of Git projects the PR creator contributed to | \cellcolor[HTML]FFFFC7 Fraction of creator’s commits in the repo | \cellcolor[HTML]DAE8FCIf the head repo was deleted after the PR was submitted | Calendar date of head repo creation | Calendar date of base repo creation |
3.1. Data Collection
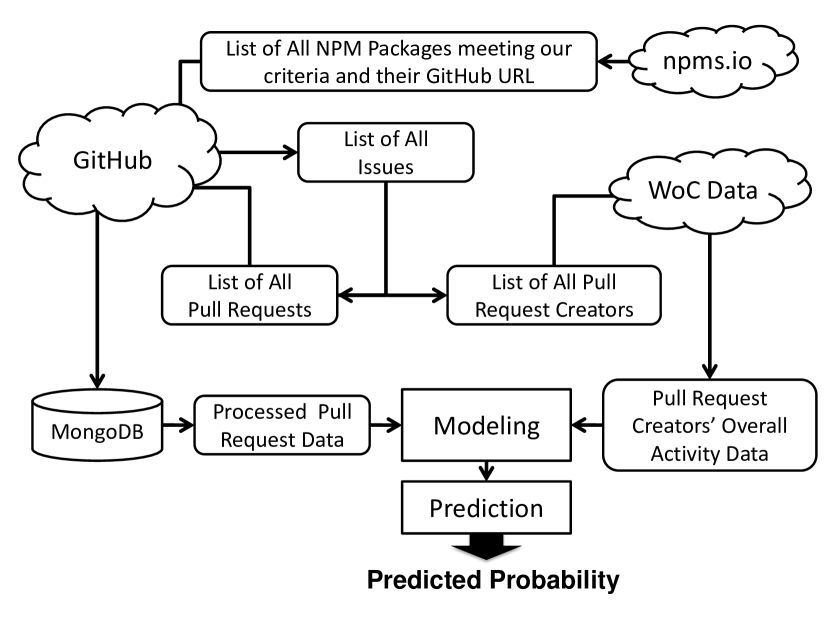
To answer the Research Question and address the different goals listed in Section 1, we first needed the list of all NPM packages that satisfy our criteria of having more than 10,000 downloads per month and a GitHub repository with at least one PR. This was obtained from the npms.io website, using the API provided 444https://api.npms.io/v2/package/[package-name]. The associated GitHub repository URLs were collected from their metadata information, which was obtained by using a “follower” script, as described in NPM’s GitHub repository 555https://github.com/npm/registry/blob/master/docs/follower.md. After filtering for our criteria that the NPM package must have more than 10,000 monthly downloads (since January, 2018), a functional link to its GitHub repository, and at least one PR, we were left with 4218 different NPM packages.
Next, we needed the list of all PRs for these NPM packages. To obtain this, we first collected all the issues associated with these NPM packages, since GitHub considers PRs as issues, and then identified the issues that have an associated patch, i.e. the ones that are Pull Requests. The list of all issues for the packages was obtained using the GitHub API for issues666https://developer.github.com/v3/issues/, using the state=all flag.
Out of all the issues, we identified 483,988 PRs for the 4218 packages (until January, 2019, when the data was collected).
It is worth mentioning here that sometimes more than one NPM package can have the same associated GitHub repository, e.g. all TypeScript NPM packages (starting with “@types/”, like @types/jasmine, @types/q, @types/selenium-webdriver etc.) refer to GitHub repository
“DefinitelyTyped/DefinitelyTyped”. To avoid double-counting and further confusion, we saved the issues keying on the repository instead of the package name, though we also saved the list of packages associated with a repository. We found that there are 3601 unique repositories associated with these 4218 packages.
Then we obtained the data on all the PRs from GitHub using the API777https://developer.github.com/v3/pulls/. This data was stored in a local MongoDB database. We used a Python script to extract the data from this database and process it into a CSV file that was used for modeling. More details about the data are discussed in Section 4.
The data on the PR creators’ overall activity across all projects that use Git were obtained from a recent version (version V) of the WoC (World of Code) data (Ma et al., 2019). WoC is a prototype of an updatable and expandable infrastructure to support research and tools that rely on version control data from the entirety of open source projects that use Git. Specifically, we used it to compile the profiles of PR authors. We identified PR authors by obtaining commits they included in their PRs. We then identified the commit authors for these commits in WoC using commit to author maps. Then we identified all the remaining commits for these authors using author to commit map. That full set of commits for each author was used to count projects (via commit to project map), files, and blobs (specific versions of a source code file). We only counted blobs created by the author (by verifying that the author mad the first commit creating the said blob) to reduce the noise produced when developers clone repositories, thus creating a massive number of blobs that were authored by others. To construct relevant measures for the PR prediction we only used the commits made by the PR author prior to the creation of the PR, thus reconstructing the state of affairs as it existed at the time of PR creation.
The data from these two sources (the PR data from GitHub and the PR creators’ activity data collected using the WoC tool) were consolidated to construct the final dataset we used for modeling. We sorted the data by the PR creation date, and extracted relevant variables from it, making sure only to use historical information while constructing different variables. More details on the data is discussed in Section 4.
3.2. Data Analysis
We performed our data analysis (modeling) tasks in R. Our response variable for modeling was the binary variable indicating whether a PR is merged with one month (30 days) after the date of creation or not. We looked into several modeling approaches for predicting the probability of acceptance of the PRs: Logistic Regression, Generalized Additive Models, Support Vector Machines, Random Forest, and Multi-Layer Perceptron networks. We tested all of these approaches on our dataset with the full set of predictors (listed in Section 4), and found that a tuned Random Forest model performs better than the others. Therefore, we decided to use it as our modeling methodology for this study.
To obtain the optimal number of predictors we used the “rfcv” function from the randomForest R package, which shows the cross-validated prediction performance of models with sequentially reduced number of predictors (ranked by variable importance) via a nested cross-validation procedure.
We used the “train” function from the caret package in R for performing a grid search (using a 10 fold cross-validation) on the training data to find the optimal values of the model parameters: “ntree” (number of trees to grow) and “mtry” (number of variables randomly sampled as candidates at each split), that gives the highest Accuracy. The optimum value for “ntree” was found to be 500, and the optimum value of “mtry” was found to be 6.
To calculate the performance of the final tuned model, we decided to use 70% of the data, selected randomly, as our training set, and the other 30% as our test set. Models with this configuration were used to predict the final probabilities of the PRs getting merged under different conditions pertaining to the different research goals we have.
We wanted to test the viability of our approach and the predictive performance of our model in a realistic scenario. So we decided to look into one NPM package as an example, and see if historical information about the package can be used to predict whether a PR submitted in future will be accepted or not. We needed a package that has sufficient number of PRs, so that we have enough historical data to train the model and enough PRs in the test set, so that the test results are trustworthy. We selected the “bootstrap”888https://www.npmjs.com/package/bootstrap NPM package as an example since it is a popular package that matches our criteria. The details of the data on this package are discussed in Section 4.
| Variable Name | Variable Description | 5% | Median | Mean | 95% | Distribution Plot |
| age | Seconds between PR creation and PR closure (max 30 days = 30*24*3600) | 231 | 100*1e3 | 651*1e3 | 2.5*1e6 | |
| commits | Number of commits in the Pull Request | 1 | 1 | 4 | 7 | |
| changed_files | Number of files modified in the Pull Request | 1 | 2 | 10 | 17 | |
| comments | Number of discussion comments against the Pull Request | 0 | 2 | 3 | 11 | |
| review_comments | Number of code review comments against the Pull Request | 0 | 0 | 1 | 6 | |
| additions | Number of lines added in the Pull Request | 1 | 12 | 703 | 619 | |
| deletions | Number of lines deleted in the Pull Request | 0 | 2 | 385 | 248 | |
| creator_total_commits | Total number of commits made by the PR creator across Git Projects | 4 | 786 | 9847 | 12,386 | |
| creator_total_blobs | Total number of blobs authored by the PR creator across Git Projects | 6 | 2080 | 12,308 | 40,808 | |
| creator_total_projects | Total number of projects the PR creator contributed to across Git Projects | 3 | 1632 | 6481 | 31,880 | |
| repo_submitted | Number of PRs submitted against the repository | 9 | 787 | 4787 | 30,270 | |
| repo_accepted | Fraction of the submitted PRs accepted by the repository | 0.1 | 0.70 | 0.63 | 0.91 | |
| creator_submitted | Number of PRs submitted by the PR creator across NPM projects | 0 | 12 | 282 | 1043 | |
| creator_accepted | Fraction of PRs submitted by the PR creator accepted across NPM projects | 0 | 0.64 | 0.53 | 1.00 |
4. Data Description
In this section, we present the original set of variables we started with, and the final set of variables we used for our final models.
We were careful to include the variables listed in (v. d. Veen et al., 2015) in our dataset, however, we later decided not to use the variable: “Last Comment Mention”, since (1) while it might be important to predict whether a PR will see some activity in the next time window (which was the goal of (v. d. Veen et al., 2015)), it is unlikely to have as much importance in predicting whether a PR will be accepted or not, and more importantly, (2) for a number of PRs, there are comments on it even after it is merged999e.g. https://github.com/twbs/bootstrap/pull/29257, and given (v. d. Veen et al., 2015) only dealt with open PRs, it is hard to replicate the variable in our context.
We extracted 50 variables from the PR data collected using the GitHub API and the PR creators’ activity data collected using the WoC tool. The list of the description of these variables is presented in Table 1. The variables can broadly be grouped into 5 categories, that describe different characteristics of : (1) The PR creator (the yellow box), (2) The specific PR (red box), (3) The NPM package repository under consideration (green box), (4) The specific characteristics of the head repository, from which the PR is submitted (blue box), and (5) The specific characteristics of the base repository to which the PR is submitted (gray box).
Using the “rfcv” function, as mentioned in Section 3, we found that 14 variables give the optimum result. So, first we created a Random Forest model using all the variables as predictors, and then we selected the top 14 predictors by looking at the variable importance. The variables that were selected in our final set of predictors are marked in bold in Table 1. The variable names used in the models, along with their descriptions, descriptive statistics, and distribution plots are shown in Table 2. The variable age was measured in seconds. Since our Research Question was about finding out if a PR is merged within one month of creation, we used 30 days, or seconds as the max value for age.
The values of creator_submitted and repo_submitted for a particular PR are the number of PRs that were submitted, before that particular PR was submitted. The fractions representing PR acceptance by the repository (repo_accepted) and for the PR creator (creator_accepted) are also measured by only considering the PRs that were submitted and accepted before that particular PR was submitted. Therefore the values of these four variables varied for different PRs.
Since the original distributions for most of the variables were very skewed, we decided to log transform the data before using them in the models.
It is worth mentioning that the PR creator’s association with the repository where the PR was submitted was one of the most important predictors according to variable importance, similar to what was observed by (Tsay et al., 2014). However, we decided not to use this variable in our final dataset since the value of this field can be updated retroactively (e.g. a PR creator, who had no association with a project when first submitting a PR, might become a member later, and the corresponding field in the first PR might be updated after its acceptance), and we have no way to know the creator’s association at the time a PR was submitted, or to verify that the affiliation wasn’t updated retroactively (see Section 6 for examples to the contrary), which would be required to faithfully reconstruct the data as it were at the time the PR was created. Instead of using this variable, we created two binary variables indicating whether the creator created any PR to the particular repository before and if any of those PRs had been accepted, but both of them proved to be not very significant. We, therefore, suspect that its importance in prior work could be due to the so called data leakage (Tu et al., 2018), when the information leaked from the “future” makes prediction models misleadingly optimistic.
As mentioned in Section 3, we selected the NPM package “bootstrap” to test the viability of our model in a practical scenario. The package had 8425 PRs submitted against it, out of which 4589 (54.5%) were merged. We decided to look at the PRs submitted until 2016-12-31 as our training data, and PRs submitted on or after 2017-01-01 as our test data, which left 6436 (76% of the PRs for this package) PRs in the training set. However, the two sets weren’t equally balanced, since 42% of the PRs in the training set were accepted, but 58% of the PRs in the test set were accepted. Still, we went ahead with using this dataset to address our Goal 5.
5. Results
In this section we discuss our findings and address the Research Goals listed in Section 1, and present some general statistics about the data.
5.1. General Statistics about the Data
Here we discuss some general statistics, which, in spite of not being directly related to our research goals, can give us some insight into the data and the NPM ecosystem in general.
To recap, our study focused on 4218 NPM packages (3601 unique GitHub repositories) with more than 10,000 monthly downloads since January, 2018, an active GitHub repository, and at least one PR. We collected 483,988 pull-requests, which were created by 82,142 creators.
A few interesting statistics about the data are reported below:
-
•
291,089 (60%) of the total PRs that were submitted were merged (accepted).
-
•
We found that 39,570 (48.2%) of the creators created only one PR (one time contributors), and only 6523 (7.9%) creators created 10 or more PRs.
-
•
294 (8.2%) repositories received only one PR, and 535 (14.9%) of the repos received 100 or more PRs.
-
•
397583 (82%) PRs were created for NPM packages that any project the PR creator contributed to depend on directly.
-
•
only 11357 (2.3%) PRs were still open when the data was collected.
-
•
312409 (65%) head repositories from which PRs were submitted were forks of the original (base) repositories.
-
•
209216 (43%) of the PRs submitted contained fixes for some bugs.
![[Uncaptioned image]](/html/2003.01153/assets/images/PDage.png) |
![[Uncaptioned image]](/html/2003.01153/assets/images/PDrepoA.png) |
![[Uncaptioned image]](/html/2003.01153/assets/images/PDrepoS.png) |
![[Uncaptioned image]](/html/2003.01153/assets/images/PDcomments.png) |
![[Uncaptioned image]](/html/2003.01153/assets/images/PDcreatorAcc.png) |
![[Uncaptioned image]](/html/2003.01153/assets/images/PDadditions.png) |
![[Uncaptioned image]](/html/2003.01153/assets/images/PDdeletions.png) |
![[Uncaptioned image]](/html/2003.01153/assets/images/PDcommits.png) |
![[Uncaptioned image]](/html/2003.01153/assets/images/PDreview.png) |
![[Uncaptioned image]](/html/2003.01153/assets/images/PDcreatorS.png) |
![[Uncaptioned image]](/html/2003.01153/assets/images/PDctp.png) |
![[Uncaptioned image]](/html/2003.01153/assets/images/PDctb.png) |
![[Uncaptioned image]](/html/2003.01153/assets/images/PDctc.png) |
![[Uncaptioned image]](/html/2003.01153/assets/images/PDchangedFiles.png) |
5.2. Assessing the performance of model using the predictors listed in (v. d. Veen et al., 2015) (G1)
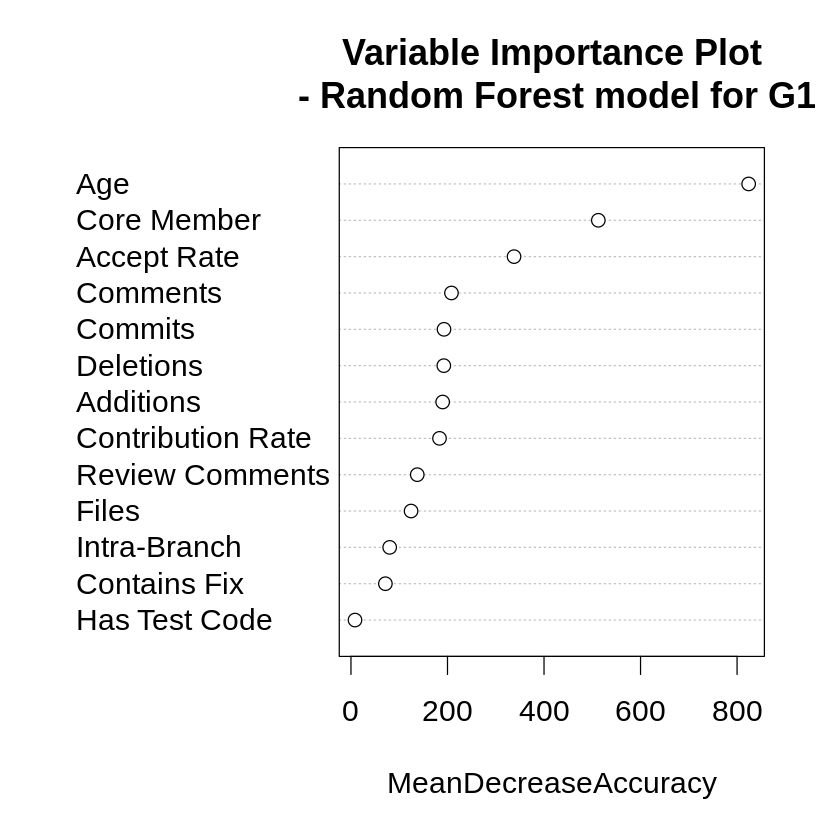
As mentioned in Section 3, we used a tuned Random Forest model and assessing its predictive performance using 13 out of the 14 predictors. The model performed pretty well using these predictors, with the value of AUC under the ROC curve being 0.89. By examining the confusion matrix of the predicted result we found that the model has an accuracy of 0.82, the value of Cohen’s kappa coefficient was 0.62 , and the values of sensitivity (recall) and specificity (precision) were 0.69 and 0.90 respectively.
The model displayed a lower accuracy than what was reported in (v. d. Veen et al., 2015) using a Random Forest model, which is not surprising, since we are looking at a different research question, and also used one less predictor, for the reasons mentioned in Section 3.
The variable importance plot for the model is shown in Figure 2. We used the same variable names as in (v. d. Veen et al., 2015) for ease of interpretation.
We get a pretty good result using the predictors listed in (v. d. Veen et al., 2015), with AUC-ROC of 0.89
5.3. Assessing the performance of the model using our set of predictors (G2)
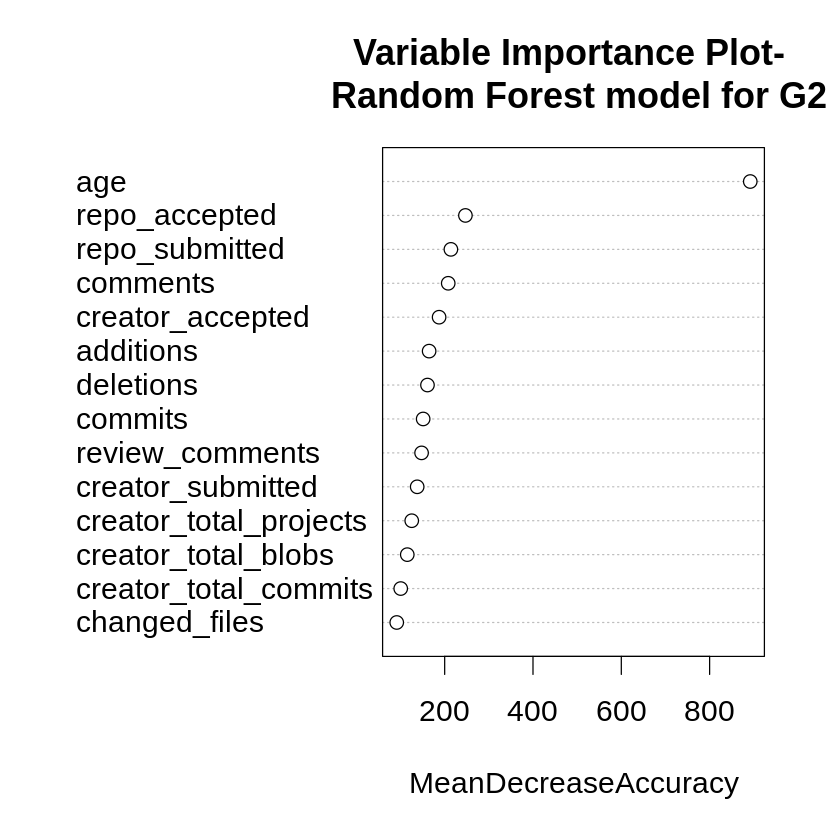
When we used the 14 predictors as described in Section 4, we had a significant improvement in result. The tuned Random forest model gave an AUC-ROC value of 0.95. By examining the confusion matrix of the predicted result we found that the model has an accuracy of 0.88, the value of Cohen’s kappa coefficient was 0.75 , and the values of sensitivity (recall) and specificity (precision) were 0.78 and 0.95 respectively. The variable importance plot for the model is shown in Figure 3. This is the result that answers our overarching research question when no constraints are put on the problem.
The performance of the model improved significantly with our set of 14 predictors, with AUC-ROC of 0.95
5.4. Understand the effect of each predictor on the probability of the PR getting merged (G3)
To illustrate the effects the different predictors have on our model, we looked at their partial dependence plots. A partial dependence plot gives a graphical depiction of the marginal effect of a variable on the class probability for the task of classification, and is implemented by the partialPlot function in the randomForest R package. In the X axes of a plots we have the values of the variables (log transformed values in our case, since the variables were log transformed), and the Y axes of the plots show the relative logit contribution of the variable on the class probability (Friedman, 2001) (probability that a PR was merged, in our case) from the perspective of the model, i.e. negative values (in the Y-axis) mean that the positive class is less likely (i.e. it is less likely that a PR would be accepted, in our case) for that value of the independent variable (X-axis) according to the model and vice versa. These plots can shed light into the dynamics of PR creation and acceptance, and would be helpful for both the PR creators and the integrators for understanding how to improve the quality of PRs being submitted and accepted.
The partial dependence plots for all the 14 predictors variables used the Random Forest model created for addressing G2 are shown in Table 3 (we apologize for the small font size). The values of all variables shown in the X-axis, except the two fractions and age, are in log scale. The values of the two fractions, creator_accepted and repo_accepted are shown in absolute value, between 0 and 1, and the value of age is shown in days, in linear scale.
The marginal effects of the predictor variables on the probability of PR acceptance are shown in Table 3
5.5. Assessing the performance of the model without using the time dependent predictors (G4)
Out of the 14 variables we have, the number of discussion comments, number of code review comments, and the age of the PR are variables that vary during the PR’s lifetime. Other variables are either historical measures, based on the PR creator’s or the repositories activities prior to submission of the PR, or they are static variables that do not change with time. Therefore, to address the goal G4, we removed the number of discussion comments, the number of code review comments, and the age of the PR from our list of predictors.
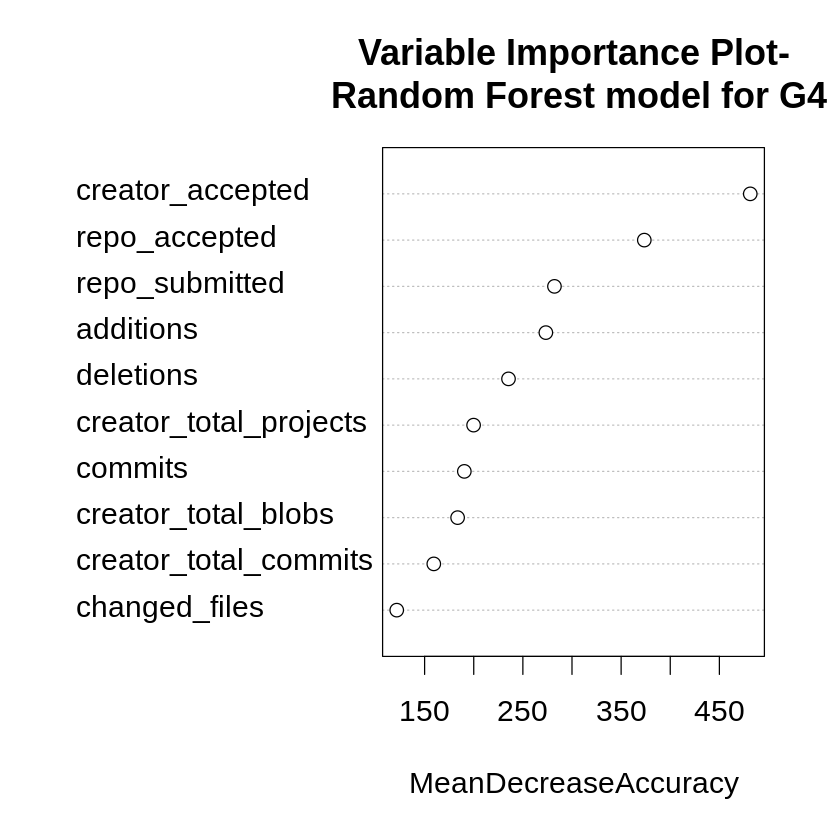
Unsurprisingly, the model with the remaining 11 predictors gave a relatively worse performance, with an AUC-ROC value of 0.89. The confusion matrix revealed that the model has an accuracy of 0.79, the value of Cohen’s kappa coefficient was 0.56, and the values of sensitivity (recall) and specificity (precision) were 0.67 and 0.87 respectively. The variable importance plot for the model is shown in Figure 4.
Using only the predictors available at the time of PR submission, we still get a very good result, with AUC-ROC of 0.89
5.6. An illustrative example of an NPM package on which this model was applied to test its viability (G5)
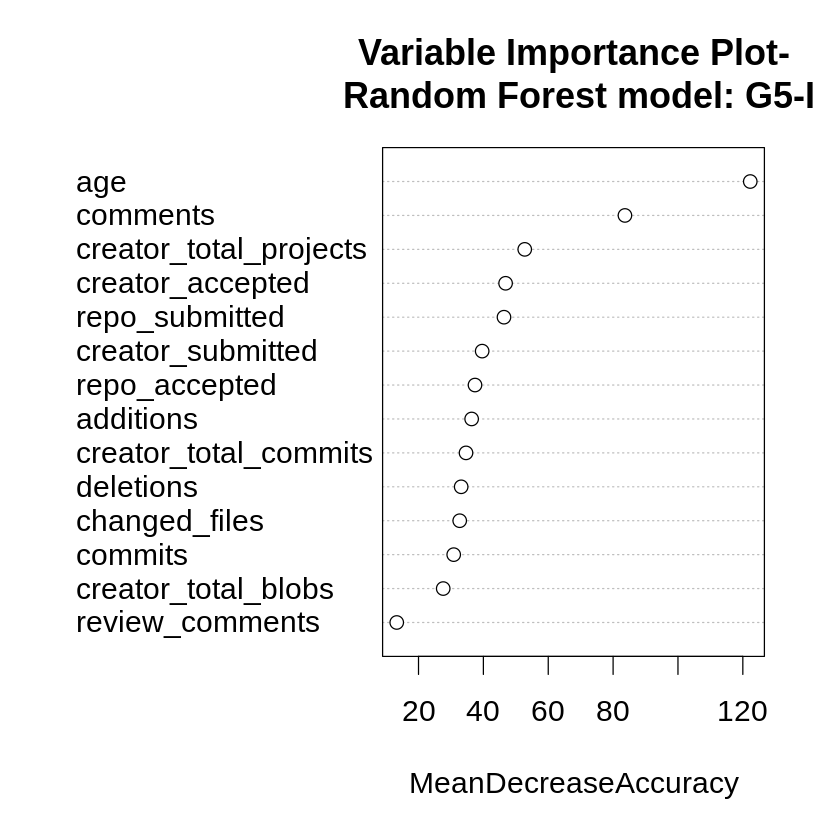
As discussed in Sections 3 and 4, we used the historical data of the “bootstrap” NPM package to predict if the PRs created in future were accepted in an attempt to test the practical viability of our approach. In the first attempt, we used our full set of 14 predictors for modeling. Although the training and the test sets were somewhat unbalanced in terms of fraction of PRs accepted (see Section 4), the model performed very well, giving an AUC-ROC value of 0.94, and the confusion matrix showed that it has an accuracy of 0.87, the value of Cohen’s kappa coefficient was 0.74, and the values of sensitivity (recall) and specificity (precision) were 0.82 and 0.92 respectively. The variable importance plot for this model is shown in Figure 5.
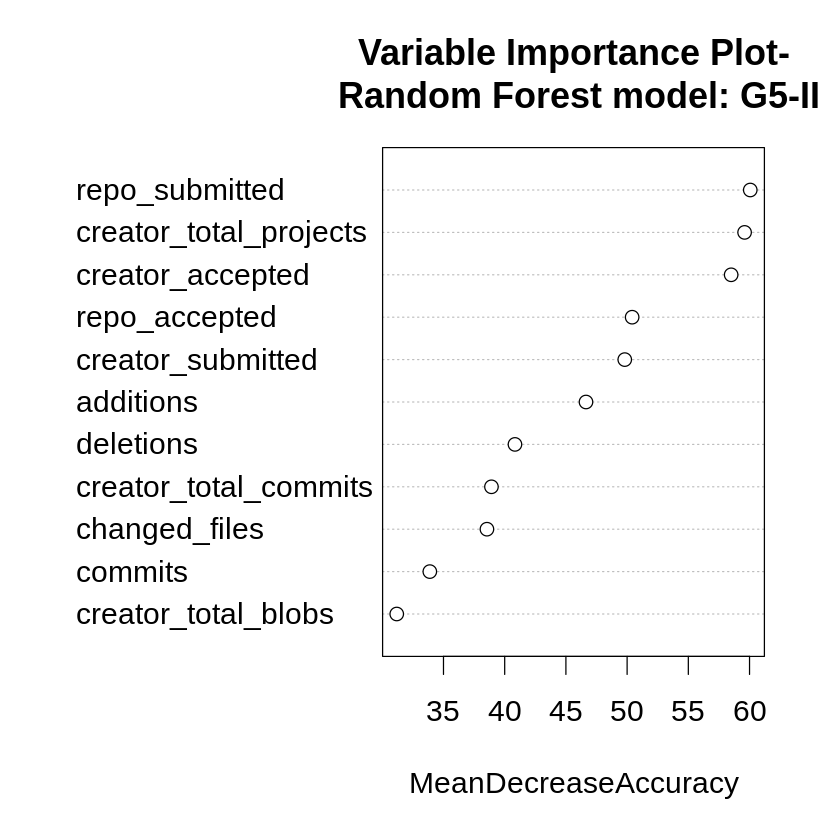
We also wanted to check how our the model performs under a condition like G4, so in the second attempt, we tested with the 11 predictors as we did when addressing G4. The model performed fairly, with a modest AUC-ROC value of 0.77. By examining the confusion matrix we found that the model has an accuracy of 0.72, the value of Cohen’s kappa coefficient was 0.41 , and the values of sensitivity (recall) and specificity (precision) were 0.54 and 0.85 respectively. The variable importance plot for this model is shown in Figure 6.
For NPM package “bootstrap”, training the model with historical data and trying to predict PR acceptance in future gives very good result with AUC-ROC of 0.94 with all predictors, and gives a fair performance with AUC-ROC of 0.77 with only the predictors available at PR submission time
6. Discussion
First, why the 14 predictors we proposed have resulted in much more accurate predictions than the 13101010we used 13 out of the 14 predictors used in (v. d. Veen et al., 2015). Although eight variables were shared between the two sets of predictors, we achieved a much better performance by adding six other variables: two variables characterizing the historic PR submission and acceptance rates of the repository in question, one variable specifying the total number of PRs submitted by the creator (prior to the predicted PR), and three variables characterizing the creators’ overall activity across all open source projects that use Git. In particular, the number of past PRs and the fraction of those that were accepted (both for the repository to which the PR was submitted, and for the PR creator across all NPM packages under consideration) were very important, as we can see by looking at the variable importance plots. The other variables used in (v. d. Veen et al., 2015) were found not to improve the prediction performance.
We found the age of the PR to consistently show up as the most significant predictor, and that the decision to merge most PRs is made very rapidly. Among the PRs that were accepted, are accepted within 3 days (see the partial dependence plot on age in Table 3), while more than half of the PRs that are not accepted are closed within 10 days. This is visible from the partial dependence plot for age as well, which shows that the chance of a PR getting accept rises rapidly during the first day, and then drops very fast over time. This suggests that most NPM package integrators are very responsive, and efficient in handling PRs.
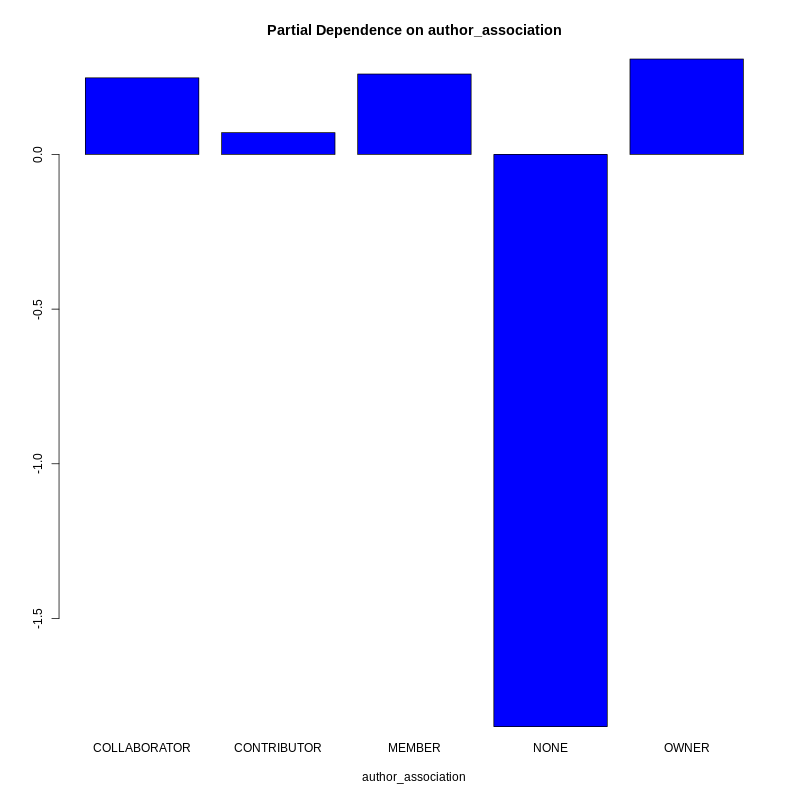
This coupled with the fact that around 60% of the submitted PRs are accepted indicate that the NPM ecosystem might have a relatively lax requirement for accepting a PR. However, when we looked at the PR creators’ association with the projects to which the PR was submitted, we found that being a member of the organization that owns the repository, or being the owner of the repository, or having been invited to collaborate on the repository significantly increases the probability of a creator’s PR(s) being accepted, while having no connection to the repository decreases the probability significantly (see Figure 7). This result, unfortunately, could be misleading, since the membership information was obtained not at the time the PR was accepted or created (like all other predictors we use) but much later, at the time of data collection, and we have no way to verify that the author’s affiliation wasn’t updated retroactively. Our suspicion was reinforced by the finding that for the “bootstrap” project, no PR creator’s association was updated over the lifetime of the project, i.e. a PR creator who’s a contributor was found to always have been a contributor to the project, since the very first PR they created. A similar situation was later observed for all the NPM projects, that an author’s association with a particular project never seem to change in the data that we collected. This is the reason why this variable, in spite of appearing to be an important predictor (a variation of this variable, viz. Core Member was used in (v. d. Veen et al., 2015) as well), wasn’t included in our model (see Section 4). In a nutshell, it might include information that was not available when the decision to merge the PR was made.
We also found that the historical performance record of the PR creator, in terms of what number of the PRs created by that individual and their acceptance rate before submitting this PR, and the number of PRs submitted to the repository and the acceptance rate of those PRs are the other most significant predictors. Looking at the partial dependence plots for these variables in Table 3, we see that:
-
•
As the number of PRs submitted by the PR creator, prior to submitting the predicted PR, increases, the probability of acceptance of the PR submitted by that creator increases up to a certain point, and then it flattens out, indicating the presence of a saturation point in the author/project relationship.
-
•
The probability that a PR submitted by a creator will be accepted has a strong positive correlation with the fraction of PRs (created by the same creator) accepted prior to submitting that PR, indicating a strong dependence on the creator’s proficiency.
-
•
We also see that repositories that accept a larger fraction of the PRs submitted are likely to accept more PRs, which could indicate a more lenient policy of PR acceptance and/or the integrators’ willingness to accept more PRs.
-
•
We see a somewhat surprising result on how the chances of a PR being accepted varies with the number of PRs submitted against the repository. We see that the repositories that receive a moderate number PRs are less likely to accept PRs. The reason why the repositories with few PRs are more likely to accept could be because they are relatively new and/or the integrators aren’t too busy. The reason why repositories with more PRs are more likely to accept could boil down to the type of the project, the leniency in policy, higher efficiency of integrators, and/or the knowledge among the PR creators that it is easier to get a PR accepted in those repositories.
Another observation can be made by looking at the partial dependence plots of different properties of the PRs, like additions, deletions, commits, changed_files in Table 3, that smaller patches are more likely to be accepted, which reinforces the findings of (Weißgerber et al., 2008). However, we see that PRs with very few changes are unlikely to be accepted, possibly because the contribution isn’t sufficient. These plots indicate the presence of a sort of sweet spot or Goldilocks Zone in terms of the size of the patch, with around 1-4 commits, 30-250 lines deleted, 5-100 lines added, and 5-15 files changed. Our findings are similar to what was reported in (Soares et al., 2015).
Pull Requests with around 1–4 commits, 30-250 lines deleted, 5-100 lines added, and 5-15 files changed have a much higher chance of getting accepted.
In terms of comments and review_comments, we see that having none or very few means a PR will likely be accepted, but a few more indicate that it will most likely be rejected, and having even more comments and especially review_comments again increases the chance of acceptance. This could indicate a pattern in the discussion boards, where the good, and likely simpler PRs are accepted with few or no discussion, while the more controversial PRs invite a few more comments, likely explaining why it wasn’t accepted, and the more complex PRs tend to have a more elaborate discussion but still have a fair chance of acceptance.
If we look at how the PR creators’ activity across all OSS projects using Git affect their chance of getting a PR accepted, we can clearly see the presence of a threshold, after crossing which the creators’ PRs have a much higher chance of getting accepted. Looking at the plots in Table 3 for these three variables, we approximate the threshold to be around 700 projects, 1000 commits, and 3000 blobs. Developers who have worked in around 700 or more projects, made around 1000 or commits, and authored around 3000 or more blobs seem to have achieved a level of proficiency or reputation that significantly improves the chances that the PRs they submit get merged.
A number of variables didn’t make it to the list of the useful predictors. We see that most of the characteristics of the head and base repositories do not help in increasing accuracy, including the number of stars, forks etc., which are generally accepted as the measures of popularity or reputation (see e.g. (Borges et al., 2016)), and the number of issues, which should be an important predictor intuitively, since more issues might invite more PRs that try to fix those issues. Moreover, if a PR was submitted with the fix for an issue ( of the PRs have an issue fix) also seem to be not very significant.
7. Limitations
Regarding external validity, we looked at 4218 most popular NPM packages, which, while a large number by itself, is less than 0.5% of the total packages in the NPM ecosystem. These packages, however, represent the tiny part of the NPM ecosystem that is widely used and where the vast majority of code contribution actually happens.
We extracted 50 variables from the data we obtained, which should cover most of the latent factors affecting the chances of a PR being accepted, however, it may not be an exhaustive set of variables. There may still be additional variables that either improve the predictor performance or help explain why certain PRs are more likely to be accepted.
Finally, the result of this paper might not be applicable as-is to other software ecosystems, since every ecosystem has their norms and characteristics which is impossible to account for when looking into only one ecosystem. Future studies are needed to determine the generality of our findings.
8. Conclusion
First, we have answered the overarching research question by determining that, at least for popular NPM packages (the ones with more than 10,000 monthly downloads), we can predict extremely accurately if a PR will be merged within a month of being created (AUC-ROC of 0.95), and illustrated the response curve to the values of the key predictors that can be used to understand the rather specific characteristics of the PRs that are most likely to get accepted. We were able to achieve such high precision by looking at the historical PR submission and acceptance records of the repositories to which a PR was submitted, and by incorporating information about developer activity across unrelated software projects, specifically using it as a proxy for the experience or reputation of the authors. This was made possible by exploiting data collected from the entire OSS ecosystem (Ma et al., 2019) and it significantly improved upon the results obtained by using the predictors listed in (v. d. Veen et al., 2015).
We have also explored the practical aspects of such prediction: would it work if we only use the properties of the PR available at the time of the creation (in contrast to using the properties of the PR just before it is merged) and found the prediction to be still highly accurate. Finally we evaluate how accurate the approach would be if it was applied in specific large NPM package.
Our findings have theoretical and practical implications. The accuracy of models of PR acceptance increase the likelihood of successful practical applications that range from tools that support PR integrators to tools that help authors of the PRs to tailor their contributions to the form resembling that of the PRs that most likely to be accepted by a specific project. We plan to pursue the goal of evaluating such tools in OSS projects. As the NPM ecosystem and other OSS ecosystems depend on contributors to maintain growth and code quality, we hope that the results of our work would help these ecosystems to sustain evolution and high quality of the code.
References
- (1)
- Baysal et al. (2012) Olga Baysal, Oleksii Kononenko, Reid Holmes, and Michael W Godfrey. 2012. The secret life of patches: A firefox case study. In 2012 19th Working Conference on Reverse Engineering. IEEE, 447–455.
- Bleikamp (2012) Ben Bleikamp. 2012. How we use Pull Requests to build GitHub. (2012). https://github.blog/2012-05-02-how-we-use-pull-requests-to-build-github/
- Borges et al. (2016) Hudson Borges, Andre Hora, and Marco Tulio Valente. 2016. Understanding the factors that impact the popularity of GitHub repositories. In Software Maintenance and Evolution (ICSME), 2016 IEEE International Conference on. IEEE, 334–344.
- Dabbish et al. (2012) Laura Dabbish, Colleen Stuart, Jason Tsay, and Jim Herbsleb. 2012. Social coding in GitHub: transparency and collaboration in an open software repository. In Proceedings of the ACM 2012 conference on computer supported cooperative work. ACM, 1277–1286.
- Decan et al. (2018) Alexandre Decan, Tom Mens, and Eleni Constantinou. 2018. On the impact of security vulnerabilities in the npm package dependency network. In 2018 IEEE/ACM 15th International Conference on Mining Software Repositories (MSR). IEEE, 181–191.
- Dey et al. (2019) Tapajit Dey, Yuxing Ma, and Audris Mockus. 2019. Patterns of Effort Contribution and Demand and User Classification based on Participation Patterns in NPM Ecosystem. arXiv preprint arXiv:1907.06538 (2019).
- Dey and Mockus (2018) Tapajit Dey and Audris Mockus. 2018. Are software dependency supply chain metrics useful in predicting change of popularity of npm packages?. In Proceedings of the 14th International Conference on Predictive Models and Data Analytics in Software Engineering. ACM, 66–69.
- Friedman (2001) Jerome H Friedman. 2001. Greedy function approximation: a gradient boosting machine. Annals of statistics (2001), 1189–1232.
- Gousios (2013) Georgios Gousios. 2013. The GHTorrent dataset and tool suite. In Proceedings of the 10th Working Conference on Mining Software Repositories (MSR ’13). IEEE Press, Piscataway, NJ, USA, 233–236. http://dl.acm.org/citation.cfm?id=2487085.2487132
- Gousios et al. (2014) Georgios Gousios, Martin Pinzger, and Arie van Deursen. 2014. An exploratory study of the pull-based software development model. In Proceedings of the 36th International Conference on Software Engineering. ACM, 345–355.
- Gousios et al. (2016) Georgios Gousios, Margaret-Anne Storey, and Alberto Bacchelli. 2016. Work practices and challenges in pull-based development: the contributor’s perspective. In 2016 IEEE/ACM 38th International Conference on Software Engineering (ICSE). IEEE, 285–296.
- Gousios et al. (2015) Georgios Gousios, Andy Zaidman, Margaret-Anne Storey, and Arie Van Deursen. 2015. Work practices and challenges in pull-based development: the integrator’s perspective. In Proceedings of the 37th International Conference on Software Engineering-Volume 1. IEEE Press, 358–368.
- Jiang et al. (2017) Jing Jiang, Yun Yang, Jiahuan He, Xavier Blanc, and Li Zhang. 2017. Who should comment on this pull request? analyzing attributes for more accurate commenter recommendation in pull-based development. Information and Software Technology 84 (2017), 48–62.
- Jiang et al. (2013) Yujuan Jiang, Bram Adams, and Daniel M German. 2013. Will my patch make it? and how fast?: Case study on the linux kernel. In Proceedings of the 10th Working Conference on Mining Software Repositories. IEEE Press, 101–110.
- Ma et al. (2019) Yuxing Ma, Chris Bogart, Sadika Amreen, Russell Zaretzki, and Audris Mockus. 2019. World of Code: An Infrastructure for Mining the Universe of Open Source VCS Data. In IEEE Working Conference on Mining Software Repositories. papers/WoC.pdf
- Mockus et al. (2002) Audris Mockus, Roy T Fielding, and James D Herbsleb. 2002. Two case studies of open source software development: Apache and Mozilla. ACM Transactions on Software Engineering and Methodology (TOSEM) 11, 3 (2002), 309–346.
- Rahman and Roy (2014) Mohammad Masudur Rahman and Chanchal K Roy. 2014. An insight into the pull requests of github. In Proceedings of the 11th Working Conference on Mining Software Repositories. ACM, 364–367.
- Rigby et al. (2014) Peter C Rigby, Daniel M German, Laura Cowen, and Margaret-Anne Storey. 2014. Peer review on open-source software projects: Parameters, statistical models, and theory. ACM Transactions on Software Engineering and Methodology (TOSEM) 23, 4 (2014), 35.
- Soares et al. (2015) Daricélio Moreira Soares, Manoel Limeira de Lima Júnior, Leonardo Murta, and Alexandre Plastino. 2015. Acceptance factors of pull requests in open-source projects. In Proceedings of the 30th Annual ACM Symposium on Applied Computing. ACM, 1541–1546.
- Tsay et al. (2014) Jason Tsay, Laura Dabbish, and James Herbsleb. 2014. Influence of social and technical factors for evaluating contribution in GitHub. In Proceedings of the 36th international conference on Software engineering. ACM, 356–366.
- Tu et al. (2018) Feifei Tu, Jiaxin Zhu, Qimu Zheng, and Minghui Zhou. 2018. Be careful of when: an empirical study on time-related misuse of issue tracking data. In Proceedings of the 2018 26th ACM Joint Meeting on European Software Engineering Conference and Symposium on the Foundations of Software Engineering. ACM, 307–318.
- v. d. Veen et al. (2015) E. v. d. Veen, G. Gousios, and A. Zaidman. 2015. Automatically Prioritizing Pull Requests. In 2015 IEEE/ACM 12th Working Conference on Mining Software Repositories. 357–361. https://doi.org/10.1109/MSR.2015.40
- Voss (2016) Laurie Voss. 2016. how many npm users are there? (2016). https://blog.npmjs.org/post/143451680695/how-many-npm-users-are-there
- Weißgerber et al. (2008) Peter Weißgerber, Daniel Neu, and Stephan Diehl. 2008. Small patches get in!. In Proceedings of the 2008 international working conference on Mining software repositories. ACM, 67–76.
- Wittern et al. (2016) Erik Wittern, Philippe Suter, and Shriram Rajagopalan. 2016. A look at the dynamics of the JavaScript package ecosystem. In Mining Software Repositories (MSR), 2016 IEEE/ACM 13th Working Conference on. IEEE, 351–361.
- Xie et al. (2013) Jialiang Xie, Minghui Zhou, and Audris Mockus. 2013. Impact of triage: a study of mozilla and gnome. In 2013 ACM/IEEE International Symposium on Empirical Software Engineering and Measurement. IEEE, 247–250.
- Yu et al. (2015) Yue Yu, Huaimin Wang, Vladimir Filkov, Premkumar Devanbu, and Bogdan Vasilescu. 2015. Wait for it: determinants of pull request evaluation latency on GitHub. In 2015 IEEE/ACM 12th Working Conference on Mining Software Repositories. IEEE, 367–371.
- Yu et al. (2014a) Yue Yu, Huaimin Wang, Gang Yin, and Charles X Ling. 2014a. Reviewer recommender of pull-requests in GitHub. In 2014 IEEE International Conference on Software Maintenance and Evolution. IEEE, 609–612.
- Yu et al. (2014b) Yue Yu, Huaimin Wang, Gang Yin, and Charles X Ling. 2014b. Who should review this pull-request: Reviewer recommendation to expedite crowd collaboration. In 2014 21st Asia-Pacific Software Engineering Conference, Vol. 1. IEEE, 335–342.
- Yu et al. (2016) Yue Yu, Huaimin Wang, Gang Yin, and Tao Wang. 2016. Reviewer recommendation for pull-requests in GitHub: What can we learn from code review and bug assignment? Information and Software Technology 74 (2016), 204–218.
- Zapata et al. (2018) Rodrigo Elizalde Zapata, Raula Gaikovina Kula, Bodin Chinthanet, Takashi Ishio, Kenichi Matsumoto, and Akinori Ihara. 2018. Towards smoother library migrations: A look at vulnerable dependency migrations at function level for npm JavaScript packages. In 2018 IEEE International Conference on Software Maintenance and Evolution (ICSME). IEEE, 559–563.
- Zhu et al. (2016) Jiaxin Zhu, Minghui Zhou, and Audris Mockus. 2016. Effectiveness of code contribution: From patch-based to pull-request-based tools. In Proceedings of the 2016 24th ACM SIGSOFT International Symposium on Foundations of Software Engineering. ACM, 871–882.