A resistive ACHINOS multi-anode structure with DLC coating for spherical proportional counters
Abstract
The spherical proportional counter is a gaseous detector used in a variety of applications, including direct dark matter and neutrino-less double beta decay searches. The ACHINOS multi-anode structure is a read-out technology that overcomes the limitations of single-anode read-out structures for large-size detectors and operation under high pressure. A resistive ACHINOS is presented, where the 3D printed central component is coated in a Diamond-Like Carbon (DLC) layer. The production and testing of the structure, in terms of stability and resolution, is described.
1 Introduction
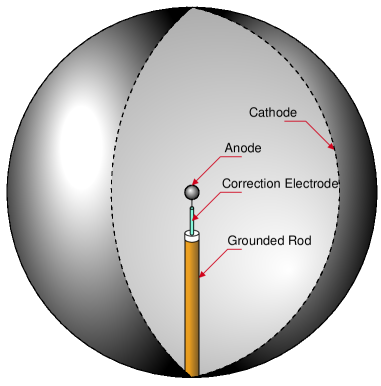
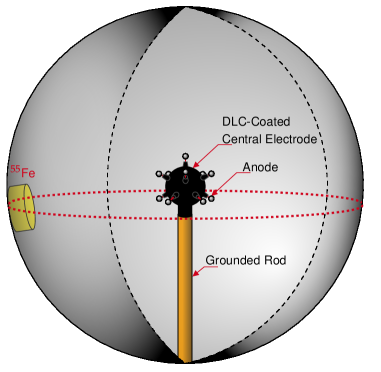
In its simplest form, the spherical proportional counter [1], shown in figure 1(a), consists of a grounded, spherical, metallic vessel filled with an appropriate gas mixture and a spherical anode of radius approximately at the centre. The anode is supported by a grounded metallic rod, which also shields the wire used to apply a positive voltage to the anode and read out the signal. The electric field, which varies as in an ideal spherical proportional counter, allows the ionisation electrons produced through particle interactions in the gas volume to drift to the anode. Within approximately from the anode an avalanche occurs, providing signal amplification. Experiments using this detector include NEWS-G [2], searching for dark matter particles, and R2D2 [3], searching for neutrino-less double beta decay.
For large detectors, or detectors operating in high pressure, the small ratio of electric field strength to gas pressure (E/P) increases the probability of electron attachment and recombination. In the single anode configuration, increasing the E/P ratio can be achieved by either increasing the anode voltage or the anode size, both of these options lead to an increased discharge probability.
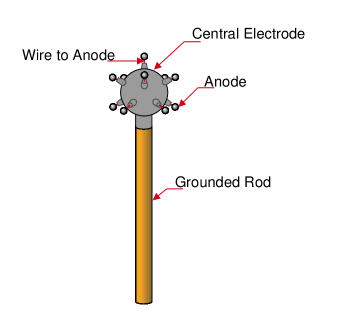
ACHINOS, a sensor structure composed of several anodes at a radius from the centre, as shown in figure 1(b), has been proposed to overcome this challenge [4]. The anodes are maintained in position by means of a central support structure. This structure needs to be constructed using resistive materials, as has been the case with previous read-out technologies [5]. With ACHINOS, the avalanche gain is determined by the anode radius and voltage , while the electric field at large radii is the collective electric field of all the anodes, determined by , , and the number of anodes. Additionally, it is possible to read out each anode individually, allowing the three-dimensional reconstruction of the ionisation tracks.
2 ACHINOS with “resistive glue” coating
The ACHINOS central electrode is manufactured with resistive material, a choice that has been shown to reduce sparking rate and intensity [4, 5].

3D printing provides a convenient means to produce a high-precision structure, however, currently 3D printing with insulators and conductors is more widely available. Thus, an appropriate coating needs to be applied. Initially, an Araldite adhesive mixed with copper powder was explored, with main benefits being the relatively low radioactivity of Araldite 2011 [6] and the possibility to control the resistivity of the coating by changing the relative amounts of Araldite and copper. It was found that mixtures containing to w/w copper powder were appropriate. An example is shown in figure 2. Despite the promising results, the coating layer was found to be susceptible to damage from discharges. Specifically, a single discharge could destroy the central electrode coating, by creating a conductive path. This behaviour was also observed repeatedly using a spark-test chamber.
3 ACHINOS using DLC coating
DLC is a form of amorphous carbon containing both the diamond and the graphite crystalline phase. Thanks to its excellent surface resistivity, in addition to structural, chemical and thermal stability, DLC coating [7] offers a novel method for producing high quality resistive materials for gaseous detectors [8, 9].
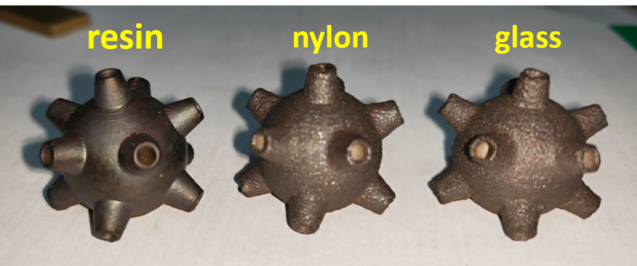
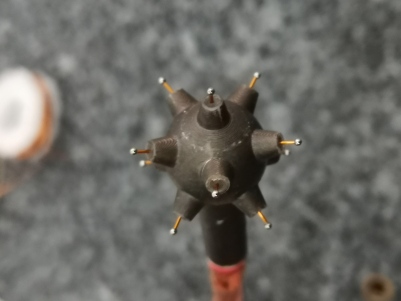
The central structure was constructed using 3D printing with different substrates, including resin, nylon, and glass, as shown in figure 3(a). DLC was deposited using magnetron sputtering. Several batches of DLC-coated structures were produced, with a range of coating thickness between and . The measured resistance between two anti-diametric points on the surface, ranged from to . The DLC-coated resin 3D printed structure was mounted on a copper rod and electrically connected to it using a conductive Araldite copper mixture, as shown in figure 3(b).
4 Experimental results
The ACHINOS structure with 11-anodes, each in diameter, shown in figure 3(b) was installed in a diameter spherical proportional counter that operated in sealed mode. An 55Fe source was installed inside the detector, the position of which could be adjusted without opening the detector. The source principally emits a X-ray when it decays to 55Mn by electron capture. The experimental set-up is shown in figure 4(a). An ISEG NHR 22 60r power supply was used to apply voltage to the anodes. The central electrode was, typically, grounded through the rod, but alternative configurations were also tested. Signals are read out by a CREMAT CR-110-R2 charge sensitive preamplifier. The preamplifier output is passed to a “CALI” digitiser, manufactured by CEA Saclay [10], with a dynamic range of and maximum sampling frequency of .
An example digitised output pulse, recorded with a sampling rate of , is shown in figure 4(b). The exponential falling edge is defined by the time constant of the preamplifier. A preamplifier output of ,222ADU = Analogue-to-Digital Units. corresponds to a charge of approximately at the preamplifier input. Contamination from cosmic-ray muons interacting in the gas volume is suppressed using loose event selections on the pulse rise time, defined as the time required for the signal to increase from to of its amplitude, and the ratio of the pulse integral to its amplitude.
4.1 Gain
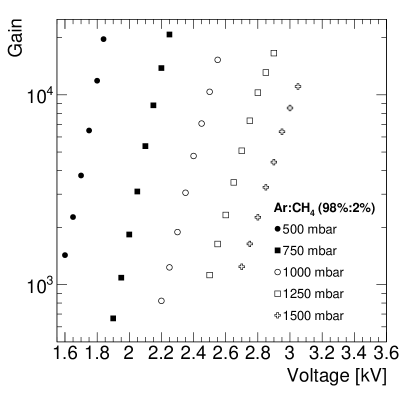
The detector was filled with of ArCH (:) and data were collected at various anode voltages and pressures, and the amplitude of the peak were recorded. These measurements, performed with the central electrode electrically floating, are presented in figure 5, where the detector is shown to operate in proportional mode over a wide pressure range. Furthermore it is demonstrated that large gas gains (avalanche electron multiplication factor) of up to can be achieved with this detector configuration.
4.2 Anode response uniformity
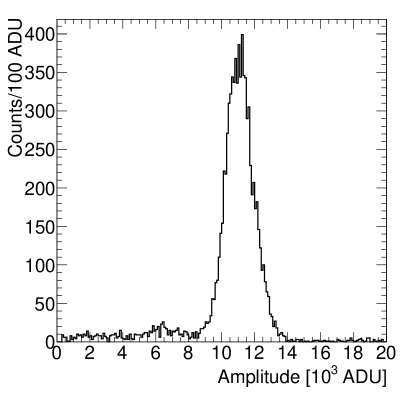
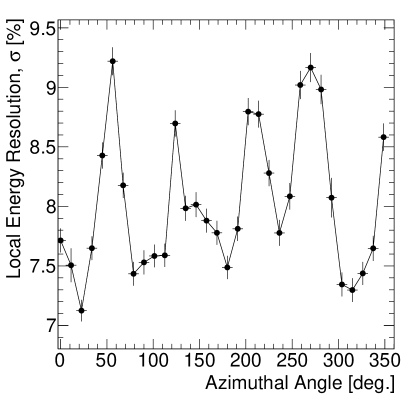
To check the uniformity of the sensor response, data were taken with the 55Fe source at various longitudinal positions, while at a fixed latitude of approximately below the equator, as shown schematically in figure 4(a). The detector was operated with of ArCH (:) and an anode voltage of . The amplitude and local energy resolution were estimated using the peak and an example spectrum is shown in figure 6. A gaussian fit of this yielded an amplitude of , corresponding to a gas gain of , and a local energy resolution of . The same procedure was repeated for the other measurements, with the results shown in figure 7(a) for the amplitude and figure 7(b) for the local energy resolution, which varies between and .
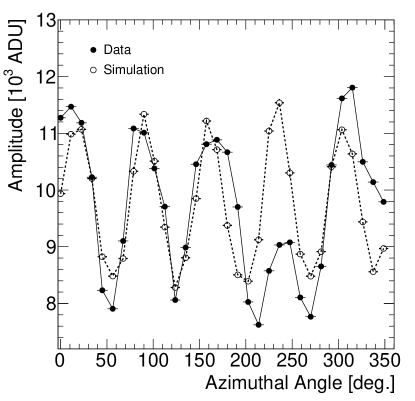
The maximum (minimum) amplitude at approximately () corresponds to a gas gain of (). The amplitude modulation as a function of the azimuthal angle observed in figure 7(a) is intriguing. To understand its origin a dedicated framework for the simulation of spherical proportional counters was used [11], which combines the strengths of Geant4 [12] and Garfield++ [13]. In the simulation 5.9 keV photons were generated near the cathode surface and directed within a cone towards the detector centre. A similar analysis to those applied to the data was implemented. The open circles in figure 7(a) correspond to the simulation results which reproduce the modulation observed in the data.
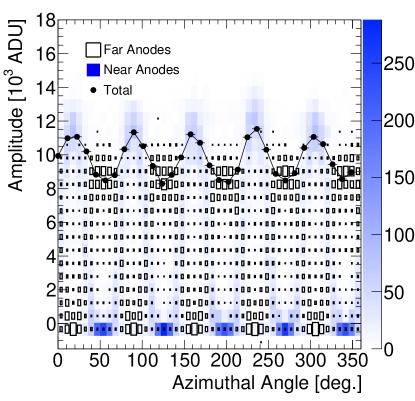
To understand the origin of the effect, the 11-anodes of the ACHINOS were split in two groups. The first group comprises the five co-planar anodes near the support rod, while the second group comprises the five co-planar anodes far from the support rod and the anode furthest away from the support rod. In the following these two groups will be referred to as “Near Anodes” and “Far Anodes” respectively. In figure 8(a) the amplitudes recorded by reading out each set separately is presented. It is observed that the amplitudes are modulating in antiphase. This provides a clear explanation of the effect; as the source is moved around the sphere, the produced primary electrons are drifting towards different anodes, alternating between the Near and the Far anodes.
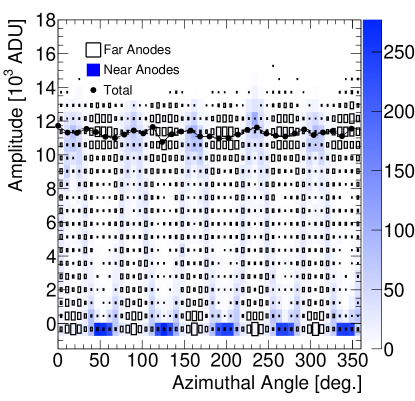
The relative difference in maximum amplitude between the Near and Far anodes is due to the gain difference between the two sides. The Near anodes exhibit an increased electric field due to the proximity to the grounded support rod, which results in deviations from the spherical symmetry. This effect can be readily corrected for by separately adjusting the applied voltage to the Near and Far anodes. In figure 8(b) the simulation is repeated with the voltage applied to the Far anodes increased by . In this case the azimuthal dependence of the amplitude is minimised, and could be eliminated by further tuning of the Far anodes voltage.
A potential source of additional response non-uniformity may arise from construction differences of the individual anodes. This effect is not included in the simulation, however it can be estimated from the experimental data. The difference in gain within the two sets of co-planar anodes are typically within . This is shown in figure 7(a), where a single outlier is also observed in each of the sets. These differences are attributed to variations in the anode radii, the smoothness of the anode surface, and the distance to the central electrode. These non uniformities can be corrected for with an anode-by-anode calibration, when each anode is read-out individually.
4.3 Stability
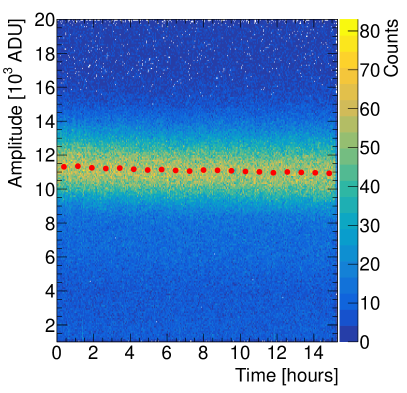
The detector operated stably filled with of ArCH (:) and the anode voltage set to . The amplitude of the 55Fe peak was monitored and no significant gain variations were observed over approximately , as shown in figure 9. The gradual decrease in gain over time is attributed to the introduction of contaminants coming from outgassing and leaks in the vacuum system, a behaviour that has been observed in earlier studies [5].
In further tests, the sensor was operated without issues for a period of 30 days despite an observed average of approximately one discharge per day. Furthermore, no damage was observed following intentionally induced discharges.
5 Future developments
Additional R&D effort is foreseen, aiming to consolidate the construction and performance of ACHINOS. The main directions for such developments are briefly discussed in the following.
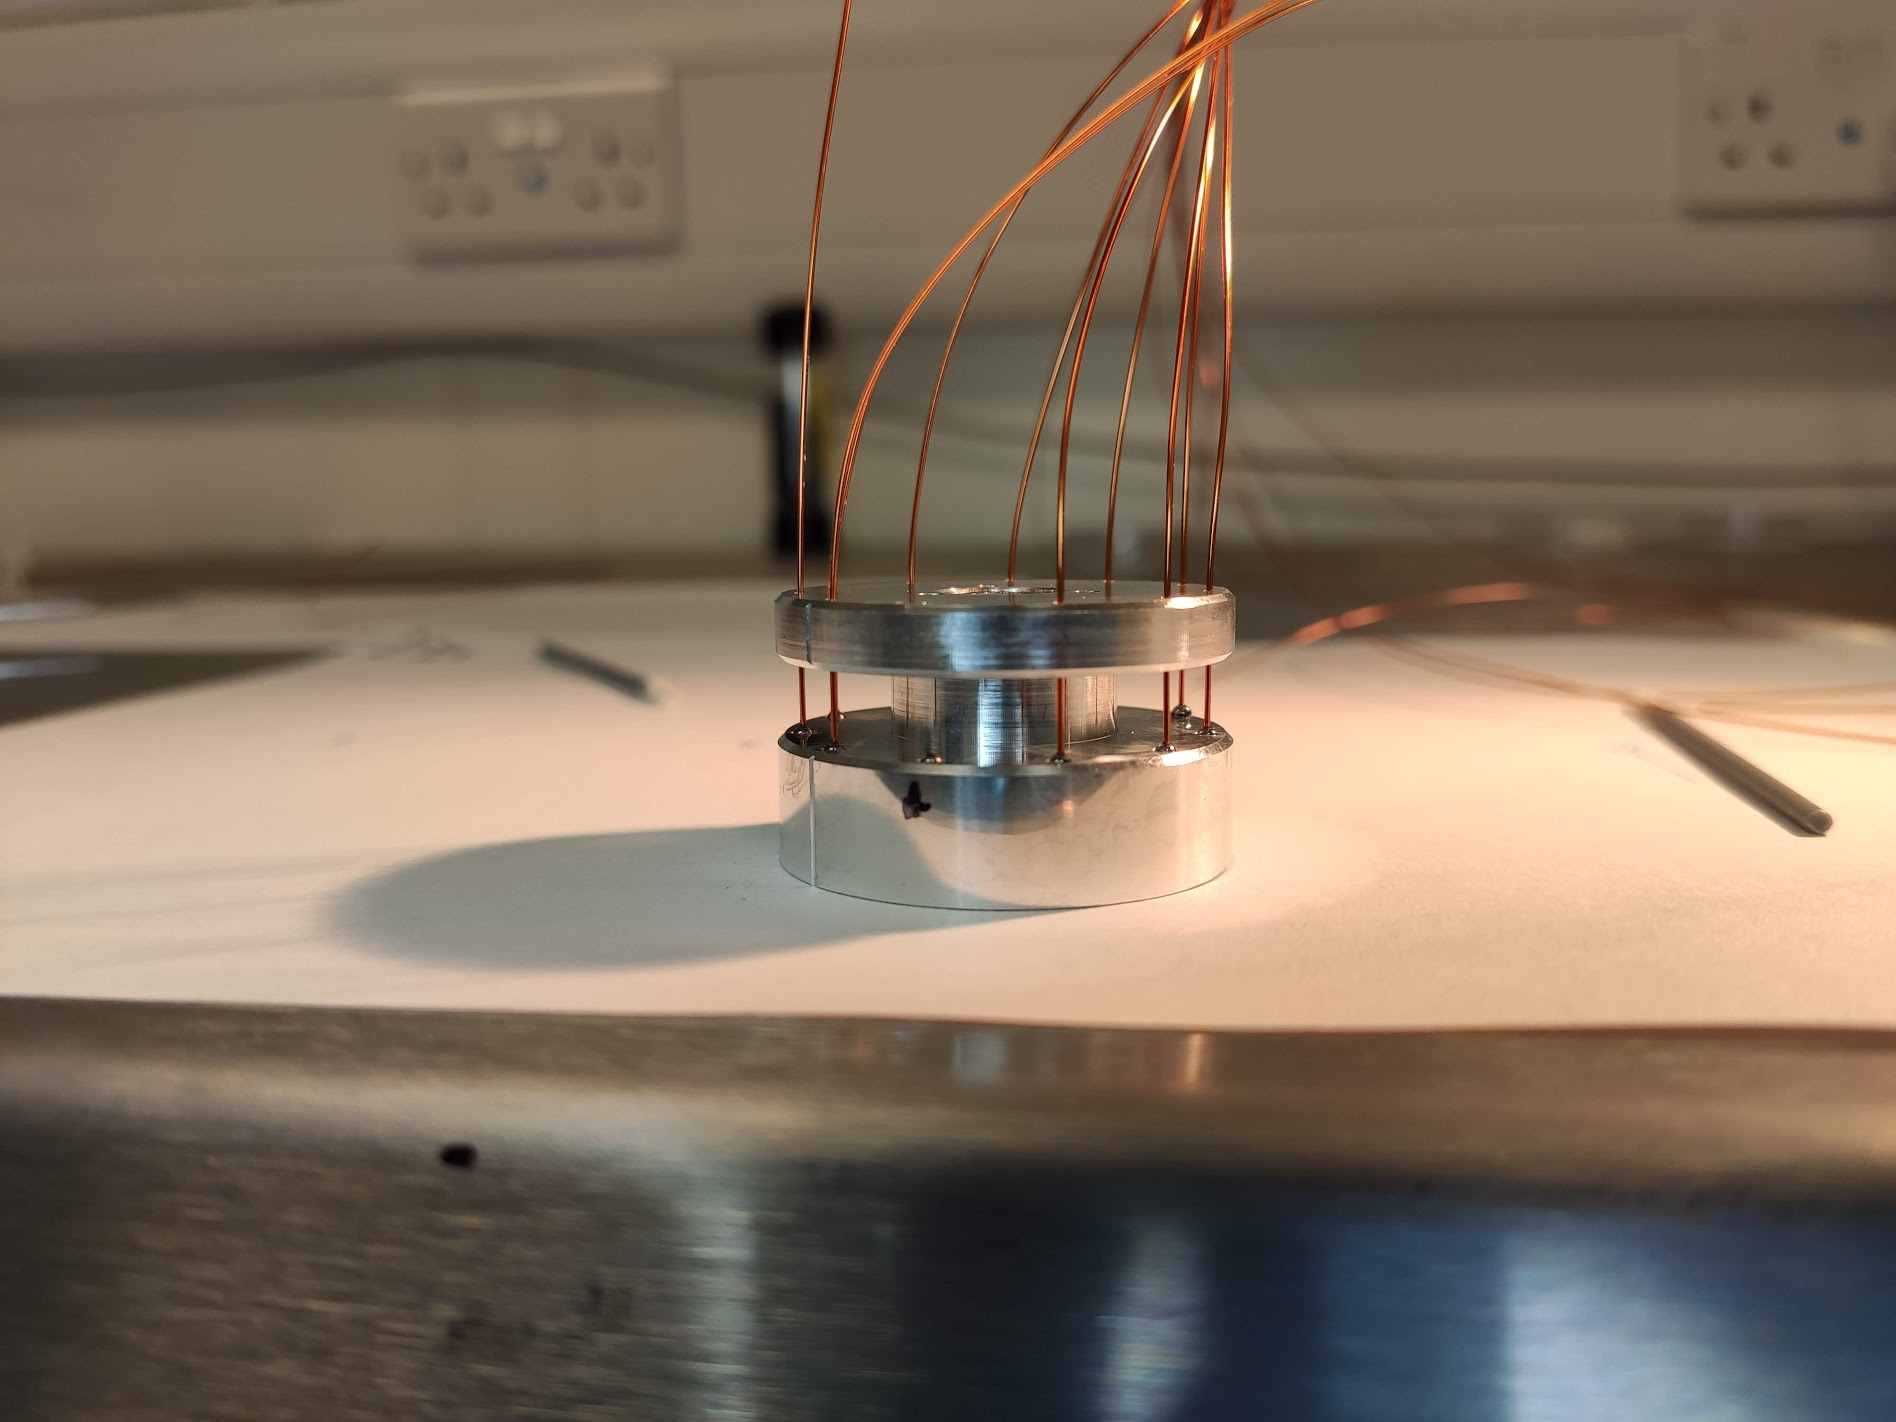
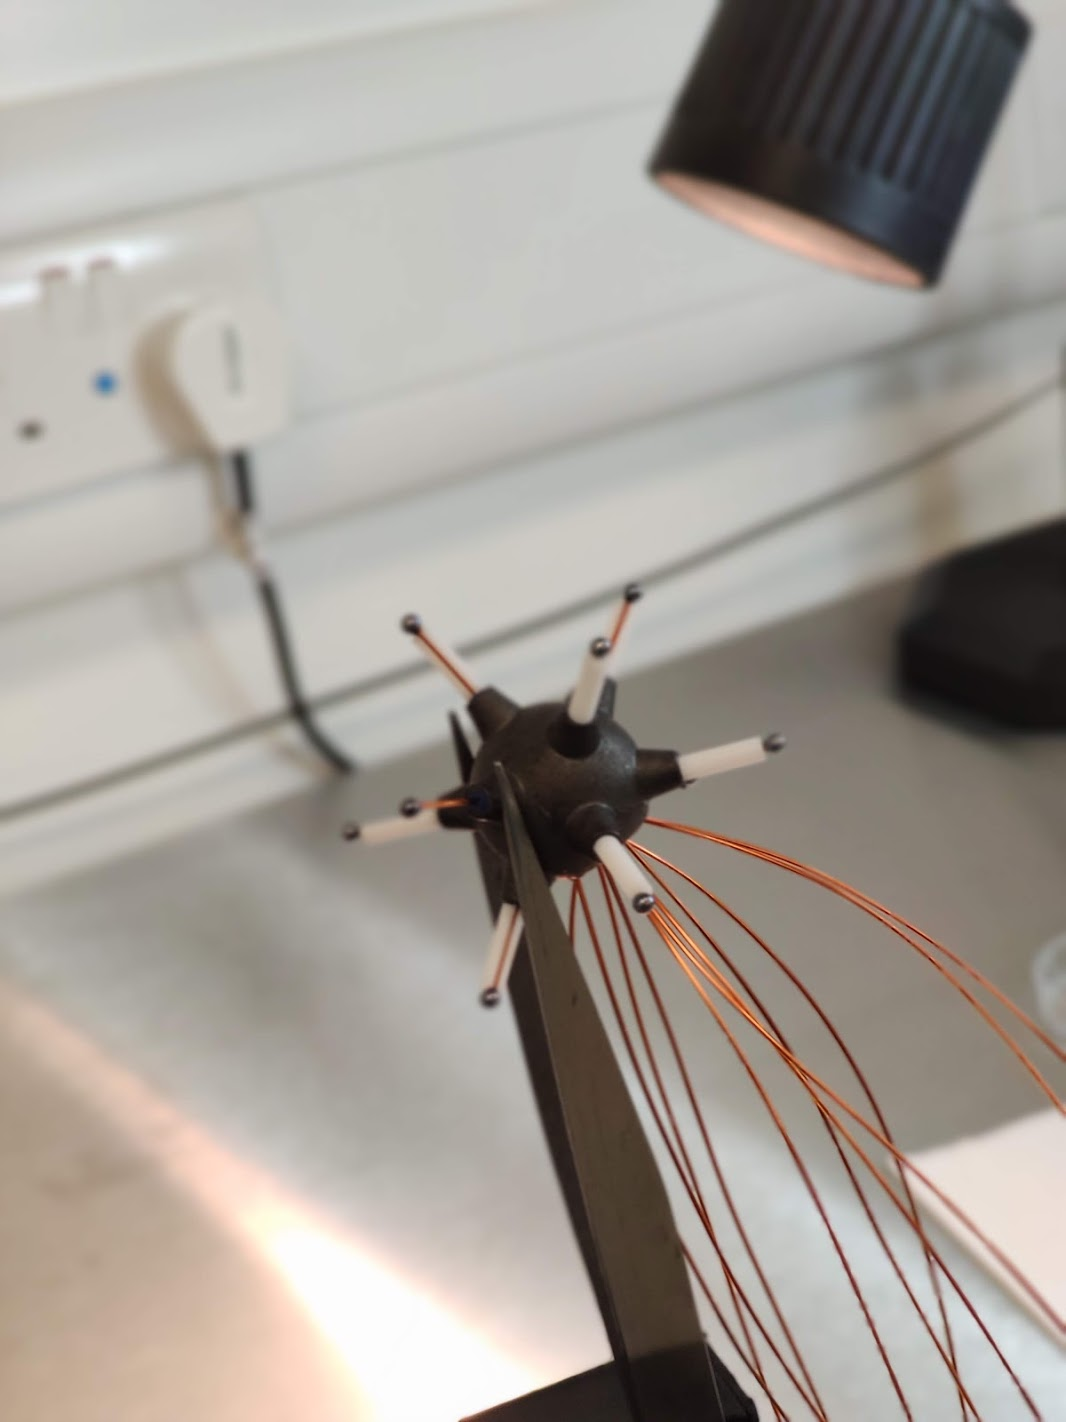
A major task is the industrialisation of the sensor manufacturing, ensuring reliable and reproducible behaviour. The use of additive manufacturing techniques, like 3D printing, for the construction of the central electrode and its DLC coating has been a significant step in this direction. Further improvements in the manufacturing are being explored, including the production of assembly tools for anode alignment and attachment of wires. As an example, an assembly tool constructed at the University of Birmingham, is shown in figure 10(a), along with the spacers used to align the anodes with during assembly, shown in figure 10(b).
To further improve the ACHINOS performance, the gain variation among different anodes needs to be reduced. A major source of this variation arises from irregularities in the shape of the individual anodes. Identifying vendors that can supply anodes with high sphericity and small surface roughness is being investigated.
A number of applications of the spherical proportional counter, such as dark matter searches [2], Supernovae [14] detection, fast neutron spectroscopy [15], and measurements of neutrino coherent scattering [16], would benefit from operation under high gas pressure. The use of ACHINOS is an important development in this aspect. To further progress in this direction, the use of anodes with small radii, of order , is being explored. This would facilitate achievement of higher gain by increasing the electric field near the anode surface, without further increase of the anode voltage. An important challenge towards smaller anode radii is the bonding to the read-out wire, which needs to be performed in a manner that minimises exposed contacts which may lead to discharges. Ideas to achieve this are being explored with industrial collaborators, at CERN and at CEA Saclay.
Furthermore, the number and configuration of anodes in the ACHINOS may be optimised for each specific application, depending on the size and pressure of the vessel. Such a developemnt can be guided by a dedicated simulation program [11]. At the same time, a further milestone would be the individual read-out and high-voltage biasing of each anode. This would allow three dimensional reconstruction of the ionisation track, and anode-by-anode calibration of the gas gain.
6 Summary
A multi-anode read-out structure for the spherical proportional counter has been developed. ACHINOS now incorporates a DLC layer to prevent discharges, and its operation stability has been demonstrated. It was also found that the DLC layer is robust under discharges. The gas gain in various pressures was also studied, demonstrating the ability to operate the detector in a gain of up to in of Ar:CH4 (:). The local energy resolution has been assessed as a function of azimuthal angle and found to be better than (). The difference in gain between different anodes was not greater than , and this can be further improved by using anodes with a smaller deviation from an ideal sphere and lower surface roughness, individually calibrating each anode and the inclusion of more anodes.
Acknowledgments
This project has received funding from the European Union’s Horizon 2020 research and innovation programme under the Marie Skłodowska-Curie grant agreement DarkSphere (grant agreement No 841261). Support has been received from the Royal Society International Exchanges Scheme. KN acknowledges support by the European Research Council (ERC) grant agreement no. 714893 and by UKRI-STFC through the University of Birmingham Particle Physics Consolidated Grant. We acknowledge the financial support of the Fundamental Research Funds for the Central Universities of China.
References
- [1] I. Giomataris et al., A Novel large-volume Spherical Detector with Proportional Amplification read-out, JINST 3 (2008) P09007, [0807.2802].
- [2] NEWS-G collaboration, First results from the NEWS-G direct dark matter search experiment at the LSM, Astropart. Phys. 97 (2018) 54–62, [1706.04934].
- [3] A. Meregaglia et al., Study of a spherical xenon gas TPC for neutrinoless double beta detection, JINST 13 (2018) P01009–P01009, [1710.04536].
- [4] A. Giganon et al., A multiball read-out for the spherical proportional counter, JINST 12 (2017) .
- [5] I. Katsioulas et al., A sparkless resistive glass correction electrode for the spherical proportional counter, JINST 13 (2018) P11006–P11006.
- [6] J. Busto, Y. Gonin, F. Hubert, P. Hubert and J.-M. Vuilleumier, Radioactivity measurements of a large number of adhesives, Nucl. Instrum. Meth. A 492 (2002) 35 – 42.
- [7] Y. Lv et al., Production and performance study of Diamond-Like Carbon resistive electrode in MPGD, Nucl. Instrum. Meth. A 958 (2020) 162759.
- [8] Y. Zhou et al., Fabrication and performance of a RWELL detector with Diamond-Like Carbon resistive electrode and two-dimensional readout, Nucl. Instrum. Meth. A 927 (2019) 31 – 36.
- [9] D. Attié et al., Performances of a resistive Micromegas module for the Time Projection Chambers of the T2K Near Detector upgrade, Nucl. Instrum. Meth. A 957 (2020) 163286.
- [10] A. D. Fard, Étude d’un détecteur sphérique gazeux pour la recherche d’événements rares á bas seuil en énergie. PhD thesis, Université Paris Sud - Paris XI, 2014.
- [11] I. Katsioulas et al., Development of a Simulation Framework for Spherical Proportional Counters, JINST 15 (2020) C06013, [2002.02718].
- [12] J. Allison et al., Recent developments in Geant4, Nucl. Instrum. Meth. A 835 (2016) 186–225.
- [13] R. Veenhof, GARFIELD, recent developments, Nucl. Instrum. Meth. A 419 (1998) 726–730.
- [14] Y. Giomataris and J. D. Vergados, A Network of neutral current spherical TPC’s for dedicated supernova detection, Phys. Lett. B634 (2006) 23–29, [hep-ex/0503029].
- [15] I. Savvidis, I. Katsioulas, C. Eleftheriadis, I. Giomataris and T. Papaevangellou, Low energy recoil detection with a spherical proportional counter, Nucl. Instrum. Meth. A 877 (2018) 220–226.
- [16] Y. Giomataris and J. D. Vergados, Neutrino properties studied with a triton source using large TPC detectors, Nucl. Instrum. Meth. A 530 (2004) 330–358, [hep-ex/0303045].