A rapid change in X-ray variability and a jet ejection in the black hole transient MAXI J1820+070
Abstract
We present Neutron Star Interior Composition Explorer X-ray and Arcminute Microkelvin Imager Large Array radio observations of a rapid hard-to-soft state transition in the black hole X-ray transient MAXI J1820+070. During the transition from the hard state to the soft state a switch between two particular types of quasiperiodic oscillations (QPOs) was seen in the X-ray power density spectra, from type-C to type-B, along with a drop in the strength of the broadband X-ray variability and a brief flare in the 7–12 keV band. Soon after this switch (1.5–2.5 hr) a strong radio flare was observed that corresponded to the launch of superluminal ejecta. Although hints of a connection between QPO transitions and radio flares have been seen in other black hole X-ray transients, our observations constitute the strongest observational evidence to date for a link between the appearance of type-B QPOs and the launch of discrete jet ejections.
1 Introduction
Black hole low-mass X-ray binaries (BH LMXBs), in which a stellar-mass black hole accretes matter from a low-mass companion star, are predominantly transient systems that spend most of their time in a low-luminosity (highly sub-Eddington) quiescent state. During their occasional outbursts the X-ray luminosity of BH LMXBs can increase by factors of up to , often showing transitions between various X-ray spectral/variability states in the process. Several classification schemes have been proposed for these states (e.g., Homan & Belloni, 2005; Remillard & McClintock, 2006; Belloni & Motta, 2016). Two main stable spectral states are usually recognized: the hard state, which shows strong rapid (subsecond) X-ray variability and a spectrum dominated by Comptonized power-law emission, and the soft state, in which rapid X-ray variability is weak and where a thermal disk blackbody component dominates the spectrum. The transitions between these two spectral states, during which sources are often classified as being in an intermediate state, are accompanied by strong evolution of the X-ray variability properties. As a source starts the transition from the hard state to the soft state, strong (type-C) low-frequency quasi-periodic oscillations (QPOs) are usually present in the power density spectra (see Wijnands et al., 1999; Remillard et al., 2002; Casella et al., 2005, for the various low-frequency QPO types). Their frequencies increase from 0.01 Hz to 10 Hz as the spectrum softens. At some point during the transition the type-C QPOs and the associated strong band-limited noise are (temporarily) replaced by other types of QPOs (type-A or type-B, both in 4–9 Hz range) and weaker band-limited noise. While the type-C QPOs are commonly interpreted as being the result of relativistic precession of the inner accretion flow (e.g., Schnittman et al., 2006; Ingram et al., 2009), the nature of the other two types is less clear. Based on their dependence on viewing angle (stronger in more face-on sources, Motta et al., 2015) and their proximity in time to jet launches (Soleri et al., 2008, see next paragraph), the type-B QPOs have been suggested to be related to the production of jet(-like) outflows, but no physical model has been proposed.
Within a few days of the (occasionally rapid) changes between the various types of low-frequency QPOs, radio flares have been observed in some BH LMXBs (see, e.g., Corbel et al., 2001; Brocksopp et al., 2002; Gallo et al., 2004; Miller-Jones et al., 2012; Russell et al., 2019). The flares last hours to days and high angular-resolution radio and X-ray observations have shown that they are the result of discrete ejection events that occurred prior to the radio flares (Corbel et al., 2003, 2005, and references above). Suggestions were made that the ejection events and the resulting radio flares are associated with the appearance of type-B QPOs (e.g. Soleri et al., 2008), but detailed studies of X-ray variability and radio flares in XTE J1550564, GX 3394, XTE J1859+226, H1743322, and MAXI J1535–571 were inconclusive as to whether such a relation exists (Fender et al., 2009; Miller-Jones et al., 2012; Russell et al., 2019). These studies were all hampered by gaps in either the X-ray and/or radio coverage, with the durations of these gaps ranging from 10 hr to 4 days, preventing an unambiguous association of the radio flares and ejection events with the appearance/disappearance of any of the low-frequency QPO types to better than half a day to a few days, depending on the source. In particular, the moment at which the strong change in rapid X-ray variability occurred was not observed in any of the above sources; it must have taken place during a gap in the X-ray coverage. Also, only in a two cases, GX 339-4 and XTE J1859+226, was the onset of the radio flare observed, but the flares were preceded by gaps in the X-ray coverage of 2 days and 16 hr, respectively. In the other cases only part of the rise was covered or only (part of) the decay phase was observed.
In this Letter, we present observations of a radio flare that occurred during a hard-to-soft state transition in MAXI J1820+070. MAXI J1820+070 is an X-ray transient that was discovered with the Monitor of All-Sky X-ray Image (MAXI) in 2018 March (Kawamuro et al., 2018). It was soon realized (Denisenko, 2018) that MAXI J1820+070 was the X-ray counterpart of the optical transient ASASSN-18ey, discovered a few days earlier (Tucker et al., 2018). Observations at various wavelengths soon suggested that the source is a BH LMXB (Baglio et al., 2018; Bright et al., 2018a; Del Santo & Segreto, 2018; Uttley et al., 2018). The black hole nature of the source was confirmed with a dynamical mass measurement by Torres et al. (2019), who put the mass in the 7–8 range. MAXI J1820+070 is a relatively nearby BH LMXB, with a distance of 2.960.33 kpc (Atri et al., 2020), and it has low interstellar absorption ( atoms cm-2; Kajava et al., 2019). After spending roughly the first half of its 8 month outburst in the hard state, MAXI J1820+070 underwent a rapid state transition to the soft state in early July of 2018 (Homan et al., 2018a, b). During this transition a fast switch from type-C to type-B QPOs was observed. Contemporaneous radio observations revealed a strong radio flare that was the result of the launch of superluminal ejecta (Bright et al., 2018b, 2020) and that, as we show in this Letter, may have started within 2–2.5 hr of the QPO transition. This presents the strongest observational link between the two phenomena to date.
2 Observations and data analysis
2.1 NICER
The Neutron Star Interior Composition Explorer (NICER; Gendreau et al., 2016) is an X-ray timing instrument on board the International Space Station. NICER consists of 56 concentrators, each coupled to a focal plane module (FPM) that houses a silicon drift detector. Of these, 52 were functional at the start of NICER operations in 2017 July. NICER provides coverage in the soft (0.2–12 keV) X-ray band with CCD-like spectral resolution and time-tags photons with an absolute timing precision of 100 ns. NICER observed the 2018 outburst of MAXI J1820+070 in great detail. Between 2018 March 5 and 2018 November 21 the source was observed with a total of 750 individual visits and an exposure time of 566 ks (after data filtering and cleaning). All observations were reprocessed with nicerl2 (processing version 20180226), which is part of the NICER software tools in HEASOFT v6.25, using standard filtering criteria (see, e.g., Stevens et al., 2018). For each observation we extracted light curves in various energy bands with a time resolution of 16s. During the brightest phases of the outburst the number of active FPMs had to be lowered (in some cases to just 17) to avoid data dropouts caused by internal telemetry saturation. We therefore normalized the light curves by the number of active FPMs. Light curves in the 13–15 keV band (where no source contribution is expected, due to NICER’s effective area) were used to remove segments of elevated background events (13–15 keV count rates 1.0 counts s-1 per 52 FPM). The light curves were not background-subtracted, which is not a concern for the (high count-rate) phase of the outburst that we focus on. We also ran Fast Fourier Transforms on 16s time segments with a time resolution of 2048-1 s to create power density spectra with a frequency range of 16-1–1024 Hz. This was done for a variety of energy bands.
2.2 AMI-LA
MAXI J1820+070 was observed in the radio with the Arcminute Microkelvin Imager Large Array (AMI-LA Zwart et al., 2008; Hickish et al., 2018) at a central frequency of 15.5 GHz, across a 5 GHz bandwidth consisting of 4096 channels. A total of 183 observations were made between 2018 March and 2018 December, with observation lengths between 1 hr and 8 hr. Data were reduced using the custom software pipeline REDUCE_DC (e.g., Davies et al., 2009; Perrott et al., 2015), which flagged radio frequency interference and performed absolute flux and phase reference calibration. 3C 286 and J1824+1044 were used as the absolute flux and phase reference calibrator, respectively. We created a 30 minute time resolution light curve from observations taken between the 5th and 9th of July directly from the (channel and baseline averaged) uv-amplitude coefficients. Errors were derived from the standard deviation of the amplitude coefficients within each time bin, combined in quadrature with a 5% absolute flux scale uncertainty. Data points for which the error on flux density was larger than 25% of the flux density itself were filtered out.
3 Results
3.1 X-Ray evolution
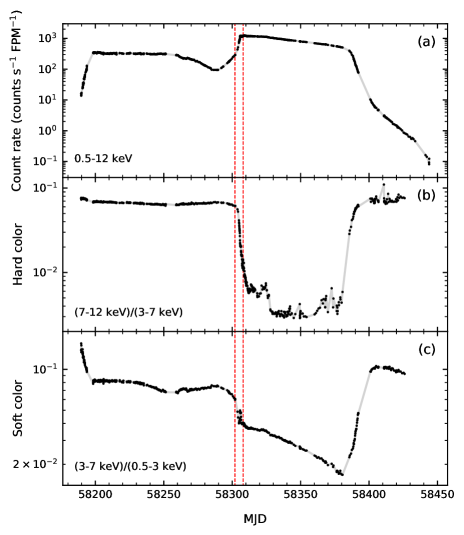
In Figure 1a we show the NICER light curve of the 2018 outburst of MAXI J1820+070 in the 0.5–12 keV band. Each data point represents the average for a single visit. In panels 1b and 1c we show two different X-ray colors; a hard color (ratio of count rates in the 7–12 keV and 3–7 keV bands) and a soft color (ratio of count rates in the 3–7 keV and 0.5–3 keV bands). While our definition of the hard color is similar to that of the soft color as frequently used with Rossi X-ray Timing Explorer (RXTE) data (see, e.g., Homan et al., 2003), our soft color includes an energy range (0.5–3 keV) that was not covered by RXTE, making it much more sensitive to the thermal disk component in the spectra and to changes in the absorption. Note that we do not show the color evolution beyond MJD 58,426, as an increased relative background contribution started affecting the colors.
Based on X-ray brightness and X-ray colors, we divide the outburst of MAXI J1820+070 into three parts: two hard state segments (roughly MJD 58,189–58,290 and MJD 58,400–58,443) that are separated by a period that includes two major state transitions and an extended soft-state phase. The high soft-color values during the rising hard state (MJD 58,195) are partly the result of the presence of a variable warm absorber that resulted in strong and spectrally hard dips (Homan et al., 2018c; Kajava et al., 2019).
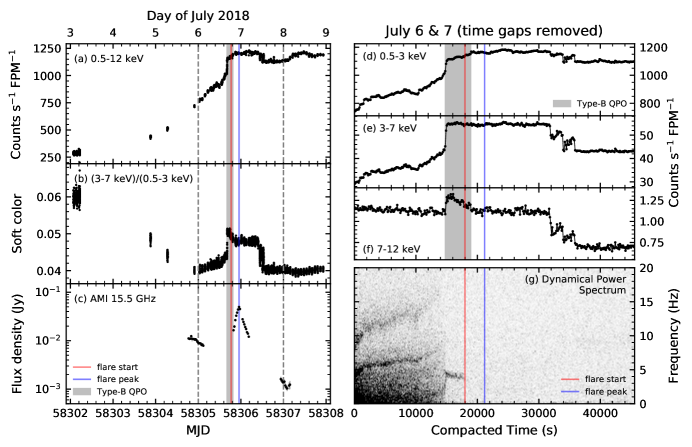
In panels 2a and 2b we show part of the hard-to-soft-state transition in more detail, with a time resolution of 16 s. This period is marked with red dashed lines in Figure 1 and corresponds to 2018 July 3–9 (MJD 58,302–58,308). As can be seen, in the days following July 3 the 0.5–12 keV count rate continued increasing (by a factor of more than 4), while the soft color continued to decrease. By July 6 (MJD 58,305) the source began to deviate from this trend: the soft color started to increase, first slowly, then more rapidly, followed by an 1 day plateau. Around the same time the count rate entered a 1 day plateau as well. On July 7 both the count rate and soft color showed sharp drops.
Strong changes in the rapid X-ray variability were seen during this period of the outburst (Homan et al., 2018a, b). In Figure 2g we show a 0.3–12 keV dynamical power spectrum from the observations made on July 6 and 7 (rebinned to a time resolution of 128 s and a frequency resolution of 0.125 Hz). Corresponding light curves in various energy bands are shown in panels 2d–f. All time gaps were removed in panels 2d–g, to aid in the visualization of the evolution in the dynamical power spectrum. Since the x-axis in panels 2d–g no longer represents elapsed time, we will use the term ‘compacted time’ () when referring to time marks in those panels. Two harmonically related low-frequency QPOs, around 4.5 and 9 Hz, were present at the start of the dynamical power spectrum, along with strong noise at lower frequencies. A time-averaged power spectrum from the time interval – s in panel 2g is shown in black in Figure 3. Based on the shape and relative strength of the power spectral features, and taking into account the evolution prior to July 3 (Homan et al., 2018a), these QPOs can be identified as type-C. Note that the overall strength of the variability in the 0.3–12 keV band (see Fig. 3) is considerably lower than typically seen in the RXTE/PCA band (2–60 keV) for similarly shaped power spectra. This is likely due to dilution by the accretion disk component at low energies. The type-C QPOs increased in frequency (up to 8 and 16 Hz) and became weaker with time; they were no longer visible in the dynamical power spectrum around s, but remained visible in time-averaged power spectra until s. The low frequency noise became weaker with time as well, by a factor of 2, and an additional broad peak around 1–2 Hz appeared to develop (not clearly visible in the dynamical power spectrum).
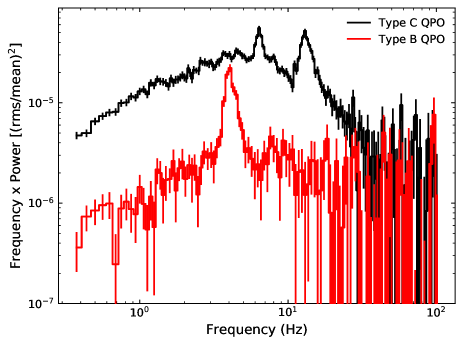
At s several dramatic changes were observed. This time corresponds to MJD 58,305.67740 (July 6 16:15 UTC). In the light curves the count rates increased sharply. The jump in count rate was more pronounced at higher energies, as can be seen from panels 2d–f, and resulted in the sharp increase in soft color that is visible in panel 2b. At the same time the low-frequency noise became even weaker and the peaked noise feature around 1–2 Hz in the power spectrum appeared to evolve rapidly into a QPO around 4.5 Hz (see panel 2g). A time-averaged power spectrum from the interval s is shown in red in Figure 3. Based on the QPO and noise properties, this QPO can be classified as a type-B QPO. The type-B QPO was only present for five good-time intervals ( s in panel 2g) during which it slightly decreased in frequency, to 3 Hz. The duration of its presence is marked with a gray shaded area in panels 2(a-f). Toward the end of this time interval the QPO could no longer be seen in the dynamical power spectrum, due to a combination of intrinsic weakening of the QPO and a drop in the number of active detectors. Interestingly, a comparison with panel 2f suggests that the type-B was only present during the small flare in the 7–12 keV light curve that started around s. After the type-B QPO disappeared ( s; MJD58,305.81136, July 6 19:28 UTC) no QPOs were detected during the remainder of the count rate and soft color plateau. However, as the soft color returned to its pre-plateau values, a weak QPO appeared around 9 Hz, which we suspect was a type-C QPO. We did not see any indications for high-frequency QPOs in our power density spectra.
3.2 Radio flare
The AMI-LA observations covered part of the rapid state transition described in Section 3.1. The radio data, which are shown in detail in Figure 4 and also in Figure 2c, were obtained between July 5 18:31 UTC and July 8 at 03:39 UTC (MJD 58,304.77201–58,307.15169) in three separate segments. Bright et al. (2018b) reported a sharp drop in the radio flux density () between July 2 and July 5, from 40 mJy to 10 mJy. As can be seen from Figure 4 the flux density was still declining during the first segment on July 5/6. However, during the second segment (July 6/7) a strong radio flare occurred, reaching a maximum flux density of 50 mJy on July 6 at 22:58 UTC (MJD 58,305.95697). Bright et al. (2020) showed that this radio flare was the result of the launch of long-lived superluminal ejecta. The start of the radio flare took place during the gap between the first and second data segments. In the third segment (July 7/8) the evolution appeared to be a continuation of the trend seen during the first segment, with the flux density declining on a similar time scale. This suggests that the occurrence of the radio flare did not significantly affect the overall decline in radio flux density.
Usually, the start of a radio flare is defined as the moment at which the flux starts to deviate significantly from the persistent flux (see, e.g., Gallo et al., 2004). This can be approximated by finding the intersection of the baseline decline (seen in the first and third data segments) and the rise of the radio flare. However, this definition of the start time of the flare is quite sensitive to the baseline flux level, which is not necessarily related to the flux from the radio flare. Therefore, we define an alternative start time by extrapolating the rise of the radio flare back to mJy. We fit the entire radio data set with three components, which are shown in Figure 4 (see the caption for details): a linear function for the rise of the flare, a power law for the flare decay, and an exponential function for the baseline decay. The combined fit (gray line) results in a reduced of 0.86 for 37 degrees of freedom. Extrapolating the linear fit (blue dashed lines in Fig. 4) back to mJy, we find a start time of MJD 58,305.7730.006 (or July 6 18:33 UTC, with a statistical uncertainty of 10 minutes). This time is marked as a vertical red line in Figure 4 and in all panels of Figure 2. The estimated flare start is 2–2.5 hr later than the time at which the type-B QPO appeared. However, it still falls within the shaded gray area in Figures 2 and 4 that represents the presence of the type-B QPO.

4 Discussion
We have presented NICER X-ray and AMI-LA radio coverage of a rapid hard-to-soft state transition in the black hole X-ray transient MAXI J1820+070. During this state transition a switch from type-C to type-B QPOs was seen in the power spectra, together with a drop in the strength of the broadband X-ray variability (Fig. 3) and the start of a brief flare in the 7–12 keV band (Fig. 2f). Soon after the rapid state transition a strong radio flare was observed, which was shown to be the result of the launch of relativistic ejecta by Bright et al. (2020). Assuming that the X-ray flare and the dramatic change in the X-ray timing properties mark the time of the ejection event—perhaps similar to how strong X-ray spikes often mark ejection events in the BH LMXB GRS 1915+105 (Eikenberry et al., 1998; Mirabel et al., 1998)—the start of the radio flare is delayed with the respect to the launch of the ejecta by 2–2.5 hr. Since the AMI in-band spectral index indicates that the flare was optically thin throughout (J. Bright et al. in preparation), the most likely explanation for the observed delay is that it represents the time it takes for the ejecta to catch up with slower moving jet material that was ejected previously, or the time it takes for the ejecta to run into the interstellar medium. Both would result in optically thin radio emission due to internal shocks (Kaiser et al., 2000; Miller-Jones et al., 2009; Jamil et al., 2010; Malzac, 2014).
Fender et al. (2009), Miller-Jones et al. (2012), and Russell et al. (2019) looked in detail at possible connections between the occurrence of radio flares and changes in the X-ray timing properties in several transient BH LMXBs: XTE J1550–564, XTE J1859+226, GX 339–4, H1743–322, XTE J1752–223, and MAXI J1535–571. Despite some cases in which a radio flare occurred close in time (within half a day to days) to the disappearance of type-C QPOs and/or the appearance of type-B QPOs, the authors concluded that there was not enough evidence to directly tie discrete jet ejections to a change in X-ray timing properties. As the authors already noted, however, their data sets suffered from gaps (up to several days long) in the radio and/or X-ray coverage, limiting their ability to either confirm or rule out a connection between the phenomena.
The NICER and AMI-LA data sets for MAXI J1820+070 that we used in this paper present a significant improvement over the data sets analyzed by Fender et al. (2009), Miller-Jones et al. (2012), and Russell et al. (2019). Most importantly, in X-rays we were able to follow the rapid evolution of the type-C QPOs until they disappeared and we captured the moment at which a narrow type-B QPO appeared around 4.5 Hz; in the previously studied sources this switch between type-C and type-B QPOs always happened during gaps in the X-ray coverage. Moreover, despite missing the start of the radio flare, the otherwise good radio coverage allowed us to narrow down its start time to a period of 2–2.5 hr after the appearance of the type-B QPO. What sets the MAXI J1820+070 data set apart from the data sets discussed above is the relative accuracy with which we were able to determine both the start of the radio flare and the appearance of the type-B QPO. Although we cannot rule out that the radio flare and the switch in QPO type are not physically related, the short (2–2.5 hr) time delay is the strongest empirical evidence to date to suggest that they are, in fact, connected. This does not, of course, necessarily imply that radio flares are only produced when type-B QPOs appear.
It is important to point out that the data sets studied by Fender et al. (2009), Miller-Jones et al. (2012), and Russell et al. (2019), are not inconsistent with there being a strong connection between radio flares and the appearance of type-B QPOs. However, for their behavior to be consistent with this we have to assume that type-B QPOs were present during gaps in the X-ray data prior to the detection of the radio flares. This is not an unreasonable assumption: while the phase during which type-B QPOs are observed in a given source can be a few days long, type-B QPOs themselves are often short-lived (minutes to tens of minutes; see, e.g., Casella et al., 2004) and can easily be missed.
Finally, the appearance of the type-B QPO coincided with the start of a small flare in the 7–12 keV band (see Fig. 2f)—a detailed spectral analysis of the rapid spectral evolution during this phase will be presented in future work. This flare had a duration between 3.2 and 4.6 hr (the presence of a data gap prevents a more accurate estimate). It has been proposed that the base of a compact jet in the hard state can produce X-rays through synchrotron emission and inverse Compton scattering (Markoff et al., 2005). Although Markoff et al. (2005) do not specifically discuss X-ray emission from discrete jet ejections, the presence of the short 7–12 keV flare preceding the radio flare suggests that these ejections may produce (hard) X-rays as well, either at the time of their launch or very soon after. This would also strengthen the case for a jet-based origin of type-B QPOs, as suggested by Motta et al. (2015) based on their dependence on viewing angle.
5 Conclusions
The dense NICER coverage of the rapid state transition in MAXI J1820+070 has allowed us to look for transient phenomena in X-rays that appear to be associated with discrete jet ejections. We have identified two such phenomena: the appearance of a type-B QPO and the occurrence of a flare in the 7–12 keV band, both of which lasted for approximately four hours and started within 2–2.5 hr of the inferred onset of a radio flare that was observed with AMI-LA. They may represent the most promising observational X-ray markers of discrete jet ejections in transient BH LMXBs.
References
- Atri et al. (2020) Atri, P., Miller-Jones, J. C. A., Bahramian, A., et al. 2020, MNRAS, 493, L81, doi: 10.1093/mnrasl/slaa010
- Baglio et al. (2018) Baglio, M. C., Russell, D. M., & Lewis, F. 2018, The Astronomer’s Telegram, 11418
- Belloni & Hasinger (1990) Belloni, T., & Hasinger, G. 1990, A&A, 227, L33
- Belloni & Motta (2016) Belloni, T. M., & Motta, S. E. 2016, in Astrophysics of Black Holes: From Fundamental Aspects to Latest Developments – Astrophysics and Space Science Library, Publisher: Springer , Editor: C. Bambi, Vol. 440, 61
- Bright et al. (2018a) Bright, J., Fender, R., & Motta, S. 2018a, The Astronomer’s Telegram, 11420
- Bright et al. (2020) —. 2020, Nature, in press
- Bright et al. (2018b) Bright, J., Motta, S., Fender, R., Perrott, Y., & Titterington, D. 2018b, The Astronomer’s Telegram, 11827
- Brocksopp et al. (2002) Brocksopp, C., Fender, R. P., McCollough, M., et al. 2002, MNRAS, 331, 765, doi: 10.1046/j.1365-8711.2002.05230.x
- Casella et al. (2004) Casella, P., Belloni, T., Homan, J., & Stella, L. 2004, A&A, 426, 587, doi: 10.1051/0004-6361:20041231
- Casella et al. (2005) Casella, P., Belloni, T., & Stella, L. 2005, ApJ, 629, 403, doi: 10.1086/431174
- Corbel et al. (2003) Corbel, S., Fender, R. P., Tzioumis, A. K., et al. 2003, New A Rev., 47, 477, doi: 10.1016/S1387-6473(03)00075-7
- Corbel et al. (2005) Corbel, S., Kaaret, P., Fender, R. P., et al. 2005, ApJ, 632, 504, doi: 10.1086/432499
- Corbel et al. (2001) Corbel, S., Kaaret, P., Jain, R. K., et al. 2001, ApJ, 554, 43, doi: 10.1086/321364
- Davies et al. (2009) Davies, M. L., Franzen, T. M. O., Davies, R. D., et al. 2009, MNRAS, 400, 984, doi: 10.1111/j.1365-2966.2009.15518.x
- Del Santo & Segreto (2018) Del Santo, M., & Segreto, A. 2018, The Astronomer’s Telegram, 11427
- Denisenko (2018) Denisenko, D. 2018, The Astronomer’s Telegram, 11400
- Eikenberry et al. (1998) Eikenberry, S. S., Matthews, K., Morgan, E. H., Remillard, R. A., & Nelson, R. W. 1998, ApJ, 494, L61, doi: 10.1086/311158
- Fender et al. (2009) Fender, R. P., Homan, J., & Belloni, T. M. 2009, MNRAS, 396, 1370, doi: 10.1111/j.1365-2966.2009.14841.x
- Gallo et al. (2004) Gallo, E., Corbel, S., Fender, R. P., Maccarone, T. J., & Tzioumis, A. K. 2004, MNRAS, 347, L52
- Gendreau et al. (2016) Gendreau, K. C., Arzoumanian, Z., Adkins, P. W., et al. 2016, in Proc. SPIE, Vol. 9905, Space Telescopes and Instrumentation 2016: Ultraviolet to Gamma Ray, 99051H
- Hickish et al. (2018) Hickish, J., Razavi-Ghods, N., Perrott, Y. C., et al. 2018, MNRAS, 475, 5677, doi: 10.1093/mnras/sty074
- Homan & Belloni (2005) Homan, J., & Belloni, T. 2005, Ap&SS, 300, 107, doi: 10.1007/s10509-005-1197-4
- Homan et al. (2003) Homan, J., Klein-Wolt, M., Rossi, S., et al. 2003, ApJ, 586, 1262
- Homan et al. (2018a) Homan, J., Uttley, P., Gendreau, K., et al. 2018a, The Astronomer’s Telegram, 11820
- Homan et al. (2018b) —. 2018b, The Astronomer’s Telegram, 11823
- Homan et al. (2018c) Homan, J., Altamirano, D., Arzoumanian, Z., et al. 2018c, The Astronomer’s Telegram, 11576
- Ingram et al. (2009) Ingram, A., Done, C., & Fragile, P. C. 2009, MNRAS, 397, L101, doi: 10.1111/j.1745-3933.2009.00693.x
- Jamil et al. (2010) Jamil, O., Fender, R. P., & Kaiser, C. R. 2010, MNRAS, 401, 394, doi: 10.1111/j.1365-2966.2009.15652.x
- Kaiser et al. (2000) Kaiser, C. R., Sunyaev, R., & Spruit, H. C. 2000, A&A, 356, 975
- Kajava et al. (2019) Kajava, J. J. E., Motta, S. E., Sanna, A., et al. 2019, MNRAS, 488, L18, doi: 10.1093/mnrasl/slz089
- Kawamuro et al. (2018) Kawamuro, T., Negoro, H., Yoneyama, T., et al. 2018, The Astronomer’s Telegram, 11399
- Malzac (2014) Malzac, J. 2014, MNRAS, 443, 299, doi: 10.1093/mnras/stu1144
- Markoff et al. (2005) Markoff, S., Nowak, M. A., & Wilms, J. 2005, ApJ, 635, 1203, doi: 10.1086/497628
- Miller-Jones et al. (2009) Miller-Jones, J. C. A., Rupen, M. P., Türler, M., et al. 2009, MNRAS, 394, 309, doi: 10.1111/j.1365-2966.2008.14279.x
- Miller-Jones et al. (2012) Miller-Jones, J. C. A., Sivakoff, G. R., Altamirano, D., et al. 2012, MNRAS, 421, 468, doi: 10.1111/j.1365-2966.2011.20326.x
- Mirabel et al. (1998) Mirabel, I. F., Dhawan, V., Chaty, S., et al. 1998, A&A, 330, L9
- Motta et al. (2015) Motta, S. E., Casella, P., Henze, M., et al. 2015, MNRAS, 447, 2059, doi: 10.1093/mnras/stu2579
- Perrott et al. (2015) Perrott, Y. C., Scaife, A. M. M., Green, D. A., et al. 2015, MNRAS, 453, 1396, doi: 10.1093/mnras/stv1728
- Remillard & McClintock (2006) Remillard, R. A., & McClintock, J. E. 2006, ARA&A, 44, 49, doi: 10.1146/annurev.astro.44.051905.092532
- Remillard et al. (2002) Remillard, R. A., Sobczak, G. J., Muno, M. P., & McClintock, J. E. 2002, ApJ, 564, 962
- Russell et al. (2019) Russell, T. D., Tetarenko, A. J., Miller-Jones, J. C. A., et al. 2019, ApJ, 883, 198, doi: 10.3847/1538-4357/ab3d36
- Schnittman et al. (2006) Schnittman, J. D., Homan, J., & Miller, J. M. 2006, ApJ, 642, 420, doi: 10.1086/500923
- Soleri et al. (2008) Soleri, P., Belloni, T., & Casella, P. 2008, MNRAS, 383, 1089, doi: 10.1111/j.1365-2966.2007.12596.x
- Stevens et al. (2018) Stevens, A. L., Uttley, P., Altamirano, D., et al. 2018, ApJ, 865, L15, doi: 10.3847/2041-8213/aae1a4
- Torres et al. (2019) Torres, M. A. P., Casares, J., Jiménez-Ibarra, F., et al. 2019, ApJ, 882, L21, doi: 10.3847/2041-8213/ab39df
- Tucker et al. (2018) Tucker, M. A., Shappee, B. J., Holoien, T. W. S., et al. 2018, ApJ, 867, L9, doi: 10.3847/2041-8213/aae88a
- Uttley et al. (2018) Uttley, P., Gendreau, K., Markwardt, C., et al. 2018, The Astronomer’s Telegram, 11423
- Wijnands et al. (1999) Wijnands, R., Homan, J., & van der Klis, M. 1999, ApJ, 526, 33
- Zwart et al. (2008) Zwart, J. T. L., Barker, R. W., Biddulph, P., et al. 2008, MNRAS, 391, 1545, doi: 10.1111/j.1365-2966.2008.13953.x