Machine learning spectral indicators of topology
Abstract
Topological materials discovery has emerged as an important frontier in condensed matter physics. While theoretical classification frameworks have been used to identify thousands of candidate topological materials, experimental determination of materials’ topology often poses significant technical challenges. X-ray absorption spectroscopy (XAS) is a widely-used materials characterization technique sensitive to atoms’ local symmetry and chemical bonding, which are intimately linked to band topology by the theory of topological quantum chemistry (TQC). Moreover, as a local structural probe, XAS is known to have high quantitative agreement between experiment and calculation, suggesting that insights from computational spectra can effectively inform experiments. In this work, we leverage computed X-ray absorption near-edge structure (XANES) spectra of more than 10,000 inorganic materials to train a neural network (NN) classifier that predicts topological class directly from XANES signatures, achieving F1 scores of 89% and 93% for topological and trivial classes, respectively. Additionally, we obtain consistent classifications using corresponding experimental and computational XANES spectra for a small number of measured compounds. Given the simplicity of the XAS setup and its compatibility with multimodal sample environments, the proposed machine learning-augmented XAS topological indicator has the potential to discover broader categories of topological materials, such as non-cleavable compounds and amorphous materials, and may further inform field-driven phenomena in situ, such as magnetic field-driven topological phase transitions.
I Introduction
Topological materials are characterized by a topologically nontrivial electronic band structure from which they derive their exceptional transport properties [1, 2, 3, 4, 5, 6]. The prospect of developing these exotic phases into useful applications has garnered widespread efforts to identify and catalogue candidate topological materials, evidenced by the emergence of numerous theoretical frameworks based on connectivity of electronic bands [7, 8, 9, 10, 11, 12, 13], symmetry-based indicators [14, 15, 16, 7, 17, 18, 19, 20, 21], electron-filling constraints [7, 22, 23], and spin–orbit spillage [24, 25, 26]. These frameworks have facilitated the prediction of over 8,000 topologically non-trivial phases [27, 28, 29, 30, 31, 32, 33, 34], a vast unexplored territory for experiments. This is strong motivation to develop complementary experimental techniques for high-throughput screening of candidate materials. Current state-of-the-art techniques such as angle-resolved photoemission spectroscopy (ARPES), scanning tunneling microscopy (STM), and quantum transport measurements are commonly used to detect topological signatures, but a few limitations remain: Methods like ARPES directly probe band topology but are surface-sensitive and thereby place strict requirements on sample preparation and the sample environment, limiting the range of experimentally accessible materials [35, 36]; transport measurements, on the other hand, can be performed on more versatile samples but can be more difficult to interpret. Neither approach yet fully meets the demands of a high-throughput classification program.
Machine learning methods are increasingly being adapted to materials research to accelerate materials discovery [37, 38, 39, 40, 41, 42, 42, 43, 44] and facilitate inverse design through high-throughput property prediction [45, 46, 47]. Several recent studies have proposed data-driven frameworks for predicting band topology from structural and compositional attributes [48, 49, 50] and quantum theoretical or simulated data [51, 52, 53, 54]. At the same time, machine learning methods are being adopted to automate and improve data analysis for a broad range of experimental techniques [55, 56, 57, 58, 59, 60, 61]. Importantly, machine learning presents a potential opportunity to not only accelerate data analysis, but to derive useful information from complex data in the absence of reliable theoretical models, or to extract new insights beyond traditional models.
In this work, we develop a data-driven classifier of electronic band topology using materials’ X-ray absorption spectra. X-ray absorption spectroscopy (XAS) is widely used to characterize the chemical state and local atomic structure of atomic species in a material. This technique is suitable for the study of highly diverse samples and environments, including noncrystalline materials and extreme temperatures and pressures [62]. As a bulk probe, XAS also places few constraints on surface quality and sample preparation. The X-ray absorption near-edge structure (XANES), defined within approximately 50 eV of an XAS absorption edge, provides a specie-specific fingerprint of the absorbing atom’s local chemical environment, including coordination chemistry, orbital hybridization, and density of available electronic states. However, despite the rich electronic structural information contained in XANES spectra, the lack of a simple analytic description of XANES has compelled largely qualitative treatment of this energy regime, with individual spectral features attributed to properties of the electronic structure through empirical evidence and spectral matching [63]. As a result, machine learning methods have been introduced to automate the estimation of materials parameters such as coordination environments [56, 64, 65, 66, 67], oxidation states, [64, 67], and crystal-field splitting [68] from XANES and other core-level spectroscopies, and even enable direct prediction of XANES spectra from structural and atomic descriptors [69, 70, 71]. Here, we propose that machine learning models can be used to extract other hidden electronic properties, namely the electronic band topology, from XANES signatures and thereby serve as a potentially useful diagnostic of topological character. The theory of topological quantum chemistry (TQC) has demonstrated the intimate link between a material’s band topology and its local chemical bonding [7], which motivates our inquiry into the unexplored connection between XANES spectra and band topology. In particular, we develop a machine learning-enabled indicator of band topology based on K-edge XANES spectral inputs, which correspond to electronic transitions from the core shell states to unoccupied states above the Fermi energy. First, we summarize the data assembly procedure, which consists of labeling the database of computed XANES K-edge spectra [72] according to topological character using the catalogue of high-quality topological materials predicted by TQC [27, 34]. We then conduct an exploratory analysis of topological indication for the K-edge XANES spectra of different elements based on principal component analysis (PCA) and -means clustering. Finally, we develop a neural network (NN) classifier of topology that synthesizes insights from XANES signatures of all elements in a given compound. Our classifier achieves F1 scores of and for topological and trivial classes, respectively. Materials containing certain elements, including Be, Al, Si, Sc, Ti, Ga, Ag, and Hg, are predicted with F1 scores above in both classes. Our work suggests the potential of machine learning to uncover topological character embedded in complex spectral features, especially when a mechanistic understanding is challenging to acquire.
II Data preparation and pre-processing
XAS data were obtained from the published database of computed K-edge XANES spectra [72] and additional examples distributed on the Materials Project [73, 74, 75, 76], which are computed using the FEFF9 program [77]. The materials from the XANES database were then labeled according to their classification in the database of topological materials [27, 34], which is based on the formalism of TQC [7]. The classifications in the TQC database are based on structures from the Inorganic Crystal Structure Database (ICSD) [78], and the ICSD identifier was used to associate topological class labels with entries in the XANES database. We note that the crystal structures in the two databases are not strictly identical, and ICSD identifiers are associated with structurally-similar Materials Project entries according to pymatgen’s StructureMatcher algorithm [76, 75]. In rare cases, multiple ICSD identifiers corresponding to different topological classifications were associated with the same set of XANES spectra. Because small discrepancies between the ICSD and Materials Project structures could lead to different topological classification for some materials close to a phase transition, all multiply-labeled examples were removed from the dataset. The materials data were further refined based on availability of both high-quality topological classification and spectral data, resulting in total materials considered: topological and trivial . Here, high-quality is defined following Ref. 27, which considers only materials with well-determined structures and excludes alloys, magnetic compounds, and certain problematic -electron atoms. Additionally, entries with spectra containing unphysical features such as large negative jumps were discarded. The materials in the final dataset are structurally and chemically diverse, representing 200 of 230 spacegroups and 63 different elements, with primitive unit cells ranging from 1 to 76 atoms and up to 7 unique chemical species. The representation of different elements among topological and trivial examples is shown in Figure S1a-b of the Supplemental Material. Data were subdivided into training, validation, and test sets according to a split. While samples were randomly distributed among the datasets, an assignment process was developed to ensure balanced representation of each absorbing element and topological class within each dataset. Specifically, the fraction of topological insulators (TI), topological semimetals (TSM) and topologically trivial materials represented in compounds containing a certain element was balanced as shown in Figure S1c. For each example, the computed K-edge XANES spectra of each absorbing element were interpolated and re-sampled at evenly-spaced energy values spanning an energy range of 56 eV surrounding the absorption edge. The spectra were standardized separately for different absorbing elements, which consisted of centering the mean of spectral intensities over each energy range, and scaling by the average intensity standard deviations.
III Results
III.1 Exploratory analysis
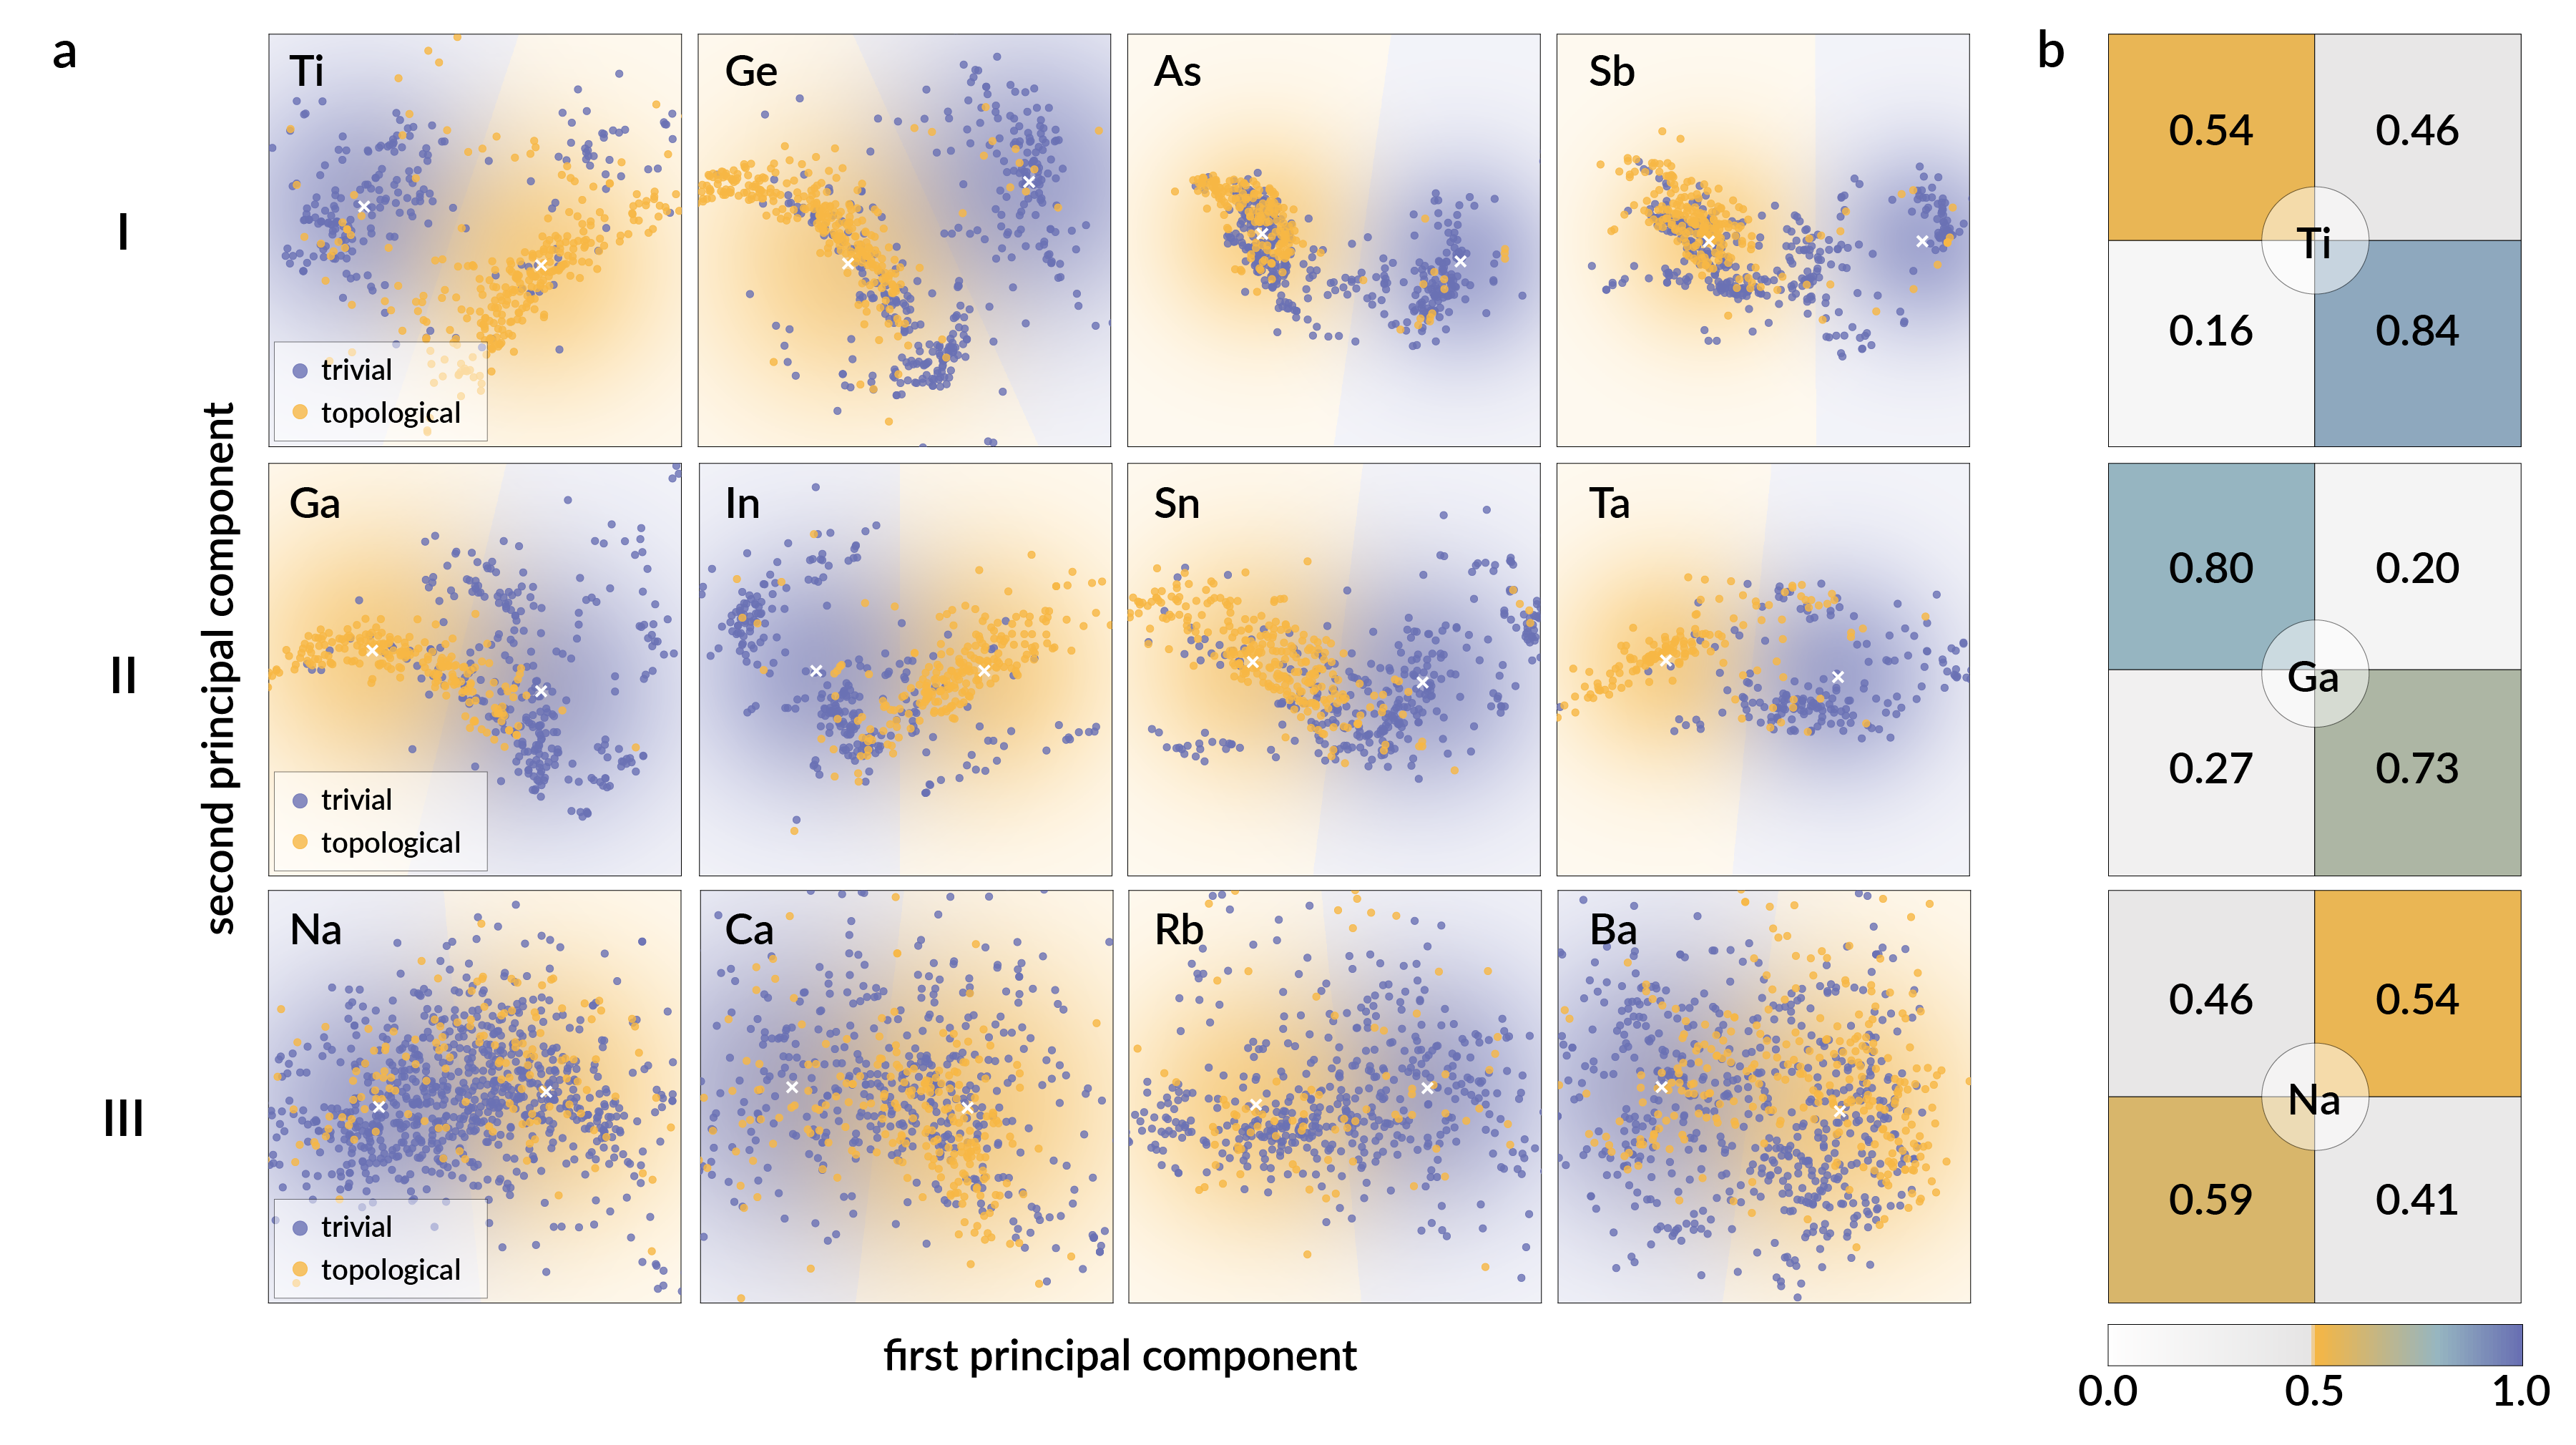
Prior to training the NN classifier, we conducted an exploratory analysis of the assembled XANES spectra to estimate the separability by topological class exhibited by different elements. For all examples containing a given element, we performed a principal component analysis (PCA) on the high-dimensional spectra and subsequently carried out unsupervised k-means clustering on a subset of principal components of the training set. The number of retained principal components was selected to retain at least of the explained variance of spectra for a given element. Results of the clustering analysis for a selection of elements are shown in Figure 1. The decision boundary between the two clusters identified by k-means clustering, projected along the first two principal components, lies at the intersection of the blue (trivial) and orange (topological) shaded regions in Figure 1a. Since k-means clustering is not supervised by the true topological class of each example, cluster assignment was performed by solving an optimal matching problem that finds the pairing between clusters and topological classes that minimizes the number of misclassified examples, corrected for class imbalance. The examples from all three datasets (training, validation, and testing) are plotted as scattered points in the low-dimensional space and colored according to their known topological class. Additional visualizations are shown in Figure S2. A quick survey of these results reveals a number of elements for which the classification accuracy of topological and trivial examples is imbalanced, and a few for which the classification accuracy is more balanced between the two classes. We correlated these observations with the decision boundary visualizations and noted three distinct patterns in the result of our unsupervised clustering. For some elements, nearly all topological examples were segregated within a single cluster (row I of Figure 1). This led to a strong score for topological examples but weaker score for trivial ones for elements such as Ti, Ge, As, and Sb. Other elements like Ga, In, Sn, and Ta exhibited more balanced classification accuracies between the two topological classes (row II of Figure 1). On the other hand, there were a number of unsuccessful examples of alkali and alkaline earth metals for which clustering of the data did not appear coincident with topological class (row III of Figure 1). Given that the feature transformations performed in our exploratory analysis were element-specific, the potential to discriminate data between the two classes is encouraging. This also suggests a possible advantage of synthesizing information of all constituent atom types in a given compound in order to improve prediction accuracy.
III.2 Network architecture optimization
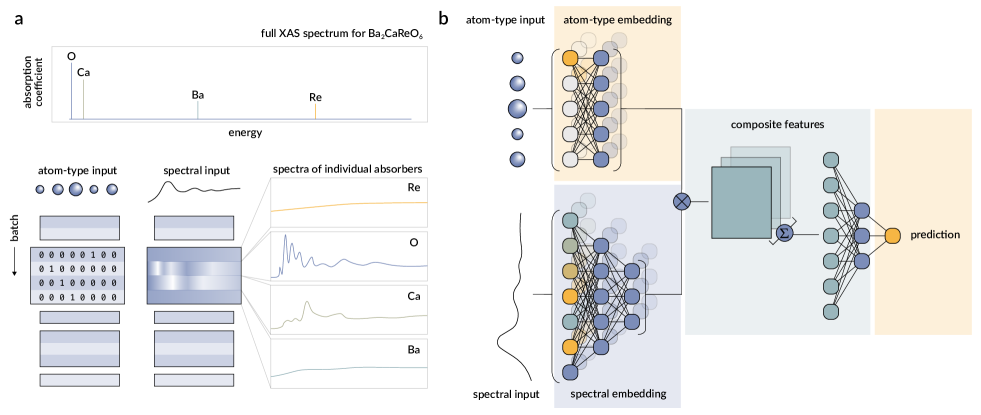
The NN classifier inputs consist of the set of XANES spectra and atom types of each absorbing atom in a given material, as shown in Figure 2a, where atom types are encoded as one-hot feature vectors with a one at the index equaling the atomic number, and zeros elsewhere. The core–electron binding energy increases substantially with increasing atomic number, ranging from 284 eV for the C K-edge to 115,606 eV for the U K-edge [79], and thus representing the XANES spectra of all absorbers on a continuous energy scale would be either poorly resolved or exceedingly high-dimensional (Figure 2a). Separating the spectral and atom type information at the input facilitates the construction of element-specific channels and allows us to retain the spectral energy resolution. In addition to enabling the synthesis of information from different absorbers, a neural network comprises more complex, non-linear operations than PCA and thereby has the capability to learn more expressive representations of the input data. The network architecture is illustrated in Figure 2b. Fully-connected layers first operate on each spectral and atom-type input to obtain intermediate representations, termed the spectral and atom-type embeddings, respectively. The embedded spectra are assigned to element-specific channels through a direct product with the corresponding atom-type embedding. These composite features are subsequently added for a given material and flattened to a single array, which is passed to another series of fully-connected layers and activations that output the predicted binary topological class. Due to moderate class imbalance, samples were weighted to add greater penalty to the misclassification of topological examples.
III.3 Machine learning model performance
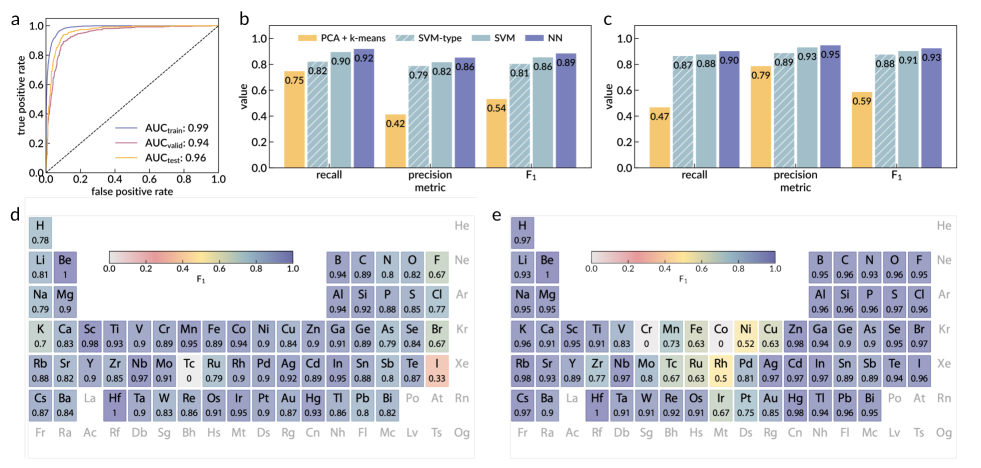
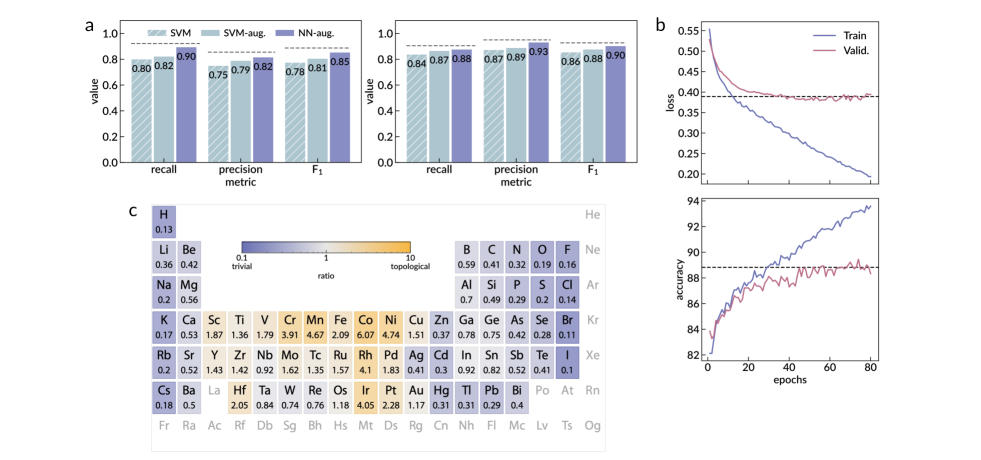
Figure 3 summarizes the performance of the trained NN classifier. The receiver operating characteristic (ROC) curve, which indicates the tradeoff between true and false positive rates, is shown in Figure 3a. We use three different metrics in assessing the quality of prediction: recall, precision, and F1 score. These metrics are defined as
| (1a) | ||||
| (1b) | ||||
| (1c) | ||||
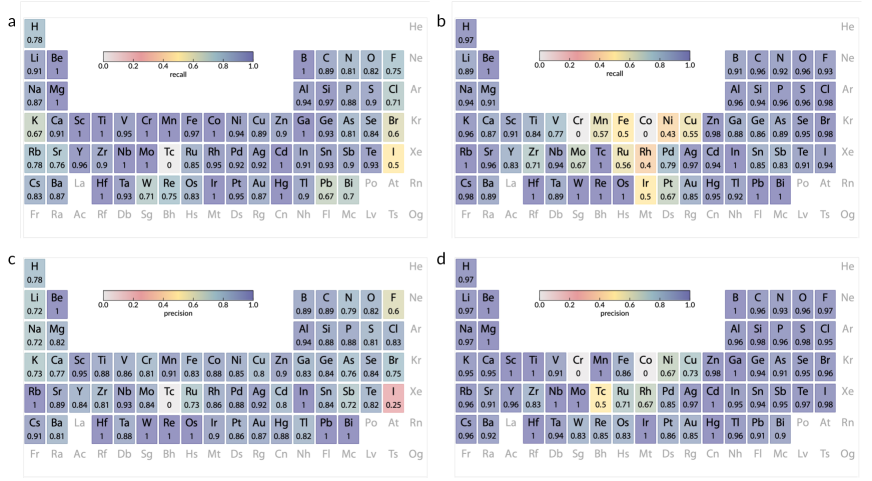
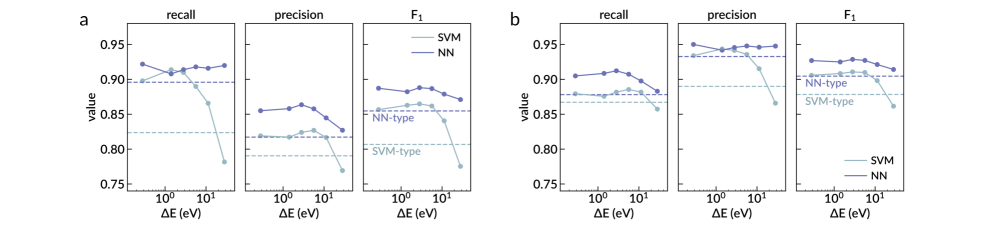
where and denote the number of true positive and true negative predictions, and and denote the number of false positive and false negative predictions of a given class, respectively. The NN classifier achieved F1 scores of and for topological and trivial classes, respectively. We compare these results to the performance of a traditional support vector machine (SVM) operating on one-hot encoded atom types only (denoted SVM-type) and on a concatenated array of spectra for all atom types (denoted SVM), as shown in Figure 3b and c. The average performance of the PCA and -means clustering approach across all elements is also included for reference. Note that the concatenated feature vector input to the SVM contains zeros in place of spectra corresponding to elements not contained in the compound. We find that both the NN and SVM classifiers based on XANES spectral inputs outperform the baseline model relying on atom types alone, suggesting that XANES spectral features provide meaningful insight to topological indication. To maintain the same number of neurons between SVM-type and SVM models, the SVM-type inputs were copied 200 times (the length of the spectral inputs) to construct the input features, which led to a combined increase of in the scores compared to a minimal SVM-type model reported in Figure S5a for comparison. The NN further improves upon the SVM model predictions, particularly in the precision of topological classification which increased by . We note that the NN with both spectral and atom-type inputs achieves a combined improvement of in the scores compared to a NN model of similar size operating on atom-type inputs alone (Figure S5a). Additional details about the reference models are provided in the Supplemental Material. We also assess the sensitivity to the spectral energy resolution in Figure S7. While the main results of this work are obtained for spectra sampled at intervals of eV, we see that a sampling of eV is sufficient for comparable performance. Finally, we compute the average metric scores obtained by the NN classifier individually for each absorbing element, shown in Figure 3d and e for topological and trivial examples, respectively. Corresponding results for the SVM model and additional plots for the NN classifier are shown in Figure S4 and Figure S6, respectively.
III.4 Application to experimental spectra
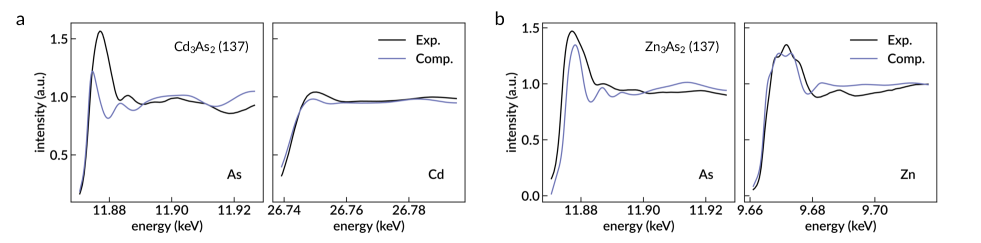
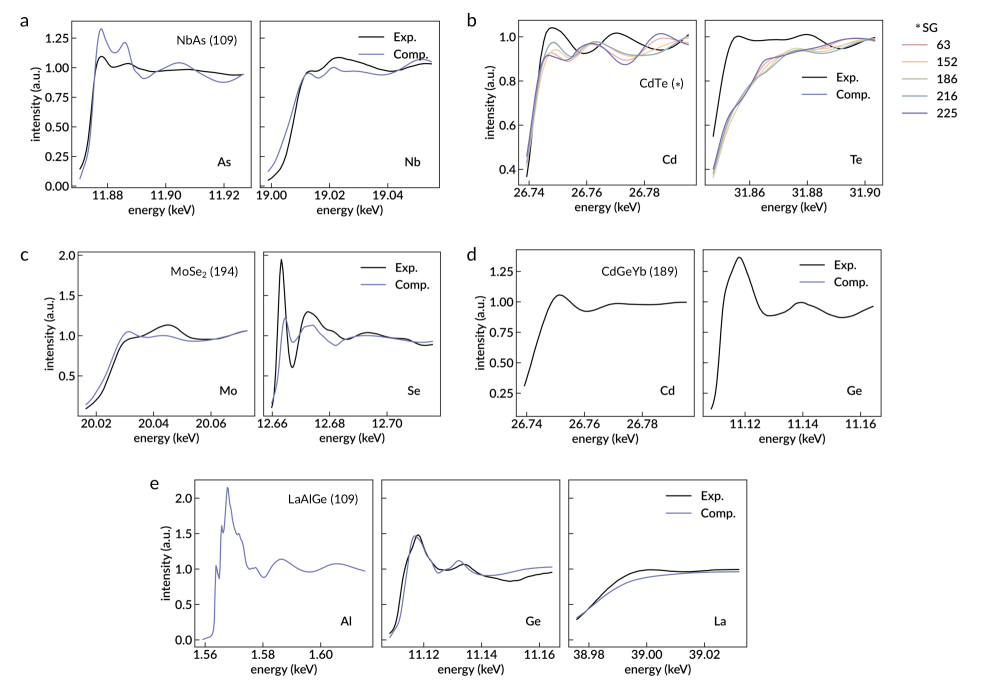
While we are unable to include experimental spectra in our training set due to limited availability, we present a preliminary effort by making predictions on a small set of seven experimental XAS spectra and their computational counterparts, where available. The XAS experiments were performed at the 4-ID-D beamline of the Advanced Photon Source (APS) and include measurements of both topological and trivial compounds listed in Table 1. The predictions obtained using the experimental and computational spectra were all consistent with one another, though in one instance (MoSe2) both are incorrectly classified, as shown in Table 1. Specifically, within this set of examples, the neural network correctly classifies six of the seven sets of experimental spectra, and five of the six sets of computational spectra (computational spectra were unavailable for one of the seven compounds). Additionally, we note that for the two ternary compounds, LaAlGe and CdGeYb, one of the three absorption edges could not be measured at this time; in these cases, the two available experimental spectra were used to make a prediction. As an example, Figure 4 shows the experimental and computational XAS spectra of the topological semimetal Cd3As2 (Figure 4a) and the isostructural trivial compound Zn3As2 (Figure 4b). While there is some misalignment of the experimental spectra relative to the computed ones, many of the key qualitative features are preserved. We expect that a certain tolerance in the misalignment is admissible, further reinforced by the results of the sensitivity analysis discussed in the previous section. Spectra for the remaining experimental examples are provided in the Supplementary Information as Figure S9.
| Class Material Spacegroup True Pred. (Exp.) Pred. (Comp.) NbAs 109 Topo. Topo. Topo. LaAlGea) 109 Topo. Topo. Topo. Zn3As2 137 Trivial Trivial Trivial Cd3As2 137 Topo. Topo. Topo. CdGeYbb) 189 Topo. Topo. MoSe2 194 Trivial Topo.d) Topo.d) CdTe c) Trivial Trivial Trivial |
-
a)
Al K-edge was not measured.
-
b)
Yb K-edge was not measured.
-
c)
The same classifications are obtained for all computed spacegroups: 63, 152, 186, 216, and 225.
-
d)
Incorrectly predicted.
| Material Spacegroup Predicted class TaAs 109 Topological NbAs 109 Topological NbP 109 Topological WTe2 31 Topological Ag2Se 17 Trivial LaAlGe 109 Topological Ba7Al4Ge9 42 Topological Cu2SnTe3 44 Topological BiTeI 143 Trivial Al4Mo 8 Topological KOs2O6 216 Topological Zn2In2S5 186 Trivial |
IV Discussion
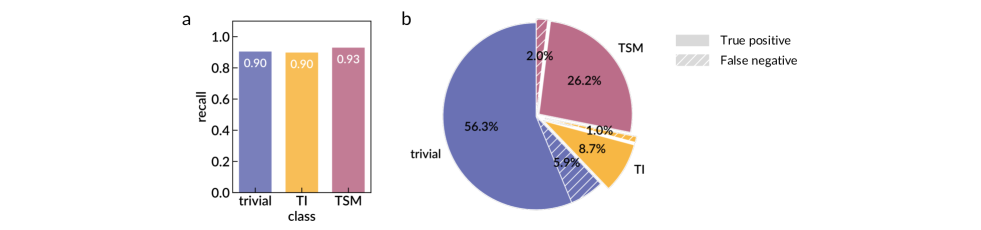
Our results indicate that the NN classifier enables higher and more balanced predictive accuracy over the PCA and -means clustering approach for a majority of elements, including significant improvement for alkali metals. Certain elements are better indicators of one class over another; for instance, the alkali metals and halogens appear to serve as somewhat poor indicators of topological samples but are well-predicted in trivial compounds. A possible explanation for this is that the elements in these columns rarely contribute to frontier orbitals (valence and conduction bands) in materials, and are thereby poor indicators of topology. Certain transition-metal elements, such as Cr, Co, Ni, Tc, and Rh, also exhibit imbalanced accuracy in the prediction of trivial and topological classes. This is most likely due to the overrepresentation of topological examples containing Cr, Co, Ni, and Rh (Figure S5c), since accurate prediction of topological compounds is prioritized during training. Tc is the least abundant element in the dataset (Figure S1a and b), which accounts for the model’s weak performance on Tc-containing compounds. However, further investigation of the relevant spectroscopic features – whether pre-edge, edge, or post-edge – in connection with the corresponding electronic transitions (e.g. ) may be useful to better understand performance barriers for transition metals. Finally, we comment on the comparatively low precision obtained for topological over trivial examples, and , respectively. While the higher false positive rate of topological materials may suggest additional model improvements are needed, it may also indicate missed topological candidates. In fact, since the TQC formalism considers only the characters of electronic bands at high-symmetry points, it may incorrectly classify certain Weyl semimetals with topological singularities at arbitrary -points [27]. In particular, we identified 12 experimentally-verified [5] or theoretically-predicted Weyl semimetals [80] that are labeled as trivial in the TQC database, 9 of which we correctly predict as topological using our NN classifier (Table 2). Thus, the potential presence of topological singularities not considered in the TQC formalism might account for some loss of precision in the classification of topological examples. In addition, we summarize in Supplementary Table S1 the top 100 predicted topological materials from a collection of 459 samples not represented in the TQC database. These are the top candidates predicted by our model that may contain topological singularities. We do note that the success of the NN classifier can be attributed significantly to the presence of particular elements; further work is being pursued to more accurately decouple this contribution from that of more subtle variations in the XAS spectral features for a given absorbing element.
V Conclusion
We explored the predictive power of XAS as a potential discriminant of topological character by training and evaluating a NN classifier on more than examples of computed XANES spectra [72] labeled according to the largest catalogue of topological materials [27, 34]. A number of important extensions are envisioned for this work, such as its application to experimental XANES data, incorporation of a multi-fidelity approach to favor experimentally validated examples [81], expansion of the energy range to the extended X-ray absorption fine structure (EXAFS) regime, and inquiry into the detailed contribution from spectral features for individual elements. The theoretical connection between band topology and the local chemical environment encoded in XANES spectra has not yet been established, and we envision data-driven methods as a possible tool in aiding this theoretical development. Our current results demonstrate a promising pathway to develop robust experimental protocols for high-throughput screening of candidate topological materials aided by machine learning methods. Additionally, the flexibility of the XAS sample environment can further enable the study of materials whose topological phases emerge when driven by electric, magnetic, or strain fields, and even presents the opportunity to study topology with strong disorder and topology in amorphous materials [82, 83]. Thus, machine learning-empowered XAS may be poised to become a simple but powerful experimental tool for topological classification.
VI Methods
Data processing
The computed XANES spectra of each absorbing atom were interpolated and re-sampled at evenly-spaced energy values. Each XANES spectrum spanned an energy range of eV, and spectra from the same absorbing atom were co-aligned using the calculated absolute energy scale. Spectra of the same absorbing atom were standardized by centering the mean of the average intensities over the sampled energy range, and scaling by the mean of the standard deviations in intensity values.
Machine learning
Principal component analysis and SVM model implementation and training were carried out using the scikit-learn Python library [84]. The NN models presented in this work were implemented in Python using the PyTorch [85] and PyTorch Geometric [86] libraries. The atom-type embeddings were obtained using a single fully-connected layer with 93 input and output neurons. The spectral embeddings of the original 200-feature spectra were obtained using a series of two fully-connected layers with 256 and 64 output neurons, respectively, each followed by a dropout layer with a rate of 0.5 and a rectified linear unit (ReLU) activation. The composite embedded features had dimensions of 5952 and were passed to a second series of two fully-connected layers with 256 and 64 output neurons, respectively, each followed by a dropout layer with a rate of 0.5 and a ReLU activation. A final, sigmoid-activated, fully-connected layer was then used to output the scalar prediction. The models were trained on a Quadro RTX 6000 graphics processing unit (GPU) with of random access memory (RAM). Optimization was performed using the Adam optimizer to minimize the binary cross-entropy loss.
Sample preparation.
NbAs and CdTe crystals were grown using chemical vapor transport while LaAlGe, CdGeYb, Cd3As2, Zn3As2 and MoSe2 crystals were grown using the flux method as described in literature. The samples exhibited clear, lustrous surfaces with demarcated straight edges indicating the orientation of the crystal axes. The samples were not polished.
X-ray absorption spectroscopy
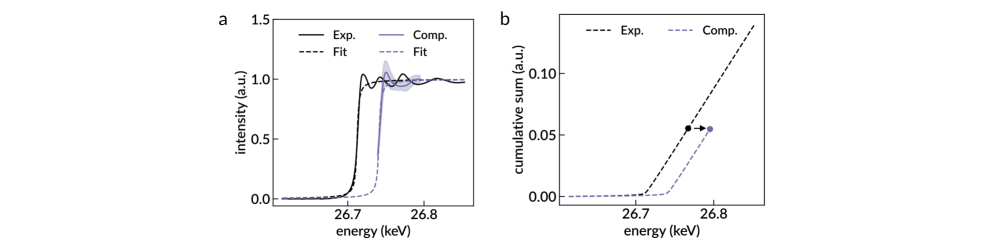
XAS experiments were performed at the 4-ID-D beamline of the Advanced Photon Source, Argonne National Laboratory. The X-ray energy was selected using a Si (111) double crystal monochromator, which was detuned to reject harmonics. Measurements were recorded near the K absorption edge for each element. For absorption edges below 23 keV, a Pd mirror was employed to further reject harmonics. Measurements were done at room temperature and in transmission mode using N2 and Ar filled ion chambers to detect both incident and transmitted intensities, respectively. Prior to making predictions, experimental spectra were pre-processed as follows. First, a linear background was fit to the pre-edge region and subtracted. The resulting spectra were fit with an arctangent function of the form with fitting parameters and measured energies , and subsequently scaled by . This ensured that experimental intensities were scaled consistently with computational ones, which are 0 at energies well below the absorption edge and approach 1 at energies well above the absorption edge. Finally, the experimental spectra were shifted in energy so that the area under the fitted arctangent matched that of the arctangent fit to the average computational spectrum for each absorbing atom. Examples of these pre-processing steps are shown in Figure S10 of the Supplemental Material. Finally, experimental spectra were interpolated and scaled according to the means and standard deviations of the computational spectra as described in the Data processing section.
Acknowledgements.
N.A. acknowledges National Science Foundation GRFP support under Grant No. 1122374. J.A. acknowledges National Science Foundation GRFP support under Grant No. DGE-1745303. N.A. and M.L. acknowledge the support from the U.S. Department of Energy (DOE), Office of Science (SC), Basic Energy Sciences (BES), Award No. DE-SC0021940. F.H., T.N. and M.L. acknowledge the support from the DOE Award No. DE-SC0020148. M.L. is partially supported by NSF DMR-2118448, the Norman C. Rasmussen Career Development Chair, and the Class of 1947 Career Development Chair, and acknowledges the support from Dr. R. Wachnik. B.A.B. and N.R. gratefully acknowledge financial support from the Schmidt DataX Fund at Princeton University made possible through a major gift from the Schmidt Futures Foundation, NSF-MRSEC Grant No. DMR-2011750 and the European Research Council (ERC) under the European Union’s Horizon 2020 research and innovation program (Grant Agreement No. 101020833). C.H.R. was partially supported by the Applied Mathematics Program of the U.S. DOE Office of Science Advanced Scientific Computing Research under Contract No. DE-AC02-05CH11231. Work performed at the Center for Nanoscale Materials, a U.S. Department of Energy Office of Science User Facility, was supported by the U.S. DOE, Office of Basic Energy Sciences, under Contract No. DE-AC02-06CH11357. This material is based, in part, upon work supported by Laboratory Directed Research and Development (LDRD) funding from Argonne National Laboratory, provided by the Director, Office of Science, of the U.S. Department of Energy under Contract No. DE-AC02-06CH11357. This research used resources of the Advanced Photon Source, a U.S. Department of Energy (DOE) Office of Science User Facility operated for the DOE Office of Science by Argonne National Laboratory under Contract No. DE-AC02-06CH11357.Competing interests The authors declare no competing interests.
Additional information
Supplemental Material is available for this paper.
Correspondence and requests for materials should be addressed
to Nina Andrejevic (nandrejevic@anl.gov), Mingda Li (mingda@mit.edu), or Chris H. Rycroft (chr@math.wisc.edu).
Data availability All the data and code supporting the findings are available from the corresponding authors upon reasonable request.
References
- Hasan and Kane [2010] M. Z. Hasan and C. L. Kane, Colloquium: Topological insulators, Rev. Mod. Phys. 82, 3045 (2010).
- Qi and Zhang [2011] X.-L. Qi and S.-C. Zhang, Topological insulators and superconductors, Rev. Mod. Phys. 83, 1057 (2011).
- Yan and Zhang [2012] B. Yan and S.-C. Zhang, Topological materials, Reports on Progress in Physics 75, 096501 (2012).
- Bansil et al. [2016] A. Bansil, H. Lin, and T. Das, Colloquium: Topological band theory, Rev. Mod. Phys. 88, 021004 (2016).
- Yan and Felser [2017] B. Yan and C. Felser, Topological materials: Weyl semimetals, Annual Review of Condensed Matter Physics 8, 337 (2017).
- Armitage et al. [2018] N. P. Armitage, E. J. Mele, and A. Vishwanath, Weyl and Dirac semimetals in three-dimensional solids, Rev. Mod. Phys. 90, 015001 (2018).
- Bradlyn et al. [2017] B. Bradlyn, L. Elcoro, J. Cano, M. Vergniory, Z. Wang, C. Felser, M. Aroyo, and B. A. Bernevig, Topological quantum chemistry, Nature 547, 298 (2017).
- Kruthoff et al. [2017] J. Kruthoff, J. De Boer, J. Van Wezel, C. L. Kane, and R.-J. Slager, Topological classification of crystalline insulators through band structure combinatorics, Physical Review X 7, 041069 (2017).
- Cano et al. [2018] J. Cano, B. Bradlyn, Z. Wang, L. Elcoro, M. Vergniory, C. Felser, M. Aroyo, and B. A. Bernevig, Building blocks of topological quantum chemistry: Elementary band representations, Physical Review B 97, 035139 (2018).
- Elcoro et al. [2020] L. Elcoro, Z. Song, and B. A. Bernevig, Application of induction procedure and smith decomposition in calculation and topological classification of electronic band structures in the 230 space groups, Physical Review B 102, 035110 (2020).
- Wieder et al. [2022] B. J. Wieder, B. Bradlyn, J. Cano, Z. Wang, M. G. Vergniory, L. Elcoro, A. A. Soluyanov, C. Felser, T. Neupert, N. Regnault, and B. A. Bernevig, Topological materials discovery from crystal symmetry, Nature Reviews Materials 7, 196 (2022).
- Bouhon et al. [2021] A. Bouhon, G. F. Lange, and R.-J. Slager, Topological correspondence between magnetic space group representations and subdimensions, Physical Review B 103, 245127 (2021).
- Călugăru et al. [2022] D. Călugăru, A. Chew, L. Elcoro, Y. Xu, N. Regnault, Z.-D. Song, and B. A. Bernevig, General construction and topological classification of crystalline flat bands, Nature Physics 18, 185 (2022).
- Slager et al. [2013] R.-J. Slager, A. Mesaros, V. Juričić, and J. Zaanen, The space group classification of topological band-insulators, Nature Physics 9, 98 (2013).
- Jadaun et al. [2013] P. Jadaun, D. Xiao, Q. Niu, and S. K. Banerjee, Topological classification of crystalline insulators with space group symmetry, Physical Review B 88, 085110 (2013).
- Chiu et al. [2016] C.-K. Chiu, J. C. Teo, A. P. Schnyder, and S. Ryu, Classification of topological quantum matter with symmetries, Reviews of Modern Physics 88, 035005 (2016).
- Po et al. [2017] H. C. Po, A. Vishwanath, and H. Watanabe, Symmetry-based indicators of band topology in the 230 space groups, Nature Communications 8, 1 (2017).
- Song et al. [2018] Z. Song, T. Zhang, Z. Fang, and C. Fang, Quantitative mappings between symmetry and topology in solids, Nature Communications 9, 1 (2018).
- Song et al. [2019] Z. Song, S.-J. Huang, Y. Qi, C. Fang, and M. Hermele, Topological states from topological crystals, Science Advances 5, eaax2007 (2019).
- Po [2020] H. C. Po, Symmetry indicators of band topology, Journal of Physics: Condensed Matter 32, 263001 (2020).
- Peng et al. [2022] B. Peng, Y. Jiang, Z. Fang, H. Weng, and C. Fang, Topological classification and diagnosis in magnetically ordered electronic materials, Physical Review B 105, 235138 (2022).
- Chen et al. [2018] R. Chen, H. C. Po, J. B. Neaton, and A. Vishwanath, Topological materials discovery using electron filling constraints, Nature Physics 14, 55 (2018).
- Watanabe et al. [2018] H. Watanabe, H. C. Po, and A. Vishwanath, Structure and topology of band structures in the 1651 magnetic space groups, Science Advances 4, eaat8685 (2018).
- Choudhary et al. [2019] K. Choudhary, K. F. Garrity, and F. Tavazza, High-throughput discovery of topologically non-trivial materials using spin-orbit spillage, Scientific Reports 9, 1 (2019).
- Choudhary et al. [2020] K. Choudhary, K. F. Garrity, J. Jiang, R. Pachter, and F. Tavazza, Computational search for magnetic and non-magnetic 2d topological materials using unified spin-orbit spillage screening, NPJ Computational Materials 6, 1 (2020).
- Choudhary et al. [2021] K. Choudhary, K. F. Garrity, N. J. Ghimire, N. Anand, and F. Tavazza, High-throughput search for magnetic topological materials using spin-orbit spillage, machine learning, and experiments, Physical Review B 103, 155131 (2021).
- Vergniory et al. [2019] M. Vergniory, L. Elcoro, C. Felser, N. Regnault, B. A. Bernevig, and Z. Wang, A complete catalogue of high-quality topological materials, Nature 566, 480 (2019).
- Zhang et al. [2019a] T. Zhang, Y. Jiang, Z. Song, H. Huang, Y. He, Z. Fang, H. Weng, and C. Fang, Catalogue of topological electronic materials, Nature 566, 475 (2019a).
- Tang et al. [2019a] F. Tang, H. C. Po, A. Vishwanath, and X. Wan, Comprehensive search for topological materials using symmetry indicators, Nature 566, 486 (2019a).
- Tang et al. [2019b] F. Tang, H. C. Po, A. Vishwanath, and X. Wan, Topological materials discovery by large-order symmetry indicators, Science Advances 5, eaau8725 (2019b).
- Tang et al. [2019c] F. Tang, H. C. Po, A. Vishwanath, and X. Wan, Efficient topological materials discovery using symmetry indicators, Nature Physics 15, 470 (2019c).
- Wang et al. [2019] D. Wang, F. Tang, J. Ji, W. Zhang, A. Vishwanath, H. C. Po, and X. Wan, Two-dimensional topological materials discovery by symmetry-indicator method, Physical Review B 100, 195108 (2019).
- Xu et al. [2020a] Y. Xu, L. Elcoro, Z.-D. Song, B. J. Wieder, M. Vergniory, N. Regnault, Y. Chen, C. Felser, and B. A. Bernevig, High-throughput calculations of magnetic topological materials, Nature 586, 702 (2020a).
- Vergniory et al. [2022] M. G. Vergniory, B. J. Wieder, L. Elcoro, S. S. Parkin, C. Felser, B. A. Bernevig, and N. Regnault, All topological bands of all nonmagnetic stoichiometric materials, Science 376, eabg9094 (2022).
- Suga and Sekiyama [2013] S. Suga and A. Sekiyama, Photoelectron Spectroscopy: Bulk and Surface Electronic Structures, Vol. 176 (Springer, 2013).
- Lv et al. [2019] B. Lv, T. Qian, and H. Ding, Angle-resolved photoemission spectroscopy and its application to topological materials, Nature Reviews Physics 1, 609 (2019).
- Raccuglia et al. [2016] P. Raccuglia, K. C. Elbert, P. D. Adler, C. Falk, M. B. Wenny, A. Mollo, M. Zeller, S. A. Friedler, J. Schrier, and A. J. Norquist, Machine-learning-assisted materials discovery using failed experiments, Nature 533, 73 (2016).
- Liu et al. [2017] Y. Liu, T. Zhao, W. Ju, and S. Shi, Materials discovery and design using machine learning, Journal of Materiomics 3, 159 (2017).
- Gómez-Bombarelli et al. [2018] R. Gómez-Bombarelli, J. N. Wei, D. Duvenaud, J. M. Hernández-Lobato, B. Sánchez-Lengeling, D. Sheberla, J. Aguilera-Iparraguirre, T. D. Hirzel, R. P. Adams, and A. Aspuru-Guzik, Automatic chemical design using a data-driven continuous representation of molecules, ACS Central Science 4, 268 (2018).
- Zhang et al. [2018a] H. Zhang, K. Hippalgaonkar, T. Buonassisi, O. M. Løvvik, E. Sagvolden, and D. Ding, Machine learning for novel thermal-materials discovery: Early successes, opportunities, and challenges, ES Energy & Environment 2, 1 (2018a).
- Mikulskis et al. [2019] P. Mikulskis, M. R. Alexander, and D. A. Winkler, Toward interpretable machine learning models for materials discovery, Advanced Intelligent Systems 1, 1900045 (2019).
- Juan et al. [2020] Y. Juan, Y. Dai, Y. Yang, and J. Zhang, Accelerating materials discovery using machine learning, Journal of Materials Science & Technology (2020).
- Kusne et al. [2020] A. G. Kusne, H. Yu, C. Wu, H. Zhang, J. Hattrick-Simpers, B. DeCost, S. Sarker, C. Oses, C. Toher, S. Curtarolo, A. V. Davydov, R. Agarwal, L. A. Bendersky, M. Li, A. Mehta, and I. Takeuchi, On-the-fly closed-loop materials discovery via bayesian active learning, Nature Communications 11, 1 (2020).
- Mannodi-Kanakkithodi and Chan [2021] A. Mannodi-Kanakkithodi and M. K. Chan, Computational data-driven materials discovery, Trends in Chemistry (2021).
- Pilania et al. [2013] G. Pilania, C. Wang, X. Jiang, S. Rajasekaran, and R. Ramprasad, Accelerating materials property predictions using machine learning, Scientific reports 3, 1 (2013).
- Ward et al. [2016] L. Ward, A. Agrawal, A. Choudhary, and C. Wolverton, A general-purpose machine learning framework for predicting properties of inorganic materials, npj Computational Materials 2, 16028 (2016).
- Carrete et al. [2014] J. Carrete, W. Li, N. Mingo, S. Wang, and S. Curtarolo, Finding unprecedentedly low-thermal-conductivity half-heusler semiconductors via high-throughput materials modeling, Physical Review X 4, 011019 (2014).
- Claussen et al. [2020] N. Claussen, B. A. Bernevig, and N. Regnault, Detection of topological materials with machine learning, Physical Review B 101, 245117 (2020).
- Rodriguez-Nieva and Scheurer [2019] J. F. Rodriguez-Nieva and M. S. Scheurer, Identifying topological order through unsupervised machine learning, Nature Physics 15, 790 (2019).
- Ma et al. [2022] A. Ma, Y. Zhang, T. Christensen, H. C. Po, L. Jing, L. Fu, and M. Soljačić, Topogivity: A machine-learned chemical rule for discovering topological materials, arXiv preprint arXiv:2202.05255 (2022).
- Zhang and Kim [2017] Y. Zhang and E.-A. Kim, Quantum loop topography for machine learning, Phys. Rev. Lett. 118, 216401 (2017).
- Lian et al. [2019] W. Lian, S.-T. Wang, S. Lu, Y. Huang, F. Wang, X. Yuan, W. Zhang, X. Ouyang, X. Wang, X. Huang, L. He, X. Chang, D.-L. Deng, and L. Duan, Machine learning topological phases with a solid-state quantum simulator, Phys. Rev. Lett. 122, 210503 (2019).
- Scheurer and Slager [2020] M. S. Scheurer and R.-J. Slager, Unsupervised machine learning and band topology, Physical Review Letters 124, 226401 (2020).
- Zhang et al. [2018b] P. Zhang, H. Shen, and H. Zhai, Machine learning topological invariants with neural networks, Physical review letters 120, 066401 (2018b).
- Carleo et al. [2019] G. Carleo, I. Cirac, K. Cranmer, L. Daudet, M. Schuld, N. Tishby, L. Vogt-Maranto, and L. Zdeborová, Machine learning and the physical sciences, Rev. Mod. Phys. 91, 045002 (2019).
- Carbone et al. [2019] M. R. Carbone, S. Yoo, M. Topsakal, and D. Lu, Classification of local chemical environments from X-ray absorption spectra using supervised machine learning, Phys. Rev. Materials 3, 033604 (2019).
- Cui et al. [2019] A. Cui, K. Jiang, M. Jiang, L. Shang, L. Zhu, Z. Hu, G. Xu, and J. Chu, Decoding phases of matter by machine-learning Raman spectroscopy, Phys. Rev. Applied 12, 054049 (2019).
- Han et al. [2020] B. Han, Y. Lin, Y. Yang, N. Mao, W. Li, H. Wang, K. Yasuda, X. Wang, V. Fatemi, L. Zhou, J. I.-J. Wang, Q. Ma, Y. Cao, D. Rodan-Legrain, Y.-Q. Bie, E. Navarro-Moratalla, D. Klein, D. MacNeill, S. Wu, H. Kitadai, X. Ling, P. Jarillo-Herrero, J. Kong, J. Yin, and T. Palacios, Deep-learning-enabled fast optical identification and characterization of 2d materials, Advanced Materials 32, 2000953 (2020).
- Samarakoon et al. [2020] A. M. Samarakoon, K. Barros, Y. W. Li, M. Eisenbach, Q. Zhang, F. Ye, V. Sharma, Z. Dun, H. Zhou, S. A. Grigera, C. D. Batista, and D. A. Tennant, Machine-learning-assisted insight into spin ice dy2ti2o7, Nature Communications 11, 1 (2020).
- Zhang et al. [2019b] Y. Zhang, A. Mesaros, K. Fujita, S. Edkins, M. Hamidian, K. Ch’ng, H. Eisaki, S. Uchida, J. S. Davis, E. Khatami, and E.-A. Kim, Machine learning in electronic-quantum-matter imaging experiments, Nature 570, 484 (2019b).
- Rem et al. [2019] B. S. Rem, N. Käming, M. Tarnowski, L. Asteria, N. Fläschner, C. Becker, K. Sengstock, and C. Weitenberg, Identifying quantum phase transitions using artificial neural networks on experimental data, Nature Physics 15, 917 (2019).
- Newville [2014] M. Newville, Fundamentals of xafs, Reviews in Mineralogy and Geochemistry 78, 33 (2014).
- Gaur and Shrivastava [2015] A. Gaur and B. Shrivastava, Speciation using x-ray absorption fine structure (xafs), Review Journal of Chemistry 5, 361 (2015).
- Torrisi et al. [2020] S. B. Torrisi, M. R. Carbone, B. A. Rohr, J. H. Montoya, Y. Ha, J. Yano, S. K. Suram, and L. Hung, Random forest machine learning models for interpretable x-ray absorption near-edge structure spectrum-property relationships, npj Computational Materials 6, 1 (2020).
- Zheng et al. [2020] C. Zheng, C. Chen, Y. Chen, and S. P. Ong, Random forest models for accurate identification of coordination environments from x-ray absorption near-edge structure, Patterns 1, 100013 (2020).
- Kiyohara et al. [2018] S. Kiyohara, T. Miyata, K. Tsuda, and T. Mizoguchi, Data-driven approach for the prediction and interpretation of core-electron loss spectroscopy, Scientific reports 8, 1 (2018).
- Guda et al. [2021] A. Guda, S. Guda, A. Martini, A. Kravtsova, A. Algasov, A. Bugaev, S. Kubrin, L. Guda, P. Šot, J. van Bokhoven, C. Copéret, and A. Soldatov, Understanding x-ray absorption spectra by means of descriptors and machine learning algorithms, npj Computational Materials 7, 1 (2021).
- Suzuki et al. [2019] Y. Suzuki, H. Hino, M. Kotsugi, and K. Ono, Automated estimation of materials parameter from x-ray absorption and electron energy-loss spectra with similarity measures, Npj Computational Materials 5, 1 (2019).
- Carbone et al. [2020] M. R. Carbone, M. Topsakal, D. Lu, and S. Yoo, Machine-learning x-ray absorption spectra to quantitative accuracy, Physical review letters 124, 156401 (2020).
- Rankine et al. [2020] C. D. Rankine, M. M. Madkhali, and T. J. Penfold, A deep neural network for the rapid prediction of x-ray absorption spectra, The Journal of Physical Chemistry A 124, 4263 (2020).
- Lüder [2021] J. Lüder, Determining electronic properties from -edge x-ray absorption spectra of transition metal compounds with artificial neural networks, Physical Review B 103, 045140 (2021).
- Mathew et al. [2018] K. Mathew, C. Zheng, D. Winston, C. Chen, A. Dozier, J. J. Rehr, S. P. Ong, and K. A. Persson, High-throughput computational X-ray absorption spectroscopy, Scientific data 5, 180151 (2018).
- Jain et al. [2013] A. Jain, S. P. Ong, G. Hautier, W. Chen, W. D. Richards, S. Dacek, S. Cholia, D. Gunter, D. Skinner, G. Ceder, and K. a. Persson, The Materials Project: A materials genome approach to accelerating materials innovation, APL Materials 1, 011002 (2013).
- Zheng et al. [2018] C. Zheng, K. Mathew, C. Chen, Y. Chen, H. Tang, A. Dozier, J. J. Kas, F. D. Vila, J. J. Rehr, L. F. J. Piper, K. A. Persson, and S. P. Ong, Automated generation and ensemble-learned matching of X-ray absorption spectra, npj Computational Materials 4, 12 (2018), https://doi.org/10.1038/s41524-018-0067-x .
- Ong et al. [2013] S. P. Ong, W. D. Richards, A. Jain, G. Hautier, M. Kocher, S. Cholia, D. Gunter, V. L. Chevrier, K. A. Persson, and G. Ceder, Python Materials Genomics (pymatgen): A robust, open-source python library for materials analysis, Computational Materials Science 68, 314 (2013).
- Ong et al. [2015] S. P. Ong, S. Cholia, A. Jain, M. Brafman, D. Gunter, G. Ceder, and K. A. Persson, The Materials Application Programming Interface (API): A simple, flexible and efficient API for materials data based on REpresentational State Transfer (REST) principles, Computational Materials Science 97, 209 (2015).
- Rehr et al. [2010] J. J. Rehr, J. J. Kas, F. D. Vila, M. P. Prange, and K. Jorissen, Parameter-free calculations of X-ray spectra with FEFF9, Physical Chemistry Chemical Physics 12, 5503 (2010).
- Bergerhoff et al. [1987] G. Bergerhoff, I. Brown, and F. Allen, Crystallographic Databases., International Union of Crystallography (1987).
- Penner-Hahn [2003] J. E. Penner-Hahn, X-ray absorption spectroscopy, Comprehensive Coordination Chemistry II 2, 159 (2003).
- Xu et al. [2020b] Q. Xu, Y. Zhang, K. Koepernik, W. Shi, J. van den Brink, C. Felser, and Y. Sun, Comprehensive scan for nonmagnetic weyl semimetals with nonlinear optical response, npj Computational Materials 6, 1 (2020b).
- Meng and Karniadakis [2020] X. Meng and G. E. Karniadakis, A composite neural network that learns from multi-fidelity data: Application to function approximation and inverse PDE problems, Journal of Computational Physics 401, 109020 (2020).
- Agarwala and Shenoy [2017] A. Agarwala and V. B. Shenoy, Topological insulators in amorphous systems, Phys. Rev. Lett. 118, 236402 (2017).
- Prodan [2011] E. Prodan, Disordered topological insulators: a non-commutative geometry perspective, Journal of Physics A: Mathematical and Theoretical 44, 113001 (2011).
- Pedregosa et al. [2011] F. Pedregosa, G. Varoquaux, A. Gramfort, V. Michel, B. Thirion, O. Grisel, M. Blondel, P. Prettenhofer, R. Weiss, V. Dubourg, J. Vanderplas, A. Passos, D. Cournapeau, M. Brucher, M. Perrot, and E. Duchesnay, Scikit-learn: Machine learning in Python, Journal of Machine Learning Research 12, 2825 (2011).
- Paszke et al. [2019] A. Paszke, S. Gross, F. Massa, A. Lerer, J. Bradbury, G. Chanan, T. Killeen, Z. Lin, N. Gimelshein, L. Antiga, A. Desmaison, A. Kopf, E. Yang, Z. DeVito, M. Raison, A. Tejani, S. Chilamkurthy, B. Steiner, L. Fang, J. Bai, and S. Chintala, Pytorch: An imperative style, high-performance deep learning library, in Advances in Neural Information Processing Systems 32, edited by H. Wallach, H. Larochelle, A. Beygelzimer, F. d'Alché-Buc, E. Fox, and R. Garnett (Curran Associates, Inc., 2019) pp. 8024–8035.
- Fey and Lenssen [2019] M. Fey and J. E. Lenssen, Fast graph representation learning with PyTorch Geometric, in ICLR Workshop on Representation Learning on Graphs and Manifolds (2019).
Supplemental material for “Machine learning spectral indicators of topology”
Nina Andrejevic,1,2,3,∗ Jovana Andrejevic,4,5,∗ B. Andrei Bernevig,6,7,8
Nicolas Regnault,6 Fei Han,2,9
Gilberto Fabbris,10 Thanh Nguyen,2,9 Nathan C. Drucker,2,5 Chris H. Rycroft,11,5,12,† and Mingda Li 2,9,‡
1Center for Nanoscale Materials, Argonne National Laboratory, Lemont, IL 60439, USA
2Quantum Measurement Group, Massachusetts Institute of Technology, Cambridge, MA 02139, USA
3Department of Materials Science and Engineering,
Massachusetts Institute of Technology, Cambridge, MA 02139, USA
4Department of Physics, University of Pennsylvania, Philadelphia, PA 19104, USA
5John A. Paulson School of Engineering and Applied Sciences,
Harvard University, Cambridge, MA 02138, USA
6Department of Physics, Princeton University, Princeton, NJ 08544, USA
7Donostia International Physics Center, P. Manuel de Lardizabal 4, 20018 Donostia-San Sebastian, Spain
8IKERBASQUE, Basque Foundation for Science, Bilbao, Spain
9Department of Nuclear Science and Engineering,
Massachusetts Institute of Technology, Cambridge, MA 02139, USA
10Advanced Photon Source, Argonne National Laboratory, Lemont, IL 60439, USA
11Department of Mathematics, University of Wisconsin-Madison, Madison, WI 53706, USA
12Computational Research Division, Lawrence Berkeley Laboratory, Berkeley, CA 94720, USA
| Formula | SG | ICSD | mp-ID |
|---|---|---|---|
| Cr8 B8 Ir4 | 63 | 418162 | mp-569911 |
| Ta4 Pt12 | 11 | 105804 | mp-567638 |
| Sc4 Mn2 B4 Rh10 | 127 | 51436 | mp-542022 |
| Sc3 Al1 C1 | 221 | 50161 | mp-4079 |
| Zr2 Fe12 P7 | 174 | 25757 | mp-540809 |
| Hf18 V8 S2 | 194 | 81822 | mp-17105 |
| In2 Ni21 B6 | 225 | 380216 | mp-21551 |
| V4 Sn8 | 70 | 106551 | mp-20887 |
| Ba6 Al6 Ga4 | 194 | 415931 | mp-569218 |
| Y3 In1 C1 | 221 | 80955 | mp-19817 |
| B8 Rh10 | 194 | 86395 | mp-567926 |
| Mn1 Ga1 Ni2 | 225 | 188992 | mp-20228 |
| Ga18 Rh4 | 7 | 414305 | mp-31312 |
| Ti1 Se2 | 164 | 80091 | mp-2194 |
| Sc2 | 194 | 164088 | mp-67 |
| Mg8 Cu4 | 70 | 174176 | mp-2481 |
| Mg2 Cu4 | 227 | 46007 | mp-1038 |
| Cu1 Sn1 F6 | 2 | 36514 | mp-4701 |
| Hg10 Au12 | 193 | 58475 | mp-1812 |
| Mn6 As4 | 12 | 75510 | mp-28916 |
| Mn12 As8 | 36 | 73251 | mp-568856 |
| Zr1 B12 | 225 | 409635 | mp-1084 |
| Y12 Co8 | 58 | 1844 | mp-616512 |
| Mo8 C4 | 60 | 246146 | mp-1552 |
| Mn1 Sb2 F12 | 2 | 411522 | mp-555052 |
| Zr4 Co2 P2 | 11 | 84825 | mp-29152 |
| Ba8 Mn4 Se12 | 62 | 26230 | mp-18513 |
| Sc6 Si7 Ni16 | 225 | 159262 | mp-5382 |
| Nb1 S2 | 42 | 72725 | mp-2648 |
| Ti6 Ni8 | 148 | 166371 | mp-567653 |
| Ba2 Ca1 Tl2 Cu2 O8 | 123 | 68198 | mp-573069 |
| Ti2 Ni2 | 11 | 164155 | mp-1048 |
| Rb8 Co4 Br16 | 62 | 280362 | mp-23366 |
| Ba6 Pb10 | 63 | 165184 | mp-630923 |
| Sc8 N2 Cl12 | 55 | 201978 | mp-23414 |
| Mn1 Hg1 C4 S4 N4 | 82 | 87889 | mp-541914 |
| Sc4 Si4 Cu4 | 62 | 86391 | mp-20083 |
| Sc7 B1 Cl12 | 148 | 201975 | mp-505489 |
| Ba2 Cd4 | 74 | 260668 | mp-11266 |
| Ba1 Ni2 As2 | 139 | 164197 | mp-568280 |
| Ni16 B12 | 62 | 24307 | mp-640067 |
| Sc8 Te12 | 70 | 171145 | mp-12383 |
| Hf6 Ni14 | 2 | 2417 | mp-27166 |
| Mn2 Cr2 F10 | 15 | 939 | mp-555156 |
| Y4 Ge10 Ru6 | 72 | 86498 | mp-620812 |
| Mn2 Se4 O10 | 15 | 73936 | mp-19175 |
| Mo4 P4 Ru4 | 62 | 98405 | mp-22451 |
| Mg2 Pd6 | 139 | 150228 | mp-12742 |
| Ba6 Sn10 | 63 | 167166 | mp-18636 |
| Y1 B2 Ir3 | 12 | 99236 | mp-31098 |
| Formula | SG | ICSD | mp-ID |
|---|---|---|---|
| Ba2 Cu2 Te4 O14 | 40 | 404297 | mp-557735 |
| Mg3 Ni9 B6 | 181 | 156018 | mp-571428 |
| V3 Se4 | 12 | 84195 | mp-22700 |
| Ti4 Cu2 S8 | 227 | 35269 | mp-3951 |
| Ba4 Fe8 Se12 | 62 | 16308 | mp-504563 |
| Cd20 Cu8 | 194 | 58958 | mp-30696 |
| Mg7 Ti1 H16 | 225 | 152886 | mp-644281 |
| Ba6 Na2 Ir4 O18 | 194 | 413452 | mp-21876 |
| K1 Cr5 S8 | 12 | 2568 | mp-12178 |
| Nb6 Sn2 S12 | 182 | 83038 | mp-9407 |
| K8 Co4 Cl16 | 14 | 661 | mp-571314 |
| Sc12 P8 | 62 | 41678 | mp-22600 |
| Co2 Te4 | 58 | 86115 | mp-9945 |
| Sc12 P8 | 62 | 41679 | mp-21182 |
| Ba1 Fe2 P2 | 139 | 10468 | mp-4883 |
| Mn2 H4 Se2 O10 | 15 | 66746 | mp-643412 |
| Rb2 Fe4 S6 | 63 | 99505 | mp-3787 |
| V2 P2 | 194 | 42444 | mp-1114 |
| Y8 C14 | 14 | 86049 | mp-9530 |
| Nb4 Sn8 | 70 | 106552 | mp-1046 |
| Ni3 S2 | 155 | 23114 | mp-362 |
| Ba6 Ca2 Ir4 O18 | 15 | 245253 | mp-17448 |
| Sr8 In8 | 43 | 414234 | mp-655461 |
| Mn4 Ga8 Te16 | 62 | 67402 | mp-653120 |
| Ba2 | 165 | 280680 | mp-1008283 |
| Sn16 Pd8 | 142 | 413281 | mp-1573 |
| Ta6 Pb2 S12 | 182 | 83037 | mp-20784 |
| Ba6 Fe6 Se14 | 186 | 16310 | mp-567429 |
| K12 Co2 S8 | 186 | 68603 | mp-14794 |
| Ca4 Pb2 Au4 | 127 | 409531 | mp-20723 |
| Tl1 Cr5 S8 | 12 | 40821 | mp-541823 |
| Mn1 Ga2 Se4 | 82 | 85674 | mp-20261 |
| K4 Mn6 S8 | 13 | 411172 | mp-29861 |
| Sn12 Pd4 | 64 | 413279 | mp-1371 |
| Fe2 Te4 | 58 | 86518 | mp-19880 |
| K2 Mn2 F6 | 11 | 89343 | mp-644332 |
| Cs4 Co2 Si2 O8 | 36 | 93878 | mp-542168 |
| Zn10 B6 Rh14 | 51 | 107495 | mp-510697 |
| Ni3 Sn1 | 221 | 181127 | mp-11522 |
| Cu1 H8 C6 N6 O2 | 2 | 156682 | mp-583429 |
| Fe10 C4 | 2 | 181367 | mp-645339 |
| Mg6 Si16 Ir6 | 216 | 416868 | mp-569313 |
| Ba5 V5 O14 | 164 | 78163 | mp-19088 |
| V4 O6 | 167 | 1473 | mp-18937 |
| Y4 Ge10 Ir6 | 72 | 86503 | mp-541609 |
| Co2 C8 N12 | 58 | 85618 | mp-22403 |
| K12 Co2 Se8 | 186 | 68605 | mp-14795 |
| Ag8 F20 | 2 | 95832 | mp-542298 |
| K12 Mn2 S8 | 186 | 65448 | mp-18244 |
| Ga10 Fe12 | 12 | 2146 | mp-570920 |