The disk of 2MASS 15491331-3539118 = GQ Lup C as seen by HST and WISE††thanks: Based on observations made with the NASA/ESA Hubble Space Telescope, obtained from the data archive at the Space Telescope Science Institute. STScI is operated by the Association of Universities for Research in Astronomy, Inc. under NASA contract NAS 5-26555
Abstract
Aims. Very recently, a second companion on wider orbit has been discovered around GQ Lup. This is a low-mass accreting star partially obscured by a disk seen at high inclination. If detected, this disk may be compared to the known disk around the primary.
Methods. We detected this disk on archive HST and WISE data.
Results. The extended spectral energy distribution provided by these data confirms the presence of accretion from H emission and UV excess, and shows an IR excess attributable to a warm disk. In addition, we resolved the disk on the HST images. This is found to be roughly aligned with the disk of the primary. Both of them are roughly aligned with the Lupus I dust filament containing GQ Lup.
Key Words.:
stars: individual: GQ Lup - stars: individual: 2MASS~15491331-3539118 - techniques: high angular resolution - protoplanetary disks1 Introduction
Alcalá et al. (2020) (hereinafter Paper I) recently found a probable second companion on wider orbit (2MASS 15491331-3539118; projected separation 2400 au) to the very young star GQ Lup using Gaia DR2 data (Gaia Collaboration et al., 2018), that also has a closer Brown Dwarf (BD) companion (projected separation 100 au). Paper I found that GQ Lup C is accreting; their data strongly suggests that it may be surrounded by a disk seen nearly edge-on that attenuates the star light, while possibly leaving unperturbed emission by an outflow. However, the disk could not be detected from the spectral energy distribution (SED) considered in that paper, that only extends up to the K-band. The purpose of this paper is to find further evidences for this disk. We found that this can be obtained both extending the spectral range, by considering observations acquired with WISE, and using high spatial resolution images such as those provided by HST. On the other side, GQ Lup C is too far from the primary to have been observed with the previous survey with ALMA.
2 Archival data
2.1 HST data
Images of the region around GQ Lup in nine different bands were obtained with the Hubble Space Telescope (HST) Wide Field Camera 3 (WFC3) (Proposal 12507: Kraus et al.) at epoch 2012.15. These images include GQ Lup C. We retrieved them using the MAST archive interface (https://archive.stsci.edu/hst/) in order both to extend the SED to the UV and to exploit the high space resolution to possibly resolve the disk. We also retrieved HST NICMOS images but GQ Lup C resulted to be outside the observed field.
2.2 WISE data
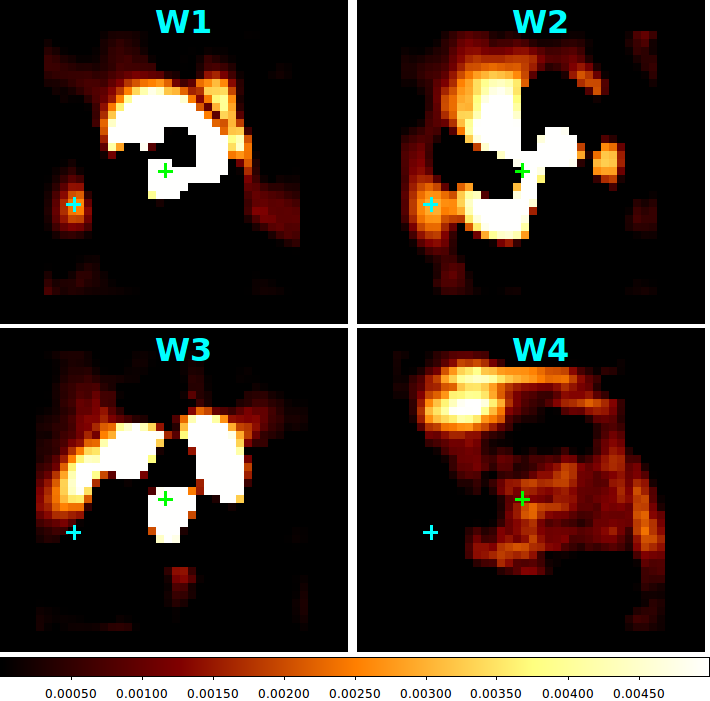
GQ Lup C is not listed in the WISE (Wright et al., 2010) point source catalogue because it is not well resolved from the much brighter primary. In order to constrain the thermal infrared emission from GQ Lup C, we then retrieved WISE images of the region around GQ Lup using the NASA-IRSA interface (https://irsa.ipac.caltech.edu/Missions/wise.html). As mentioned above, the WISE Point Spread Function (PSF) is very extended (Full With at Half Maximum FWHM arcsec, that is much larger than the size of the disk around A) and C is much fainter than A. To reduce the contamination by A, we simply subtracted from each image the same image rotated by 180 degree. The exact position of the pivot of the rotation was obtained by minimizing the r.m.s. within a square region of 1111 pixels centered on a first approximate position obtained by a Gaussian fitting routine. In this way, symmetric features on the PSF are suppressed111We also downloaded images of nearby objects, but their images look quite different so that cannot be used for a PSF subtraction. Figure 1 gives the result of this subtraction. There is a clear signal at the position of C in W1 and W2, while nothing is detected in W3 and W4. We however used the non-detection in W3 to provide an upper limit to the emission by GQ Lup C, while we did an aperture photometry for W1 and W2.
3 Spectral Energy Distribution
In order to discuss the spectral energy distribution (SED) of GQ Lup C, we list in Table 1 the fluxes over a wide spectral range (from 0.33 up to 12 m) that we obtained combining HST, 2MASS (Skrutskie et al., 2006), and WISE data (Wright et al., 2010). The HST magnitudes were calibrated into flux using the recipes in the WFC3 handbook222 https://hst-docs.stsci.edu/display/WFC3IHB.
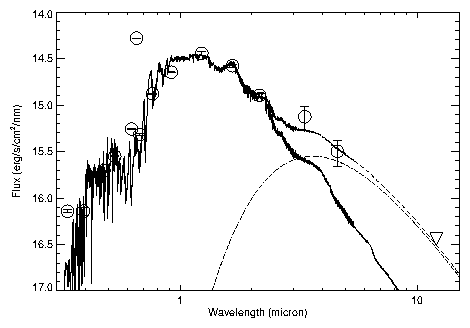
Figure 2 shows a comparison between the SED of GQ Lup C and a BT-Settl model spectrum (Allard et al., 2012) with the parameters closest to those found in Paper I, i.e. Teff=3200 K and dex. An extinction of 1.0 mag, as found in Paper I, has been also considered. The agreement is excellent in the spectral range between 0.4 and 2.2 m. However, the HST data shows evidence for strong excesses in the H narrow band filter and in the UV, that are clear signs of mass accretion from the disk. By comparing the flux in the F656N filter with respect to that measured in broad band filters, and taking into account the band width, we obtained an equivalent width of Å for H, that is considerably stronger than the value of 100 Å obtained from the X-Shooter spectrum in Paper I. This argues for a strong variability of the source, which has been frequently observed in accreting objects (see, e.g., Frasca et al. 2018, and references therein).
The SED also shows an IR excess at wavelengths longer than 3 m, consistent with the detection of the warm part of the disk around GQ Lup C. This may be fitted by a black body SED of K, a value that is constrained at the upper edge by the observed K magnitude, and at the lower edge by the non detection in W3. This is lower than the dust sublimation temperature, suggesting a real truncation of the disk. More specifically, this temperature is about 1/4 of the stellar temperature, suggesting that the disk is truncated at , being the stellar radius. This may be compared with the value of given by eq. (2.2) of Bouvier et al. (2007): assuming B=1 kG, M⊙/yr, M⊙ and R (Paper I), we obtain =12.3. Integrating the fluxes from the model atmosphere and the black body representing the emission from the warm disk over all wavelengths, we obtain a value of , where is the total luminosity; this is of course a lower limit to the disk emission because we cannot exclude that there is also a cold component emitting at wavelengths longer than those considered here. Using Spitzer data to estimate , Merín et al. (2008) obtained an average value of , but with a considerable scatter with values ranging from 0.01 to 1.5. Usually, accretors are thought to have . GQ Lup C would then be at the lower edge of the distribution of this quantity.
4 Disk images from HST
There is a star (Gaia DR2 source 6011522757637551616) with similar peak intensity less than 2 arcsec from GQ Lup C (farther from GQ Lup A). This star can be used as a comparison source for HST images because it is placed at similar separation from the field center and it is quite bright. A comparison of the flux of GQ Lup C with that of this comparison star confirms the clear detection of a strong H emission and UV excess for GQ Lup C. In addition and most interestingly, GQ Lup C image appears to be fuzzier in comparison with the comparison star. While peak intensity is lower at most wavelengths, the FWHM of the images are consistently larger (about 130 mas with respect to about 80 mas for the comparison object). This suggests that the disk around GQ Lup C is actually resolved from the stellar PSF in the HST images.
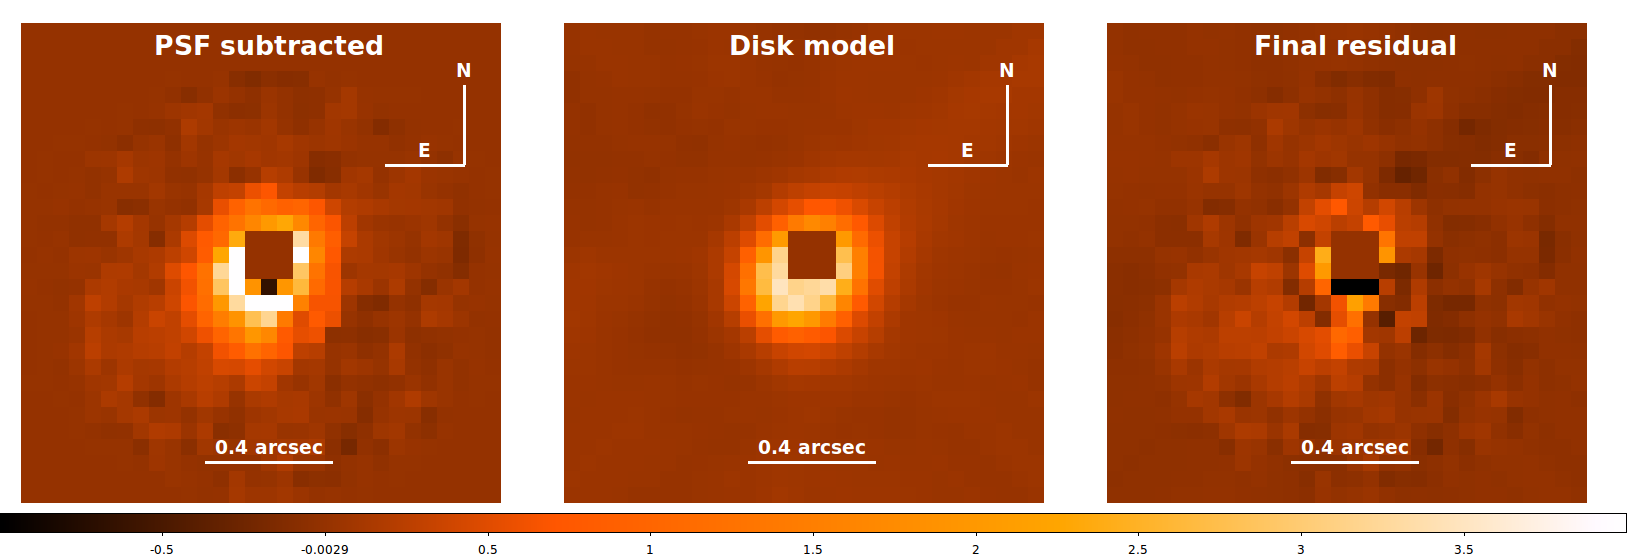
In order to image the disk from the HST data we used a technique based on the PSF subtraction (see Appendix A for a more extended discussion). As a first step, in each frame we determined the position and the flux for GQ Lup C. Then we considered the PSF of the reference star and rescaled it to the flux obtained for GQ Lup C. As a last step, we subtracted the reference PSF to our target star in its position and rotated the frame with respect to the True North (see next Section). The residuals are shown in the last panel of Figure 3, whereas the first two images show GQ Lup C and the model PSF used for the subtraction, respectively.
The PSF subtraction yields a well resolved image of the disk of GQ Lup C. We consider here the image obtained by combining the four best bands (F850LP, F625W, F555W, F775W); however, very similar results are obtained for the individual bands. After PSF subtraction, the excess signal looks roughly distributed along an ellipse aligned NW-SE, with the E side brighter than the W one; the central empty region is likely an artefact of the procedure. We think this light distribution is produced by scattering of the stellar light by a flared circular disk seen at rather high inclination, with the near side less luminous because very close to the center of the star image and then subtracted by the procedure.
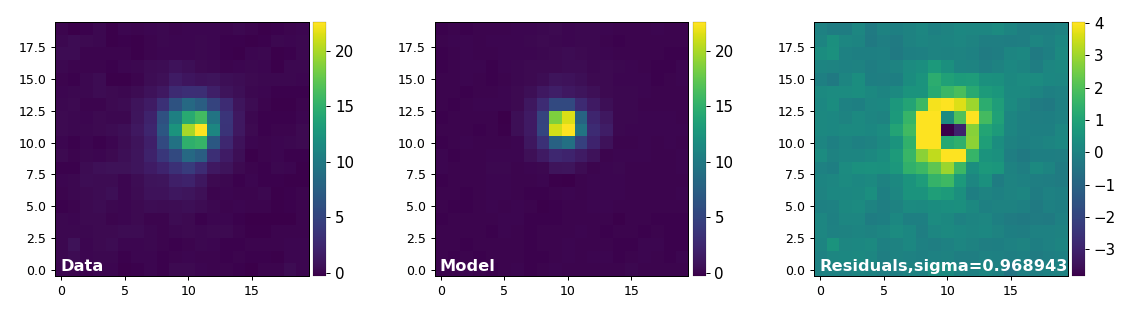
In order to determine the geometrical parameters of this disk, we assumed that the disk is actually a circular ring of radius seen at a given inclination and position angle , and convoluted it with the PSF of the nearby comparison star. We considered that the ring can be offset with respect to the center of the star along the minor axis of the projected ellipse, as seen in numerous cases of disks seen in scattered light (see e.g. Ginski et al. 2016; Sissa et al. 2018). We then found the set of parameters that minimizes the r.m.s. of the residuals between the image obtained after the PSF subtraction and the model disk. Figure 4 illustrates the procedure. We repeated this procedure for the images obtained with the individual bands and assumed the mean value of the parameters as best estimate, and the standard deviation of the mean as its uncertainty. In this way, we obtained a radius of pixels (that is mas, or au at the distance of GQ Lup), an inclination degree, a position angle degree, and an offset of pixel (that is, mas) in the NE direction. The offset can be interpreted as due to flaring of the disk at an angle of about degree, the near side being SW.
For comparison, the disk of GQ Lup A has and degree, as derived from ALMA data (MacGregor et al., 2017); similar parameters ( and ) were obtained by Wu et al. (2017). In addition, if we assume that the circumprimary disk seen by ALMA is co-rotating with GQ Lup B, that is describing a counter-clockwise orbit (see Schwarz et al. 2016), the near side is the SW one also in that case. This comparison suggests that the two disks have a similar though not identical orientation, being disaligned by degree.
5 Is there an outflow from GQ Lup C?
Astrometric calibration of the HST images was obtained using as reference the position, proper motion and parallax of GQ Lup A, C, and of two background stars (sources id. 6011522757637561216 and 6011522757637551616) measured by Gaia DR2 (Gaia Collaboration et al., 2016, 2018). In this way, we obtained a plate scale of 0.03962 arcsec/pixel (very close to the nominal value of 0.0395 arcsec/pixel given in the WFC3 handbook333https://hst-docs.stsci.edu/display/WFC3IHB and a true north correction of 132.153 degree.
We then measured the position of GQ Lup C in the individual bands with respect to the two reference background stars, and between the two reference stars themselves. We found that the position in most bands are essentially identical with each other, with an r.m.s. scatter of about 6 mas. However, the position of GQ Lup C measured on the image obtained with the F656N filter (that is, at H) is offset with respect to the average of that obtained at the remaining wavelengths by about 13 mas, at degree measured on sky. While this result has a significance at only slightly more than twice the error bar, it suggests that H is emitted from a region that is not the same as for the remaining wavelengths. This also agrees with the smaller value of the FWHM of the GQ Lup C image (112 mas) obtained with F656N with respect an average value of 131 mas (with an r.m.s. of 10 mas) for the remaining wavelengths.
We propose that most of the H emission may be attributed to an outflow from GQ Lup C. The outflow is expected to be seen projected along the minor axis of the disk image on the far side, that is roughly at PA=45 degree. This implies that the H emission seems to be shifted at almost right angle, but slightly in the opposite direction. This last feature might be explained as follows: while the direct star light is heavily absorbed by the disk and we see it largely as light scattered by the disk - that is, at a position substantially offset with respect to the real position of the star along the minor axis of the disk -, the outflow is not significantly obscured. This agrees well with the discussion in Paper I. Variability of the emission is consistent with the small size of the outflow ( arcsec) and with the quite long time elapsed between HST and X-Shooter observations (seven years).
6 Discussion and Conclusions
The main result of this letter is the detection of the disk around GQ Lup C both from the excess in the WISE W1 and W2 bands and from scattered light seen in the HST images. The near-infrared excess reveals the warm part of the disk, whose emission is matched by a black body with a temperature of 800 K. We notice that this temperature is lower than that of dust sublimation, suggesting that the disk is actually truncated, probably by magnetic fields at the stellar co-rotation radius. This is not well determined, because we can only estimate the stellar rotation period from the values of the stellar radius and of determined in Paper I, and using the inclination we obtained for the disk. The corresponding period is 2.7 d, but it is largely uncertain because of the huge error bar of . On the other hand, the inner disk radius is also uncertain because the value of the albedo is not well determined. However, an inner disk radius of 0.20 au, corresponding to a period of 2.7 d for the stellar mass (0.15 M⊙) determined in Paper I is obtained assuming an albedo of 0.3.
The scattered light image provides an estimate of the disk radius of au. This is smaller than all disk radii obtained in the ALMA survey of disks in Lupus (Ansdell et al., 2016, 2018); however this is due to the resolution of the ALMA images used in that survey, because there are examples of disks as small as that in GQ Lup C resolved by ALMA (see e.g. Facchini et al. 2019). On the other hand, this same survey suggests the presence of a correlation between disk radii and dust masses, that is roughly described by the power law . While this relation is based on sub-mm observations, that can provide very different images of disks with respect to scattered light, we notice that if we use the disk radius determined from the HST data, we would obtain a dust mass of 2.1 M⊕; this is a quite typical value for disks around small mass stars in Lupus (Ansdell et al., 2016, 2018). The disk of GQ Lup C looks then not anomalous for the Lupus association, and we expect that the corresponding sub-mm flux would have been detected by that survey, though resolution of the disk would have required a longer baseline.
We finally note that the orientation of the major axis of the disks of GQ Lup A and C agrees fairly well with the main axis of the filament visible in Herschel images (Rygl et al., 2013), while that of the minor axis agrees with that of the magnetic field in nearby regions (Rizzo et al., 1998; Matthews et al., 2014).
Acknowledgements.
R.G., D.M., S.D. and V.D. acknowledge support from the “Progetti Premiali” funding scheme of the Italian Ministry of Education, University, and Research. This work has been supported by the project PRIN-INAF 2016 The Cradle of Life - GENESIS-SKA (General Conditions in Early Planetary Systems for the rise of life with SKA). E.R. is supported by the European Union’s Horizon 2020 research and innovation programme under the Marie Skłodowska-Curie grant agreement No 664931. This work has made use of data from the European Space Agency (ESA) mission Gaia (https://www.cosmos.esa.int/gaia), processed by the Gaia Data Processing and Analysis Consortium (DPAC, https://www.cosmos.esa.int/web/gaia/dpac/consortium). Funding for the DPAC has been provided by national institutions, in particular the institutions participating in the Gaia Multilateral Agreement.References
- Alcalá et al. (2020) Alcalá, J. M., Majidi, F. Z., Desidera, S., et al. 2020, arXiv e-prints, arXiv:2001.10879
- Allard et al. (2012) Allard, F., Homeier, D., & Freytag, B. 2012, Philosophical Transactions of the Royal Society of London Series A, 370, 2765
- Ansdell et al. (2018) Ansdell, M., Williams, J. P., Trapman, L., et al. 2018, ApJ, 859, 21
- Ansdell et al. (2016) Ansdell, M., Williams, J. P., van der Marel, N., et al. 2016, ApJ, 828, 46
- Bouvier et al. (2007) Bouvier, J., Alencar, S. H. P., Harries, T. J., Johns-Krull, C. M., & Romanova, M. M. 2007, in Protostars and Planets V, ed. B. Reipurth, D. Jewitt, & K. Keil, 479
- Facchini et al. (2019) Facchini, S., van Dishoeck, E. F., Manara, C. F., et al. 2019, A&A, 626, L2
- Frasca et al. (2018) Frasca, A., Montes, D., Alcalà, J. M., Klutsch, A., & Guillout, P. 2018, Acta Astron., 68, 403
- Gaia Collaboration et al. (2018) Gaia Collaboration, Brown, A. G. A., Vallenari, A., et al. 2018, A&A, 616, A1
- Gaia Collaboration et al. (2016) Gaia Collaboration, Prusti, T., de Bruijne, J. H. J., et al. 2016, A&A, 595, A1
- Ginski et al. (2016) Ginski, C., Stolker, T., Pinilla, P., et al. 2016, A&A, 595, A112
- MacGregor et al. (2017) MacGregor, M. A., Wilner, D. J., Czekala, I., et al. 2017, ApJ, 835, 17
- Matthews et al. (2014) Matthews, T. G., Ade, P. A. R., Angilè, F. E., et al. 2014, ApJ, 784, 116
- Merín et al. (2008) Merín, B., Jørgensen, J., Spezzi, L., et al. 2008, ApJS, 177, 551
- Rizzo et al. (1998) Rizzo, J. R., Morras, R., & Arnal, E. M. 1998, MNRAS, 300, 497
- Rygl et al. (2013) Rygl, K. L. J., Benedettini, M., Schisano, E., et al. 2013, A&A, 549, L1
- Schwarz et al. (2016) Schwarz, H., Ginski, C., de Kok, R. J., et al. 2016, A&A, 593, A74
- Sissa et al. (2018) Sissa, E., Gratton, R., Garufi, A., et al. 2018, A&A, 619, A160
- Skrutskie et al. (2006) Skrutskie, M. F., Cutri, R. M., Stiening, R., et al. 2006, AJ, 131, 1163
- Wright et al. (2010) Wright, E. L., Eisenhardt, P. R. M., Mainzer, A. K., et al. 2010, AJ, 140, 1868
- Wu et al. (2017) Wu, Y.-L., Sheehan, P. D., Males, J. R., et al. 2017, ApJ, 836, 223
Appendix A PSF subtraction method
The method applied in Section 4 to image the disk around GQ Lup C after the subtraction of a model PSF is described in details in Lazzoni et al. (submitted). Here, we just summarize two main caveats to be considered when using this technique. The first one regards the model used, since we are fitting the parameters of a Gaussian profile for the central peak and damped correction for the Airy diffraction pattern (the model PSF of the nearby star) to a PSF that has a different shape (GQ Lup C), given by the presence of the disk. For this reason, the optimized residuals will show over-bright areas surrounded by over-subtracted ones to balance the incongruous models. Thus, one of the most difficult parameters to estimate is the flux of the source whereas the geometry of the disk should be less affected, especially for centered disks around the star. In cases like the one presented in this paper, where the disk looks slightly mis-centered, the derived inclination and width are to be considered as a first estimate only.
The second caveat regards, instead, the differences between the PSF of the object and the one of the model due to the instruments itself. Indeed, even if the two PSFs are taken at the same time (thus in the same conditions), distortions may emerge from different position in the field of view. However, since the two sources are quite close on the detector, we can neglect such effects for this case.
Appendix B Tables
| Band | Wavel. | Magnitude | Flux |
|---|---|---|---|
| (m) | (mag) | erg/cm2/s1/nm | |
| HST-F336W | 0.3355 | E-17 | |
| HST-F390W | 0.3921 | E-17 | |
| HST-F475W | 0.4771 | E-16 | |
| HST-F555W | 0.5305 | E-16 | |
| HST-F625W | 0.6241 | E-16 | |
| HST-F656N | 0.6561 | E-16 | |
| HST-F673N | 0.6766 | E-16 | |
| HST-F775W | 0.7651 | E-15 | |
| HST-F850LP | 0.9187 | E-15 | |
| 2MASS-J | 1.235 | E-15 | |
| 2MASS-H | 1.662 | E-15 | |
| 2MASS-K | 2.159 | E-15 | |
| WISE-W1 | 3.353 | E-16 | |
| WISE-W2 | 4.603 | E-16 | |
| WISE-W3 | 12 | 10.638 | 3.62E-17 |