Dust depleted inner disks in a large sample of transition disks through long-baseline ALMA observations
Abstract
Transition disks with large inner dust cavities are thought to host massive companions. However, the disk structure inside the companion orbit and how material flows toward an actively accreting star remain unclear. We present a high resolution continuum study of inner disks in the cavities of 38 transition disks. Measurements of the dust mass from archival Atacama Large Millimeter/Submillimeter Array observations are combined with stellar properties and spectral energy distributions to assemble a detailed picture of the inner disk. An inner dust disk is detected in 18 of 38 disks in our sample. Of the 14 resolved disks, 8 are significantly misaligned with the outer disk. The near-infrared excess is uncorrelated with the mm dust mass of the inner disk. The size-luminosity correlation known for protoplanetary disks is recovered for the inner disks as well, consistent with radial drift. The inner disks are depleted in dust relative to the outer disk and their dust mass is uncorrelated with the accretion rates. This is interpreted as the result of radial drift and trapping by planets in a low () disk, or a failure of the -disk model to describe angular momentum transport and accretion. The only disk in our sample with confirmed planets in the gap, PDS 70, has an inner disk with a significantly larger radius and lower inferred gas-to-dust ratio than other disks in the sample. We hypothesize that these inner disk properties and the detection of planets are due to the gap having only been opened recently by young, actively accreting planets.
1 Introduction
Protoplanetary disks are circumstellar reservoirs of gas and dust found surrounding young stars, and are the presumed birthplace of planets. Transition disks are a class of protoplanetary disks with large cavities in their dust distributions seen directly in millimetre observations (Andrews et al., 2011) or implied from a deficit of infrared emission in their spectral energy distribution (SED) (Espaillat et al., 2014). The dust cavities in transition disks can be formed by embedded companions (e.g. Lin & Papaloizou, 1979) or dead zones (e.g. Regály et al., 2012), which can create local enhancements in the gas pressure where dust grains are trapped and grow to mm sizes (Pinilla et al., 2012). This trapping is necessary to explain the observed emission at millimetre wavelengths, as otherwise drag forces from the gas acting on the large (mm-cm) size grains would cause them to rapidly drift into the star (Whipple, 1972; Weidenschilling, 1977). Trapping by a companion is strongly favoured due to the detection of deep gas cavities within dust cavities in several transition disks by the Atacama Large Millimeter/Submillimeter Array (ALMA) (e.g. van der Marel et al., 2016; Dong et al., 2017). The only robust detection of a planet embedded inside a transition disk cavity so far, however, is PDS70b (Keppler et al., 2018; Haffert et al., 2019). Other planet candidates inside cavities have been claimed (e.g. Quanz et al., 2013; Sallum et al., 2015), but later discarded as imaging artefacts (e.g. Rameau et al., 2017; Currie et al., 2019).
Several lines of evidence indicate that dust trapping does not produce transition disk cavities completely devoid of dust, and that an inner disk exists close to the star. The presence of a significant near-infrared (NIR) excess over the stellar blackbody in some objects suggests an inner ring of micron-sized warm dust extending to the sublimation radius separated from the outer disk (Espaillat et al., 2007), which has been used to define the ”pre-transition disk” (PTD) sub-class. This distinction between pre-transition disk and transition disk has been suggested as an evolutionary sequence, where the inner disk is eventually cleared by accretion onto the star. However, the modelling of the inner disk responsible for the NIR excess is subject to several uncertainties, in particular, the opacity and the assumed 3D geometry, which makes it difficult to constrain the extent of the dust distribution.
The high accretion rates in transition disks, comparable to rates in ’full’ protoplanetary disks, require the presence of a gas-rich inner disk (e.g. Manara et al., 2014), or flow through the cavity at free-fall speeds if the gas is also depleted (Rosenfeld et al., 2014). ALMA observations of CO isotopologues indicate that the gas surface density drops by several orders of magnitude within transition disk dust cavities, however, these studies were limited to a resolution of au and thus unable to detect the gas structure in the inner part of the disk (e.g. van der Marel et al., 2016). Detections of rovibrational CO line emission, which is only excited at high temperatures, also indicates potential high gas surface densities close to the star (e.g. Pontoppidan et al., 2008; Banzatti & Pontoppidan, 2015). Models of viscous (“”) accretion disks (Shakura & Sunyaev, 1973) predict a tight correlation between the total disk mass and accretion rate (Hartmann et al., 1998), which has recently been found observationally in protoplanetary disks (Manara et al., 2016; Sanchis et al., 2019). This favors a gas-rich inner disk, however, the validity of -disk models has been called into question by observational and theoretical concerns over the degree of turbulence present in protoplanetary disks (Flaherty et al., 2017, 2018; Bai, 2016).
A misaligned inner disk has been invoked to explain several phenomena in transition disks. Scattered light observations show shadowing of the outer disk in several objects (e.g. DoAr 44, Casassus et al. (2018), RXJ1604.3 - 2130, Pinilla et al. (2018)) which are well described by a misaligned or warped inner disk. Observations of the gas motion as traced by CO also display velocity patterns consistent with a misaligned inner gas disk (e.g. AA Tau, Loomis et al. (2017)). Finally, a misaligned inner disk has been used to explain the aperiodic/quasi-period dips seen in the light curves of dipper stars, some of which are known to host transition disks (AA Tau, Bouvier et al. (1999, 2007), RXJ1604.3 - 2130 Sicilia-Aguilar et al. (2019)).
While an inner disk has been inferred from the previous findings indirectly, a properly quantified study of inner disks in a large sample of transition disks is still lacking. The mm-dust content of an inner disk can be measured by long-baseline observations with ALMA. For nearby transition disks, ALMA is capable of resolving dust emission on scales as small as 5 au (equivalent to a 0.033″ beam at 150 pc), and several inner mm-dust disks have previously been detected, e.g. HD 142527, DM Tau and SR24S (Fukagawa et al., 2013; Kudo et al., 2018; Pinilla et al., 2019).
In this work, we present an ALMA continuum study of inner disks in a sample of 38 transition disks. We combine archival ALMA observations with a range of sensitivities and spatial resolutions at typically or au resolution with measurements of the SED-derived near-infrared (NIR) excess and accretion rates to investigate the properties of the inner disks.
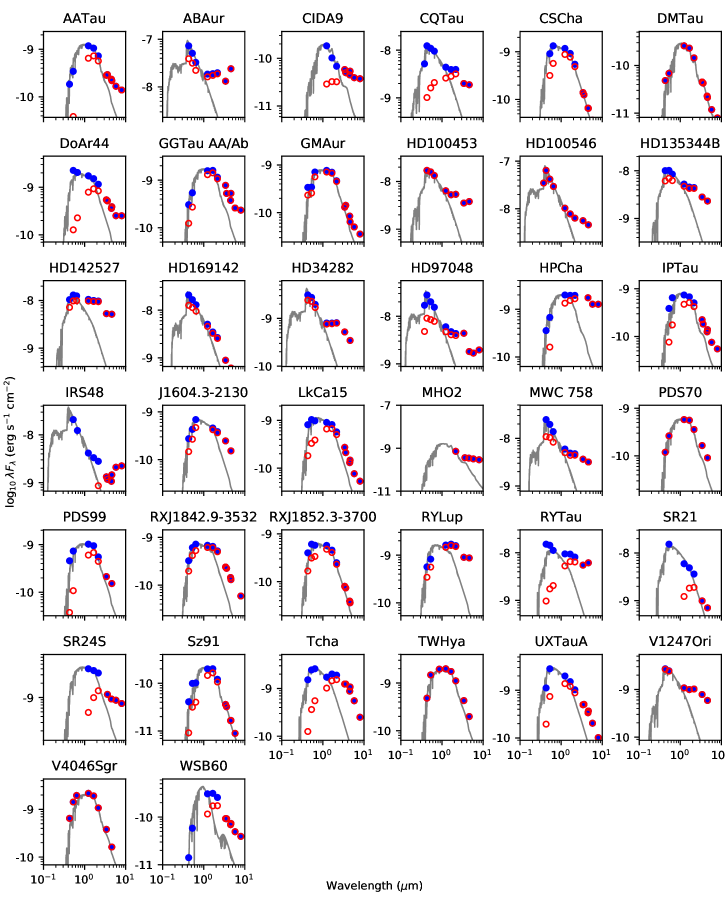
The paper is organized as follows: In Section 2, we present our sample selection (2.1), the ALMA data reduction process (2.2), the collection of the stellar properties and SED photometry (2.3), and the calculation of the NIR excess (2.4). In Section 3, we outline our methods of fitting the inner disk emission (3.1), determining the inner disk dust mass (3.2), and measuring global dust surface density profiles (3.3). In Section 4, we discuss misalignments between the inner and outer disk (4.1), correlations between mm-dust mass and NIR excess or accretion rates (4.2,4.3), the size of the inner dust disk compared with the size-luminosity relation and the water snowline (4.4), the gas content and angular momentum transport through the inner disk (4.5), and the consequences for the presence of companions (4.6). A summary of the paper and our conclusions are given in Section 5. Plots of the SEDs for our sample, the determination of the inclination and position angle of some outer disks, and the coordinates of the detected inner disks are given in the Appendix.
2 Sample and Observations
2.1 Sample selection
Our sample consists of 38 transition disks with large inner dust cavities (25 au, except TW Hya), for which spatially resolved ALMA archival data exist and for which the spatial resolution is sufficient to fully resolve the dust cavity. If fully resolved, the millimeter flux of the inner disk (when detected) can be measured directly and its size can be constrained. For the majority of disks, Band 6 (1.3 mm or 230 GHz) or Band 7 (0.87 mm or 345 GHz) data at high resolution is available, but for four targets (HD 135344B, T Cha, SR21, SR24S) data in Band 3 (3.0 mm or 100 GHz) actually had higher spatial resolution and those were chosen for our analysis instead. The full list of targets and their respective observing wavelength and resolution is given in Table 1. About half of our datasets have been published already; references are provided in the same table.
| Name | ALMA Project IDs | Frequency | Beam | RMS | Briggs robust | Ref. | |
|---|---|---|---|---|---|---|---|
| (GHz) | (″) | (mJy bm-1) | |||||
| AATau | 2013.1.01070.S, 2016.1.01205.S | 241.1495 | 0.07 x 0.04 | 0.04 | -2.0 | 1,2 | |
| ABAur | 2015.1.00889.S | 232.7003 | 0.06 x 0.03 | 0.02 | 2.0 | 3 | |
| CIDA9 | 2016.1.01164.S | 217.9947 | 0.14 x 0.11 | 0.07 | 0.5 | 4 | |
| CQTau | 2016.A.00026.S, 2017.1.01404.S | 224.9946 | 0.07 x 0.05 | 0.02 | 0.5 | 5 | |
| CSCha | 2017.1.00969.S | 341.1324 | 0.09 x 0.06 | 0.04 | 0.5 | 6 | |
| DMTau | 2013.1.00498.S, 2017.1.01460.S | 224.8051 | 0.04 x 0.03 | 0.01 | 2.0 | 7 | |
| DoAr44 | 2012.1.00158.S | 336.0885 | 0.22 x 0.19 | 0.33 | -2.0 | 8 | |
| GGTau AA/Ab | 2012.1.00129.S, 2015.1.00224.S | 336.8155 | 0.26 x 0.16 | 1.23 | 0.5 | 9,10 | |
| GMAur | 2015.1.01207.S, 2017.1.01151.S | 243.1163 | 0.04 x 0.02 | 0.01 | 0.5 | 11 | |
| HD100453 | 2015.1.00192.S, 2017.1.01424.S | 281.2888 | 0.03 x 0.02 | 0.03 | -2.0 | 12 | |
| HD100546 | 2016.1.00344.S | 224.9983 | 0.04 x 0.02 | 0.03 | -2.0 | 13 | |
| HD135344B | 2017.1.00884.S | 109.1009 | 0.11 x 0.07 | 0.03 | 2.0 | 14 | |
| HD142527 | 2012.1.00631.S | 321.7245 | 0.12 x 0.09 | 0.13 | -2.0 | - | |
| HD169142 | 2016.1.00344.S | 225.0001 | 0.05 x 0.03 | 0.01 | 0.5 | 15 | |
| HD34282 | 2015.1.00192.S, 2017.1.01578.S | 225.5628 | 0.06 x 0.05 | 0.02 | 0.5 | 16 | |
| HD97048 | 2016.1.00826.S | 338.0715 | 0.06 x 0.03 | 0.12 | -2.0 | 17 | |
| HPCha | 2017.1.01460.S | 224.8087 | 0.05 x 0.03 | 0.02 | 0.5 | 18 | |
| IPTau | 2016.1.01164.S | 225.4950 | 0.12 x 0.09 | 0.07 | -2.0 | 4 | |
| IRS48 | 2013.1.00100.S | 343.0859 | 0.13 x 0.10 | 0.24 | -2.0 | 19 | |
| J1604.3-2130 | 2015.1.00888.S | 349.7554 | 0.13 x 0.12 | 0.14 | -2.0 | 20 | |
| LkCa15 | 2015.1.00678.S | 284.1257 | 0.18 x 0.12 | 0.16 | -2.0 | 21 | |
| MHO2 | 2013.1.00498.S | 224.6686 | 0.20 x 0.14 | 0.40 | -2.0 | 22 | |
| MWC 758 | 2017.1.00492.S | 343.5038 | 0.05 x 0.04 | 0.04 | 0.5 | 23 | |
| PDS70 | 2015.1.00888.S, 2017.A.00006.S | 350.5927 | 0.07 x 0.05 | 0.03 | 0.5 | 24 | |
| PDS99 | 2015.1.01301.S | 226.4268 | 0.24 x 0.15 | 0.14 | -2.0 | 25 | |
| RXJ1842.9-3532 | 2015.1.01083.S | 343.5127 | 0.16 x 0.12 | 0.12 | -2.0 | 26 | |
| RXJ1852.3-3700 | 2015.1.01083.S | 343.5125 | 0.15 x 0.12 | 0.17 | -2.0 | 27 | |
| RYLup | 2017.1.00449.S | 220.7937 | 0.12 x 0.11 | 0.06 | -2.0 | 28 | |
| RYTau | 2013.1.00498.S, 2017.1.01460.S | 224.7880 | 0.04 x 0.02 | 0.07 | 0.5 | 29 | |
| SR21 | 2017.1.00884.S | 108.0000 | 0.10 x 0.07 | 0.02 | 2.0 | 30 | |
| SR24S | 2017.1.00884.S | 108.0000 | 0.07 x 0.06 | 0.04 | 0.5 | 31 | |
| Sz91 | 2012.1.00761.S | 349.4095 | 0.15 x 0.12 | 0.04 | 0.5 | 32 | |
| Tcha | 2015.1.00979.S | 97.4942 | 0.08 x 0.04 | 0.03 | -2.0 | 33 | |
| TWHya | 2011.1.00399, 2013.1.00198.S, 2015.1.00686.S | 345.8636 | 0.02 x 0.02 | 0.04 | 0.0 | 34 | |
| UXTauA | 2015.1.00888.S | 349.7559 | 0.15 x 0.12 | 0.33 | -2.0 | 35 | |
| V1247Ori | 2015.1.00986.S | 351.4541 | 0.03 x 0.03 | 0.06 | 0.5 | 36 | |
| V4046Sgr | 2017.1.01167.S | 238.8056 | 0.06 x 0.04 | 0.05 | 0.5 | 37 | |
| WSB60 | 2016.1.01042.S | 224.6866 | 0.11 x 0.08 | 0.10 | -2.0 | - |
Note. — Refs. 1) Loomis et al. (2017); 2) Loomis et al. in prep. 3) Tang et al. (2017); 4) Long et al. (2018); 5) Ubeira Gabellini et al. (2019); 6) Kurtovic et al. in prep.; 7) Kudo et al. (2018); 8) van der Marel et al. (2016); 9) Dutrey et al. (2016); 10) Phuong et al. (2020); 11) Huang et al. (2020); 12) Rosotti et al. (2019b); 13) Pérez et al. (2020); 14) Cazzoletti et al. (2018); 15) Pérez et al. (2019); 16) de Boer et al. in prep.; 17) van der Plas et al. subm.; 18) Konishi et al. in prep.; 19) van der Marel et al. in prep.; 20) Mayama et al. (2018); 21) Qi et al. (2019); 22) Pinilla et al. (2018) 23) Dong et al. (2018); 24) Keppler et al. (2019); 25) Hashimoto et al. in prep.; 26) Morino & Fukagawa in prep.; 27) Villenave et al. (2019); 28) van der Marel et al. in prep.; 29) Konishi et al. in prep.; 30) Muro-Arena et al. subm.; 31) Pinilla et al. (2019); 32) Tsukagoshi et al. (2019); 33) Hendler et al. (2018); 34) Andrews et al. (2016); 35) Akiyama et al. in prep.; 36) Kraus et al. (2017); 37) Perez et al. in prep.
The final sample consists of transition disks in nearby star forming regions such as Taurus, Chamaeleon, Ophiuchus, Lupus, Upper Sco, Corona Australis, TW Hydra and a number of isolated objects (all Herbig stars). Most targets are located within 200 pc with the exception of V1247 Ori and HD 34282, at 400 and 312 pc distance, respectively.
Biases in the sample towards large and bright objects likely exist: several disks were observed with ALMA at high spatial resolution as targeted observations on the disk structure, as the presence of their cavity was already known from previous (sub)millimeter observations and/or a dip in the infrared part of their Spectral Energy Distribution (SED). Some transition disks have been discovered serendipitously as part of complete disk surveys of nearby star forming regions (e.g. Ansdell et al., 2016b; Pascucci et al., 2016; Cox et al., 2017; Long et al., 2018) at lower spatial resolution (0.12-0.3”). However, for many disks identified in those surveys the resolution was insufficient to fully resolve the cavity and they were thus not included. This applies in particular to the new transition disks in Lupus (van der Marel et al., 2018) and Chamaeleon (Pascucci et al., 2016). The sample is thus not a complete sample of all transition disks with large cavities within 200 pc, but representative across a wide range of disk and stellar properties. Spectral types range between A0 and M6 with an increased occurrence of early type objects.
For Herbig Group I disks (Herbig stars with high far infrared excess, considered the Herbig transition disks) within 400 pc the completeness of the sample can be readily estimated: 9 out of 12 Group I Herbig stars as identified by Garufi et al. (2017) have been spatially resolved with ALMA and are included in our sample. The only exceptions are HD 141569, which is a much more evolved object (White et al., 2016), and HD 179218 and HD 139614, which do not have high-resolution ALMA data yet.
For T Tauri stars completeness is much harder to determine, as these are taken from both targeted studies and disk surveys, and it remains unclear if all transition disks are known within these regions. The disk surveys of nearby star forming regions (dominated by T Tauri stars) are both resolution, sample and sensitivity limited, but with different limits for each region. For example, Chamaeleon was observed at a modest 0.6” resolution (Pascucci et al., 2016), leaving all but the largest (50 au) cavities unresolved, whereas Taurus and Ophiuchus were observed at 0.12” (Long et al., 2018; Cieza et al., 2019), but the full Class II population of Taurus has not been covered yet. The Lupus disk survey was complete (Ansdell et al., 2016b, 2018) but at a resolution of 0.25-0.3”, and even though 11 transition disks were identified (van der Marel et al., 2018), only 2 were followed up in high enough resolution to resolve the inner disk. However, these disk surveys do indicate that transition disks with large cavities are generally bright (Owen & Clarke, 2012; van der Marel et al., 2018), so even if our sample is incomplete, the disks selected here likely cover the majority of the transition disks with large cavities within the Solar Neighborhood.
2.2 ALMA data reduction
The archival ALMA data collected for each disk was chosen in order to best resolve the dust cavity and inner disk (if present). All data were calibrated using the ALMA pipeline reduction scripts provided with the raw data from the ALMA archive, except TW Hya, for which the reduced image from Andrews et al. (2016) was used.
Images created from long baseline data alone can suffer from negative bowls around bright structures, which can potentially lower the flux of the inner disk. To avoid this and maximize the sensitivity to the inner disk, we verified that each ALMA project contained sufficient short baselines to recover the largest scales in the disk. Where necessary, long baseline observations were combined with more compact configuration ALMA data from other projects in order to recover the largest scales in each disk. The only image missing compact configuration data is AB Aur, as no Band 6 observations in a compact configuration have been taken, and the outer disk is consequently resolved out.
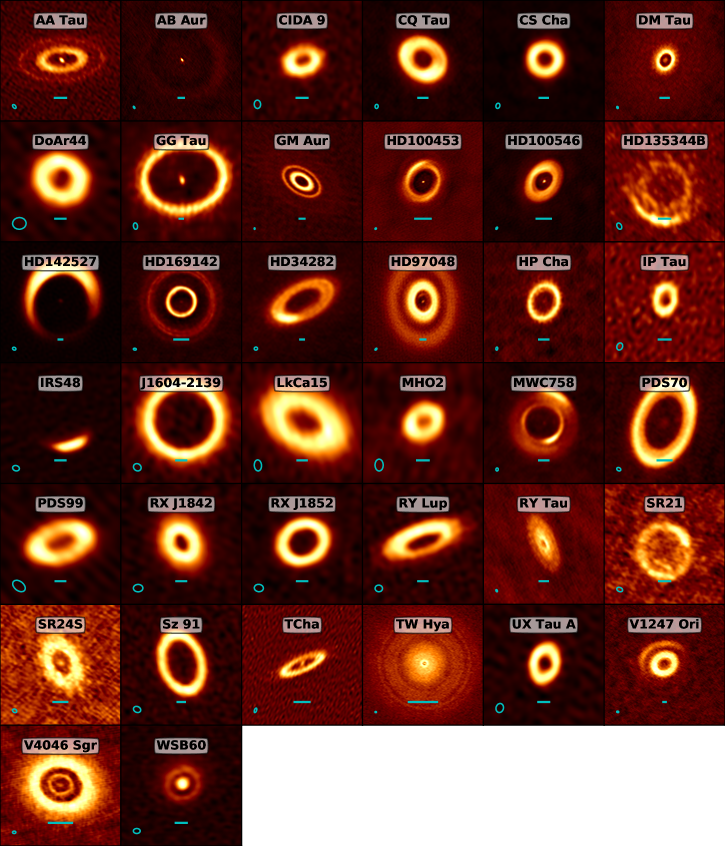
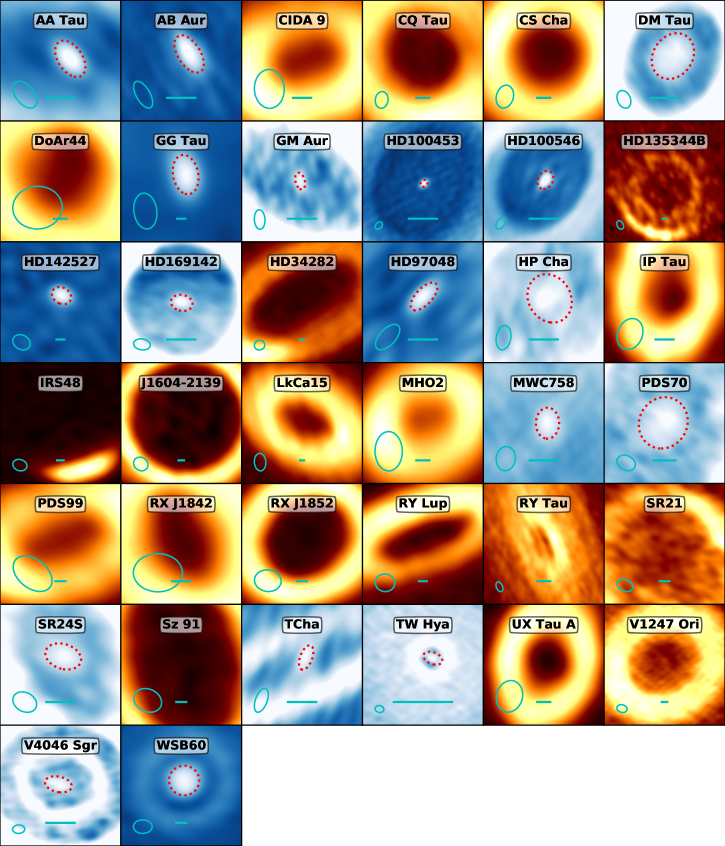
Images of each target were created using the tclean task in version 5.5.0 of the Common Astronomy Software Applications (CASA) package. For each disk, images were produced using briggs robust weighting values of 2.0 (natural), 0.5 (robust), and -2.0 (uniform). As the relative sensitivity and spatial sampling varied widely across our sample, we individually selected the weighting for each image that maximized the S/N of the inner disk. For TW Hya, a Briggs robust value of 0.0 was used by Andrews et al. (2016). The images used for analysis of the inner disk are shown in Figure 1, and a zoom-in on each disk with contours in units of the image RMS are shown in Figure 2.
The natural weighted images were used to determine the dust surface density profiles of the outer disk in Section 3.3. For AB Aur lower resolution Band 7 data (program 2012.1.00303.S) were used to measure the surface density profile of the outer disk, as the Band 6 data did not contain the short baselines and thus did not recover most of the outer disk emission.
2.3 Stellar properties
For all targets in our sample spectral types and accretion rates are taken from the literature. For more than half of these targets, these properties were derived using full X-shooter spectra from UV to NIR, with a proper simultaneous fit to UV excess, extinction, stellar photosphere and emission lines following Alcalá et al. (2014). However, most of these stellar studies were performed before Gaia Data Release 2 with incorrect distances for individual objects. We have taken the new distances from Gaia DR2 (Gaia Collaboration et al., 2018) and scaled the luminosities and extinction accordingly by fitting the optical and NIR photometry of the Spectral Energy Distributions to Kurucz stellar photospheric models (Castelli & Kurucz, 2004). Photometric data was taken from BVRI surveys, 2MASS (JHK), WISE and Spitzer-IRAC. The results are given in Table 2 and the final SEDs in Figure 16. For MHO 2 and CIDA 9 (both M stars), no optical photometry is available and the fit to stellar luminosity and extinction remains highly uncertain.
For consistency, we rederive the stellar masses using the new luminosities and temperatures by comparing them with evolutionary tracks for pre-main sequence stars (see method description in van der Marel et al., 2019). For K and M stars we use the evolutionary tracks of Baraffe et al. (2015). For the earlier type stars, the Baraffe models do not provide stellar mass estimates and we use the evolutionary tracks of Siess et al. (2000) instead.
For the accretion rates, we use the values provided in the literature. These values were derived with pre-Gaia distances but can not be simply scaled without a full consideration of the stellar properties. We assume an uncertainty of half a dex on the accretion rates.
| Name | Distance | Spectral Type | Luminosity | Mass | A | NIR Excess | PTD/TD | Ref.aafootnotemark: | ||
|---|---|---|---|---|---|---|---|---|---|---|
| (pc) | (K) | () | (%) | ( | ||||||
| AATau | 137 | K7 | 4350 | 1.1 | 0.68 | 2.3 | TD | -8.44 | 1, 4, 27 | |
| ABAur | 163 | A0 | 9520 | 65.1 | 2.56 | 0.5 | PTD | -6.80 | 1, 5, 28 | |
| CIDA9 | 140 | M2 | 3580 | 0.1 | 0.36 | 7.0 | TD | 0.00 | 2, 6, - | |
| CQTau | 163 | F2 | 6890 | 10.0 | 1.63 | 2.0 | PTD | -8.30 | 1, 7, 29 | |
| CSCha | 176 | K2 | 4780 | 1.9 | 1.4 | 1.1 | TD | -8.30 | 1, 8, 8 | |
| DMTau | 145 | M2 | 3580 | 0.2 | 0.39 | 0.0 | TD | -8.30 | 1, 8, 30 | |
| DoAr44 | 146 | K2 | 4780 | 1.9 | 1.4 | 3.0 | PTD | -8.20 | 1, 8, 8 | |
| GGTau AA/Ab | 140 | K7+M0 | 4060 | 1.6 | 0.66 | 0.7 | PTD | -7.30 | 2, 9, 31 | |
| GMAur | 160 | K5 | 4350 | 1.0 | 1.01 | 0.3 | TD | -8.30 | 1, 8, 8 | |
| HD100453 | 104 | F0 | 7200 | 6.2 | 1.47 | 0.0 | PTD | -8.30 | 1, 10, 10 | |
| HD100546 | 110 | A0 | 9520 | 25.0 | 2.13 | 0.0 | PTD | -7.04 | 1, 10, 10 | |
| HD135344B | 136 | F5 | 6440 | 6.7 | 1.51 | 0.4 | PTD | -7.37 | 1, 10, 10 | |
| HD142527 | 157 | F6 | 6360 | 9.9 | 1.69 | 0.3 | PTD | -7.45 | 1, 10, 10 | |
| HD169142 | 114 | A5 | 8200 | 8.0 | 1.65 | 0.4 | PTD | -8.70 | 1, 11, 32 | |
| HD34282 | 312 | A0 | 9520 | 10.8 | 2.11 | 0.2 | PTD | -8.30 | 1, 10, 10 | |
| HD97048 | 185 | A0 | 9520 | 30.0 | 2.17 | 0.9 | PTD | -8.16 | 1, 10, 10 | |
| HPCha | 160 | K7 | 4060 | 2.4 | 0.95 | 1.5 | PTD | -8.97 | 3, 12, 12 | |
| IPTau | 131 | M0 | 3850 | 0.6 | 0.54 | 1.7 | PTD | -8.14 | 1, 13, 33 | |
| IRS48 | 134 | A0 | 9520 | 17.8 | 1.96 | 11.0 | PTD | -8.40 | 1, 14, 34 | |
| J1604.3-2130 | 150 | K3 | 4780 | 0.7 | 1.1 | 0.5 | PTD | -10.54 | 1, 15, 35 | |
| LkCa15 | 159 | K2 | 4730 | 1.3 | 1.32 | 1.2 | PTD | -8.40 | 1, 8, 8 | |
| MHO2 | 133 | M3 | 3470 | 1.0 | 0.44 | 0.0 | TD | 0.00 | 1, 16, - | |
| MWC 758 | 160 | A7 | 7850 | 14.0 | 1.77 | 0.7 | PTD | -7.35 | 1, 17, 34 | |
| PDS70 | 113 | K7 | 4060 | 0.3 | 0.8 | 0.0 | TD | -11.00 | 1, 18, 36 | |
| PDS99 | 155 | K6 | 4205 | 1.1 | 0.88 | 2.0 | TD | 0.00 | 1, 19, - | |
| RXJ1842.9-3532 | 154 | K2 | 4780 | 0.8 | 1.14 | 0.4 | PTD | -8.80 | 1, 8, 8 | |
| RXJ1852.3-3700 | 146 | K2 | 4780 | 0.6 | 1.05 | 0.7 | TD | -8.70 | 1, 8, 8 | |
| RYLup | 159 | K2 | 4780 | 1.9 | 1.4 | 0.4 | PTD | -8.20 | 1, 20, 20 | |
| RYTau | 175 | G2 | 5860 | 15.0 | 2.25 | 2.2 | PTD | -7.10 | 1, 21, 21 | |
| SR21 | 138 | G4 | 5770 | 11.0 | 2.12 | 6.0 | PTD | -7.90 | 1, 8, 8 | |
| SR24S | 114 | K6 | 4060 | 2.5 | 0.87 | 8.0 | PTD | -7.15 | 1, 22, 22 | |
| Sz91 | 159 | M1 | 3850 | 0.2 | 0.54 | 1.2 | TD | -8.73 | 1, 20, 14 | |
| Tcha | 107 | G8 | 5570 | 1.3 | 1.12 | 2.0 | PTD | -8.40 | 1, 23, 37 | |
| TWHya | 60 | K7 | 4205 | 0.3 | 0.81 | 0.0 | TD | -8.90 | 1, 8, 8 | |
| UXTauA | 140 | G8 | 5570 | 2.5 | 1.4 | 1.4 | PTD | -7.95 | 1, 24, 24 | |
| V1247Ori | 400 | F0 | 7200 | 15.0 | 1.82 | 0.0 | PTD | -8.00 | 1, 25, 38 | |
| V4046Sgr | 72 | K7+K5 | 4060 | 0.5 | 0.76 | 0.0 | TD | -9.30 | 1, 26, 39 | |
| WSB60 | 137 | M6 | 3050 | 0.2 | 0.24 | 3.7 | PTD | -8.90 | 1, 8, 8 |
Note. — a) References order: distance, spectral type, . Refs. 1) Gaia Collaboration et al. (2018); 2) Kenyon et al. (2008); 3) Feigelson & Lawson (2004); 4) Bouvier et al. (1999); 5) Bohm & Catala (1993); 6) Herczeg & Hillenbrand (2014); 7) Herbig (1960); 8) Manara et al. (2014); 9) White et al. (1999); 10) Fairlamb et al. (2015); 11) Dunkin et al. (1997); 12) Manara et al. (2017); 13) Furlan et al. (2011); 14) Brown et al. (2012); 15) Sicilia-Aguilar et al. (2020) 16) Luhman et al. (2010); 17) Acke et al. (2005); 18) Pecaut & Mamajek (2016); 19) Torres et al. (2006); 20) Alcalá et al. (2017); 21) Calvet et al. (2004); 22) Natta et al. (2006); 23) Alcala et al. (1993); 24) Espaillat et al. (2010); 25) Kraus et al. (2013); 26) Stempels & Gahm (2004); 27) Bouvier et al. (2013); 28) Garcia Lopez et al. (2006); 29) Mendigutía et al. (2011); 30) Rigliaco et al. (2015); 31) Beck et al. (2012); 32) Wagner et al. (2015); 33) Ingleby et al. (2013); 34) Salyk et al. (2013); 35) Pinilla et al. (2018); 36) (Wagner et al., 2018) 37) Schisano et al. (2009); 38) Willson et al. (2019); 39) Curran et al. (2011).
2.4 NIR excess
To quantify the presence of warm micron-sized dust close to the star, we compute the percentage near-infrared (NIR) following the definition from Pascual et al. (2016). Specifically, we calculate the percentage NIR excess from the de-reddened SED excess as , where and are the flux of the SED and stellar photosphere integrated between 1.2 to 4.5 µm, respectively. As the uncertainty in is dominated by variations in , we determine it by assuming a 1 uncertainty of 0.5 in and propagating errors accordingly. In addition, we classify each disk as a pre-transition disk (PTD), or otherwise a transition disk (TD) using the K-band (2.2 µm) excess of the SED over the stellar photosphere (Espaillat et al., 2007). If magnitudes, the disk is classified as pre-transition, and transition otherwise. The percentage NIR excess and PTD/TD status of each disk are listed in Table 2. Although the comparison is not entirely the same throughout the sample, the threshold for a transition to a pre-transition disk appears to be around a NIR excess of .
3 Analysis
3.1 Inner disk detection and modelling
We detect an inner disk in 18 of the 38 images. A detection is defined as the measurement of a flux at the stellar location above a threshold of 3 times the RMS image noise level. For each of the 18 detections, a Gaussian model is fit using the CASA imfit task. Otherwise, we use 3 times the RMS as the upper limit on the flux for an unresolved inner disk. The results of our inner disk fits and upper limits are given in Table 3, while the RA and Dec. of the inner disks can be found in Table 5 in the Appendix.
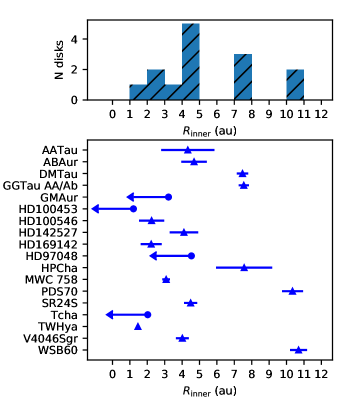
Of the 18 detected inner disks, we are able to resolve 14 of them, and measure the inclination and outer radius of the inner disk (). To determine we measure the half width at half maximum (HWHM) of the Gaussian fit in the resolved case; where unresolved, we assume the inner disk has the same inclination and position angle as the outer disk, and use the semi-major axis of the largest ellipse (i.e., the largest projected inner disk) that would fit into the beam as . The inclinations and position angle of the inner disk are given in Table 4, while the values of scaled to au are listed in Table 3. In Figure 3, we show the distribution of in our sample, which has a mean value of 5 au.
| Name | Inner Flux | Inner Dust Mass | Maj. x Min. | Outer Flux | ||||
|---|---|---|---|---|---|---|---|---|
| (mJy) | (″) | (mJy) | ||||||
| AATau | 0.06 x 0.04 | 44 | 111 | 67 | -1.43 | |||
| ABAur | 0.06 x 0.03 | 156 | 225 | 69 | -1.47 | |||
| CIDA9 | - | - | 29 | 46 | 35 | -2.41 | ||
| CQTau | - | - | 50 | 70 | 147 | -3.48 | ||
| CSCha | - | - | 37 | 72 | 186 | -3.09 | ||
| DMTau | 0.10 x 0.08 | 25 | 137 | 119 | -1.59 | |||
| DoAr44 | - | - | 40 | 88 | 192 | -2.09 | ||
| GGTau AA/Ab | 0.11 x 0.06 | 224 | 258 | 2047 | -2.49 | |||
| GMAur | 0.04 x 0.02 | 40 | 220 | 162 | -2.73 | |||
| HD100453 | 0.03 x 0.02 | 30 | 31 | 200 | -3.09 | |||
| HD100546 | 0.04 x 0.04 | 27 | 99 | 432 | -1.24 | |||
| HD135344B | - | - | 52 | 86 | 200 | -3.36 | ||
| HD142527 | 0.05 x 0.04 | 185 | 245 | 967 | -3.53 | |||
| HD169142 | 0.04 x 0.03 | 26 | 127 | 198 | -2.12 | |||
| HD34282 | - | - | 87 | 227 | 100 | -2.67 | ||
| HD97048 | 0.06 x 0.03 | 63 | 189 | 2344 | -2.33 | |||
| HPCha | 0.09 x 0.08 | 50 | 64 | 66 | -2.68 | |||
| IPTau | - | - | 25 | 31 | 13 | -2.27 | ||
| IRS48 | - | - | 83 | 98 | 173 | -2.71 | ||
| J1604.3-2130 | - | - | 87 | 135 | 262 | -2.72 | ||
| LkCa15 | - | - | 76 | 114 | 252 | -2.73 | ||
| MHO2 | - | - | 28 | 55 | 161 | -2.08 | ||
| MWC 758 | 0.04 x 0.02 | 62 | 102 | 217 | -2.75 | |||
| PDS70 | 0.18 x 0.16 | 74 | 87 | 287 | -2.82 | |||
| PDS99 | - | - | 56 | 81 | 89 | -2.44 | ||
| RXJ1842.9-3532 | - | - | 37 | 73 | 133 | -2.45 | ||
| RXJ1852.3-3700 | - | - | 49 | 74 | 149 | -2.57 | ||
| RYLup | - | - | 69 | 80 | 65 | -3.07 | ||
| RYTau | - | - | 27 | 57 | 271 | -3.00 | ||
| SR21 | - | - | 56 | 66 | 7 | -2.57 | ||
| SR24S | 0.08 x 0.04 | 35 | 42 | 25 | -2.44 | |||
| Sz91 | - | - | 86 | 101 | 46 | -2.97 | ||
| Tcha | 0.08 x 0.08 | 34 | 46 | 17 | -1.82 | |||
| TWHya | 0.03 x 0.02 | 2 | 57 | 1319 | -2.13 | |||
| UXTauA | - | - | 31 | 48 | 161 | -2.36 | ||
| V1247Ori | - | - | 64 | 126 | 259 | -2.87 | ||
| V4046Sgr | 0.11 x 0.06 | 31 | 45 | 248 | -2.83 | |||
| WSB60 | 0.16 x 0.14 | 32 | 72 | 90 | -0.54 |
3.2 Inner disk dust mass
In order to derive the inner disk mass from the millimeter flux, we use the following approach. First, we check the optical depth by estimating the expected flux based on basic radiative transfer calculations, given the stellar luminosity.
In general, the flux density is defined
| (1) |
for distance and assuming the emission originates from an annulus with an inner radius and outer radius .
The specific intensity is defined as
| (2) |
with the optical depth and the Planck equation in the Rayleigh-Jeans approximation:
| (3) |
and the midplane temperature profile with the simplified expression for a passively heated, flared disk in radiative equilibrium (e.g. Chiang & Goldreich, 1997; Dullemond et al., 2001):
| (4) |
with the Stefan-Boltzmann constant, the flaring angle (taken as 0.02) and the stellar luminosity.
For an entirely optically thick disk, , so , and Equation 1 simplifies to:
| (5) |
However, if the emission is optically thin, , and in Equation 2 is defined for a geometrically thin disk as:
| (6) |
with the dust opacity . We thus assume a power law for the dust surface density,
| (7) |
and Eqn 1 then becomes
| (8) |
We then choose the scaling surface density and radius to be evaluated at the outer radius, i.e., and , such that
| (9) |
where is the optical depth at the outer radius.
The flux thus depends primarily on and . For the inner disk, we define the outer radius , and the inner radius as the sublimation radius (Dullemond et al., 2001).
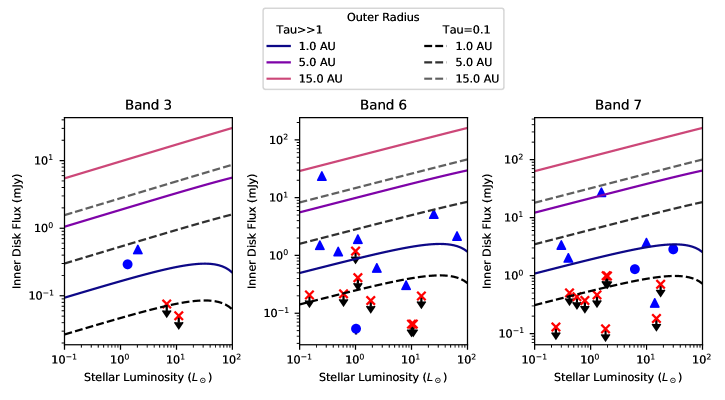
Figure 4 shows the expected flux as function of for both the optically thick and optically thin () case for a range of outer radii in the ALMA bands of our observations. The measured inner disk fluxes are overplotted. In order to assess optical depth, the outer radius () thus needs to be known.
For our data is constrained for 14 targets. For the unresolved inner disks and the non-detections the outer radius is not constrained, but based on the resolved cases (Figure 3), we assume an average outer radius of 5 au for those inner disks. However, Figure 4 shows that the emission remains optically thin for all but 2 disks if =5 au. These disks are WSB 60 and GG Tau, which are resolved with and au, and are thus within the optically thin regime as well.
This means that the mm-dust mass can computed accurately with the optically thin assumption. We note that in this approach using the blackbody approximation we ignore scattering, which might result in an underestimate of the inner disk dust mass (Zhu et al., 2019). However, a full radiative transfer modeling approach is beyond the scope of this study.
The dust mass is defined as
| (10) |
resulting in
| (11) |
using the power law profile in Eqn 7. Now we can express the optically thin flux from Equation 3.2 in terms of the dust mass:
or
| (12) |
where we take as 10 cm2 g-1 at 1000 GHz and use an opacity power-law index of = 1.0 (Beckwith & Sargent, 1991).
In this calculation we assume that there are no significant contributions from free-free emission from ionized gas close to the star from a jet (Snell & Bally, 1986). Considering that most detections are resolved, this suggests that for those disks the main component is originating from thermal dust emission from a disk. Although free-free emission at 9 GHz has been detected for a handful of our targets (Zapata et al., 2017), extrapolation of these fluxes to our observed wavelengths remains highly uncertain. Multi-wavelength observations of the inner disk are required to measure the spectral index, which can rule out contributions of free-free emission. If free-free emission is contributing to our derived fluxes, this implies that even our inner disk masses from detections are upper limits.
3.3 Disk surface density profiles
Using the total flux of the outer and inner disk, we can compute from Equation 11 and 12 for both the outer and inner disk and construct using the parameter , the fractional drop in dust surface density from the inner disk with respect to the outer disk:
For the outer disk, we take = from the azimuthally averaged intensity profile to be representative of the cavity radius. In reality the cavity radius edge is usually more complex than a sharp edge (see e.g. Pinilla et al., 2018) but as we only aim for an approximate profile of compared to the inner disk, this approach is sufficient. Our derived values for are generally within 20% of the literature values of derived using more detailed fitting methods.
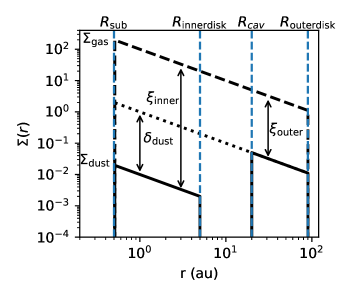
For , we use a curve-of-growth method to measure the radius of the outer disk , in which successively larger photometric apertures are applied until the measured flux is 95% of the total flux. A generic profile is shown in Figure 5, listing the definitions of the different radii and ratios in the disk. The outer disk properties are given in Table 3. We also provide the inclination and position angle of the outer disk in Table 4, taken from the literature where available (references in Table 1). For CS Cha, HP Cha, MHO 2, PDS 99, RXJ1842.9-3532, UX Tau A, and WSB 60 no previous fitting of the outer disk was performed. We estimate the inclination and position angle by fitting a simple Gaussian ring to the outer disk ring (see Appendix).
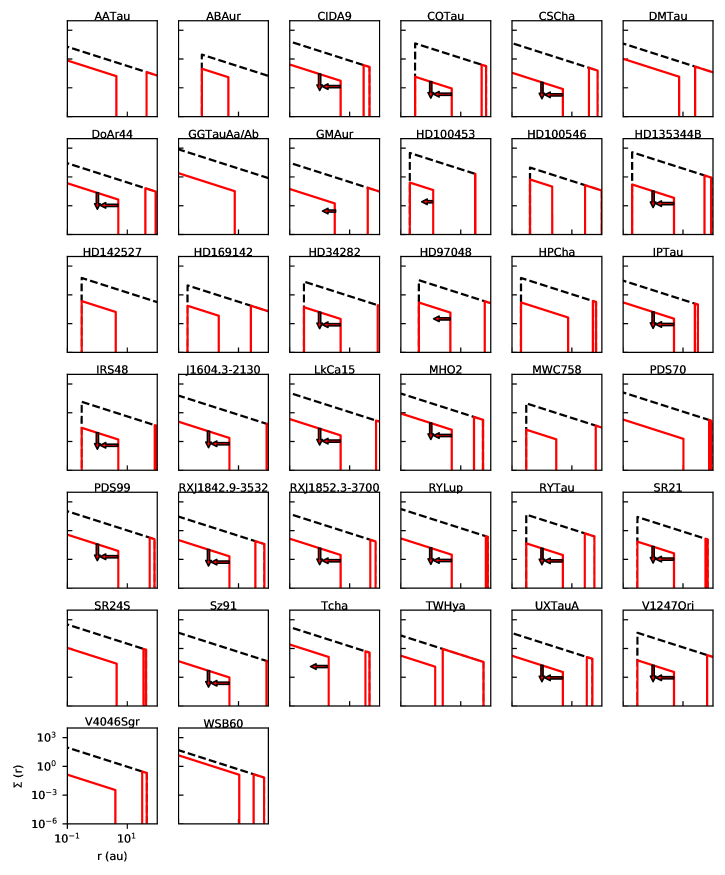
The final profiles are given in Figure 6. For unresolved and undetected fluxes, we provide the profile for the assumption au (arrows indicating that these are upper limits). For all inner disks, the surface density drops by 2 to 3 orders of magnitude compared to the unperturbed surface density profile extrapolated from the outer disk, this drop is quantified as in Table 3.
4 Discussion
4.1 Misalignment between the inner and outer disk
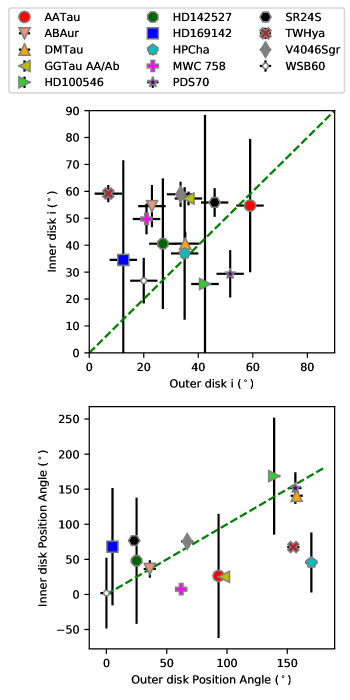
For 14 of 18 disks in our sample, we are able to resolve the inner disks, and thus measure their inclination and position angle and compare with those of the outer disks. For the outer disks, we have either collected the inclination and position angles from the literature or performed a fit to determine them (see Section 3.3 and Table 3). As a variety of techniques are used to determine the outer disk orientation, we conservatively assume an uncertainty of 5 degrees in inclination and position angle of the outer disk. We compare the inclination and position angle of the (resolved) inner and outer disks in Figure 7. In 8 of 14 resolved disks, a significant ( probability) misalignment in either position angle or inclination is found. For the 6 other disks, the error bars are such that alignment cannot be confirmed.
Inner dust disk orientations have also been measured through VLTI observations with PIONIER and GRAVITY in H-band and K-band respectively for a number of Herbig stars (Lazareff et al., 2017; Perraut et al., 2019). The latter have higher S/N due to the higher contrast with the stellar photosphere. Comparing their samples with our inner disk resolved detections we find only limited overlap: HD100546, HD169142, AB Aur and MWC758, where the latter two were only part of the PIONIER survey (Lazareff et al., 2017). Our derived orientations for HD100546 and HD169142 have very large error bars so they are consistent with the GRAVITY results from Perraut et al. (2019). For AB Aur and MWC 758 we find very different values than Lazareff et al. (2017), suggesting that the inner disk might be warped as the millimeter emission is primarily tracing the outer part and the NIR primarily the inner part.
A misalignment between inner and outer disk can be the result of the presence of a companion, which breaks and warps the disk under low viscosity conditions (e.g. Lodato & Facchini, 2013; Facchini et al., 2018; Owen & Lai, 2017) and its detection could be interpreted as indirect evidence for the presence of a massive companion.
In Table 4, we summarize the misalignment found for our detected inner disks, and list other indirect signatures of a misaligned inner disk where known for our sample. These indirect signatures include shadows on the outer disk seen in scattered light, deviations from a Keplerian velocity pattern in the CO gas motion, and a ”dipper” host star which shows aperiodic/quasiperiodic dimming episodes that may be due to extinction by an edge-on inner disk (in contrast to a more face-on outer disk). As several of our disks have poorly constrained inclination or position angle and not every disk has been surveyed for indirect signatures of misalignment, we only indicate with a ’Y’ if a signature of misalignment is known in the literature.
Of the 8 objects in our sample with an indirect signature of a misaligned inner disk, we detect an inner disk in 5 cases (AA Tau, HD100453, HD100546, HD142527, MWC 758), although the inclination and position angle are poorly constrained except for MWC 758, which shows a robust misalignment in the mm inner disk. In DoAr44 and J1604.3-2130 where we do not detect an inner disk but indirect signatures of misalignment are known, we have upper limits on the dust mass of and respectively. This may simply be due to a lack of sensitivity in these observations, as other disks in our sample are detected with masses as low as (e.g. MWC 758). Furthermore, a recent study of the light curve of the J1604.3-2130 dipper (Sicilia-Aguilar et al., 2019) found that only () was required to reproduce the observed eclipses, well below the detection limits in the ALMA observations. Overall, a misaligned disk may be present in 12 of 18 of our detected disks, and none of our resolved objects can be confirmed to be not misaligned. This suggests that misaligned disks at a few AU scales are common in transition disks, and a plausible way to explain outer disk shadows and CO warps. Previous ALMA observations of dipper star outer disks (Ansdell et al., 2016a, 2019) have shown that the outer disks of dipper stars have an isotropic inclination distribution, requiring frequent misalignment of the inner disk to bring it close to edge-on, or mechanisms to reproduce the dipper behaviour which do not require an edge-on disk. The high frequency of misaligned inner and outer disks in our sample thus suggests that dipper star light curves are best modelled with mechanisms requiring an edge-on inner disk. We emphasize that dippers are a special case of misalignment, i.e. where the inner disk ends up in an edge-on orientation obscuring the star, whereas a much larger fraction of possible misalignments would not result in obscurations of the star and dipper behaviour.
One other explanation for apparent misalignment of the inner disk in the millimeter is that we are not measuring inner disk dust emission, but free-free emission from a jet which is perpendicular to the protoplanetary disk. This has been proposed to explain the emission morphology of JVLA 3.3 cm emission in the inner part of the AB Aur disk (Rodríguez et al., 2014). High angular resolution observations at centimeter wavelengths are required to reliably distinguish between jets and inner dust disks. However, indirect evidence of misaligned inner disks, such as shadows, dippers and warps in the kinematics which have been found in many of our targets support the interpretation of misaligned inner disks over jets in several disks already.
| Name | Inner Disk? | Inner i, PA | Outer i, PA | Mis. i | Mis. PA | Shadows | CO Warp | Dipper | Ref. | ||
|---|---|---|---|---|---|---|---|---|---|---|---|
| (∘) | (∘) | (∘) | (∘) | ||||||||
| AATau | Y | 59 | 93 | - | - | - | Y | Y | -,6,12 | ||
| ABAur | Y | 23 | 36 | Y | - | - | - | - | |||
| CIDA9 | N | - | - | 46 | 103 | - | - | - | - | - | |
| CQTau | N | - | - | 35 | 55 | - | - | - | - | - | |
| CSCha | N | - | - | 8 | 161 | - | - | - | - | - | |
| DMTau | Y | 35 | 158 | - | - | - | - | - | |||
| DoAr44 | N | - | - | 20 | 30 | - | - | Y | - | - | 1,-,- |
| GGTau AA/Ab | Y | 36 | 98 | Y | Y | Y | - | - | 2,-,- | ||
| GMAur | Y | - | - | 53 | 56 | - | - | - | - | - | |
| HD100453 | Y | - | - | 30 | 149 | - | - | Y | Y | - | 3,7,- |
| HD100546 | Y | 42 | 139 | - | - | - | Y | - | -,8,- | ||
| HD135344B | N | - | - | 12 | 62 | - | - | - | - | - | |
| HD142527 | Y | 27 | 25 | - | - | Y | Y | - | 4,9,- | ||
| HD169142 | Y | 12 | 5 | - | - | - | - | - | |||
| HD34282 | N | - | - | 59 | 117 | - | - | - | - | - | |
| HD97048 | Y | - | - | 41 | 4 | - | - | - | - | - | |
| HPCha | Y | 37 | 162 | - | Y | - | - | - | |||
| IPTau | N | - | - | 45 | 173 | - | - | - | - | - | |
| IRS48 | N | - | - | 50 | 100 | - | - | - | - | - | |
| J1604.3-2130 | N | - | - | 6 | 80 | - | - | Y | Y | Y | 5,10,13 |
| LkCa15 | N | - | - | 55 | 60 | - | - | - | - | - | |
| MHO2 | N | - | - | 38 | 120 | - | - | - | - | - | |
| MWC 758 | Y | 21 | 62 | Y | Y | - | Y | - | |||
| PDS70 | Y | 52 | 157 | Y | - | - | - | - | |||
| PDS99 | N | - | - | 55 | 107 | - | - | - | - | - | |
| RXJ1842.9-3532 | N | - | - | 32 | 30 | - | - | - | - | - | |
| RXJ1852.3-3700 | N | - | - | 30 | 124 | - | - | - | - | - | |
| RYLup | N | - | - | 67 | 109 | - | - | - | - | - | |
| RYTau | N | - | - | 65 | 23 | - | - | - | - | - | |
| SR21 | N | - | - | 16 | 14 | - | - | - | - | - | |
| SR24S | Y | 46 | 23 | - | Y | - | - | - | |||
| Sz91 | N | - | - | 45 | 17 | - | - | - | - | - | |
| Tcha | Y | - | - | 73 | 113 | - | - | - | - | - | |
| TWHya | Y | 7 | 155 | Y | Y | - | - | - | |||
| UXTauA | N | - | - | 40 | 167 | - | - | - | - | - | |
| V1247Ori | N | - | - | 30 | 115 | - | - | - | - | - | |
| V4046Sgr | Y | 34 | 67 | Y | - | - | - | - | |||
| WSB60 | Y | 28 | 172 | - | - | - | - | - | |||
Note. — Reference order: Shadows, CO Warp, dipper. The misalignment between the inner and outer disk was derived in this work. Refs. 1) Casassus et al. (2018); 2 Brauer et al. (2019); 3) Benisty et al. (2017); 4) Marino et al. (2015); 5) Pinilla et al. (2018); CO Warps: 6) Loomis et al. (2017); 7) van der Plas et al. (2019); 8) Walsh et al. (2017); 9) Casassus et al. (2013); 10) Mayama et al. (2018); 11) Boehler et al. (2018); Dippers: 12) Bouvier et al. (1999, 2007); 13) Sicilia-Aguilar et al. (2019).
4.2 NIR vs millimeter emission
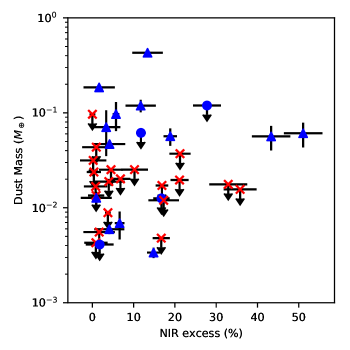
Traditionally, the presence of an inner disk has been assessed using the NIR excess in the SED. A plot of our derived inner disk dust mass against percentage NIR excess is shown in Figure 8. No clear correlation is apparent from the data. Using the linear regression procedure of Kelly (2007), which takes into account upper limits and intrinsic scatter in the data, we find no significant correlation between these properties: the correlation coefficient . The NIR excess (and similarly, the PTD/TD classification by the value) is thus not necessarily a reliable measure of the presence of a inner mm-dust disk. This can be understood as the two wavelengths are tracing different regimes: whereas the NIR emission is primarily originating from micron-sized grains at the hot inner dust wall, the millimeter emission is dominated by the millimeter-sized dust grains in the outer part of the inner disk, which can be several au in radius. The lack of correlation suggests that many of the inner mm-dust disks are actually inner rings, with an inner radius well beyond the sublimation radius (and thus no longer detected in the NIR). This applies in particular to those systems with a detected inner disk in the millimeter but low NIR excess (): DM Tau, V4046 Sgr, GM Aur, PDS 70, and TW Hya.
The lack of correlation between dust mass and NIR excess also appears to contradict some of the results by Banzatti et al. (2018) on their interpretation of rovibrational lines of Herbig disks. They find that low NIR excess correlates with large inner CO radii, sub-solar metallicity and higher CO excitation levels (), which they interpret as full clearing of the inner dust disk within the planet’s orbit. They also identify a second category of disks with high NIR excess, smaller CO radii, solar metallicity and lower CO excitation levels, interpreted as a massive inner disk inside the planet’s orbit. Based on these results, they propose a dichotomy in the presence or absence of inner disk. Comparing their sample with our observed Herbig stars, we have 9 overlapping targets. We detect millimeter-dust inner disks in 4 out of 5 high NIR disks, consistent with massive inner disks. However, we also detect mm-dust inner disks in 3 out of 4 of the low NIR disks, with outer radii well within their derived inner CO radii (). The derived dust masses for each category are not showing a dichotomy. Whereas the lower NIR excess implies that the of the inner disk is beyond the sublimation radius (potentially caused by another close-in planet), our results contradict the proposed scenario where no dust is present inside the line.
4.3 Dust depletion in the inner disk
From the dust surface density profiles in Figure 6 it is clear that the dust surface density drops by more than an order of magnitude in the inner disk compared to the outer disk. In Figure 9, we compare the fractional drop from Section 3.3 across the sample.
All of the disks in our sample have a , with a median of , indicating significant dust depletion relative to the outer disk. As our sample covers a wide range of disk properties, this implies that the mechanism responsible for the dust depletion operates rapidly, on timescales shorter than the lifetimes of the youngest disks.
Furthermore, the value of remains constant across a range of accretion rates: we see no anti-correlation () of with accretion rate, consistent with the millimeter-grains being decoupled from the accreting gas.
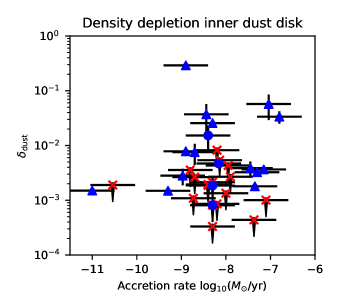
These two effects (rapid dust depletion and decoupling of dust from the gas) can be explained by rapid initial radial drift in the inner disk, when separated from the outer disk. In a smooth, continuous disk, millimeter grains move at sub-keplerian velocities, and consequently feel a headwind that causes them to rapidly drift toward the star and sublimate (Weidenschilling, 1977). However, both embedded planets and instabilities (e.g. dead zones) can create pressure bumps in the outer part of the disk which limits the inward drift of millimeter grains to the location of the pressure bump (Pinilla et al., 2012), provided a low value of the viscosity parameter . This results in a pile-up of mm grains at the pressure bump, and a rapid inward radial drift of millimeter grains in the inner disk which can not be replenished due to a cutoff of the flow of dust grains from the outer disk. Smaller dust grains may continue to flow through the gap after the outer pressure bump has been established, and grow to larger sizes again in the inner disk through coagulation, but for a sufficiently massive planet even the smallest dust grains cannot flow inwards any more. Inward drift results in depletion of mm-dust of the inner disk as dust grains may either sublimate at the sublimation radius or grow to large pebbles and rocks.
4.4 Inner disk size
.
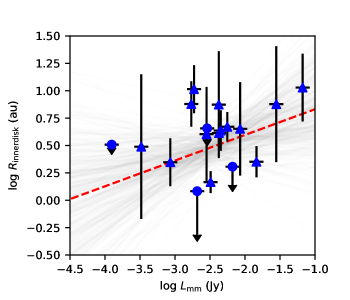
Protoplanetary dust disks have been found to follow a continuum size - luminosity relation, demonstrating that the amount of emission scales linearly with the emitting surface area (Tripathi et al., 2017; Andrews et al., 2018a). This correlation could be reproduced by dust evolution models in the regime dominated by radial drift rather than fragmentation (Rosotti et al., 2019a). For our sample of inner disks, we check if the same correlation exists.
In Figure 10 we present the relationship between continuum size (represented by ) and the millimeter luminosity, which is the millimeter flux of the inner dust disk, scaled to a distance of 140 pc and a frequency of 340 GHz for a spectral index =2.5 (similar to Andrews et al. (2018a)). We only include the detections in this plot, although several values of are upper limits when the inner disk is unresolved. The linear regression procedure mentioned before shows a moderate correlation with , with a linear relation:
| (13) |
with best-fit parameters and . Although the error bars are much larger, this is only slightly offset but with a slope that is consistent with the results of Andrews et al. (2018a) for a sample of more than 100 protoplanetary disks, who find and for this relation. This implies that inner dust disks as isolated systems are susceptible to radial drift and follow a similar morphology as full disks.
.
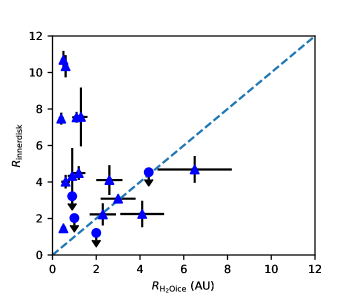
Second, we compare the outer radius of the inner dust disk with the location of the water snowline in each system in Figure 11. The water snowline is defined as the radius where the temperature drops below the freeze-out temperature of H2O, which is taken as 14015 K (Zhang et al., 2015). The snowline radius is computed from Equation 4 using the stellar luminosity. For the majority of the disks the outer radius of the dust disk is well outside the snowline. For a handful of the targets the radius is similar (within 1 au).
The snowline is thought to affect the dynamics of the dust particles because grains without ice mantles are expected to stick less efficiently and therefore the fragmentation velocity (velocity threshold from destructive collisions) decreases inside the snowline (e.g. Birnstiel et al., 2010). Right outside the snowline, the dust growth is still set by the radial drift. Pinilla et al. (2016) ran a series of dust evolution simulations for a range of companion masses to quantify the dust growth in the inner disk. They found that for a low-mass companion (1 MJup), the inner mm-dust disk remains large even after 5 Myr as dust in the inner disk gets replenished through the gap. However, for a high-mass companion (5 MJup) the inner mm-dust disk eventually shrinks due to radial drift as no dust flows through the gap. In the latter case, the micron-sized grains inside the snow line also disappear.
Since we find mm-dust well beyond the snowline for several of our targets, this implies that either the dust flow has only recently been cut off and radial drift has not fully shrunk the inner dust disk yet, or the mass of the companion is low enough to allow replenishment of the inner dust disk. It is also possible that the snowline location cannot be described by a simple power-law for the temperature relation. More detailed dust evolution modeling of the effect of the snowline and the possible companion masses is required to fully test this phenomenon.
4.5 Gas content of the inner disks
The lack of correlation in Figure 9 implies a decoupling of the mm grains and gas. We can test this further by assuming instead that there is no decoupling, and comparing the inferred gas content of the inner disk with the accretion rate. Assuming a standard ISM gas to dust ratio, we compare the dust mass and accretion rate in Figure 12, and overplot the resulting timescale for the gas and dust content of the inner disk to accrete onto the star. Similar to Figure 9, no correlation appears to be present (), which is again consistent with decoupling of the mm grains and accreting gas. Secondly, we find that the lifetimes of most inner disks are relatively short compared to the lifetime of the disk, typically less than yr, assuming an ISM gas-to-dust ratio of 100.
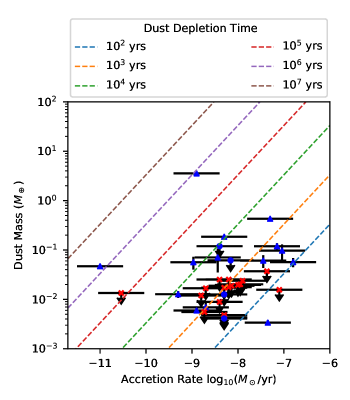
Given the high occurrence rate of inner disks in our sample, a short lifetime would require that the inner disk is regularly replenished by episodes of enhanced accretion from the outer disk. However, depletion of dust in the inner disk due to radial drift such as suggested in the previous section may cause the gas to dust ratio of the inner disk to be several orders of magnitude larger (Pinilla et al., 2012), implying proportional longer lifetimes. While we do not have a direct measurement of gas content of the inner disk to assess this scenario, viscous accretion disk theory predicts a link between the gas surface density, accretion rate and viscosity which we can use to estimate the gas content. We assume the following relations:
| (14) | |||
with the disk viscosity, the viscosity parameter, the sound speed, the vertical height, the angular velocity, the Boltzmann constant, the mean molecular weight, the proton mass, the gravitational constant and the stellar mass. The third equation assumes that the disk is vertically isothermal. These equations result in a relation between the gas surface density and the accretion rate (Manara et al., 2014):
| (15) |
The gas surface density profile is derived from the dust profile with and the gas-to-dust ratio for inner and outer disk, respectively:
while for the temperature profile we use Eqn 4. This means that we can express the gas-to-dust ratio :
| (16) |
with
| (17) |
and equivalently, we can express viscosity as:
| (18) |
We note that both quantities and are independent of and can be evaluated at any radius, and we can compute either quantity while keeping the other one fixed. We are thus able to evaluate various assumptions about the values of , , and to determine whether the gas to dust ratio is enhanced in the inner disk.
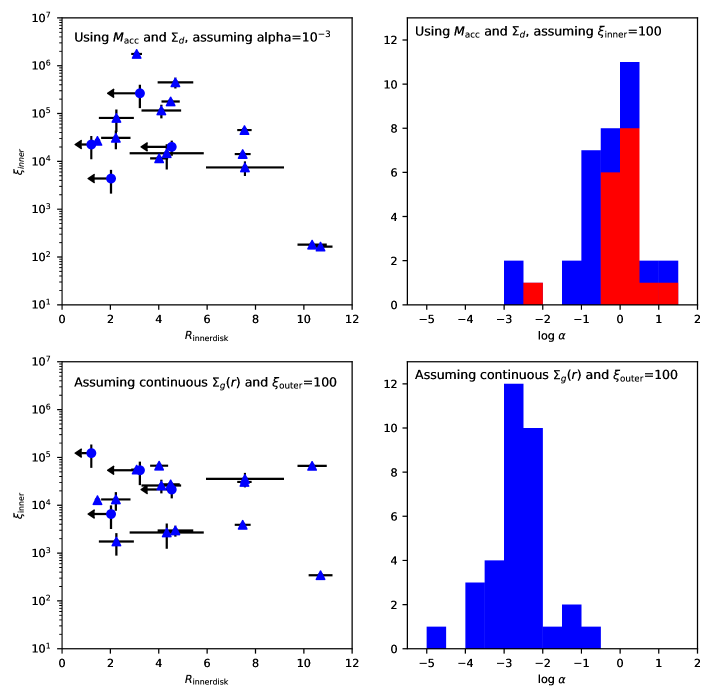
In the top-left panel of Figure 13 we use Equation 16 to calculate for a low =10-3, and find gas-to-dust ratios of for the majority of the (detected) disks. The non-detections are left out of this plot for clarity, but their limits indicate as well. For lower values of , the inferred gas-to-dust ratios would be even larger, while larger values of are unable to produce a mm dust trap such as observed in the outer disk in these images (Pinilla et al., 2012). If the gas to dust ratios are indeed times larger than the ISM ratio of 100, the disk lifetimes in Figure 12 may also be two orders of magnitude larger, and replenishment is no longer needed to explain the high occurrence rates of inner disks in our sample.
We notice that the two disks with a lower ratio of 100 are the largest inner dust disks in the sample, PDS 70 and WSB 60. In these cases, a gap has possibly been opened only recently, and the mm grains have not yet had time to drift toward the star and sublimate. These two disks also lie well above the size-luminosity correlation in Figure 10, implying they are not subject to the radial drift regime which has been used to explain this correlation. The low fraction of 2/38 (assuming all non-detections are smaller and fainter disks) is consistent with rapid initial radial drift. The typical drift time scale for millimeter-sized particles is years for typical disk conditions at 1 au (Birnstiel et al., 2010).
If we instead assume an ISM-like of 100, we find the values of most disks in our sample would be 1 (see top right panel of Figure 13), which is completely unphysical for a viscous accretion disk. Alternatively, if we assume a of 100, and a continuous profile across the entire disk, , and can be computed using in Equation 18. The two lower panels of 13 show that our is enhanced by two orders of magnitude or more relative to the outer disk, and suggests is low for most disks, which is again compatible with the expectations of dust drift. We note that the values of in this case are also comparable to values when computed from the accretion rate from the top panel. The ratio between these two values may represent the gas depletion in the inner part of the disk due to accretion, and thus the evolutionary stage, but due to the large uncertainties and assumptions in our derivation of the gas surface we do not attempt to estimate these ages.
The previous arguments suggest that the inner disk is dust depleted (or equivalently, is enhanced) relative to the outer disk for a low disk. Gas-to-dust ratios of are also found in the inner disks in dust evolution models with planet-disk interaction due to radial drift (Pinilla et al., 2012).
However, in recent years the -disk model has become a topic of debate, as the measured turbulence in disks is very low (Flaherty et al., 2017, 2018), and inclusion of non-ideal MHD effects in disk evolution models has been shown to suppress the viscous spreading (e.g. Bai, 2016). This would imply a =100 is possible (but not required), and that the inner disks are may indeed be short-lived structures, as shown in section 3.2, and thus replenishment of the inner disk by enhanced accretion episodes is required to explain the high occurrence in our sample. If replenishment is occurring, the accreting material must flow at speeds near the free-fall velocity (Rosenfeld et al., 2014) to be consistent with the measured low gas surface densities in the gaps of transition disks (van der Marel et al., 2016).
In order to distinguish between the possibilities, more direct measurements of the gas content of the inner disk are required. Either spatially resolved ALMA observations of CO isotopologues or near infrared observations of rovibrational molecular lines with the James Webb Space Telescope or thirty-meter class telescopes may help to constrain the gas content in the inner disk. However, both chemistry and excitation conditions in the inner disk are poorly understood, so interpretation of these data will remain challenging.
4.6 Consequences for the presence of companions
All of our inner disks show significant depletion in dust surface density relative to the outer disks (Figure 9), and if the inner disks are well described by an -disk model, they must also have a low and high . These features are expected if a giant () planet traps mm grains outside its orbit, while mm grains within the inner disk rapidly drift towards the star and sublimate (Pinilla et al., 2012; Dong et al., 2015). In principle, constraints on the mass and location of the conjectured planets can be placed based on the depth and width of the gap in the gas surface density (Dong & Fung, 2017). However, since our study only resolves the dust whose structure is regulated by a combination of planet-disk interaction and radial drift, our results cannot be used to derive properties of embedded planets. Spatially resolved measurements of the gas surface density of molecular tracers from either ALMA or NIR rovibrational lines are required.
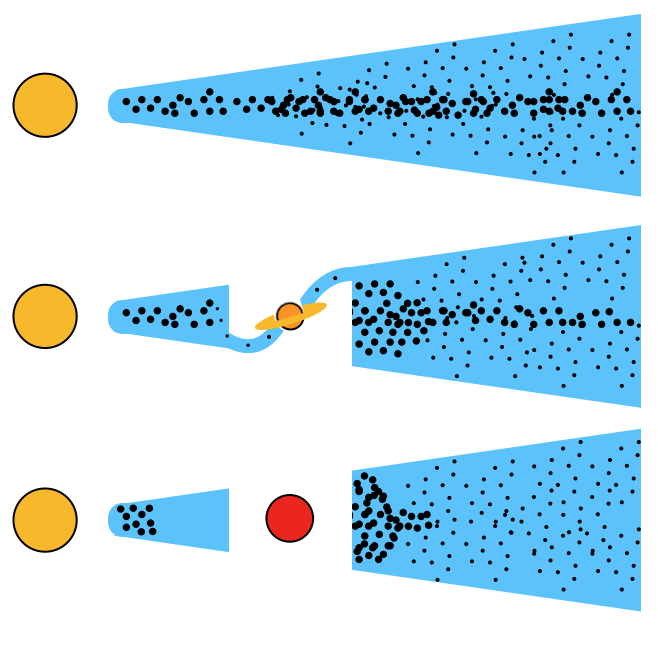
The only disk in our sample confirmed to host an embedded planet 111A second planet in the gap, PDS 70c, has recently been detected in H emission (Haffert et al., 2019). is PDS70 (PDS70b, , au) (Keppler et al., 2018; Müller et al., 2018). Six other disks in our sample (HD135344B, HD142527, HD97048, MWC 758, UXTauA, and HD100453) have been observed in H emission with sufficient contrast to redetect PDS 70b, but no planet candidates have been detected (Zurlo et al., 2020). PDS 70b is located just outside the detected inner disk, which is larger ( au) and has a lower () than most other disks in the sample (Figure 13, upper left). We propose the hypothesis that PDS 70b has only recently formed and opened a gap in the disk, such that the supply of dust grains to the inner disk is not yet fully cut off, and the inward drift of mm grains has yet to significantly reduce the size of the inner disk (see schematic representation in Figure 14). This could also explain why a planet has been detected in the PDS 70 disk, but not in other transition disks where searches have been conducted with similar sensitivity (e.g. Maire et al., 2017; Langlois et al., 2018; Ligi et al., 2018): PDS 70b is young and actively accreting, and thus it is significantly brighter and has a visible circumplanetary disk.
The WSB 60 disk in our sample is also an outlier with a large au inner disk and inferred of . WSB60 is thus similar to PDS 70 and an excellent candidate for direct imaging searches. However, WSB 60 is optically faint and considering the dust cavity radius of 30 au the planet is likely much further in than for PDS 70, which may make direct imaging challenging.
This hypothesis also suggests the possibility of an evolutionary connection between transition disks and some of the observed ring disks (e.g. DSHARP, Andrews et al., 2018b; van der Marel et al., 2019), where several disks show a bright inner disk surrounded by one or more wide dust gaps, e.g. HD143006, SR4 or Elias 24. Perhaps in these systems a planet was only recently formed, and the inner dust disk has not started to deplete as material continues to flow through the gap. This would lead to a natural evolutionary connection between ring disks and transition disks such as previously suggested (van der Marel et al., 2018).
Other than the consequences for wide orbit companions, our results can also constrain the presence of close-in companions at a few au orbital distances. Several of the disks in our sample have a low NIR excess but a detected mm disk (Section 4.2, DM Tau, V4046 Sgr, GM Aur, PDS 70, and TW Hya.), suggesting an inner ring rather than an inner disk. This may be caused by clearing of the inner disk by an unseen companion planet or star in the very inner part of the disk. Of these disks, V4046 Sgr is known to be a spectroscopic equal-mass binary with a separation of only 0.045 au (Stempels & Gahm, 2004; Rosenfeld et al., 2013), while the others may contain yet undiscovered planets or low-mass stars within a few au.
Two of the detected inner disks in our sample are likely circumprimary disks within a multiple star system. HD142527 ( au) is known to have a binary M-star (mass ratio 0.2) companion at a highly eccentric orbit, with semi-major axes ranging from 26 to 50 au (Lacour et al., 2016). GG Tau A is in fact a triple system with a separation of 0.25” or 35 au between the Aa and Ab components (White et al., 1999) where Ab consists of Ab1 and Ab2 at a separation of 5 au (Di Folco et al., 2014). The B companion is located 10” south (Leinert et al., 1993) and is less relevant for the study of the disk around GG Tau A. Our detected inner disk is located around the Aa component with a radius of au, consistent with truncation by the Ab companion, and an inclination angle of , consistent with shadowing observed on the outer disk (Brauer et al., 2019).
5 Conclusions
In this study, we have collected ALMA archival continuum observations of 38 transition disks with resolved dust cavities, for which we have measured the size and dust mass of the inner disk, or placed upper limits. We have also constructed dust surface density profiles of the inner and outer disk from the ALMA data, measured the NIR excess from archival photometry, and compared the results with stellar properties and accretion rates from the literature. Our main findings are as follows:
-
•
At least 18 of 38 transition disks in our sample host an inner dust disk, 14 of which are resolved with a mean radius of au. As our sensitivity is extremely non-uniform across the sample, this is likely an underestimate of the occurrence rate of inner disks.
-
•
Of our 14 resolved inner disks, 8 have misalignments in inclination and position angle compared with the outer disk. The other 4 have detected inner disks where CO warps, outer disk shadows, or a dipper host star suggest a misaligned inner disk, which is an indicator of massive giant companions.
-
•
The NIR excess in the SED is uncorrelated with the dust mass of the inner disk, suggesting that the NIR excess is not a reliable measure of the presence of a mm dust inner disk, and that some of our dust disks are in fact dust rings.
-
•
The dust surface density of all our inner disks is depleted relative to the outer disk, with a median depletion of . As our sample spans a wide range of disk properties, this suggests the mechanism responsible for depletion operates on timescales shorter than the lifetimes of the youngest disks.
-
•
The continuum size-luminosity correlation found in protoplanetary disks is reproduced for the inner dust disks in our sample, indicating that the dust is in the regime dominated by radial drift.
-
•
If our inner disks are well described by a viscous disk model, we find a low () and high gas-to-dust ratio () for the inner disk, which implies trapping of mm grains in the outer disk and depletion of mm grains by radial drift in the inner disk.
-
•
Alternatively, if the inner disk is poorly described by viscous disk theory, the inner disk gas to dust ratio may be low, implying that lifetimes of the inner disk are short ( yr), and periods of enhanced accretion from the outer disk with high speed radial flows of gas through the gap are required to explain the high frequency of inner disks.
-
•
In the -disk scenario, the depletion and dust trapping seen in the outer and inner disks respectively is well explained by dust evolution models of planet-disk interaction models involving embedded giant planets.
-
•
The only disk with a confirmed planet in our sample, PDS 70, has an inner disk with a large size and an implied low gas-to-dust ratio. This may be explained if the gap has only been opened by the planet recently. We propose a hypothesis that PDS 70 has been the only embedded planet detection to date due to its recent formation, implying material flowing through the gap, active accretion and a bright circumplanetary disk.
6 Acknowledgements
We thank the anonymous referee for a careful review and Doug Johnstone, Ruobing Dong, Jeffrey Fung, Carlo Manara, Paola Pinilla, Giovanni Rosotti and Takayuki Muto for useful discussions. N.M. acknowledges support from the Banting Postdoctoral Fellowships program, administered by the Government of Canada. This research was enabled in part by support provided by Compute Canada.
The National Radio Astronomy Observatory is a facility of the National Science Foundation operated under agreement by the Associated Universities, Inc.
ALMA is a partnership of ESO (representing its member states), NSF (USA) and NINS (Japan), together with NRC (Canada) and NSC and ASIAA (Taiwan) and KASI (Republic of Korea), in cooperation with the Republic of Chile. The Joint ALMA Observatory is operated by ESO, AUI/ NRAO and NAOJ. This paper makes use of the following ALMA data: 2011.1.00399.S, 2012.1.00129.S, 2012.1.00158.S, 2012.1.00631.S, 2012.1.00761.S, 2013.1.00100.S, 2013.1.00198.S, 2013.1.00498.S, 2013.1.01070.S, 2015.1.00192.S, 2015.1.00224.S, 2015.1.00678.S, 2015.1.00686.S, 2015.1.00888.S, 2015.1.00889.S, 2015.1.00979.S, 2015.1.00986.S, 2015.1.01083.S, 2015.1.01207.S, 2015.1.01301.S, 2016.1.00344.S, 2016.1.00629.S, 2016.1.00826.S, 2016.1.01042.S, 2016.1.01164.S, 2016.1.01205.S, 2016.A.00026.S, 2017.1.00449.S, 2017.1.00492.S, 2017.1.00884.S, 2017.1.00969.S, 2017.1.01151.S, 2017.1.01167.S, 2017.1.01404.S, 2017.1.01424.S, 2017.1.01460.S, 2017.1.01578.S, 2017.A.00006.S.
References
- Acke et al. (2005) Acke, B., van den Ancker, M. E., & Dullemond, C. P. 2005, A&A, 436, 209, doi: 10.1051/0004-6361:20042484
- Alcala et al. (1993) Alcala, J. M., Covino, E., Franchini, M., et al. 1993, A&A, 272, 225
- Alcalá et al. (2014) Alcalá, J. M., Natta, A., Manara, C. F., et al. 2014, A&A, 561, A2, doi: 10.1051/0004-6361/201322254
- Alcalá et al. (2017) Alcalá, J. M., Manara, C. F., Natta, A., et al. 2017, A&A, 600, A20, doi: 10.1051/0004-6361/201629929
- Andrews et al. (2018a) Andrews, S. M., Terrell, M., Tripathi, A., et al. 2018a, ApJ, 865, 157, doi: 10.3847/1538-4357/aadd9f
- Andrews et al. (2011) Andrews, S. M., Wilner, D. J., Espaillat, C., et al. 2011, ApJ, 732, 42, doi: 10.1088/0004-637X/732/1/42
- Andrews et al. (2016) Andrews, S. M., Wilner, D. J., Zhu, Z., et al. 2016, ApJ, 820, L40, doi: 10.3847/2041-8205/820/2/L40
- Andrews et al. (2018b) Andrews, S. M., Huang, J., Pérez, L. M., et al. 2018b, ApJ, 869, L41, doi: 10.3847/2041-8213/aaf741
- Ansdell et al. (2016a) Ansdell, M., Gaidos, E., Williams, J. P., et al. 2016a, MNRAS, 462, L101, doi: 10.1093/mnrasl/slw140
- Ansdell et al. (2016b) Ansdell, M., Williams, J. P., van der Marel, N., et al. 2016b, ApJ, 828, 46, doi: 10.3847/0004-637X/828/1/46
- Ansdell et al. (2018) Ansdell, M., Williams, J. P., Trapman, L., et al. 2018, ApJ, 859, 21, doi: 10.3847/1538-4357/aab890
- Ansdell et al. (2019) Ansdell, M., Gaidos, E., Hedges, C., et al. 2019, arXiv e-prints, arXiv:1912.01610. https://arxiv.org/abs/1912.01610
- Astropy Collaboration et al. (2013) Astropy Collaboration, Robitaille, T. P., Tollerud, E. J., et al. 2013, A&A, 558, A33, doi: 10.1051/0004-6361/201322068
- Bai (2016) Bai, X.-N. 2016, ApJ, 821, 80, doi: 10.3847/0004-637X/821/2/80
- Banzatti et al. (2018) Banzatti, A., Garufi, A., Kama, M., et al. 2018, A&A, 609, L2, doi: 10.1051/0004-6361/201732034
- Banzatti & Pontoppidan (2015) Banzatti, A., & Pontoppidan, K. M. 2015, ApJ, 809, 167, doi: 10.1088/0004-637X/809/2/167
- Baraffe et al. (2015) Baraffe, I., Homeier, D., Allard, F., & Chabrier, G. 2015, A&A, 577, A42, doi: 10.1051/0004-6361/201425481
- Beck et al. (2012) Beck, T. L., Bary, J. S., Dutrey, A., et al. 2012, ApJ, 754, 72, doi: 10.1088/0004-637X/754/1/72
- Beckwith & Sargent (1991) Beckwith, S. V. W., & Sargent, A. I. 1991, ApJ, 381, 250, doi: 10.1086/170646
- Benisty et al. (2017) Benisty, M., Stolker, T., Pohl, A., et al. 2017, A&A, 597, A42, doi: 10.1051/0004-6361/201629798
- Birnstiel et al. (2010) Birnstiel, T., Dullemond, C. P., & Brauer, F. 2010, A&A, 513, A79, doi: 10.1051/0004-6361/200913731
- Boehler et al. (2018) Boehler, Y., Ricci, L., Weaver, E., et al. 2018, ApJ, 853, 162, doi: 10.3847/1538-4357/aaa19c
- Bohm & Catala (1993) Bohm, T., & Catala, C. 1993, A&AS, 101, 629
- Bouvier et al. (2013) Bouvier, J., Grankin, K., Ellerbroek, L. E., Bouy, H., & Barrado, D. 2013, A&A, 557, A77, doi: 10.1051/0004-6361/201321389
- Bouvier et al. (1999) Bouvier, J., Chelli, A., Allain, S., et al. 1999, A&A, 349, 619
- Bouvier et al. (2007) Bouvier, J., Alencar, S. H. P., Boutelier, T., et al. 2007, A&A, 463, 1017, doi: 10.1051/0004-6361:20066021
- Brauer et al. (2019) Brauer, R., Pantin, E., Di Folco, E., et al. 2019, A&A, 628, A88, doi: 10.1051/0004-6361/201935966
- Brown et al. (2012) Brown, J. M., Herczeg, G. J., Pontoppidan, K. M., & van Dishoeck, E. F. 2012, ApJ, 744, 116, doi: 10.1088/0004-637X/744/2/116
- Calvet et al. (2004) Calvet, N., Muzerolle, J., Briceño, C., et al. 2004, AJ, 128, 1294, doi: 10.1086/422733
- Casassus et al. (2018) Casassus, S., X, T., X, S., & X, E. F. 2018, MNRAS in press
- Casassus et al. (2013) Casassus, S., van der Plas, G., M, S. P., et al. 2013, Nature, 493, 191, doi: 10.1038/nature11769
- Castelli & Kurucz (2004) Castelli, F., & Kurucz, R. L. 2004, ArXiv Astrophysics e-prints
- Cazzoletti et al. (2018) Cazzoletti, P., van Dishoeck, E. F., Pinilla, P., et al. 2018, A&A, 619, A161, doi: 10.1051/0004-6361/201834006
- Chiang & Goldreich (1997) Chiang, E. I., & Goldreich, P. 1997, ApJ, 490, 368
- Cieza et al. (2019) Cieza, L. A., Ruíz-Rodríguez, D., Hales, A., et al. 2019, MNRAS, 482, 698, doi: 10.1093/mnras/sty2653
- Cox et al. (2017) Cox, E. G., Harris, R. J., Looney, L. W., et al. 2017, ApJ, 851, 83, doi: 10.3847/1538-4357/aa97e2
- Curran et al. (2011) Curran, R. L., Argiroffi, C., Sacco, G. G., et al. 2011, A&A, 526, A104, doi: 10.1051/0004-6361/201015522
- Currie et al. (2019) Currie, T., Marois, C., Cieza, L., et al. 2019, ApJ, 877, L3, doi: 10.3847/2041-8213/ab1b42
- Di Folco et al. (2014) Di Folco, E., Dutrey, A., Le Bouquin, J.-B., et al. 2014, A&A, 565, L2, doi: 10.1051/0004-6361/201423675
- Dong & Fung (2017) Dong, R., & Fung, J. 2017, ApJ, 835, 146, doi: 10.3847/1538-4357/835/2/146
- Dong et al. (2018) Dong, R., Liu, S.-y., & Fung, J. 2018, ArXiv e-prints. https://arxiv.org/abs/1811.09629
- Dong et al. (2015) Dong, R., Zhu, Z., & Whitney, B. 2015, ApJ, 809, 93, doi: 10.1088/0004-637X/809/1/93
- Dong et al. (2017) Dong, R., van der Marel, N., Hashimoto, J., et al. 2017, ApJ, 836, 201, doi: 10.3847/1538-4357/aa5abf
- Dullemond et al. (2001) Dullemond, C. P., Dominik, C., & Natta, A. 2001, ApJ, 560, 957, doi: 10.1086/323057
- Dunkin et al. (1997) Dunkin, S. K., Barlow, M. J., & Ryan, S. G. 1997, MNRAS, 290, 165
- Dutrey et al. (2016) Dutrey, A., Di Folco, E., Beck, T., & Guilloteau, S. 2016, A&A Rev., 24, 5, doi: 10.1007/s00159-015-0091-5
- Espaillat et al. (2007) Espaillat, C., Calvet, N., D’Alessio, P., et al. 2007, ApJ, 670, L135, doi: 10.1086/524360
- Espaillat et al. (2010) Espaillat, C., D’Alessio, P., Hernández, J., et al. 2010, ApJ, 717, 441, doi: 10.1088/0004-637X/717/1/441
- Espaillat et al. (2014) Espaillat, C., Muzerolle, J., Najita, J., et al. 2014, Protostars and Planets VI, 497, doi: 10.2458/azu_uapress_9780816531240-ch022
- Facchini et al. (2018) Facchini, S., Juhász, A., & Lodato, G. 2018, MNRAS, 473, 4459, doi: 10.1093/mnras/stx2523
- Fairlamb et al. (2015) Fairlamb, J. R., Oudmaijer, R. D., Mendigutía, I., Ilee, J. D., & van den Ancker, M. E. 2015, MNRAS, 453, 976, doi: 10.1093/mnras/stv1576
- Feigelson & Lawson (2004) Feigelson, E. D., & Lawson, W. A. 2004, ApJ, 614, 267, doi: 10.1086/423613
- Flaherty et al. (2018) Flaherty, K. M., Hughes, A. M., Teague, R., et al. 2018, ApJ, 856, 117, doi: 10.3847/1538-4357/aab615
- Flaherty et al. (2017) Flaherty, K. M., Hughes, A. M., Rose, S. C., et al. 2017, ApJ, 843, 150, doi: 10.3847/1538-4357/aa79f9
- Fukagawa et al. (2013) Fukagawa, M., Tsukagoshi, T., Momose, M., et al. 2013, PASJ, 65, L14. https://arxiv.org/abs/1309.7400
- Furlan et al. (2011) Furlan, E., Luhman, K. L., Espaillat, C., et al. 2011, ApJS, 195, 3, doi: 10.1088/0067-0049/195/1/3
- Gaia Collaboration et al. (2018) Gaia Collaboration, Brown, A. G. A., Vallenari, A., et al. 2018, A&A, 616, A1, doi: 10.1051/0004-6361/201833051
- Garcia Lopez et al. (2006) Garcia Lopez, R., Natta, A., Testi, L., & Habart, E. 2006, A&A, 459, 837, doi: 10.1051/0004-6361:20065575
- Garufi et al. (2017) Garufi, A., Meeus, G., Benisty, M., et al. 2017, A&A, 603, A21, doi: 10.1051/0004-6361/201630320
- Haffert et al. (2019) Haffert, S. Y., Bohn, A. J., de Boer, J., et al. 2019, Nature Astronomy, 3, 749, doi: 10.1038/s41550-019-0780-5
- Hartmann et al. (1998) Hartmann, L., Calvet, N., Gullbring, E., & D’Alessio, P. 1998, ApJ, 495, 385, doi: 10.1086/305277
- Hendler et al. (2018) Hendler, N. P., Pinilla, P., Pascucci, I., et al. 2018, MNRAS, 475, L62, doi: 10.1093/mnrasl/slx184
- Herbig (1960) Herbig, G. H. 1960, ApJS, 4, 337, doi: 10.1086/190050
- Herczeg & Hillenbrand (2014) Herczeg, G. J., & Hillenbrand, L. A. 2014, ApJ, 786, 97, doi: 10.1088/0004-637X/786/2/97
- Huang et al. (2020) Huang, J., Andrews, S. M., Dullemond, C. P., et al. 2020, arXiv e-prints, arXiv:2001.11040. https://arxiv.org/abs/2001.11040
- Hunter (2007) Hunter, J. D. 2007, Computing in Science and Engineering, 9, 90, doi: 10.1109/MCSE.2007.55
- Ingleby et al. (2013) Ingleby, L., Calvet, N., Herczeg, G., et al. 2013, ApJ, 767, 112, doi: 10.1088/0004-637X/767/2/112
- Kelly (2007) Kelly, B. C. 2007, ApJ, 665, 1489, doi: 10.1086/519947
- Kenyon et al. (2008) Kenyon, S. J., Gómez, M., & Whitney, B. A. 2008, Low Mass Star Formation in the Taurus-Auriga Clouds, ed. B. Reipurth, 405
- Keppler et al. (2018) Keppler, M., Benisty, M., Müller, A., et al. 2018, A&A, 617, A44, doi: 10.1051/0004-6361/201832957
- Keppler et al. (2019) Keppler, M., Teague, R., Bae, J., et al. 2019, A&A, in press
- Kraus et al. (2013) Kraus, S., Ireland, M. J., Sitko, M. L., et al. 2013, ApJ, 768, 80, doi: 10.1088/0004-637X/768/1/80
- Kraus et al. (2017) Kraus, S., Kreplin, A., Fukugawa, M., et al. 2017, ApJ, 848, L11, doi: 10.3847/2041-8213/aa8edc
- Kudo et al. (2018) Kudo, T., Hashimoto, J., Muto, T., et al. 2018, ApJ, 868, L5, doi: 10.3847/2041-8213/aaeb1c
- Lacour et al. (2016) Lacour, S., Biller, B., Cheetham, A., et al. 2016, A&A, 590, A90, doi: 10.1051/0004-6361/201527863
- Langlois et al. (2018) Langlois, M., Pohl, A., Lagrange, A.-M., et al. 2018, A&A, 614, A88, doi: 10.1051/0004-6361/201731624
- Lazareff et al. (2017) Lazareff, B., Berger, J. P., Kluska, J., et al. 2017, A&A, 599, A85, doi: 10.1051/0004-6361/201629305
- Leinert et al. (1993) Leinert, C., Zinnecker, H., Weitzel, N., et al. 1993, A&A, 278, 129
- Ligi et al. (2018) Ligi, R., Vigan, A., Gratton, R., et al. 2018, MNRAS, 473, 1774, doi: 10.1093/mnras/stx2318
- Lin & Papaloizou (1979) Lin, D. N. C., & Papaloizou, J. 1979, MNRAS, 188, 191
- Lodato & Facchini (2013) Lodato, G., & Facchini, S. 2013, MNRAS, 433, 2157, doi: 10.1093/mnras/stt878
- Long et al. (2018) Long, Z. C., Akiyama, E., Sitko, M., et al. 2018, ApJ, 858, 112, doi: 10.3847/1538-4357/aaba7c
- Loomis et al. (2017) Loomis, R. A., Öberg, K. I., Andrews, S. M., & MacGregor, M. A. 2017, ApJ, 840, 23, doi: 10.3847/1538-4357/aa6c63
- Luhman et al. (2010) Luhman, K. L., Allen, P. R., Espaillat, C., Hartmann, L., & Calvet, N. 2010, ApJS, 186, 111, doi: 10.1088/0067-0049/186/1/111
- Maire et al. (2017) Maire, A.-L., Stolker, T., Messina, S., et al. 2017, A&A, 601, A134, doi: 10.1051/0004-6361/201629896
- Manara et al. (2014) Manara, C. F., Testi, L., Natta, A., et al. 2014, A&A, 568, A18, doi: 10.1051/0004-6361/201323318
- Manara et al. (2016) Manara, C. F., Rosotti, G., Testi, L., et al. 2016, A&A, 591, L3, doi: 10.1051/0004-6361/201628549
- Manara et al. (2017) Manara, C. F., Testi, L., Herczeg, G. J., et al. 2017, A&A, 604, A127, doi: 10.1051/0004-6361/201630147
- Marino et al. (2015) Marino, S., Perez, S., & Casassus, S. 2015, ApJ, 798, L44, doi: 10.1088/2041-8205/798/2/L44
- Mayama et al. (2018) Mayama, S., Akiyama, E., Panić, O., et al. 2018, ApJ, 868, L3, doi: 10.3847/2041-8213/aae88b
- McMullin et al. (2007) McMullin, J. P., Waters, B., Schiebel, D., Young, W., & Golap, K. 2007, in Astronomical Society of the Pacific Conference Series, Vol. 376, Astronomical Data Analysis Software and Systems XVI, ed. R. A. Shaw, F. Hill, & D. J. Bell, 127
- Mendigutía et al. (2011) Mendigutía, I., Calvet, N., Montesinos, B., et al. 2011, A&A, 535, A99, doi: 10.1051/0004-6361/201117444
- Müller et al. (2018) Müller, A., Keppler, M., Henning, T., et al. 2018, A&A, 617, L2, doi: 10.1051/0004-6361/201833584
- Natta et al. (2006) Natta, A., Testi, L., & Randich, S. 2006, A&A, 452, 245, doi: 10.1051/0004-6361:20054706
- Owen & Clarke (2012) Owen, J. E., & Clarke, C. J. 2012, MNRAS, 426, L96, doi: 10.1111/j.1745-3933.2012.01334.x
- Owen & Lai (2017) Owen, J. E., & Lai, D. 2017, MNRAS, 469, 2834, doi: 10.1093/mnras/stx1033
- Pascual et al. (2016) Pascual, N., Montesinos, B., Meeus, G., et al. 2016, A&A, 586, A6, doi: 10.1051/0004-6361/201526605
- Pascucci et al. (2016) Pascucci, I., Testi, L., Herczeg, G. J., et al. 2016, ApJ, 831, 125, doi: 10.3847/0004-637X/831/2/125
- Pecaut & Mamajek (2016) Pecaut, M. J., & Mamajek, E. E. 2016, MNRAS, 461, 794, doi: 10.1093/mnras/stw1300
- Pérez et al. (2019) Pérez, S., Casassus, S., Hales, A., et al. 2019, arXiv e-prints, arXiv:1906.06305. https://arxiv.org/abs/1906.06305
- Pérez et al. (2020) —. 2020, ApJ, 889, L24, doi: 10.3847/2041-8213/ab6b2b
- Perraut et al. (2019) Perraut, K., Labadie, L., Lazareff, B., et al. 2019, arXiv e-prints, arXiv:1911.00611. https://arxiv.org/abs/1911.00611
- Phuong et al. (2020) Phuong, N. T., Dutrey, A., Diep, P. N., et al. 2020, arXiv e-prints, arXiv:2001.08147. https://arxiv.org/abs/2001.08147
- Pinilla et al. (2012) Pinilla, P., Benisty, M., & Birnstiel, T. 2012, A&A, 545, A81, doi: 10.1051/0004-6361/201219315
- Pinilla et al. (2019) Pinilla, P., Benisty, M., Cazzoletti, P., et al. 2019, ApJ, 878, 16, doi: 10.3847/1538-4357/ab1cb8
- Pinilla et al. (2016) Pinilla, P., Klarmann, L., Birnstiel, T., et al. 2016, A&A, 585, A35, doi: 10.1051/0004-6361/201527131
- Pinilla et al. (2018) Pinilla, P., Tazzari, M., Pascucci, I., et al. 2018, ApJ, 859, 32, doi: 10.3847/1538-4357/aabf94
- Pontoppidan et al. (2008) Pontoppidan, K. M., Blake, G. A., van Dishoeck, E. F., et al. 2008, ApJ, 684, 1323, doi: 10.1086/590400
- Qi et al. (2019) Qi, C., Öberg, K. I., Espaillat, C. C., et al. 2019, ApJ, 882, 160, doi: 10.3847/1538-4357/ab35d3
- Quanz et al. (2013) Quanz, S. P., Amara, A., Meyer, M. R., et al. 2013, ApJ, 766, L1, doi: 10.1088/2041-8205/766/1/L1
- Rameau et al. (2017) Rameau, J., Follette, K. B., Pueyo, L., et al. 2017, AJ, 153, 244, doi: 10.3847/1538-3881/aa6cae
- Regály et al. (2012) Regály, Z., Juhász, A., Sándor, Z., & Dullemond, C. P. 2012, MNRAS, 419, 1701, doi: 10.1111/j.1365-2966.2011.19834.x
- Rigliaco et al. (2015) Rigliaco, E., Pascucci, I., Duchene, G., et al. 2015, ApJ, 801, 31, doi: 10.1088/0004-637X/801/1/31
- Rodríguez et al. (2014) Rodríguez, L. F., Zapata, L. A., Dzib, S. A., et al. 2014, ApJ, 793, L21, doi: 10.1088/2041-8205/793/1/L21
- Rosenfeld et al. (2013) Rosenfeld, K. A., Andrews, S. M., Wilner, D. J., Kastner, J. H., & McClure, M. K. 2013, ApJ, 775, 136, doi: 10.1088/0004-637X/775/2/136
- Rosenfeld et al. (2014) Rosenfeld, K. A., Chiang, E., & Andrews, S. M. 2014, ApJ, 782, 62, doi: 10.1088/0004-637X/782/2/62
- Rosotti et al. (2019a) Rosotti, G. P., Booth, R. A., Tazzari, M., et al. 2019a, MNRAS, 486, L63, doi: 10.1093/mnrasl/slz064
- Rosotti et al. (2019b) Rosotti, G. P., Benisty, M., Juhász, A., et al. 2019b, MNRAS, 2689, doi: 10.1093/mnras/stz3090
- Sallum et al. (2015) Sallum, S., Follette, K. B., Eisner, J. A., et al. 2015, Nature, 527, 342, doi: 10.1038/nature15761
- Salyk et al. (2013) Salyk, C., Herczeg, G. J., Brown, J. M., et al. 2013, ApJ, 769, 21, doi: 10.1088/0004-637X/769/1/21
- Sanchis et al. (2019) Sanchis, E., Testi, L., Natta, A., et al. 2019, arXiv e-prints, arXiv:1911.06005. https://arxiv.org/abs/1911.06005
- Schisano et al. (2009) Schisano, E., Covino, E., Alcalá, J. M., et al. 2009, A&A, 501, 1013, doi: 10.1051/0004-6361/200811073
- Shakura & Sunyaev (1973) Shakura, N. I., & Sunyaev, R. A. 1973, A&A, 24, 337
- Sicilia-Aguilar et al. (2019) Sicilia-Aguilar, A., Manara, C. F., de Boer, J., et al. 2019, arXiv e-prints, arXiv:1911.04938. https://arxiv.org/abs/1911.04938
- Sicilia-Aguilar et al. (2020) —. 2020, A&A, 633, A37, doi: 10.1051/0004-6361/201936565
- Siess et al. (2000) Siess, L., Dufour, E., & Forestini, M. 2000, A&A, 358, 593
- Snell & Bally (1986) Snell, R. L., & Bally, J. 1986, ApJ, 303, 683, doi: 10.1086/164117
- Stempels & Gahm (2004) Stempels, H. C., & Gahm, G. F. 2004, A&A, 421, 1159, doi: 10.1051/0004-6361:20034502
- Tang et al. (2017) Tang, Y.-W., Guilloteau, S., Dutrey, A., et al. 2017, ApJ, 840, 32, doi: 10.3847/1538-4357/aa6af7
- Torres et al. (2006) Torres, C. A. O., Quast, G. R., da Silva, L., et al. 2006, A&A, 460, 695, doi: 10.1051/0004-6361:20065602
- Tripathi et al. (2017) Tripathi, A., Andrews, S. M., Birnstiel, T., & Wilner, D. J. 2017, ApJ, 845, 44, doi: 10.3847/1538-4357/aa7c62
- Tsukagoshi et al. (2019) Tsukagoshi, T., Momose, M., Kitamura, Y., et al. 2019, ApJ, 871, 5, doi: 10.3847/1538-4357/aaf4f1
- Ubeira Gabellini et al. (2019) Ubeira Gabellini, M. G., Miotello, A., Facchini, S., et al. 2019, MNRAS, 486, 4638, doi: 10.1093/mnras/stz1138
- van der Marel et al. (2019) van der Marel, N., Dong, R., di Francesco, J., Williams, J., & Tobin, J. 2019, ApJ, in press
- van der Marel et al. (2016) van der Marel, N., van Dishoeck, E. F., Bruderer, S., et al. 2016, A&A, 585, A58, doi: 10.1051/0004-6361/201526988
- van der Marel et al. (2018) van der Marel, N., Williams, J. P., Ansdell, M., et al. 2018, ApJ, 854, 177, doi: 10.3847/1538-4357/aaaa6b
- van der Plas et al. (2019) van der Plas, G., Ménard, F., Gonzalez, J.-F., et al. 2019, A&A, 624, A33, doi: 10.1051/0004-6361/201834134
- Villenave et al. (2019) Villenave, M., Benisty, M., Dent, W. R. F., et al. 2019, A&A, 624, A7, doi: 10.1051/0004-6361/201834800
- Wagner et al. (2018) Wagner, K., Follete, K. B., Close, L. M., et al. 2018, ApJ, 863, L8, doi: 10.3847/2041-8213/aad695
- Wagner et al. (2015) Wagner, K. R., Sitko, M. L., Grady, C. A., et al. 2015, ApJ, 798, 94, doi: 10.1088/0004-637X/798/2/94
- Walsh et al. (2017) Walsh, C., Daley, C., Facchini, S., & Juhász, A. 2017, A&A, 607, A114, doi: 10.1051/0004-6361/201731334
- Weidenschilling (1977) Weidenschilling, S. J. 1977, MNRAS, 180, 57
- Whipple (1972) Whipple, F. L. 1972, in From Plasma to Planet, ed. A. Elvius, 211
- White et al. (2016) White, J. A., Boley, A. C., Hughes, A. M., et al. 2016, ApJ, 829, 6, doi: 10.3847/0004-637X/829/1/6
- White et al. (1999) White, R. J., Ghez, A. M., Reid, I. N., & Schultz, G. 1999, ApJ, 520, 811, doi: 10.1086/307494
- Willson et al. (2019) Willson, M., Kraus, S., Kluska, J., et al. 2019, A&A, 621, A7, doi: 10.1051/0004-6361/201630215
- Zapata et al. (2017) Zapata, L. A., Rodríguez, L. F., & Palau, A. 2017, ApJ, 834, 138, doi: 10.3847/1538-4357/834/2/138
- Zhang et al. (2015) Zhang, K., Blake, G. A., & Bergin, E. A. 2015, ApJ, 806, L7, doi: 10.1088/2041-8205/806/1/L7
- Zhu et al. (2019) Zhu, Z., Zhang, S., Jiang, Y.-F., et al. 2019, ApJ, 877, L18, doi: 10.3847/2041-8213/ab1f8c
- Zurlo et al. (2020) Zurlo, A., Cugno, G., Montesinos, M., et al. 2020, A&A, 633, A119, doi: 10.1051/0004-6361/201936891
Appendix A Inner Disk Coordinates
| Name | RA | dec |
|---|---|---|
| (ICRS J2000) | (ICRS J2000) | |
| AATau | 04:34:55.4277 | +24:28:52.668 |
| ABAur | 04:55:45.8515 | +30:33:03.895 |
| DMTau | 04:33:48.7486 | +18:10:09.650 |
| GGTau AA/Ab | 04:32:30.3663 | +17:31:40.198 |
| GMAur | 04:55:10.987 | +30:21:58.943 |
| HD100453 | 11:33:05.502 | -54:19:28.64 |
| HD100546 | 11:33:25.306 | -70:11:41.232 |
| HD142527 | 15:56:41.870 | -42:19:23.703 |
| HD169142 | 18:24:29.7759 | -29:46:49.999 |
| HD97048 | 11:08:03.186 | -77:39:17.474 |
| HPCha | 11:08:15.366 | -77:33:53.432 |
| MWC 758 | 05:30:27.534 | +25:19:56.600 |
| PDS70 | 14:08:10.107 | -41:23:52.995 |
| SR24S | 16:26:58.506 | -24:45:37.278 |
| Tcha | 11:57:13.2868 | -79:21:31.668 |
| TWHya | 11:01:51.8183 | -34:42:17.238 |
| V4046Sgr | 18:14:10.486 | -32:47:35.479 |
| WSB60 | 16:28:16.5040 | -24:36:58.527 |
Appendix B Orientation outer disk
For 7 targets (CS Cha, HP Cha, MHO 2, PDS 99, RXJ1842.9-3532, UX TauA and WSB 60), no previous fitting of the outer disk orientation is available from the literature. In order to determine the orientation of the outer disk, we perform a simple fitting procedure for each image, where the intensity model is a Gaussian ring with an inclination and a position angle PA:
| (B1) |
with the center of the ring and a width . The intensity model is convolved with the beam and subtracted to check the residual. After an initial fit by eye, a minimization with steps of 0.005” in radial direction and 1∘ results in the best fit values reported in Table 6. The residual images often still contain remnant emission, which are the result of additional structure in the disk that is not included in this model. However, for the purpose of this work (the orientation of the outer disk to within a few degrees) it is sufficient.
| Name | ||||
|---|---|---|---|---|
| (”) | (”) | (∘) | (∘) | |
| CSCha | 0.225 | 0.055 | 161 | 8 |
| HPCha | 0.28 | 0.04 | 162 | 37 |
| MHO2 | 0.245 | 0.05 | 120 | 38 |
| PDS99 | 0.42 | 0.08 | 107 | 55 |
| RXJ1842 | 0.27 | 0.07 | 30 | 32 |
| UXTauA | 0.25 | 0.03 | 167 | 40 |
| WSB60 | 0.25 | 0.08 | 172 | 28 |
Figure 15 shows the images and best-fit models.
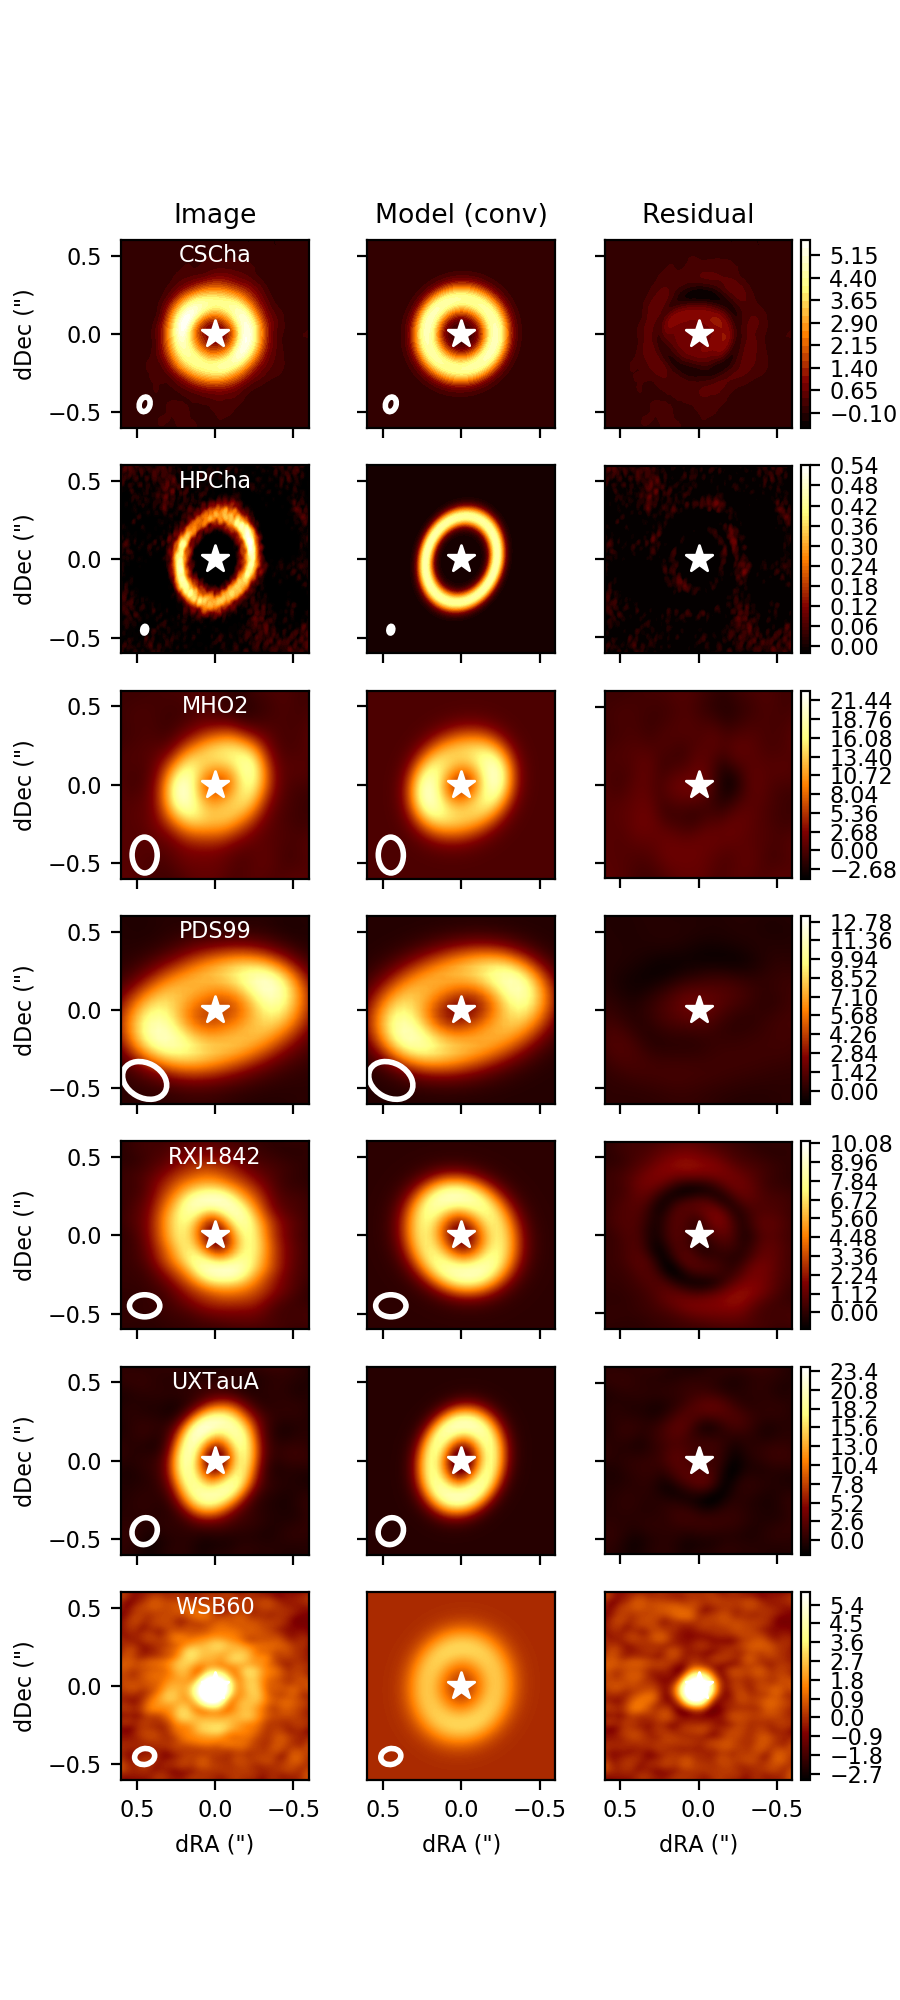
Appendix C Spectral energy distributions