An ultra-massive white dwarf with a mixed hydrogen-carbon atmosphere as a likely merger remnant
Abstract
White dwarfs are dense, cooling stellar embers consisting mostly of carbon and oxygen[1], or oxygen and neon (with a few percent carbon) at higher initial stellar masses[2]. These stellar cores are enveloped by a shell of helium which in turn is usually surrounded by a layer of hydrogen, generally prohibiting direct observation of the interior composition. However, carbon is observed at the surface of a sizeable fraction of white dwarfs[3, 4], sometimes with traces of oxygen, and it is thought to be dredged-up from the core by a deep helium convection zone[5, 6]. In these objects only traces of hydrogen are found[7, 8] as large masses of hydrogen are predicted to inhibit hydrogen/helium convective mixing within the envelope[9]. We report the identification of WD J055134.612413531.09, an ultra-massive (1.14 ) white dwarf with a unique hydrogen/carbon mixed atmosphere ( in number ratio). Our analysis of the envelope and interior indicates that the total hydrogen and helium mass fractions must be several orders of magnitude lower than predictions of single star evolution[10]: less than and , respectively. Due to the fast kinematics ( km s-1 relative to the local standard of rest), large mass, and peculiar envelope composition, we argue that WD J05514135 is consistent with formation from the merger of two white dwarfs in a tight binary system[11, 12, 13, 14].
Department of Physics, The University of Warwick, Coventry, CV4 7AL, UK
Facultad de Ciencias Astrónomicas y Geofísicas, Universidad Nacional de La Plata, Paseo del Bosque s/n, 1900 La Plata, Argentina
Instituto de Astrofísica de La Plata, UNLP-CONICET, Paseo del Bosque s/n, 1900 La Plata, Argentina
Institut für Theoretische Physik und Astrophysik, University of Kiel, 24098 Kiel, Germany
Department of Physics, Faculty of Science, Naresuan University, Phitsanulok 65000, Thailand
Department of Physics and Astronomy, University of Sheffield, Sheffield, S3 7RH, UK
Instituto de Astrofísica de Canarias, 38205 La Laguna, Tenerife, Spain
European Southern Observatory, Karl-Schwarzschild-Str 2, D-85748 Garching, Germany
Departamento de Astrofísca, Universidad de La Laguna, 38206 La Laguna, Tenerife, Spain
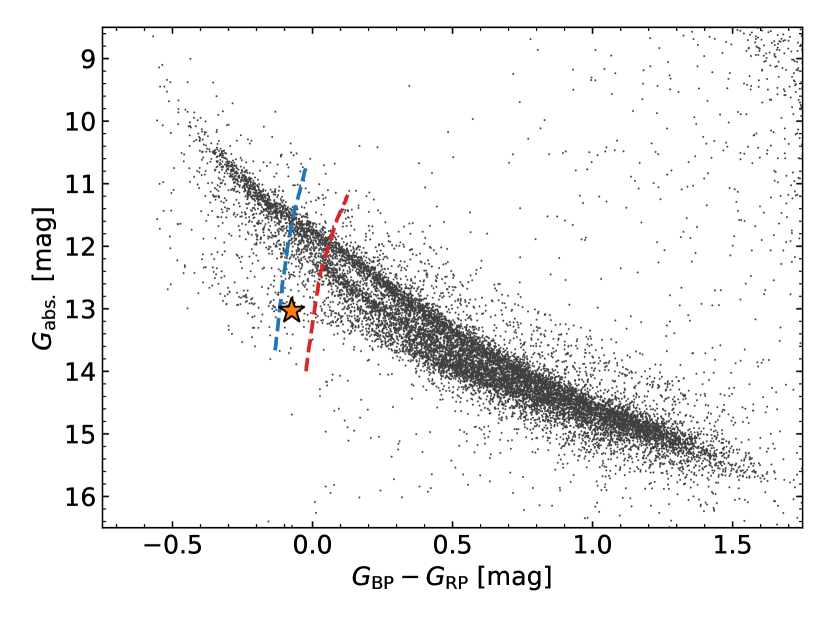
WD J05514135 was identified as a candidate high-mass white dwarf[15] from its location in the Gaia Hertzsprung-Russell diagram[16] (Fig. 1). The Gaia parallax places WD J05514135 at pc away from the Sun. Compared to most other white dwarfs of the same colour, WD J05514135 is fainter in absolute magnitude, signifying a relatively small radius, and thus a large mass given the mass-radius relation of white dwarfs whose structure is dominated by electron degeneracy[17].
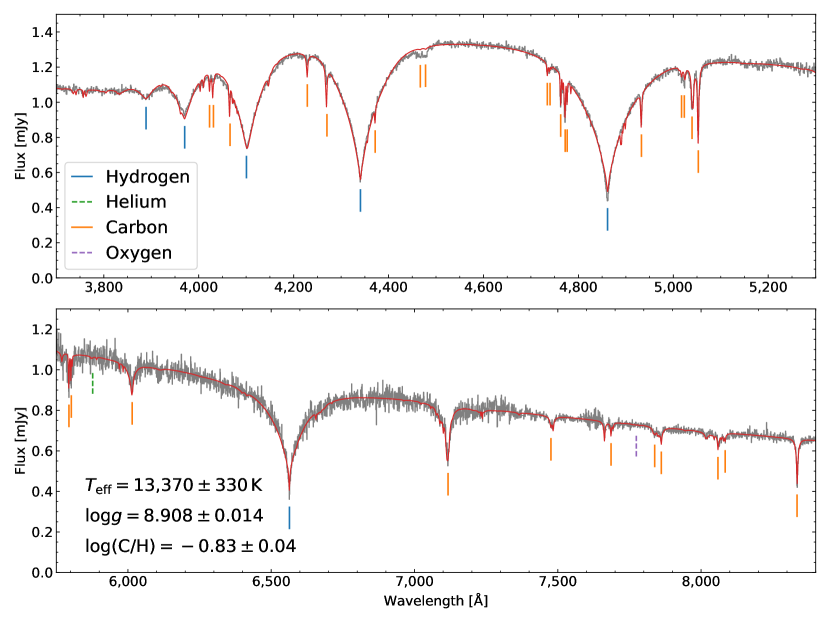
We acquired spectroscopy of WD J05514135 with the William Herschel Telescope (WHT) in October 2018, February 2019, and September 2019. The coadded spectrum (Fig. 2) is qualitatively similar to a typical hydrogen-atmosphere white dwarf, but with the addition of numerous absorption lines from atomic carbon, formally making WD J05514135 the first white dwarf of its spectral class[18] (DAQ). Fitting (see Methods) the spectrum and photometry (Gaia/Pan-STARRS/SWIFT), we found an effective temperature () of K, radius () of (implying a mass () of , see Methods), and an atmospheric carbon to hydrogen number ratio of (). The best fitting model is shown in red in Fig. 2. Helium is not detected in the spectrum (Fig. 2, green dashed) with a 99 % upper limit of (see Methods). This upper limit allows for a moderate helium component, but confirms the hydrogen-dominated nature of the atmosphere. From the absence of the 7,774 Å O i triplet (Fig. 2, purple dashed), we determined an oxygen upper limit of at 99 % confidence. Convection was identified from 0.02 to the bottom of the atmospheric model (1,000 ), where is the Rosseland mean optical depth.
Previously known white dwarfs with helium/carbon atmospheres and similar atmospheric parameters[7, 8] are best explained by the convective dredge-up of carbon into an outer helium envelope[5, 6]. Assuming carbon dredge-up is also the mechanism responsible for the nature of WD J05514135, the helium fraction in the stellar envelope must be exceptionally low – dredge-up of carbon into the surface hydrogen layer would necessarily also dredge-up all of the helium situated between the carbon and hydrogen layers. The above ratio is consistent with the highest ratios observed in carbon-rich white dwarf atmospheres with comparable [8, 7].
Given its mass, WD J05514135 is expected to harbour an ONe core, and so oxygen dredge-up might also be expected, as is seen for some carbon rich white dwarfs[8, 7]. Since oxygen was not detected in the spectrum of WD J05514135, we considered the possibility that WD J05514135 harbours a massive CO core.
To test this hypothesis we calculated CO and ONe core interior models of WD J05514135 at the estimated mass and evolved them to the measured , using lpcode[2, 19]. The envelope was initialised with both hydrogen and helium masses of (chosen from an initial estimate of the surface convection zone depth). The resulting models shown in Fig. 3 (top and middle panels) demonstrate several key results. Firstly, despite the distinct core-structures, above (where is the mass enclosed within a sphere of radius ), the models are almost indistinguishable. Therefore the degree of oxygen dredge-up is not found to depend upon the core-composition, and so the atmospheric non-detection of oxygen cannot be used to test the evolutionary history.
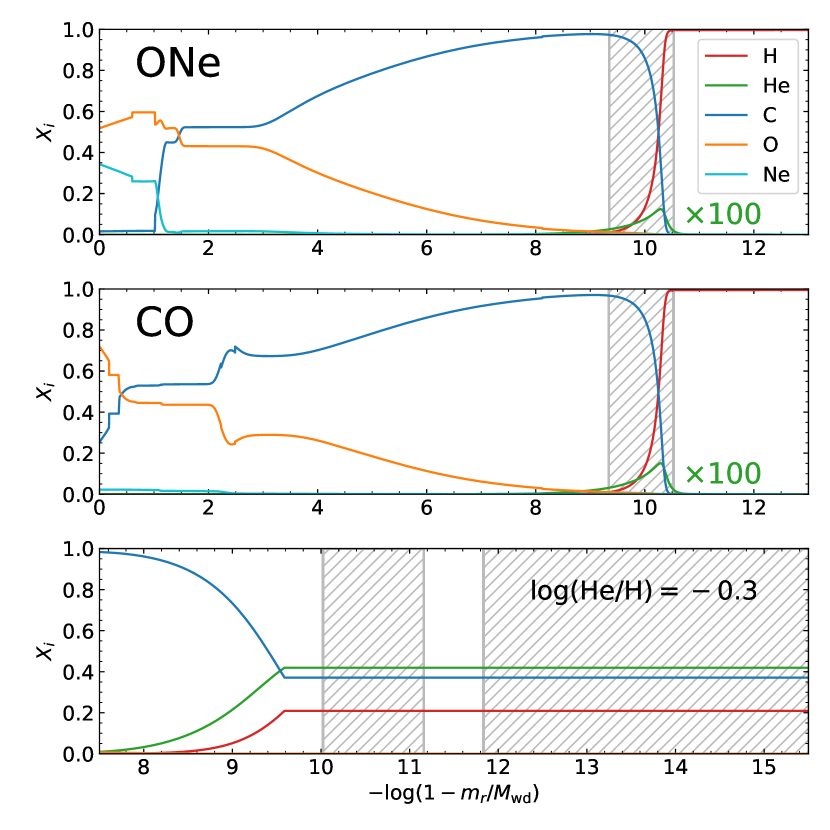
Secondly, the helium layer, initially acting as a buffer between the hydrogen and carbon, was found to have almost entirely diffused into the carbon layer – multiplication of the helium-curves by is required for visibility in Fig. 3. While the helium fraction peaks in the C/H overlap region, most of the integrated mass is found between and , far below any convective region. This demonstrates that for low total helium masses, diffusion succeeds in erasing the helium buffer, resulting in a direct hydrogen/carbon interface, allowing for carbon dredge-up into the hydrogen layer without dredging up a large amount of helium.
For a more accurate understanding of the upper layers, we integrated our best fit model atmosphere downwards[20] (Fig. 3, bottom), which explicitly includes chemical mixing in convective regions. The displayed profile assumes our atmospheric upper limit of . Below the surface convection zone, a second, deeper convectively unstable region develops (). We obtained conservative upper limits for the total hydrogen and helium mass fractions by integrating the chemical profiles in the envelope model, taking into account convective overshoot[21], finding and , respectively (see Methods). While total hydrogen masses this low are observed in a moderate fraction of white dwarfs, the canonical helium mass fraction[10] is of the order , and so WD J05514135 is found to be helium-deficient by many orders of magnitude.
We also investigated the kinematics of WD J05514135. The proper motion and (gravitational redshift corrected) radial velocity, imply a speed of km s-1 in the heliocentric frame, and km s-1 in the local standard of rest frame. We found this speed to be at the 99th percentile of the 3D velocity distribution of nearby white dwarfs with similar absolute magnitudes (see Methods). Because stellar velocity dispersion increases with system age, the fast kinematics of WD J05514135 may signify a system age much older than implied simply from the white dwarf cooling: if WD J05514135 formed through single star evolution, the implied progenitor mass would be – [22], implying a main sequence lifetime of yr, and thus a system age dominated by the estimated Gyr of white dwarf cooling. By comparison, formation from a double white dwarf merger would allow WD J05514135 to be many Gyr older considering the longer main sequence lifetimes of the lower mass progenitor stars, and the delay inferred for merger products in the local white dwarf population[13].
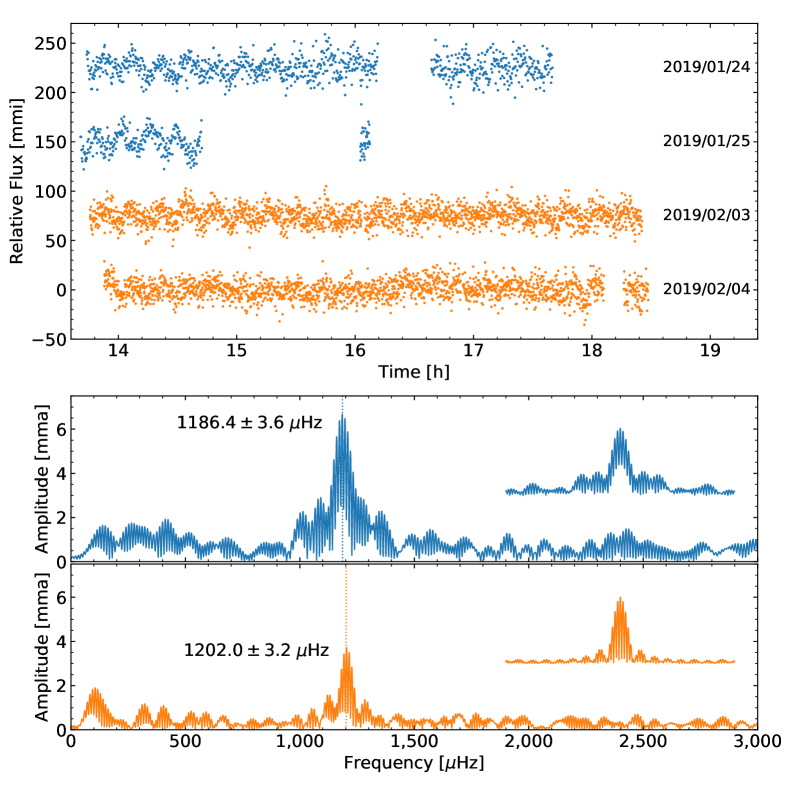
The mass and temperature of WD J05514135 locates it in the parameter-space where white dwarfs with hydrogen dominated atmospheres are unstable to pulsations[23] (bounded by the blue and red dashed lines in Fig. 1), motivating a search for pulsations in WD J05514135. Observations obtained with the Liverpool Telescope indicated potential variability at a s period amplitude. Additional lightcurves (Fig. 4, top) obtained with the Thai National Telescope (TNT) – two nights in January and two in February 2019 – unambiguously confirmed the variability as a single pulsation mode. The 840 s period is found to be typical for hydrogen-atmosphere white dwarfs with these stellar parameters[24]. While a single peak in the Fourier transform (Fig. 4, bottom) may arise from rotation, the oscillation frequency exhibits a Hz shift between the January and February observations (see Methods), which is possible for pulsations, but not for rotation. The oscillation amplitude also varies by a factor of two between the observations, which could be attributed to unresolved rotational splitting.
Given the many unusual properties of WD J05514135, this object is challenging to explain via single star evolution. Instead we argue that its unique hydrogen/carbon atmosphere, inferred low total hydrogen and helium content, fast kinematics consistent with an old age, and finally the mass approximately twice the canonical mass are consistent with formation from a double white dwarf merger. Following such a merger, WD J05514135 might have had a hot carbon dominated atmosphere[25] with hydrogen later diffusing upward as the white dwarf cooled.
If WD J05514135 formed from a merger, it can be expected to be rapidly rotating. While rotational broadening of spectral lines was not detected ( km s-1, where is the equatorial rotation speed, and is the inclination angle), the tiny radius of WD J05514135 only allows the period to be constrained to min (for edge on rotation). For example EUVE J0317855 is also thought to be a merger remnant, but its measured rotation period of 12 minutes[26] would be undetectable for WD J05514135.
A possibility to distinguish between single star evolution and the merger hypothesis comes from the core composition, where ONe and CO cores are expected respectively. While interior modelling of WD J05514135 proved insufficient to elucidate the core composition, a preliminary investigation (using the lp-pul pulsation code[27]) into the pulsation properties of our CO/ONe interior models suggests a dependence on core composition, and has similarly been shown in other recent work[28]. Indeed asteroseismology is the most successful methodology for investigating the interior physics of white dwarfs, including core composition[29]. Therefore the future detection of additional pulsation frequencies may allow the core composition to be established via detailed asteroseismology, and the formation channel to be resolved.
The unique atmosphere of WD J05514135 has been shown to be explainable if both hydrogen and helium masses are orders-of-magnitude lower than usual, where the helium layer has mostly diffused downwards, allowing carbon dredge-up into the hydrogen layer. These unusually low hydrogen/helium masses could be the result of a merger of a former binary system – a hypothesis supported by the fast kinematics and ultra-massive nature of WD J05514135. However, the nature of the helium depleting process remains an outstanding question of this work, and so motivates exploration using detailed white dwarf merger simulations including helium and hydrogen burning[12, 30].
0.1 Spectroscopic observations and reductions
On October 15th 2018, we observed WD J05514135 as part of our International Time Programme (ITP), using the William Herschel Telescope (WHT) at the Roque de los Muchachos Observatory. We made our observations with the Intermediate-dispersion Spectrograph and Imaging System (ISIS), which allows simultaneous observations using blue and red optimised CCDs via a dichroic beam-splitter. For the blue arm we used the R600B grating at a central wavelength of 4,540 Å and R600R at 6,560 Å in the red arm, permitting a spectral resolution of Å.
We took single 600 s exposures in both arms commencing at 05:58 UTC. As the final target of the night as well as the observing run, we did not have time to obtain additional spectra either in this setup or at other central wavelengths. Bias and flat field frames were taken in the afternoon before the start of observing. Standard star (G 191B2B) and arc calibration data were taken following observation of WD J05514135.
Reduction of the data was performed using packages within the starlink[31] distribution of software. Standard techniques were used, i.e. bias subtraction, flat field correction, sky subtraction, and optimal extraction (figaro, kappa, and pamela packages). Wavelength and flux calibration of the 1D spectra were performed using molly[32]
Additional spectroscopic observations were acquired on February 9th 2019 and September 7th 2019, again using ISIS on the WHT, once again using the R600B and R600B gratings. For the February observations the central wavelengths were instead set to 3,930 Å and 8,200 Å. Two 900 s exposures were taken with each CCD with arcs acquired in between. Compared to the October observations, the February spectra have a more accurate wavelength calibration, suitable for precise measurement of the redshift of WD J05514135. G 191B2B was again used as a flux standard. The September observations were acquired in service mode with central wavelengths of 4,540 Å and 8,200 Å. Reduction of these data followed the same procedure as described above, though for the September observations a flux standard was not provided, and so the data were flux calibrated against the best fitting model to the previous data. A summary of all spectroscopic observations is given in Table E1.
0.2 Spectrophotometric fitting
To determine the stellar and atmospheric parameters (summarised in Table E2), we made use of the multiple data available to us, i.e. the spectroscopy, photometry, and the Gaia parallax, fitting these with the Koester white dwarf 1D model atmospheres[33] and a mass-radius relation. The fitting was split into two parts. Firstly, to fit the and stellar radius, we used only the photometry and parallax, with fixed abundances. For the second part we fitted the abundances using only the spectra, but with and the radius fixed. The whole procedure was then performed iteratively until all parameters converged to within a small fraction of the quoted uncertainties. In both cases, the fits were achieved via minimisation. These photometric and spectroscopic fits are detailed below.
For the photometric fit, the choice of photometry and treatment of their uncertainties are important. For the optical we used Gaia[16, 34] and Pan-STARRS[35] which have been shown to have consistent calibration in the case of warm white dwarfs[15]. For the near-ultraviolet (NUV) we initially made use of Galex photometry[36]. While we were able to achieve an adequate fit to these photometry, we found the resulting model ( K) proved inconsistent with the Balmer lines in our optical spectroscopy. Suspecting poor absolute calibration of the Galex fluxes[37], we acquired NUV SWIFT photometry in December 2018. These observations were performed with the U, UVW1, and UVW2 filters using the UVOT (Ultraviolet/Optical Telescope) instrument. To derive calibrated AB magnitudes, we used the latest zeropoints from the High-Energy Astrophysics Science Archive Research Center (HEASARC) for all three filters. The flux level was indeed found to be higher compared to Galex (Fig. E0.2). Refitting using the SWIFT photometry in the NUV instead, we were able to achieve a fit consistent with both photometry and spectroscopy. All photometry considered are listed in Table E3. To correctly fold the parallax and its uncertainty into our fit, we included parallax as a free parameter, the measured value and its error were then used as a Gaussian prior. Given the proximity of WD J05514135 ( pc), the effects of interstellar reddening could be neglected throughout, and 3D effects from convection[38] can also be neglected when fitting optical photometry. Throughout a mixing length parameter of ML2/ = 1.25 was used, though we note that little difference was seen for a value of 0.8.
![[Uncaptioned image]](/html/2003.00028/assets/x5.png)
Our model spectrum (grey) was fitted to Gaia, Pan-STARRS and Swift photometry to determine the and stellar radius. Fitting the Galex photometry instead of Swift, a cooler of K was found to be inconsistent with the optical spectrum. The Galex magnitudes are therefore shown only to demonstrate disagreement with the superior absolute calibration of Swift photometry. Error-bars represent uncertainties.
For the spectroscopic fit, because the surface gravity is the input parameter to the spectral synthesis, the stellar radius (determined from the photometric fit) must be converted to a via a mass-radius relation. For this we made use of CO models with thin hydrogen envelopes[39], linearly interpolating as a function of and . This also leads to a mass estimate of . However, since we also consider an ONe-core as a possibility, we considered the effect this would have on the mass. From our interior models (below), we determined an ONe-core white dwarf would have a 0.85 % lower mass at our measured radius, i.e. . As compromise between these two possibilities, we adopt as the mass of WD J05514135, and a surface gravity of .
For measuring the carbon abundance not all lines were suitable. Bluer than 4,300 Å, the C i lines are overly strong in the model, whereas the doublet near 4,570 Å is too weak (Fig. 2). These lines are reported with NIST (National Institute of Standards and Technology) grade E (oscillator strength accuracy level %). We therefore only considered lines with grade B (7–10 % accuracy) or above, although only the 8,335 Å line was found to be higher accuracy with grade B+ (3–7 % accuracy) The final model is shown with the data in Fig. 2.
Owing to the sharp Balmer line cores and carbon lines, we estimate an upper limit of 50 kG on magnetic field strength for WD J05514135.
0.3 Upper limits
In spectroscopic analyses upper limits are typically expressed as a confidence level in percentage form, but usually without qualification of how such a percentage was derived or should be interpreted. The helium/oxygen upper limits we present are crucial to our interpretation of WD J05514135 and so here we make clear our approach to their derivation.
For each of helium and oxygen, we used only their strongest predicted features to assess upper limits – the 5,877 Å He i line and the 7,774 Å O i triplet (which would appear unresolved if present in our data). For He we created a grid of models from to in steps of 0.1 dex with , , and fixed to the values established from our fits. For O we instead used a grid from to also in steps of 0.1 dex. For each model we normalised them to the data by fitting a first order polynomial to the surrounding continuum. We then determined the between the models and data at each grid point.
The values can be converted to likelihoods via
| (1) |
Because the models barely change for increasingly negative log-abundances, the likelihood converges to a constant value. This makes the likelihood problematic for estimating an upper limit as this represents an improper distribution, one that can’t be normalised, and thus one where percentiles cannot be established. This issue can be rectified through a careful choice of uninformative prior.
First we consider the abundances on the absolute fractional scale. For a two-component atmosphere with abundances of hydrogen and a second element (where ), the likelihood becomes a proper distribution when expressed as a function of absolute fractions, however, we still require an explicit choice of prior. Given that we are attempting to constrain an unknown fraction, a beta-distribution is the appropriate choice. We used the Jeffrey’s prior, setting the and parameters of the beta distribution to , i.e.
| (2) |
For an -component atmosphere, this can be extended to the corresponding Dirichlet-distribution,
| (3) |
however with the C abundance fixed, equation (2) is sufficient.
With our model grids spaced equidistantly in log-abundance, numerical integration is simpler on this scale rather than in terms of absolute fractions. Transforming equation (2) we find
| (4) |
as the corresponding prior for log-abundances. Note that in the limit
| (5) |
provides a simple approximation to (4). Multiplying the likelihood by the prior distribution given by (4) yields a proper distribution that initially rises with increasing abundance, before rapidly dropping to near-zero posterior probability once the models start to visibly disagree with the data. Finding a given percentile of the distribution is a simple case of numerical integration, to obtain the cumulative distribution and reading off the corresponding percentile. While we quoted the 99th percentiles, we note that for both He and O, the 95th percentiles were found to be 0.2 dex below the 99th percentile. The model spectra evaluated at these upper limits are shown against the data in Fig. E0.3.
![[Uncaptioned image]](/html/2003.00028/assets/x6.png)
Upper limits for He and O abundances. The solid red models correspond to the estimated 99th percentile upper limits, whereas the dotted curves indicate models with their respective elements at zero abundance.
0.4 Interior structure
To analyse the unusual surface abundances of this star, we have performed evolutionary calculations for both ONe-core and CO-core white dwarf models, with low H and low He content, using the lpcode stellar evolutionary code. While a merger origin may initially produce an out-of-equilibrium structure, these evolutionary calculations are justified given that the timescale for carbon diffusion out of the convection zone is of the order of hundreds of years[21] for the stellar parameters of WD J05514135. It is therefore almost impossible that the presence of carbon is due to the relaxation of prior evolution instead of dredge-up. The results are shown on the top two panels of Fig. 3 for the evolution stage that corresponds to the mass and of WD J05514135. The initial ONe chemical profile is the result of the full previous calculation of the progenitor evolution[40, 41], whereas the initial CO chemical profile was artificially generated. For the envelope we initialised both the hydrogen and helium masses to . These theoretical white dwarf models consider changes in the chemical abundances due to chemical diffusion and gravitational settling[42, 43, 6], and a detailed treatment of the chemical redistribution resulting of crystallisation, due to coulomb interactions[2]. As a result of gravitational settling, heavy elements are rapidly depleted from the outer layers, sinking into the stellar interior. Simultaneously, chemical diffusion acts in the opposite direction, smoothing the chemical profiles.
Despite the distinct structures within the cores, we have found that the models are almost indistinguishable in the envelope (). However, the effect of the low light element content produces notable differences in the stellar envelope compared to previously published models with thick He- and H-layers[2]. Due to the low helium content of this star, chemical diffusion manages to erase the helium buffer, leading to a hydrogen-carbon interface, regardless of the core chemical composition. Moreover, as helium and carbon have the same mass-to-proton ratio, electron degeneracy does not prevent helium chemical diffusion into the interior, as it does happen with hydrogen[44]. Thus the hydrogen-carbon interface can allow convection to dredge-up carbon, without revealing signatures of helium in the spectrum. We note that these lpcode models include convective energy transfer, with the inferred convective layers shown in Fig. 3, but not the possibility of convective mixing. Therefore to study the envelope in more detail, we rely on our best fit model atmosphere that we integrate downwards using the same microphysics as that used in the model atmosphere code[20, 33]. In particular, we rely on a mixed H/He/C equation-of-state allowing for the different chemical constituents to influence the size of the convection zone(s). As with the atmospheric models, 1.25 was used for the mixing length parameter.
The integrated envelope model assumes complete convective mixing within the unstable regions but neglects convective overshoot[45, 46]. In radiative layers, microscopic diffusion is taken into account as in the lpcode, allowing for a chemical gradient in which the fraction of light elements decrease with increasing depth. We rely on two assumptions on the surface composition, either mixed H/C or mixed H/He/C using our upper limit on the helium abundance. Only the latter case is shown on the bottom of Fig. 3, as it also leads to an upper limit on the total mass of hydrogen and helium. The main difference between the He-free case and our model is that the surface convection zone is significantly smaller in the former case, with its base located at . However in both cases, a second, deeper unstable region develops (). This is in stark contrast with pure-hydrogen structures which never develop a second, deeper convection zone[47].
To obtain upper limits for the hydrogen and helium total mass fractions, we must also consider the effect of convective overshoot. Thus we can not directly rely on the 1D abundance profiles presented in the bottom of Fig. 3. In the limiting case of shown in Fig. 3, the separation between the two convection zones is small enough that overshoot is expected to be able to completely mix them[21]. While 3D overshoot simulations for white dwarfs have so far only been performed for pure-H and mixed H/He atmospheres[48, 21, 49], the presence of carbon is not expected to change the strength of overshoot for a given convection zone mass. Furthermore, convective overshoot is also expected to mix material below the second convection zone. Here we apply a conservative one pressure scale height value (0.43 dex in mass). Therefore, we obtain our upper limit by first integrating our envelope model assuming the atmospheric composition down to 0.43 dex below the second convection zone (). Below this point, the diffusion tails in the interior models were rescaled to match the value at . This results in 99.8 % of the helium mass being localised to the diffusion tail below the convectively mixed region. This ultimately yields and to the nearest 0.5 dex, for total hydrogen and helium mass-fractions, respectively. We note that owing to the presence of two convection zones and the complex nature of convective overshoot, the total masses of hydrogen and helium may not decrease monotonically as the assumed fraction of helium at the surface decreases. However, it is clear that if there is no helium at the surface (or in the star), the total amount of hydrogen must be similar or smaller than our upper limit.
0.5 Kinematic analysis
WD J05514135 has a fairly minor tangential speed of km s-1, however its line-of-sight motion was found to be much larger in magnitude. To precisely measure the total redshift of the white dwarf, we were unable to use the discovery spectrum (covering 3,700–7,500 Å), as the arc calibration spectrum was taken at a different sky position, and so the wavelength solution is affected by some flexure of the telescope. Instead we used the February 2019 -band spectrum which covers 7,300–9,100 Å, and contains a strong, narrow C i line at 8,335 Å. The coadded -band spectrum consists of two sub-spectra where a single arc was taken between them. The RMS-scatter of the fitted wavelength-solution is 0.024 Å corresponding to a 0.9 km s-1 systematic uncertainty at 8,335 Å.
To measure the total-velocity shift of the spectrum, we first convolved our best fitting model to a resolution of 1.43 Å, as measured from the sky-emission spectrum. We then minimized the -between this model and the spectrum as a function of velocity-shift, finding km s-1 (including the km s-1 calibration uncertainty). Inspection of the normalised-residuals as function of velocity-shift, indicated that this level of uncertainty is reasonable.
Considering the adopted mass of radius of , and their covariance, the gravitational redshift of WD J05514135 was found to be km s-1. Therefore the line-of-sight motion is inferred to be km s-1, i.e. the line-of-sight motion essentially balances the gravitational redshift. This gives the three-dimensional speed of WD J05514135 relative to the Sun as km s-1, and km s-1 relative to the local standard of rest.
To assess the statistical significance of the speed of WD J05514135, we chose to compare against the empirical velocity distribution for local white dwarfs. While most known white dwarfs (since the release of Gaia DR2) have precisely measured proper-motions, few have well measured radial velocities corrected for gravitational redshift. We therefore had to work with the two-dimensional distribution in order to parametrize the three-dimensional distribution. We selected our local sample as a subset of the Gaia catalogue of white dwarfs[15], relying on stars with parallaxes mas, relative parallax uncertainties %, and absolute Gaia magnitudes with 0.5 mag either side of WD J05514135. We also required white dwarf probabilities[15] of . Finally we excluded objects with km s-1, as these are most likely Galactic halo stars and represent a different distribution. This resulted in a sample size of 9,367 objects.
Assuming velocity components are drawn from Gaussian distributions with a shared variance, then the transverse velocity is Rayleigh distributed, and the three-dimensional speed is described by a Maxwell-Boltzmann distribution. We fitted the dispersion, , to our sample of by maximising the likelihood of the Rayleigh distribution finding km s-1, however, comparing the histogram of the data with the fitted distribution demonstrated clear disagreement particularly in the high tail.
Instead we tried a mixture model of two Rayleigh distributions, i.e.
| (6) |
where are the Gaussian dispersions of the two velocity distributions (), and are the fractional weightings where . This essentially models the kinematic distribution as containing two sub-populations (e.g. thin/thick disc or merger/non-merger). However since the objective is simply to empirically determine the shape of the 3D distribution, the specific interpretation is unimportant. Again we maximised the likelihood of the parameters finding km s-1, km s-1, and , this time finding good agreement with the observed distribution (Fig. E0.5). The distribution on the 3D speed, , is correspondingly given by
| (7) |
where the values of , and , are shared with those measured for equation (6). The distribution was then integrated to infer that km s-1, sits at the 99th percentile (Fig. E0.5).
![[Uncaptioned image]](/html/2003.00028/assets/x7.png)
Our maximum likelihood fit (blue) to the distribution of white dwarfs with similar (grey) to WD J05514135. The LSR 3D velocity of WD J05514135 (red dashed) is located beyond the 99th percentile of the corresponding 3D distribution (orange).
0.6 Time-series photometry
The time-series photometry shown in Fig. 4 were acquired using ULTRASPEC, a high cadence photometer, mounted on the 2.4 m Thai National Telescope[50]. Observations were made using a KG5 filter with binning. A summary of observations is given in Table E4. The observations were bias and flat-field corrected, and aperture photometry extracted using the tsreduce pipeline[51]. Several nearby stars were used as comparisons to create differential light curves relative to the mean flux level. Amplitude spectra were determined using a discrete Fourier transform of the data.
The frequencies for both runs were calculated from the centroids of the power-spectra (as opposed to the amplitude-spectra shown in Fig. 4) in a Hz window around the main peak. I.e.
| (8) |
where is the power at frequency . Similarly the centroid variances, and hence their uncertainties were calculated as
| (9) |
For the January and February observing runs, this yielded frequency centroids of Hz and Hz respectively. Thus Hz was inferred as the frequency shift between runs.
| Obs. date | Cen. wave. (blue/red, Å) | (s) | |
|---|---|---|---|
| 2018-10-15 | 4,540/6,650 | 600 | 1 |
| 2019-02-09 | 3,930/8,200 | 900 | 2 |
| 2019-09-07 | 4,540/8,200 | 900 | 4 |
| Parameter | |
|---|---|
| [K] | |
| [ ] | |
| [dex] | |
| [dex] | |
| [dex] | |
| [] | |
| [] | |
| [dex] | |
| [dex] | |
| Parameter | Value |
|---|---|
| Ra (J2015.5) | 05:51:34.612 |
| Dec (J2015.5) | +41:35:31.09 |
| Gaia source ID | 192275966334956672 |
| [mas] | |
| [mas yr-1] | |
| [mas yr-1] | |
| Gaia | |
| Gaia | |
| Gaia | |
| Galex FUV | |
| Galex NUV | |
| Swift | |
| Swift | |
| Swift | |
| Pan-STARRS | |
| Pan-STARRS | |
| Pan-STARRS | |
| Pan-STARRS | |
| Pan-STARRS |
| Obs. date | (s) | |
| 2019-01-24 | 10 | 1,046 |
| 2019-01-25 | 5/10 | 902 |
| 2019-02-03 | 5 | 2,008 |
| 2019-02-04 | 5 | 1,985 |
Data Availability Statement The spectra of WD J05514135, the
best fitting model spectrum, and lightcurves are provided as supplementary
data.
Code Availability Statement The Koester model atmosphere
and envelope codes, as well as the lpcode/lp-pul
evolutionary/pulsation codes are not made available. However their associated
references in the main text can be consulted for further details.
References
References
- [1] Paczyński, B. Evolution of Single Stars. I. Stellar Evolution from Main Sequence to White Dwarf or Carbon Ignition. Acta Astron. 20, 47 (1970).
- [2] Camisassa, M. E. et al. The evolution of ultra-massive white dwarfs. Astron. Astrophys. 625, A87 (2019). 1807.03894.
- [3] Hollands, M. A., Tremblay, P. E., Gänsicke, B. T., Gentile-Fusillo, N. P. & Toonen, S. The Gaia 20 pc white dwarf sample. Mon. Not. R. Astron. Soc. 480, 3942–3961 (2018). 1805.12590.
- [4] Kepler, S. O. et al. White dwarf and subdwarf stars in the Sloan Digital Sky Survey Data Release 14. Mon. Not. R. Astron. Soc. 486, 2169–2183 (2019). 1904.01626.
- [5] Koester, D., Weidemann, V. & Zeidler, E. M. Atmospheric parameters and carbon abundance of white dwarfs of spectral types C2 and DC. Astron. Astrophys. 116, 147–157 (1982).
- [6] Pelletier, C., Fontaine, G., Wesemael, F., Michaud, G. & Wegner, G. Carbon Pollution in Helium-rich White Dwarf Atmospheres: Time-dependent Calculations of the Dredge-up Process. Astrophys. J. 307, 242 (1986).
- [7] Coutu, S. et al. Analysis of Helium-rich White Dwarfs Polluted by Heavy Elements in the Gaia Era. Astrophys. J. 885, 74 (2019).
- [8] Koester, D. & Kepler, S. O. Carbon-rich (DQ) white dwarfs in the Sloan Digital Sky Survey. Astron. Astrophys. 628, A102 (2019). 1905.11174.
- [9] Rolland, B., Bergeron, P. & Fontaine, G. On the Spectral Evolution of Helium-atmosphere White Dwarfs Showing Traces of Hydrogen. Astrophys. J. 857, 56 (2018). 1803.05965.
- [10] Iben, J., I. & Renzini, A. Asymptotic giant branch evolution and beyond. Annu. Rev. Astron. Astrophys. 21, 271–342 (1983).
- [11] Toonen, S., Nelemans, G. & Portegies Zwart, S. Supernova Type Ia progenitors from merging double white dwarfs. Using a new population synthesis model. Astron. Astrophys. 546, A70 (2012). 1208.6446.
- [12] Shen, K. J., Bildsten, L., Kasen, D. & Quataert, E. The Long-term Evolution of Double White Dwarf Mergers. Astrophys. J. 748, 35 (2012). 1108.4036.
- [13] Cheng, S., Cummings, J. D. & Ménard, B. A Cooling Anomaly of High-mass White Dwarfs. Astrophys. J. 886, 100 (2019).
- [14] Gvaramadze, V. V. et al. A massive white-dwarf merger product before final collapse. Nature 569, 684–687 (2019). 1904.00012.
- [15] Gentile Fusillo, N. P. et al. A Gaia Data Release 2 catalogue of white dwarfs and a comparison with SDSS. Mon. Not. R. Astron. Soc. 482, 4570–4591 (2019). 1807.03315.
- [16] Gaia Collaboration et al. Gaia Data Release 2. Summary of the contents and survey properties. Astron. Astrophys. 616, A1 (2018). 1804.09365.
- [17] Chandrasekhar, S. The highly collapsed configurations of a stellar mass (Second paper). Mon. Not. R. Astron. Soc. 95, 207–225 (1935).
- [18] Sion, E. M. et al. A proposed new white dwarf spectral classification system. Astrophys. J. 269, 253–257 (1983).
- [19] Althaus, L. G., García-Berro, E., Isern, J., Córsico, A. H. & Miller Bertolami, M. M. New phase diagrams for dense carbon-oxygen mixtures and white dwarf evolution. Astron. Astrophys. 537, A33 (2012). 1110.5665.
- [20] Koester, D. Accretion and diffusion in white dwarfs. new diffusion timescales and applications to gd 362 and g 29-38. Astron. Astrophys. 498, 517–525 (2009). 0903.1499.
- [21] Cunningham, T., Tremblay, P.-E., Freytag, B., Ludwig, H.-G. & Koester, D. Convective overshoot and macroscopic diffusion in pure-hydrogen-atmosphere white dwarfs. Mon. Not. R. Astron. Soc. 488, 2503–2522 (2019). 1906.11252.
- [22] Cummings, J. D., Kalirai, J. S., Tremblay, P. E., Ramirez-Ruiz, E. & Choi, J. The White Dwarf Initial-Final Mass Relation for Progenitor Stars from 0.85 to 7.5 M⊙. Astrophys. J. 866, 21 (2018). 1809.01673.
- [23] Tremblay, P. E. et al. 3D Model Atmospheres for Extremely Low-mass White Dwarfs. Astrophys. J. 809, 148 (2015). 1507.01927.
- [24] Curd, B. et al. Four new massive pulsating white dwarfs including an ultramassive DAV. Mon. Not. R. Astron. Soc. 468, 239–249 (2017). 1702.03343.
- [25] Dufour, P., Liebert, J., Fontaine, G. & Behara, N. White dwarf stars with carbon atmospheres. Nature 450, 522–524 (2007). 0711.3227.
- [26] Ferrario, L., Vennes, S., Wickramasinghe, D. T., Bailey, J. A. & Christian, D. J. Euve j0317-855 a rapidly rotating, high-field magnetic white dwarf. Mon. Not. R. Astron. Soc. 292, 205–217 (1997).
- [27] Córsico, A. H. & Althaus, L. G. Asteroseismic inferences on GW Virginis variable stars in the frame of new PG 1159 evolutionary models. Astron. Astrophys. 454, 863–881 (2006). astro-ph/0603736.
- [28] De Gerónimo, F. C., Córsico, A. H., Althaus, L. G., Wachlin, F. C. & Camisassa, M. E. Pulsation properties of ultra-massive DA white dwarf stars with ONe cores. Astron. Astrophys. 621, A100 (2019). 1807.03810.
- [29] Córsico, A. H., Althaus, L. G., Miller Bertolami, M. M. & Kepler, S. O. Pulsating white dwarfs: new insights. Astron. Astrophys. Rev. 27, 7 (2019). 1907.00115.
- [30] Tanikawa, A. et al. Hydrodynamical Evolution of Merging Carbon-Oxygen White Dwarfs: Their Pre-supernova Structure and Observational Counterparts. Astrophys. J. 807, 40 (2015). 1504.06035.
- [31] Currie, M. J. et al. Starlink Software in 2013, vol. 485 of Astron. Soc. Pac. Conf., 391 (2014).
- [32] Marsh, T. R. molly: 1D astronomical spectra analyzer. Astrophys. Source Code Libr. 1907.012 (2019).
- [33] Koester, D. White dwarf spectra and atmosphere models . Memorie della Societa Astronomica Italiana, 81, 921–931 (2010).
- [34] Gaia Collaboration et al. Gaia Data Release 2. Observational Hertzsprung-Russell diagrams. Astron. Astrophys. 616, A10 (2018). 1804.09378.
- [35] Chambers, K. C. et al. The Pan-STARRS1 Surveys. arXiv e-prints arXiv:1612.05560 (2016). 1612.05560.
- [36] Morrissey, P. et al. The Calibration and Data Products of GALEX. Astrophys. J. Suppl. 173, 682–697 (2007).
- [37] Wall, R. E. et al. GALEX absolute calibration and extinction coefficients based on white dwarfs. Mon. Not. R. Astron. Soc. 489, 5046–5052 (2019). 1909.02617.
- [38] Tremblay, P.-E., Ludwig, H.-G., Steffen, M. & Freytag, B. Spectroscopic analysis of DA white dwarfs with 3D model atmospheres. Astron. Astrophys. 559, A104 (2013). 1309.0886.
- [39] Fontaine, G., Brassard, P. & Bergeron, P. The Potential of White Dwarf Cosmochronology. Publ. Astron. Soc. Pac. 113, 409–435 (2001).
- [40] Siess, L. Evolution of massive AGB stars. II. model properties at non-solar metallicity and the fate of Super-AGB stars. Astron. Astrophys. 476, 893–909 (2007).
- [41] Siess, L. Evolution of massive AGB stars. III. the thermally pulsing super-AGB phase. Astron. Astrophys. 512, A10 (2010).
- [42] Paquette, C., Pelletier, C., Fontaine, G. & Michaud, G. Diffusion coefficients for stellar plasmas. Astrophys. J. Suppl. 61, 177–195 (1986).
- [43] Paquette, C., Pelletier, C., Fontaine, G. & Michaud, G. Diffusion in white dwarfs - New results and comparative study. Astrophys. J. Suppl. 61, 197–217 (1986).
- [44] Iben, J., I. & MacDonald, J. The effects of diffusion due to gravity and due to composition gradients on the rate of hydrogen burning in a cooling degenerate dwarf. I - The case of a thick helium buffer layer. Astrophys. J. 296, 540–553 (1985).
- [45] Spiegel, E. A. A Generalization of the Mixing-Length Theory of Turbulent Convection. Astrophys. J. 138, 216 (1963).
- [46] Zahn, J.-P. Convective penetration in stellar interiors. Astron. Astrophys. 252, 179–188 (1991).
- [47] Tremblay, P. E. et al. Calibration of the Mixing-length Theory for Convective White Dwarf Envelopes. Astrophys. J. 799, 142 (2015). 1412.1789.
- [48] Kupka, F., Zaussinger, F. & Montgomery, M. H. Mixing and overshooting in surface convection zones of DA white dwarfs: first results from ANTARES. Mon. Not. R. Astron. Soc. 474, 4660–4671 (2018). 1712.00641.
- [49] Cukanovaite, E. et al. Calibration of the mixing-length theory for structures of helium-dominated atmosphere white dwarfs. Mon. Not. R. Astron. Soc. 490, 1010–1025 (2019). 1909.10532.
- [50] Dhillon, V. S. et al. ULTRASPEC: a high-speed imaging photometer on the 2.4-m Thai National Telescope. Mon. Not. R. Astron. Soc. 444, 4009–4021 (2014). 1408.2733.
- [51] Chote, P. et al. Puoko-nui: a flexible high-speed photometric system. Mon. Not. R. Astron. Soc. 440, 1490–1497 (2014). 1412.5724.
- [52] Tremblay, P.-E. et al. Core crystallization and pile-up in the cooling sequence of evolving white dwarfs. Nature 565, 202–205 (2019).
M.A.H. acknowledges useful discussions on the nature of WD J05514135 with Pier Bergeron and Amanda Karakas, and Maria-Teresa Belmonte for a useful discussion on the quality of experimental atomic data. The research leading to these results has received funding from the European Research Council under the European Union’s Horizon 2020 research and innovation programme no. 677706 (WD3D). A.A. acknowledges generous support from Faculty of Science, Naresuan University (grant no. R2562E029). V.S.D. and ULTRASPEC are funded by the STFC. This work presents results from the European Space Agency (ESA) space mission Gaia. Gaia data are being processed by the Gaia Data Processing and Analysis Consortium (DPAC). Funding for the DPAC is provided by national institutions, in particular the institutions participating in the Gaia MultiLateral Agreement (MLA). The Gaia mission website is https://www.cosmos.esa.int/gaia. The Gaia archive website is https://archives.esac.esa.int/gaia. The William Herschel Telescope is operated on the island of La Palma by the Isaac Newton Group of Telescopes in the Spanish Observatorio del Roque de los Muchachos of the Instituto de Astrofísica de Canarias. Based on observations made with ULTRASPEC at the Thai National Observatory which is operated by the National Astronomical Research Institute of Thailand (Public Organization).
M.A.H., P.-E.T., and B.T.G. lead the project including the interpretation of WD J05514135. M.E.C. calculated the interior CO/ONe core models. D.K. calculated the envelope models and advised M.A.H on atmospheric modelling. N.P.G.-F. acquired the initial LT lightcurve. A.A., V.S.D., and T.R.M. acquired the TNT lightcurves. P.C. calibrated the LT and TNT lightcurves and their amplitude spectra. A.H.C. calculated the pulsation properties of WD J05514135 from the CO/ONe interior models. M.J.H. and P.I. acquired the WHT spectroscopic data of WD J05514135. D.S. acquired and calibrated SWIFT photometry of WD J05514135.
The authors declare that they have no competing financial interests.
Correspondence and requests for materials should be addressed to M. A. Hollands. (email: M.Hollands.1@warwick.ac.uk).