Mid-Infrared Diagnostics of the Circumnuclear Environments
of the Youngest Radio Galaxies
Abstract
We present a systematic analysis of the mid-infrared (MIR) properties of the youngest radio galaxies, based on low-resolution data provided by the WISE and IRAS satellites. We restrict our analysis to sources with available X-ray data that constitute the earliest phase of radio galaxy evolution, i.e. those classified as Gigahertz Peaked Spectrum (GPS) and/or Compact Symmetric Objects (CSOs). In our sample of 29 objects, we find that the host galaxies are predominantly red/yellow ellipticals, with some of them displaying distorted morphology. We find a variety of MIR colors, and observe that the sources in which the MIR emission is dominated by the ISM component uniformly populate the region occupied by galaxies with a wide range of pronounced ( yr-1) star formation activity. We compare the MIR color distribution in our sample to that in the general population of local AGN, in the population of evolved FR II radio galaxies, and also in the population of radio galaxies with recurrent jet activity. We conclude that the triggering of radio jets in AGN does not differentiate between elliptical hosts with substantially different fractions of young stars; instead there is a relationship between the jet duty cycle and the ongoing star formation. The distribution of the sub-sample of our sources with on the low-resolution MIR vs. absorption-corrected X-ray luminosity plane is consistent with the distribution of a sample of local AGN. Finally, we comment on the star formation rates of the two -ray detected sources in our sample, 1146+596 & 1718–649.
,
1 Introduction
Compact radio sources constitute a particularly interesting, yet diverse, class of active galactic nuclei (AGN), with newly born radio structures (jets and lobes) fully confined within their host galaxies (see O’Dea, 1998, for a review). As such, they provide direct insight into the mechanisms that lead to triggering the production of relativistic jets in AGN (e.g., Czerny & You, 2016), as well as insight into the complex dynamics of feedback between evolving supermassive black holes and interstellar medium (e.g., Tadhunter, 2016; Wagner et al., 2016).
To study these dynamics, specific evolutionary models for compact radio galaxies have been developed (e.g., Kawakatu et al., 2008), and certain predictions have been made regarding their multi-wavelength emission and absorption properties (e.g., Stawarz et al., 2008). These models have been tested against various multi-frequency datasets (Ostorero et al., 2010; Migliori et al., 2014). There, however, still remains a lack of consensus on the relative contribution from jets and lobes, accretion disks and circum-nuclear dusty tori, or, to some extent, the interstellar medium (ISM) itself, to the observed radiative output of such systems at infrared, X-ray, and -ray photon energies.
In this context, we focus on a systematic investigation of the mid-infrared (MIR) properties of the most compact radio galaxies. These sources are confirmed spectroscopically in the radio domain as ‘GHz-peaked spectrum’ (GPS) sources, and/or morphologically (using high-resolution radio interferometers) as ‘compact symmetric objects’ (CSOs). In order to study the MIR properties, we utilize data provided by the Wide-field Infrared Survey Explorer (WISE), as well as archival data from the Infrared Astronomical Satellite (IRAS) augmented in a few cases by Spitzer Space Telescope observations. We restrict our sample only to those objects which have been observed in X-rays with either the XMM-Newton or the Chandra X-ray Observatory, so that multi-wavelength diagnostics can be applied to disclose the origins of the observed fluxes.
Previously, the infrared emission of GPS/CSOs had been analyzed by Heckman et al. (1994) in the mid-far infrared domain, based on low-resolution data from IRAS, and by Fanti et al. (2000) in the far infared, using the Infrared Space Observatory (ISO) data. These authors argued that the mid-to-far infrared emission of compact radio galaxies is comparable to that of the extended radio galaxies with matching radio powers and redshifts. Therefore, these sources are most likely dominated by an AGN component, the hot dusty tori in particular.
More recently, Willett et al. (2010) presented the MIR observations of eight nearby CSOs (redshifts ) from Spitzer, finding a diversity in their spectral properties. An overwhelming majority of the sources in their sample displayed a contribution from both circum-nuclear dust, heated by the central AGN, and star formation activity within the host galaxy. Willett et al. (2010) argued, moreover, that the star formation rates in the studied sources, estimated at the level of yr-1 based on the detected polycyclic aromatic hydrocarbon (PAH) emission, implies a close link between the triggering of radio jets and galaxy mergers. On the other hand, Tadhunter et al. (2011) and Dicken et al. (2012) proposed that the enhanced star formation activity in compact radio sources over that observed in evolved radio galaxies, indeed seen in their flux limited samples, may be instead due to an observational selection effect. This follows from the enhanced radiative efficiency of compact radio-emitting jets and lobes in the former class of objects (see also O’Dea, 2016, for the discussion).
In the X-ray domain, the first dedicated studies of GPS/CSOs with the high-angular resolution telescopes XMM-Newton and Chandra, have been reported by Guainazzi et al. (2004, 2006); Vink et al. (2006); Siemiginowska et al. (2008, 2009, 2016); Tengstrand et al. (2009), and Sobolewska et al. (2019a, b). Since the radio structures of the targeted sources remain unresolved even on arcsec scales, various origins of the detected fluxes within the 0.1–10 keV range have been considered by these authors including: accretion disk coronal emission, jet/lobe non-thermal radiation, as well as emission of hot gas within the ISM, modified (shocked) by expanding compact radio structures.
In most cases, unfortunately, rather limited photon statistics preclude any more in-depth spectral modeling, which would enable a robust discrimination between various emission models. The X-ray continua of compact radio galaxies were typically found to be consistent with a single power-law, with photon indices , moderated by hydrogen column densities cm-2. Such spectra could be accommodated by either the disk coronal emission scenario, with modest intrinsic absorption, or the model in which observed X-ray fluxes are dominated by inverse-Comptonization of various ambient photon fields (and the infrared emission of circumnuclear dusty tori in particular) within compact radio lobes shining through the ISM of host galaxies (Ostorero et al., 2010). Only in a few cases, subjected to deeper exposures (1404+286, 1511+0518 and 2021+614), was there a detection of the neutral fluorescence iron line and/or hydrogen column densities in excess of cm-2, indicating the disk coronal emission is seen through a Compton-thick circumnuclear tori (Guainazzi et al., 2004; Siemiginowska et al., 2016; Sobolewska et al., 2019a, b). On the other hand, for the particular case of 1718–649, the observed X-ray emission appeared contributed to by a hot, collisionally ionized gas located within the central parts of the host galaxy (Siemiginowska et al., 2016; Beuchert et al., 2018).
Below, in Section 2 we discuss the selection of the sample including the most compact radio galaxies observed in X-rays. In Section 3 we describe the MIR data acquisition for the selected sources, specifically the WISE, IRAS, and Spitzer archival observations. In Section 4 we discuss the results of our analysis, and our main conclusions are outlined in Section 5. Throughout the paper we assume modern CDM cosmology with km s-1 Mpc-1, , and .
=0.05cm
Name
LS
class
W1–W2
W2–W3
WISE
IRAS
MIPS
WISE
Ref.
[Mpc]
[pc]
[mag]
[mag]
color
[ erg/s]
[ erg/s]
[ erg/s]
[ erg/s]
(1)
(2)
(3)
(4)
(5)
(6)
(7)
(8)
(9)
(10)
(11)
(12)
(13)
0019–000
0.305
1521
220
GPS
0.472
2.441
G
–
–
3.53 0.11
0.55∧
T09
0026+346
0.517
2852
190
GPS
0.743
2.491
Un
–
–
21 0.3
23 2
G06
0035+227
0.096
418
21.8
CSO
0.148
1.265
G
–
–
0.425 0.007
0.075 0.034
S16
0108+388
0.669
3907
22.7
CSO
0.132
3.159
G
9.86 9.16
3.79 1.40
13.1
7 3
T09,S16
0116+319
0.059
255
70.1
CSO
0.035
1.682
S⋆
0.595 0.056
0.609 0.046
0.629 0.003
0.10†
S16
0402+379
0.055
234
7.3
CSO
0.099
1.721
G
0.48 0.07
0.949 0.059
0.608 0.004
0.041 0.016
R14
0428+205
0.219
1044
653
GPS
0.323
2.648
G
–
–
3.93 0.08
1.4 0.6
T09
0500+019
0.585
3319
55
GPS
1.047
2.892
Q
63.4 6.5
87.2 9.8
59.3 0.5
50 6
T09
0710+439
0.518
2868
87.7
CSO
0.726
2.997
Sy
43.8 4.4
107 7
43.4 0.4
39.40 3.15
T09,S16
0941–080
0.228
1100
148
GPS
0.388
2.444
G*
–
–
2.57 0.05
0.091 0.075
T09
1031+567
0.460
2480
109
CSO
0.999
2.922
Q
17.6 3.0
16.5 4.7
15.6 0.3
2.2 0.2
T09,S16
1117+146
0.362
1874
306
GPS
0.406
3.599
SB
–
–
5.87
1.40 0.19
T09
1146+596
0.011
47
933⋄
CSO∙
–0.011
1.237
G
0.0816 0.0022
0.0818 0.0033
0.1010 0.0002
0.007
U05
1245+676
0.107
478
9.6
CSO
0.130
1.409
G
0.33 0.14
0.358 0.098
0.531 0.006
0.031††
W09,S16
1323+321
0.368
1908
247
GPS
0.303
2.014
G
–
–
2.54 0.11
3.7 0.4
T09
1345+125
0.122
551
166
CSO
1.308
3.930
Sy⋆
83.3 1.7
216 4
87.9 0.2
7.8 1.5
T09,J13
1358+624
0.431
2298
218
GPS
1.210
2.592
Q⋆
31.0 2.4
37.8 2.8
35.4 0.2
30 20
T09
1404+286
0.077
336
10.0
CSO
1.018
3.063
Q
50.9 0.9
65.2 1.3
51.6 0.1
0.45 0.06C
T09,S16,S19b
1511+0518
0.084
370
7.3
CSO
1.233
2.899
Q
–
51.1 3
52.2 0.1
3C
S16
1607+268
0.473
2569
240
CSO
0.287
2.679
S⋆
4.21 3.17
21.6 4.4
7.27
3.79 0.87
T09,S16
1718–649
0.014
60.4
2.0
CSO
0.136
2.462
G
0.322 0.009
0.32 0.01
0.401 0.001
0.0154 0.0024
S16
1843+356
0.763
4612
22.3
CSO
1.160
4.047
Sy
–
–
190 1
5.60 2.28
S16
1934–638
0.183
845
85.1
CSO
0.609
3.360
Sy*
5.89 0.62
19 1
6.52 0.03
0.60 0.14
S16,S19a
1943+546
0.263
1285
107.1
CSO
0.628
2.191
Un
–
–
5.64 0.04
0.73 0.28
S16
1946+708
0.101
444
39.4
CSO
0.663
2.336
Un
1.75 0.15
1.67 0.10
1.69 0.01
1.20 0.18
S16,S19a
2008–068
0.547
3056
218
CSO
0.334
2.159
G
–
7.68 0.35
9.1 0.4
6 2
T09
2021+614
0.227
1086
16.1
CSO
1.287
3.009
Q
210
–
64.9 0.2
11.2C
S16,S19a
2128+048
0.990
6364
218
GPS
0.688
3.352
Sy
–
63.9 2.3
52.4
29 4
T09
2352+495
0.238
1143
117.3
CSO
0.688
2.714
Sy
–
–
4.25 0.04
1.3 0.3
T09,S16
††footnotetext:
col(1) — name of the source;
col(2) — redshift;
col(3) — luminosity distance;
col(4) — linear size of the radio lobes taken from the references provided in col(13), ⋄ except of 1146+596 cited from Perlman et al. (2001);
col(5) — morphological/spectral radio classification: Compact Symmetric Object (CSO) based on the radio morphology, Gigahertz Peaked Spectrum (GPS) based on the spectral classification; classification follows the references given in col(13), ∙ except of 1146+596 following from Perlman et al. (2001);
col(6) — WISE Difference in the W1 (3.4 m) and W2 (4.6 m) color bands;
col(7) — WISE Difference in the W2 (4.6 m) and W3 (12 m) color bands;
col(8) — color classification: “Galaxy” (G), “Starburst” (SB), Quasar/Seyfert (Q/Sy), “Uncertain” (Un); possible contamination of WISE fluxes by background/foreground sources denoted by ⋆;
col(9) — IRAS 12 m luminosity;
col(10) — Spitzer/MIPS 24 m luminosity;
col(11) — WISE 12 m luminosity calculated from the W3 band magnitude;
col(12) — unabsorbed keV luminosity taken from the references provided in col(13); ∧ extrapolated from the detection in the keV band with photon index ; † estimated from the keV upper limit erg cm-2 s-1 assuming photon index ; †† calculated based on the keV PN flux; C value corresponding to the “Compton-thick” scenario;
col(13) — X-ray references: Guainazzi et al. (2006) [G06], Jia et al. (2013) [J13], Romani et al. (2014) [R14], Siemiginowska et al. (2016) [S16], Sobolewska et al. (2019a) [S19a], Sobolewska et al. (2019b) [S19b], Tengstrand et al. (2009) [T09], Ueda et al. (2005) [U05], Watson et al. (2009) [W09].
2 Sample Selection
As mentioned in Section 1 above, in this paper we consider only radio galaxies (i) for which the redshifts are measured, (ii) are characterized by compact radio structures with linear sizes LS kpc, and are classified morphologically as CSOs and/or spectrally as GPS sources, and (iii) that have available X-ray data. After a careful inspection of literature studies, we construct a “master sample” of such objects, the majority of which make up the samples discussed by Tengstrand et al. (2009) and Siemiginowska et al. (2016), with the addition of 0026+346, 0402+379, and 1146+596 (see Guainazzi et al., 2006; Willett et al., 2010; Ostorero et al., 2017). This amounts to a total of 29 targets, including 27 that have been detected in X-rays by either XMM-Newton or Chandra, one source with the X-ray flux measured by ASCA (1146+596; see Ueda et al., 2005)111The analysis of the archival and previously unpublished Chandra data for 1146+596 will be presented in a forthcoming paper., and one source having a Chandra upper limit for its keV flux (0116+319; see Siemiginowska et al., 2016). Table 1 summarizes the basic information for the given sample, in particular, the keV and MIR luminosities.
In the accompanying paper by Wójtowicz et al. (2019), we considered a smaller sample of the youngest X-ray detected radio galaxies, by imposing a much more restrictive selection criteria, namely (i) measured redshifts, (ii) strictly CSO morphological classification, in addition with measured kinematic ages, (iii) core X-ray fluxes measured with either XMM-Newton or Chandra. All of the 17 sources analyzed by Wójtowicz et al. are included in our master sample as well.
On the other hand, in our master sample we do not include X-ray detected compact radio galaxies lacking any robust GPS or CSO classification (e.g., 0046+316, 1146+531, 1217+295, 1231+481, 1254+571; see Sobolewska et al., 2019a), or classified before as GPS/CSOs but more recently re-classified as blazars (e.g., 1413+135; see Willett et al., 2010). We also do not discuss here the more evolved radio galaxies, classified morphologically as Medium Symmetric Objects (MSOs), and/or spectrally as Compact Steep Spectrum (CSS) sources (see Kunert-Bajraszewska et al., 2014). Finally, we do not include the Fanaroff-Riley type 0 (FR0) radio galaxies (Glowacki et al., 2017; Torresi et al., 2018).
All in all, our master sample of the youngest radio galaxies, with available X-ray data, is composed predominantly (17/29) from the flux- and volume-limited set of targets extracted by Tengstrand et al. (2009) and Guainazzi et al. (2006), from a complete sample of GPS sources compiled by Stanghellini et al. (1998), by applying cuts on redshift, , and the 5 GHz flux density, Jy. For this sub-sample, the X-ray detection rate is particularly high, namely (including 0019-000 which has been detected with XMM-Newton only in the soft keV band). Secondly, our master sample includes a set (10/29) of CSOs at , with available kinematic age measurements, selected for Chandra study by Siemiginowska et al. (2016). These sources are not flux or volume limited, and the radio luminosities are on average lower than that of the Tengstrand et al. (2009) sub-sample; still, all but one (0116+319) of the sources selected by Siemiginowska et al. (2016) have been detected with Chandra, despite short exposures, ksec, for the majority of the targets. In addition to the sources in the above-mentioned sub-samples, we have also included two particularly compact and nearby CSOs, namely 0402+379 (see Willett et al., 2010), and 1146+596 (see Ostorero et al., 2017), in our master list.


3 MIR Data Acquisition
3.1 MIR Data
In this study we utilize three infrared telescopes: the Wide-field Infrared Survey Explorer (WISE), the Infrared Astronomical Satellite (IRAS), and the Spitzer instrument, the Multiband Imaging Photometer (MIPS) for NASA’s Space Infrared Telescope Facility (SIRTF). Each instrument has differing operating capabilities, all of which are detailed below.
WISE is an all sky survey mission covering the entirety of the northern and southern sky. The telescope obtains measurements in four bands (W1–W4) centered at 3.4, 4.6, 12, and 22 m respectively. The resolution in each of the bands is as follows: , , , & in each of the four bands (W1, W2, W3, W4; Wright et al., 2010).
IRAS surveys the sky at slightly longer wavelengths than WISE; its bands are centered at 12, 25, 60 and 100 . We utilize the 12 m measurements for this work with a resolution of , notably larger than WISE. It is prudent to note that the IRAS 12 band has a width of 6.5 , whereas the WISE 12 has a band width of 5.5 . This results in the IRAS measurements being on average slightly higher than the WISE measurements.
MIPS images the sky with bands centered at: 24, 70, and 160 m. For this work we inspect the 24m measurements with a given resolution of , comparable to WISE.
3.2 Source Contamination
Due to the angular resolution of WISE, and the significantly lower resolution of the IRAS instrument, source contamination due to galaxies in close proximity to our sources is possible. In order to diagnose any potential contamination, visual inspection of optical and infrared images of all sources in our sample was performed to assess if any contaminating objects lie within the field of view of the WISE or IRAS instruments. This inspection was paired with a literary search using the NASA/IPAC Extragalactic Database (NED) to identify the classification of any objects within of our sources. For this search, we restrict our inspection to only galaxies and stellar objects as their infrared luminosities are significant enough to cause a detectable shift in the infrared measurements of our sources. We note that we do not consider any unresolved infrared sources as contaminating objects.
In addition to the known interacting binary systems, and , discussed in de Vries, et al. (1998) and Jauncey, et al. (1986) respectively, we conclude that contamination in the WISE bands is possible in 8 of the 29 sources in our sample. Out of these, the following sources are expected to only have contamination in the longest-wavelength WISE band, W4 (resolution of ), which we do not use for our color classification or in further analysis: , , and . Therefore, for these four sources, the WISE color classification is expected to be unaffected by the nearby galaxies/stars, however, there is a potential for mild contamination in their IRAS fluxes. We note that from these only has available IRAS flux measurements, and the difference in the measured flux between the IRAS and WISE is , see Table 1.
 |
 |
 |
 |
 |
 |
 |
 |
 |
 |
 |
 |
 |
 |
 |
 |
 |
 |
 |
 |
 |
 |
 |
 |
 |
 |
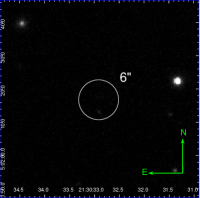 |
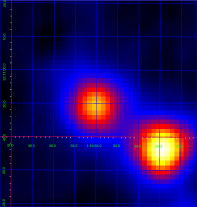
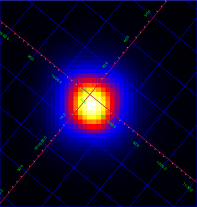
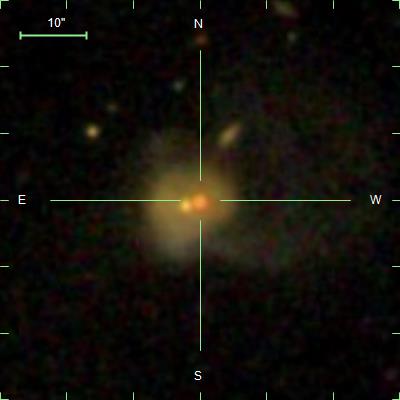
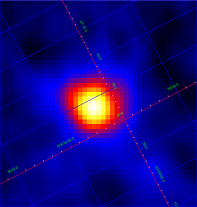
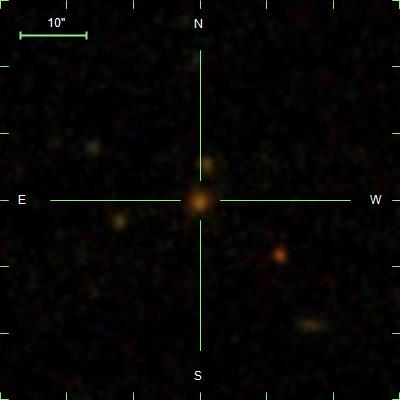
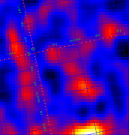
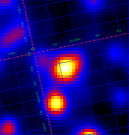
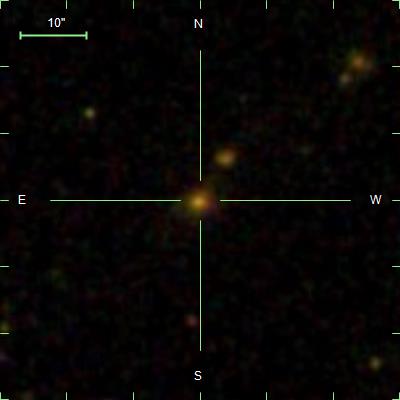
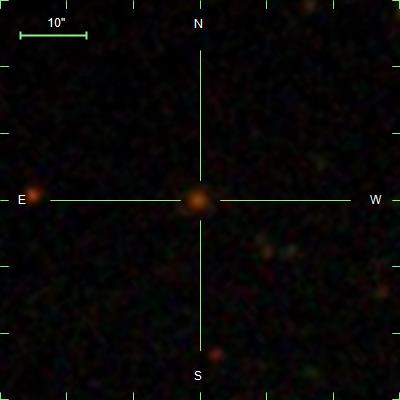
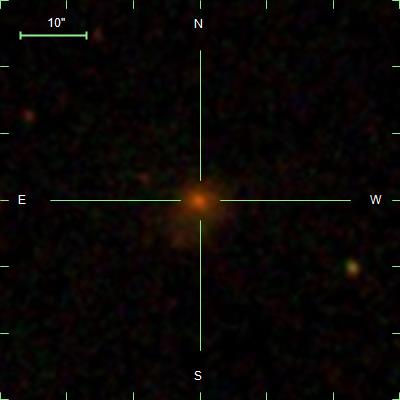
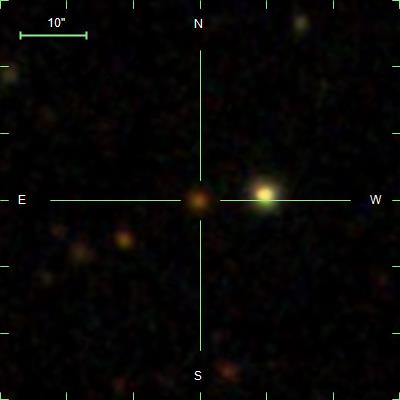
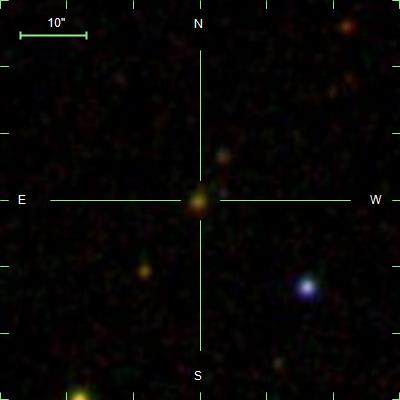
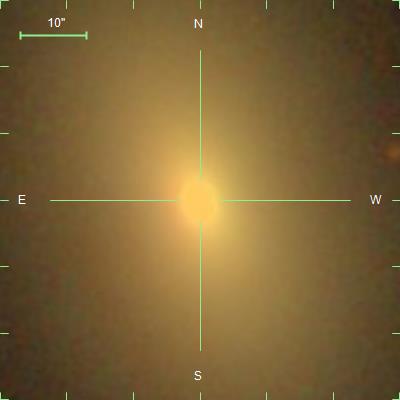
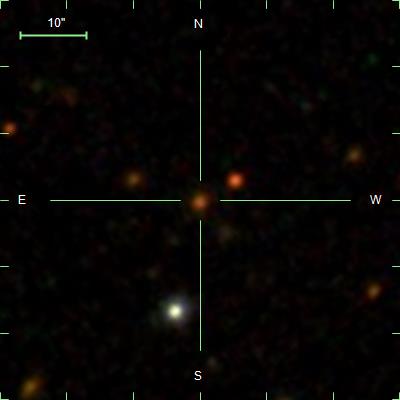
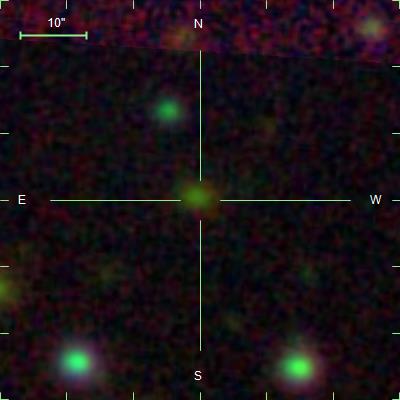
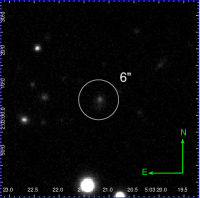
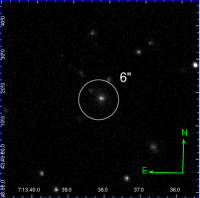
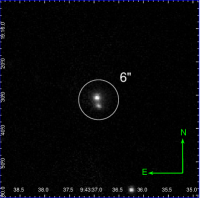
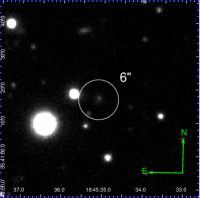
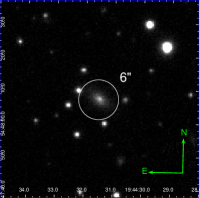
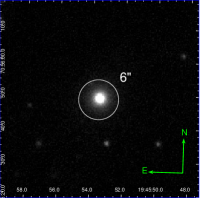
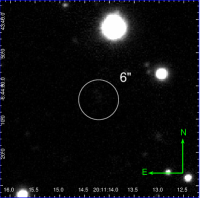
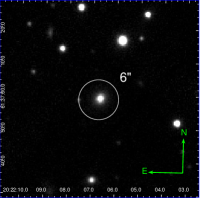
Contamination in the WISE color classification for the following sources is likely: , , , and , all marked in Table 1. These sources have galaxies and/or stars closer than , and as such would contain some level of excess flux in all four WISE bands and result in a shift in the positioning on our diagnostic plot. These four cases can be viewed in Figure 1, which displays the WISE 12 m image and the respective Sloan Digital Sky Survey (SDSS) color composite image of each source. Optical images are color composite images of the g(4770 Å), r(6231 Å), and i(7625 Å) bands obtained through the SDSS sky server. It can be clearly seen that the WISE images show a blending or merging of nearby objects that in the SDSS image are more clearly seen as separate objects. For the specific case of which has a very low flux in the 12 m band; we provide the m band image as well. The morphology of is discussed in detail in Axon, et al. (2000).
We finally note one source in particular, , which shows a significant difference between the IRAS and WISE flux measurements. The calculated IRAS luminosity is higher than the respective WISE luminosity. This is most likely due to unresolved infrared sources near to as well as poor data quality provided by IRAS. We comment, however, that the difference in the fluxes provides little change to our conclusions.
3.3 MIR Photometry
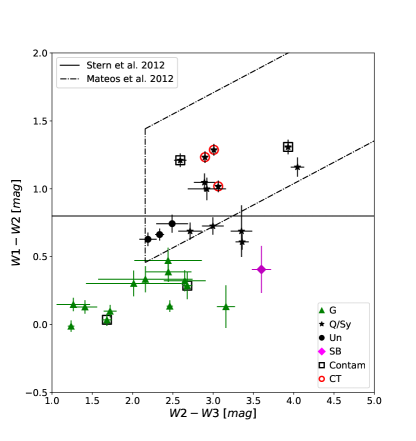
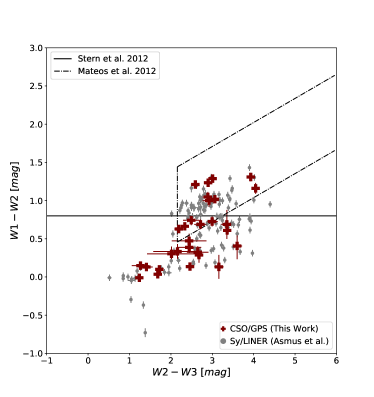
The WISE colors, W1–W2 and W2–W3, can be utilized to diagnose the suggested level of star formation within a source and suggest the type of source being observed. The WISE colors for all sources in our sample have been estimated in a standard manner based on photometry in the W1 (3.4 m), W2 (4.6 m), and W3 (12 m) bands. The W1–W2 and W2–W3 color values are provided in Table 1, and plotted in Figure 2. Based on those colors, and following the diagnostic plot provided in Wright et al. (2010), we have grouped our sources into distinct types denoted as “Galaxy” (G), “Starburst” (SB), Quasar/Seyfert (Q/Sy), or — if the color falls in a non-defined region of the diagnostic plot – “Uncertain” (Un). G type sources encompass the region of the plot associated with star formation levels typical of Elliptical and Spiral morphology.
Infrared magnitudes were obtained for all 29 sources from WISE, and their luminosities were calculated using standard flux relations. In addition, 12 m were obtained from IRAS measurements for 16 out of the 29 sources, with the corresponding luminosities provided in Table 1. We provide the 12 m IRAS and 24 m MIPS luminosities for comparison with the obtained WISE values. We note that all but four sources have comparable 24 m MIPS luminosities to the 12 m WISE and IRAS measurements. 0710+439, 1345+125, 1607+268, and 1934-638 show an increase of in the 24 m band, are all classified as Sy, and are all morphologically classified as CSO. We note these four sources for further investigation in a follow-up paper, as potentially interesting sources to inspect spectroscopically.
4 Results & Discussion
4.1 WISE Colors and Host Galaxy Morphologies
Figure 2 presents the WISE color diagnostic plot, with different symbols reflecting the WISE color identification following Wright et al. (2010). Clearly, such an identification does not serve as a rigorous classification, as it only points out the most likely origin of the detected MIR fluxes, corresponding to either the ISM with various levels of the star formation activity (G, SB) or the AGN component (Q/Sy).222Note in this context the overlaps between different types of galaxies in the WISE color classification: for example 1345+125, denoted here as “Sy”, can additionally be classified as Ultraluminous Infrared Galaxy (ULIRG; e.g., Rodríguez Zaurín et al., 2009). Quasar and Seyfert like galaxies are collected into one group due to significant overlap of their individual regions in the color–color diagram, however, we differentiate these sources in Table 1. This identification is, on the other hand, consistent with the selection cut introduced by Stern et al. (2012), and represented in the figure by a solid horizontal line: all the young radio galaxies with the WISE colors of the Q/Sy type, are indeed located either very close to the line, or much above it, and this substantiates the dominant AGN (dusty torus) contribution to the MIR emission in their cases. The overwhelming majority of our sources with the WISE classifications of Q/Sy, as well as all classified as Uncertain, fall within the Mateos et al. (2012) cut, which constitutes a reliable MIR color selection of luminous AGN, constructed based on the flux-limited wide-angle Bright Ultrahard XMM-Newton Survey (BUXS; keV flux limit of erg s-1 cm-2).
Let us comment here on a few cases from our sample with “uncertain” WISE color identification. These sources lie, in fact, within the so-called “blazar strip” (Massaro et al., 2012), which may suggest that their MIR fluxes are dominated by a non-thermal jet-related emission. Unlike in blazar sources, however, such an emission does not have to be relativistically beamed, but instead may constitute a high-energy tail of the synchrotron continuum of compact radio lobes expanding with sub-relativistic () velocities (see in this context the broad-band modelling by Ostorero et al., 2010).
Interestingly enough, all the objects in the sample confirmed as Compton-thick, based on the X-ray spectroscopy (1404+286, 1511+0518 and 2021+614; see Siemiginowska et al., 2016; Sobolewska et al., 2019a, b, respectively), are characterized by the WISE colors as being consistent with a quasar identification, as in fact expected. Hence, WISE color diagnostics could, in general, be considered as a very useful tool when selecting candidates for Compton-thick AGN among compact radio galaxies.
The most striking feature of the diagram is, however, the fact that the most compact radio galaxies with colors W1–W2 mag, i.e. those presumably dominated in MIR by the ISM radiative output, populate almost uniformly the entire region occupied by galaxies (from elliptical to starbursts) with the W2–W3 colors between 1.0 and 4.0, suggesting a wide range of pronounced star formation activity within their hosts. Such a diversity could imply that the triggering of radio jets in AGN is not differentiated between hosts with substantially different fractions of young stars.
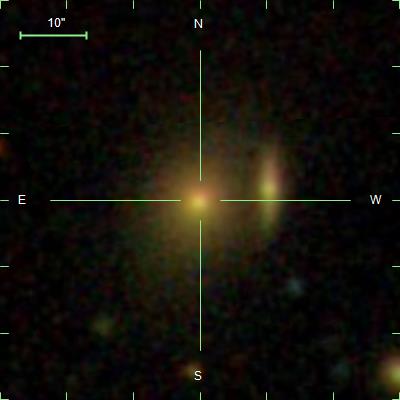
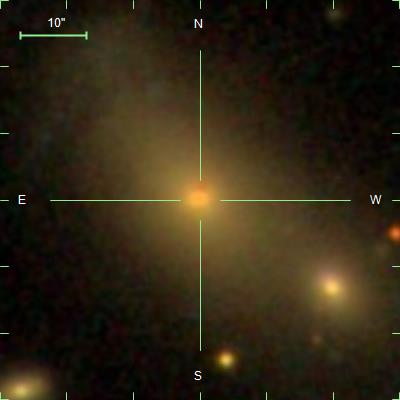
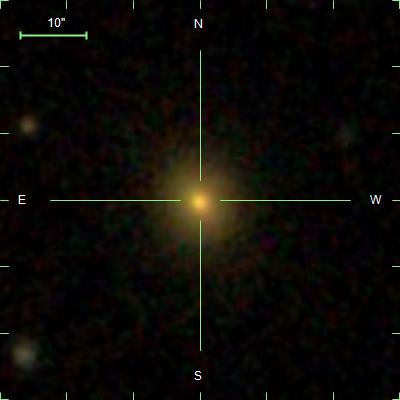
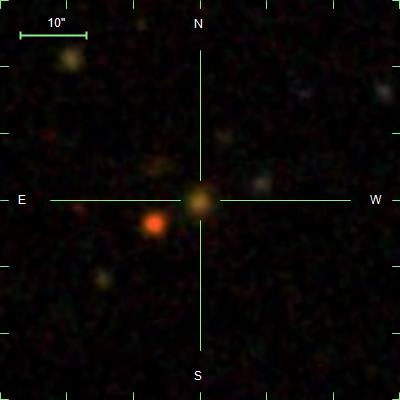
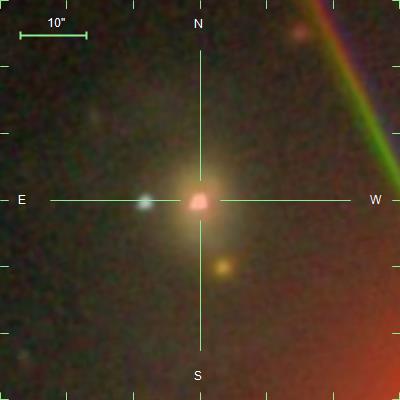
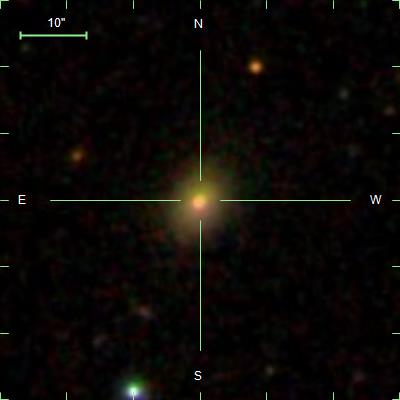
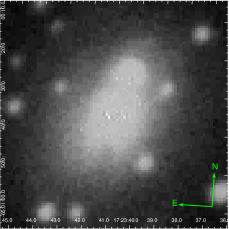
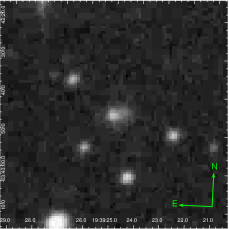
In this context, we investigate the optical images of the host galaxies in our sample. SDSS images of the host galaxies (Abolfathi et al., 2018) are available for 17 sources from our list; these are shown in Figure 3 (excluding the particularly faint 2128+048). In each image, the position of the source is indicated by a cross, while the image scale is shown in the upper left corner. These images are combined color images of the u, g, r, i, and z optical bands, obtained through the SDSS DR15 Navigate Tool. The SDSS images of the majority of our galaxies allow for an approximate morphological classification (the only exceptions are 2128+048, which is too faint to be classified, and 2352+495, whose image shows false colors). Most of the sources are red/yellow galaxies with an elliptical shape. Five galaxies have distorted morphology or show the signs of galaxy interaction; these are 0035+227, 0116+319, 0428+205, 1345+125, and 1404+286. None of the galaxies classified as ”galaxy” in the MIR color diagram shows the indication of a spiral structure. On this basis, we can conclude that the MIR colors differentiate galaxies with different levels of star formation, but they are loosely related to morphological types.
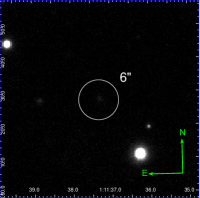
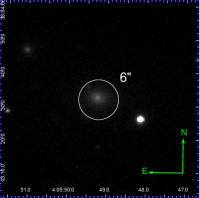
For the remaining sources which are not covered by the SDSS, or which are too faint for the SDSS, we retrieved the optical images of the hosts from the all sky survey PanSTARRS, in the i band (7563 Å), and, in the case of the two southernmost objects 1718-649 and 1934-638, from the Super Cosmos Sky Surveys in the UKST blue band; these are shown in Figures 4 and 5, respectively. Again, most of those galaxies whenever bright enough to be classified morphologically, display elliptical shapes, with the exception of the peculiar 1718–649 host, “having the appearance of a high luminosity elliptical with faint outer spiral structure” as noted by Fanti et al. (2000). We comment more on this object in Section 4.3. These images are shown as strictly optical intensity and as such no comments on their colors are made. We note that 0108+388, 2008–068, and 2128+048 are too faint in optical for any classification.
It is interesting to compare the distribution of the WISE colors in our sample of young radio galaxies with comparison samples of various types of active galaxies. For this purpose, we consider first the list of local (redshifts ) AGN compiled by Asmus et al. (2014), which includes 102 sources selected from the nine months of observations with the Burst Alert Telescope (BAT) onboard the Swift satellite within the keV band (constituting a flux limited sub-sample in the list), complemented by the AGN with the available high-resolution MIR imaging enabled by ground-based 8m class telescopes such as VLT/VISIR, Gemini/Michelle, Subaru/COMICS, or Gemini South/T-ReCS. All together there are 253 sources in the Asmus et al. sample, for which the optical spectroscopic classification includes Seyferts type I, Seyferts type II, LINERs, and AGN/starburst composites. Moreover, the AGN from this sample are hosted by various types of galaxies, including late type galaxies with bona-fide spiral structures, not only elliptical or disk systems.
The distribution of the WISE colors for the Asmus et al. (2014) sample, in a direct comparison with our sample of GPS/CSOs, is shown in the top left panel of Figure 6. In order to establish a secure sample of WISE sources, we performed two quality cuts to remove any uncertain measurements. First we removed all sources that had a null or signal to noise ratios (snr) for bands W1, W2, W3. Following this cut, we removed any sources with flagged contamination (marked by not equal to 0). These cuts left us with a sample of 121 sources from the original 253 sources in the Asmus et al. sample. Both distributions appear very similar and we quantify this statement by performing the two-dimensional Kolmogorov-Smirnov (2D KS) test, that was developed through the efforts to generalize the classical one-dimensional KS test to two (Peacock, 1983) and higher dimensions (Fasano, & Franceschini, 1987). In particular, we follow the 2D KS algorithm described in Fasano, & Franceschini (1987) and calculate — under the null hypothesis that the two analyzed samples were drawn from the same distribution — the two-tailed -value (i.e., the probability of obtaining a value of the statistic D greater than the observed value, if the null-hypothesis were true). As a result, we obtain and ; adopting a significance level of , this result implies that the null hypothesis should be accepted.
We note that the Asmus et al. (2014) sample includes both radio-quiet and also radio-loud objects — either low-power radio galaxies of the Fanaroff-Riley type I (FR Is), or high-power classical doubles, i.e. Fanaroff-Riley type II radio galaxies (FR IIs) — however, the radio properties were not taken into account when selecting the sample. That is, neither a detection of a radio counterpart nor a particular threshold value for the radio loudness parameter constituted a selection criterion. It is therefore interesting that the distribution of the WISE colors for this “hard X-ray selected/quasi MIR selected” sample of local AGN with the median redshift , is statistically similar to the distribution of WISE colors in our sample of the youngest radio galaxies, selected based on their radio properties and availability of X-ray data, and in addition spanning a wider range of redshifts from up to , with the median of . We note, however, that we are looking at a smaller set of the Asmus et al. (2014) sample, due to the quality cuts necessary for the WISE data, which could impose some unexpected selection effects.
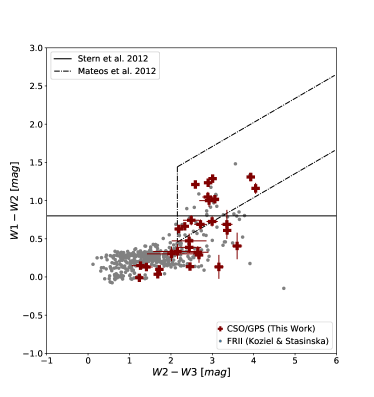
Second, we compare the MIR colors of our GPS/CSOs with those characterizing the evolved (extended) FR II type radio galaxies. In particular, we consider the FR II sample by Kozieł-Wierzbowska, & Stasińska (2011), which resulted from cross-identification of the objects included in the Cambridge Catalogues of Radio Sources (3C–9C) with galaxies from the SDSS DR7 main galaxy sample, after excluding quasars and only keeping the objects with clear FR II large-scale radio morphology, investigated manually based on the available radio maps from the NRAO VLA Sky Survey (NVSS) and the Faint Images of the Radio Sky at Twenty-cm (FIRST) survey. This sample amounts to 401 sources spanning a redshift range from up to , which is well matched to the redshift range in our GPS/CSO sample.
The distribution of the WISE colors for the Kozieł-Wierzbowska, & Stasińska (2011) sample, in a direct comparison with our sample of GPS/CSOs, is presented in the top right panel of Figure 6. As shown, the analyzed GPS/CSOs, as a population, have significantly different MIR colors than FR IIs. Unlike compact radio galaxies, the evolved FR IIs typically cluster within the area of the color diagram occupied by elliptical galaxies with very little star formation activity. In addition, we note that the sample selection adopted by Kozieł-Wierzbowska, & Stasińska (2011), specifically the removal of SDSS classified quasars, may result in a reduction of bright AGN in this sample. Again, we quantify our statement by running the 2D KS test, and obtain with the corresponding , meaning that the null hypothesis stating that the two samples were drawn from the same distribution, can be safely rejected at the adopted significance level, . This result is in fact unexpected, as CSOs (at least the most luminous ones) are widely considered to be a young progenitor of FR II radio galaxies (see, e.g., Perucho, 2016, and references therein), and the evolution of radio structures from a compact ( kpc) CSO phase to an evolved (linear sizes 10s–100s kpc) classical double phase, takes only up to Myr, which is much shorter than the timescale required for host galaxy evolution from a late to an early type.
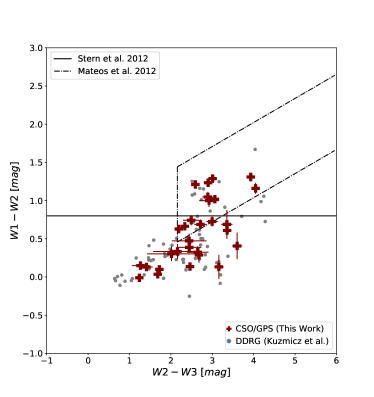
Third, we consider the sample of radio galaxies with confirmed recurrent jet activity, i.e. radio galaxies displaying clearly extended/outer radio lobes (predominantly of the FR II morphological type), in addition to a compact/inner double structure produced during the distinct, newborn jet phase. For these so-called “double-double radio galaxies” (DDRGs; see Schoenmakers et al., 2000), we use the list recently compiled by Kuźmicz et al. (2017), including 73 sources within a redshift range . The distribution of the WISE colors for this sample is given in the bottom left panel of Figure 6. The 2D KS test in this case returns with the corresponding , meaning that at the significance level of , the WISE colors for both samples of DDRGs and GPS/CSOs considered here, were drawn from the same distribution.
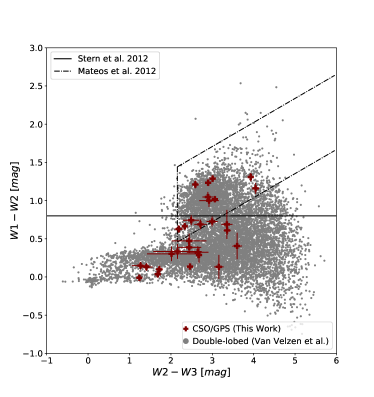
Finally, we inspect the WISE color distribution of our sample of GPS/CSOs against a larger sample of double-lobed radio sources, compiled by Van Velzen et al. (2015) by means of an automated search algorithm applied to the FIRST survey. With the adopted five quality cuts — optimized with respect to the angular size of the respective systems, their radio fluxes, as well as their radio core prominence — the sample of Van Velzen et al. consists of sources that could be safely considered as representing FR II-type radio galaxies, with radio fluxes extending down to the adopted 12 mJy limit. We performed the same two quality cuts to remove any uncertain measurements as the Asmus et al. sample. We removed all sources that had a null or signal to noise ratios (snr) for bands W1, W2, W3 as well as all sources with not equal to 0. These cuts left us with a sample of sources from the original sources in the Van Velzen et al. sample. The distribution of the WISE colors for this sample is given in the bottom right panel of Figure 6. The 2D KS for this and our sample returns a value of with the corresponding , signifying that the two data sets were not drawn from the same distribution. Indeed, it is apparent that one of the main differences here is the lack of GPS/CSOs within the region of the WISE color diagram occupied by galaxies forming stars at very high rates (starbursts, luminous- and ultraluminous-infrared galaxies), where, in contrast, many double-lobed FIRST radio sources can be found. This could signify that, either the youngest radio sources avoid hosts with very vigorous starformation, or that we are dealing with an observational bias that does not allow for differentiation of compact jets and lobes (and therefore for the “GPS/CSO” classification) in the presence of a strong radio emission from the central starburst region.
The results from all WISE color 2D KS tests are summarized in Table 2.
| Sample Set | -value | value |
|---|---|---|
| Asmus et al. | ||
| Koziel & Stasinska | ||
| Kuzmicz et al. | ||
| Van Velzen et al. |
4.2 MIR/X-ray Correlation
A similarity in the MIR colors between our GPS/CSOs and the general population of bright local AGN, prompted us to investigate a correlation between MIR and X-ray luminosities in young radio galaxies. The relationship between MIR and X-ray luminosities in various samples of AGN and in different photon energy ranges have been studied extensively in recent years. Different infrared instruments have been utilized in such analysis, including the low-resolution ISO (Lutz et al., 2004; Ramos Almeida et al., 2007), Spitzer (Hardcastle et al., 2009; Sazonov et al., 2012), AKARI (Matsuta et al., 2012; Ichikawa et al., 2012), and WISE (Mateos et al., 2015; Stern, 2015) instruments. Studies with high-resolution ground-based telescopes turned out particularly conclusive in this context, as they disclosed a tight correlation between the nuclear MIR luminosities and the 2–10 keV luminosities of the targeted AGN, which has important implications for understanding the structure of circumnuclear dusty tori in active galaxies in general (see, e.g., Horst et al., 2008; Levenson et al., 2009; Gandhi et al., 2009; Asmus et al., 2011, 2015).
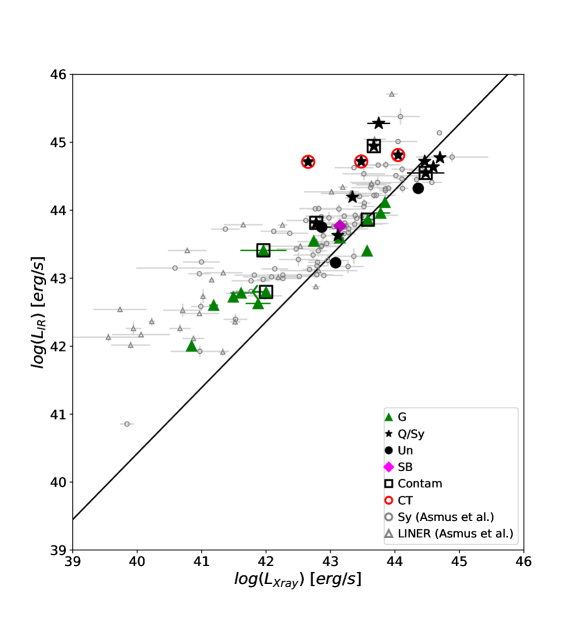
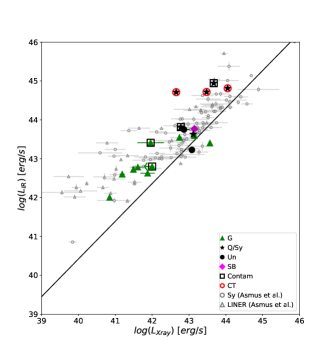
In the upper panel of Figure 7 we plot the IRAS 12 m and the intrinsic (absorption-corrected) 2–10 keV luminosities for the entire sample of our compact radio galaxies (see Table 1; large symbols in the figure), along with the comparison AGN sample by Asmus et al. (2014) introduced in the previous section, for which the 12 m luminosities were obtained similarly with the IRAS satellite (small grey symbols). In the cases of our sources we utilize the WISE 12 m measurements; note the WISE resolution at 12 m compared to the IRAS angular resolution of at 12 m. The differences in angular resolution of the instruments can result in the WISE measurements viewing a smaller region of the targeted source. Still, even with such, we are not able to extract solely the innermost nuclear regions of the galaxies, and so all of the sources included in the figure are expected to have a significant contribution from the ISM component in their MIR luminosities, this is in addition to the circumnuclear dust emission (if present). In this context, the solid line in Figure 7 denotes the best-fit linear relation between the logarithms of the luminosities, obtained by Asmus et al. (2015) when using the high-resolution MIR observations with ground-based telescopes, for their (Asmus et al., 2014) Seyfert+LINER sample,
| (1) |
As evident from the figure, the AGN from the comparison sample are located mostly above the best-fit correlation line, as expected keeping in mind the relatively poor angular resolution of IRAS, and the fact that the best-fit correlation was established based on sub-arcsec MIR photometry, and so without any significant ISM emission component. Note that the relative contribution of the ISM to the total MIR flux detected with IRAS increases for low-luminosity AGN (LINER), as expected.
The distribution of young radio galaxies in the diagram, at the first glance, resembles the distribution of the comparison local AGN sample. The emerging approximate linear scaling between the MIR and X-ray luminosities, along the correlation established by Asmus et al. (2015), could be therefore considered as an indication for the nuclear (disk corona) origin of the observed X-ray fluxes also in the GPS/CSOs sample. Indeed, at least in the case of the confirmed Compton-thick objects, this is the most plausible explanation (Guainazzi et al., 2004; Siemiginowska et al., 2016; Sobolewska et al., 2019a, b). On the other hand, in the framework of the model presented in Stawarz et al. (2008) and Ostorero et al. (2010), where the X-ray radiative output of GPS/CSOs is dominated by the non-thermal emission of the compact radio lobes, one could expect some correlation between the MIR and X-ray luminosities, because in this model X-ray photons are generated predominantly by the inverse-Comptonization of the circumnuclear dust emission by relativistic electrons within compact lobes; we analyze this possibility in more detail in Appendix A below.
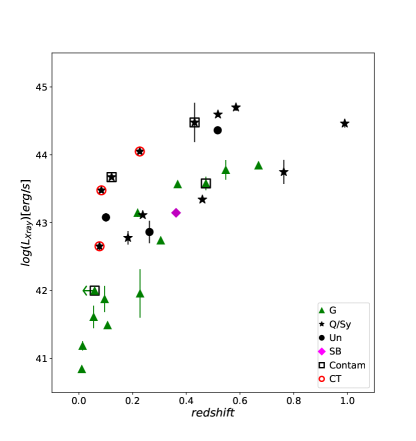
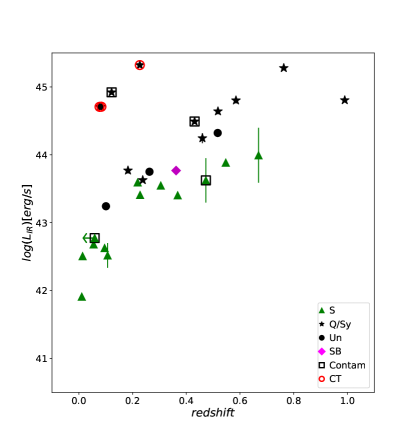
On the other hand, an approximately linear luminosity-luminosity scaling is expected in any flux limited sample of cosmologically distant sources, even in the case of no intrinsic correlations between radiative outputs in various bands (e.g., see the discussion in Singal et al., 2019). Neither our GPS/CSOs sample nor the AGN sample by Asmus et al. (2014) are, strictly speaking, flux-limited (or complete, in that matter). However, the luminosity-redshift distributions of young radio galaxies analyzed here, presented in Figure 8, indicate that we are seriously affected by flux limits in both MIR and X-ray bands, and as a result the observed luminosity-luminosity correlation may be simply due to the fact that higher- sources have to be more luminous in either band, in order to be included in the sample.
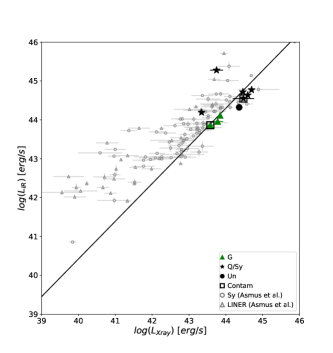
In the lower panels of Figure 7, we plot again the low-resolution WISE 12 m and the intrinsic (absorption-corrected) 2–10 keV luminosities for our GPS/CSOs, but divided into the redshift bins and (left and right panels, respectively). As shown, the overall scalings are still preserved, although there is a significant difference in the luminosity ratio between the two considered redshift bins. We perform the 2D KS test for the distributions of our GPS/CSOs and the comparison AGN from Asmus et al. (2014), and obtain with for the entire sample of young radio galaxies, with when only young radio galaxies at redshifts are considered, and with for the GPS/CSOs with (see Table 3). These values imply that our null hypothesis — stating that, in the “low-resolution MIR luminosity vs. absorption-corrected X-ray luminosity” representation, the GPS/CSOs and the comparison AGN samples are drawn from the same distribution — can be rejected only for high-redshift sources.
| Sample Set | -value | value |
|---|---|---|
| Full Sample | ||
Those high-redshift targets, on the other hand, appear (visually) to match very well the best-fit correlation line of Asmus et al. (2015) established based on sub-arcsec MIR photometry of local AGN. This should not be surprising, however, noting that at high MIR luminosities characterizing our sources, erg s-1, any contribution from the ISM component with a moderate star formation rate (up to yr-1), is expected to be rather minor, and so the fluxes extracted even with low-resolution instruments such as IRAS or WISE, should be dominated by the radiative output of circumnuclear dust.
On the related note, we comment that in the case of young radio galaxies, the only ones with exceeding erg s-1, are the three Compton-thick objects 1404+286, 1511+0518 and 2021+614, and the peculiar 1345+125, which can also be classified as Ultraluminous Infrared Galaxies (see Rodríguez Zaurín et al., 2009). Those four sources appear in fact over-luminous in MIR for their given intrinsic (absorption-corrected) X-ray luminosities when compared to the general local AGN population, as well as other local GPS/CSOs (see in this context the right panel in Figure 8).
4.3 Gamma-ray Emitters 1718–649 & 1146+596
1718–649 and 1146+596 are the two lowest-luminosity sources in our sample, which are rather unique objects for several reasons. 1718–649 is particularly young and compact (LS pc, yr; Tingay et al., 1997; Tingay & de Kool, 2003; Giroletti & Polatidis, 2009), located at the distance of 60 Mpc only, and most importantly, it is the first bona-fide CSO detected in the high-energy -ray range with Fermi Large Area Telescope (LAT; see the analysis and the discussion in Migliori et al., 2016). 1146+596 is characterized by a much larger LS pc (Taylor et al., 1998; Perlman et al., 2001)333We note that 1146+596 is characterized by multiple radio outbursts, and the most compact radio component in the source, for which the kinematic age has been estimated as yr, has a linear size of 3.5 pc (Principe et al., 2020)., but located at a comparable distance of 47 Mpc, and recently associated with the -ray source 4FGL J1149.0+5924 in the Fermi LAT 8-Year Point Source Catalog (4FGL; The Fermi-LAT collaboration, 2019). The question follows if the observed -ray emission in both sources is related to the jet activity and compact radio lobes in particular (Stawarz et al., 2008; Kino et al., 2009), or is instead due to the star formation activity within the hosts, analogous to the LAT-detected, star-forming and starburst galaxies (Ackermann et al., 2012; Hayashida et al., 2013; Rojas-Bravo & Araya, 2016).
In order to address this question, we have collected all archival infrared data for both sources, including near-infrared 2MASS and MIR Spitzer spectra, as well as mm fluxes from WMAP, and estimated the integrated m luminosities, and next the star-formation rates assuming the Kennicutt (1998) scaling relation
| (2) |
with the initial mass function factor (Ackermann et al., 2012). The resulting values, given in Table 4, are consistent with the SFR estimates by Willett et al. (2010) for 1718–649, based on either Ne lines or PAH features in the Spitzer high-resolution spectra (see the Table). In the case of 1146+596 we achieve a lower SFR estimate based on the integrated luminosity, which may be due in part to poor data quality (i.e. lack of data points over the infrared range) as well as due to the fact that some MIR emission can come from the dust heated by old stellar populations and not indeed by star formation itself. As both sources are the weakest MIR emitters in the sample, the SFR at the corresponding level of yr-1 should be considered as the limiting value for young radio galaxies analyzed here. Assuming further the best-fit correlation derived by Ackermann et al. (2012) for the LAT-detected, star-forming and starburst galaxies,
| (3) |
we next derived the ISM-related GeV luminosities for the two targets, which are both at the level of erg s-1, as listed in Table 4.
| Name | SFRIR | SFRNe | SFRPAH | |||
|---|---|---|---|---|---|---|
| erg s-1 | yr-1 | yr-1 | yr-1 | erg s-1 | erg s-1 | |
| (1) | (2) | (3) | (4) | (5) | (6) | (7) |
| 1146+596 | ||||||
| 1718–649 |
Meanwhile, the integrated GeV photon flux of the high-energy -ray counterpart of 1718–649 provided by Migliori et al. (2016), ph cm-2 s-1, along with the best-fit photon index , yields the luminosity erg s-1, which is three orders of magnitude larger than the one expected for the ISM emission as estimated above. Similarly, for 1146+596, based on the integrated GeV photon flux of the high-energy -ray counterpart provided in 4FGL, ph cm-2 s-1, along with the best-fit photon index , we derive the luminosity erg s-1, which is again orders of magnitude larger than the expected emission for the ISM component alone.
Hence, we conclude that the -ray emission detected with Fermi-LAT from 1718–649 and 1146+596, is undoubtedly related to the jet activity in the sources, and not the star formation activity. This strengthens the expectation that compact lobes/jets in young radio galaxies are in general -ray emitters. Moreover, we note that the two CSOs detected by Fermi LAT so far, are in fact the nearest objects in our sample. This suggests that with a longer accumulation of the LAT data, the most promising candidates for the -ray detection should be 0116+319 and 0402+379 (luminosity distances Mpc; see Table 1), and — even more excitingly — the two Compton-thick CSOs 1404+286 and 1511+0518 (luminosity distances Mpc).
The existence of an intrinsic link between the X-ray and -ray luminosities among CSO/GPS galaxies, is still an open question, having only two such sources detected in high-energy gamma-rays. However, theoretical modeling suggest there may be a linear correlation between the X-ray and -ray bands related to the radiative output of the jets in young radio sources, for further discussion see Migliori et al. (2014). Additional -ray detections of young radio galaxies could shed light on this issue and allow more conclusive statements on this relationship.
5 Conclusions
In this paper we have discussed the MIR properties of the most compact (GPS/CSO-type) radio galaxies, based predominantly on the lower-resolution MIR data provided by WISE and IRAS satellites (augmented in a few cases by the Spitzer observations). We have restricted our analysis to only those objects which have been observed in X-rays with either XMM-Newton or Chandra, and this resulted in the sample of 29 objects.
The inspection of optical images for the targets, implies that the analyzed GPS/CSOs are hosted predominantly by red/yellow galaxies with an elliptical shape, with several cases containing distorted morphology or signs of galaxy interaction.
In our sample we found a variety of WISE colors, suggesting that the MIR continua of the studied sources are contributed not exclusively by the circumnuclear dust, but also by the ISM of host galaxies, and in a few cases even by the non-thermal emission of compact jets and lobes. Such a diversity resembles a general population of bright local AGN (Asmus et al., 2014). In particular, we found that young radio galaxies with the MIR emission dominated by the ISM component, populate almost uniformly the entire region occupied by galaxies (from elliptical to starbursts) with a wide range of a pronounced star formation activity (rates yr-1). This constitutes a significant difference with the population of the evolved ordinary FR II radio galaxies (Kozieł-Wierzbowska, & Stasińska, 2011), which are clustered within the area of the MIR color diagram occupied by elliptical galaxies with very little star formation activity. This unexpected result — keeping in mind the general expectation that luminous CSOs are young progenitor of FR II radio galaxies — could signal a negative feedback at work, meaning that that expanding jets and lobes, during their evolution from a compact CSO phase up to the evolved classical double phase, suppress the star formation in galactic hosts. Yet we also found that the distribution of the MIR colors in our GPS/CSOs sample is statistically indistinguishable from the distribution of MIR colors of large-scale radio galaxies but with recurrent jet activity (DDRGs; Kuźmicz et al., 2017). We quantified our statement by performing two-dimensional Kolmogorov-Smirnov tests.
All these findings seems therefore to imply that (1) triggering radio jets in AGN does not differentiate between elliptical hosts with substantially different fractions of young stars, and (2) it is the jet duty cycle — and not the jet launching itself — which is related to the star formation rate within the host, in that radio galaxies hosted by galaxies with more pronounced population of young stars are either typically short lived (i.e., not surviving long enough to form an extended FR II structure), or characterized by a highly modulated/recurrent jet activity. We note in this context that, in the accompanying paper Wójtowicz et al. (2019), we derived the bolometric luminosities of the accretion disks and the black hole masses for about half of the GPS/CSOs sample analyzed here, and demonstrated that the corresponding accretion rates are in all the cases high, namely between and in Eddington units.
The caveat here is the WISE color distribution of our sample of GPS/CSOs against a larger sample of double-lobed radio sources from Van Velzen et al. (2015), suggest at the same time that the youngest radio sources avoid hosts with very vigorous starformation. However, a more plausible explanations is that there exists an observational bias which does not allow for differentiation of compact jets and lobes (and therefore for the “GPS/CSO” classification) in the presence of a strong radio emission from the central starburst region.
The distribution of the sub-sample of our sources with on the low-resolution MIR vs. absorption-corrected X-ray luminosity plane is consistent with the distribution of a sample of local AGN on the same plane (Asmus et al., 2014). High-resolution (sub-arcsec) MIR photometry of the studied sources, along with deep X-ray exposures, are required in order to make any conclusive statements on the origin of the emerging luminosity-luminosity correlation.
Interestingly, all the confirmed Compton-thick objects in the sample — 1404+286, 1511+0518 and 2021+614 — are characterized by the WISE colors consistent with quasar identification, and, in addition, appear over-luminous in MIR for the given level of their intrinsic X-ray emission when compared to the general local AGN population as well as other local GPS/CSOs. Hence, WISE color diagnostics and photometry could, in general, be considered as a very useful tool when selecting candidates for Compton-thick AGN among compact radio galaxies. Note in this context that, compact radio sources are particularly abundant in flux-limited radio samples, constituting of the bright radio-source population (O’Dea, 1998; Sadler, 2016).
Finally, we discussed in more detail the particular case of the -ray–detected 1718–649 and 1146+596. By means of a comparison with the sample of star-forming and starburst galaxies detected with Fermi-LAT, we have argued that the -ray flux observed from these, is undoubtedly related to the jet activity in the sources, and not due to the star formation activity. This strengthens the expectation that compact lobes/jets in young radio galaxies are in general -ray emitters, albeit relatively weak so that the Fermi-LAT detections are currently limited to the two the nearest objects in the sample.
References
- Abolfathi et al. (2018) Abolfathi, B., Aguado, D. S., Aguilar, G., et al. 2018, ApJS, 235, 42
- Ackermann et al. (2012) Ackermann, M., Ajello, M., Allafort, A., et al. 2012, ApJ, 755, 164
- Allison et al. (2019) Allison, J. R., Mahony, E. K., Moss, V. A., et al. 2019, MNRAS, 482, 2934
- Asmus et al. (2011) Asmus, D., Gandhi, P., Smette, A., Hönig, S. F., & Duschl, W. J. 2011, A&A, 536, A36
- Asmus et al. (2014) Asmus, D., Hönig, S. F., Gandhi, P., Smette, A., & Duschl, W. J. 2014, MNRAS, 439, 1648
- Asmus et al. (2015) Asmus, D., Gandhi, P., Hönig, S. F., Smette, A., & Duschl, W. J. 2015, MNRAS, 454, 766
- Axon, et al. (2000) Axon D. J., Capetti A., Fanti R., Morganti R., Robinson A., Spencer R., 2000, AJ, 120, 2284
- Beuchert et al. (2018) Beuchert, T., Rodríguez-Ardila, A., Moss, V. A., et al. 2018, A&A, 612, L4
- Chambers et al. (2016) Chambers, K. C., Magnier, E. A., Metcalfe, N., et al. 2016, arXiv e-prints, arXiv:1612.05560
- Czerny & You (2016) Czerny, B., & You, B. 2016, Astronomische Nachrichten, 337, 73
- de Vries et al. (1997) de Vries, W. H., Barthel, P. D., & O’Dea, C. P. 1997, A&A, 321, 105
- de Vries, et al. (1998) de Vries W. H., et al., 1998, ApJ, 503, 138
- Dicken et al. (2012) Dicken, D., Tadhunter, C., Axon, D., et al. 2012, ApJ, 745, 172
- Fanti et al. (2000) Fanti, C., Pozzi, F., Fanti, R., et al. 2000, A&A, 358, 499
- Fasano, & Franceschini (1987) Fasano, G., & Franceschini, A. 1987, MNRAS, 225, 155
- The Fermi-LAT collaboration (2019) The Fermi-LAT collaboration 2019, arXiv e-prints, arXiv:1902.10045
- Gandhi et al. (2009) Gandhi, P., Horst, H., Smette, A., et al. 2009, A&A, 502, 457
- Giroletti & Polatidis (2009) Giroletti, M., & Polatidis, A. 2009, Astronomische Nachrichten, 330, 193
- Glowacki et al. (2017) Glowacki, M., Allison, J. R., Sadler, E. M., et al. 2017, MNRAS, 467, 2766
- Guainazzi et al. (2004) Guainazzi, M., Siemiginowska, A., Rodriguez-Pascual, P., & Stanghellini, C. 2004, A&A, 421, 461
- Guainazzi et al. (2006) Guainazzi, M., Siemiginowska, A., Stanghellini, C., et al. 2006, A&A, 446, 87
- Hardcastle et al. (2009) Hardcastle, M. J., Evans, D. A., & Croston, J. H. 2009, MNRAS, 396, 1929
- Hayashida et al. (2013) Hayashida, M., Stawarz, Ł., Cheung, C. C., et al. 2013, ApJ, 779, 131
- Heckman et al. (1994) Heckman, T. M., O’Dea, C. P., Baum, S. A., & Laurikainen, E. 1994, ApJ, 428, 65
- Horst et al. (2008) Horst, H., Gandhi, P., Smette, A., & Duschl, W. J. 2008, A&A, 479, 389
- Ichikawa et al. (2012) Ichikawa, K., Ueda, Y., Terashim a, Y., et al. 2012, ApJ, 754, 45
- Jauncey, et al. (1986) Jauncey D. L., White G. L., Batty M. J., Preston R. A., 1986, AJ, 92, 1036
- Jia et al. (2013) Jia, J., Ptak, A., Heckman, T., & Zakamska, N. L. 2013, ApJ, 777, 27
- Kawakatu et al. (2008) Kawakatu, N., Nagai, H., & Kino, M. 2008, ApJ, 687, 141
- Kellermann et al. (2004) Kellermann, K. I., Lister, M. L., Homan, D. C., et al. 2004, ApJ, 609, 539
- Kennicutt (1998) Kennicutt, R. C., Jr. 1998, ApJ, 498, 541
- Kino et al. (2009) Kino, M., Ito, H., Kawakatu, N., & Nagai, H. 2009, MNRAS, 395, L43
- Kozieł-Wierzbowska, & Stasińska (2011) Kozieł-Wierzbowska, D., & Stasińska, G. 2011, MNRAS, 415, 1013
- Kunert-Bajraszewska et al. (2014) Kunert-Bajraszewska, M., Labiano, A., Siemiginowska, A., & Guainazzi, M. 2014, MNRAS, 437, 3063
- Kuźmicz et al. (2017) Kuźmicz, A., Jamrozy, M., Kozieł-Wierzbowska, D., et al. 2017, MNRAS, 471, 3806
- Levenson et al. (2009) Levenson, N. A., Radomski, J. T., Packham, C., et al. 2009, ApJ, 703, 390
- Lutz et al. (2004) Lutz, D., Maiolino, R., Spoon, H. W. W., & Moorwood, A. F. M. 2004, A&A, 418, 465
- Massaro et al. (2012) Massaro, F., D’Abrusco, R., Tosti, G., et al. 2012, ApJ, 750, 138
- Mateos et al. (2012) Mateos, S., Alonso-Herrero, A., Carrera, F. J., et al. 2012, MNRAS, 426, 3271
- Mateos et al. (2015) Mateos, S., Carrera, F. J., Alonso-Herrero, A., et al. 2015, MNRAS, 449, 1422
- Matsuta et al. (2012) Matsuta, K., Gandhi, P., Dotani, T., et al. 2012, ApJ, 753, 104
- Migliori et al. (2014) Migliori, G., Siemiginowska, A., Kelly, B. C., et al. 2014, ApJ, 780, 165
- Migliori et al. (2016) Migliori, G., Siemiginowska, A., Sobolewska, M., et al. 2016, ApJ, 821, L31
- O’Dea (1998) O’Dea, C. P. 1998, PASP, 110, 493
- O’Dea (2016) O’Dea, C. P. 2016, Astronomische Nachrichten, 337, 141
- Ostorero et al. (2010) Ostorero, L., Moderski, R., Stawarz, Ł., et al. 2010, ApJ, 715, 1071
- Ostorero et al. (2017) Ostorero, L., Morganti, R., Diaferio, A., et al. 2017, ApJ, 849, 34
- Peacock (1983) Peacock, J. A. 1983, MNRAS, 202, 615
- Perlman et al. (2001) Perlman, E. S., Stocke, J. T., Conway, J., & Reynolds, C. 2001, AJ, 122, 536
- Perucho (2016) Perucho, M. 2016, Astronomische Nachrichten, 337, 18
- Principe et al. (2020) Principe, G., Migliori, G., Johnson, T. J., et al. 2020, A&A, 635, A185
- Ramos Almeida et al. (2007) Ramos Almeida, C., Pérez García, A. M., Acosta-Pulido, J. A., & Rodríguez Espinosa, J. M. 2007, AJ, 134, 2006
- Rodríguez Zaurín et al. (2009) Rodríguez Zaurín, J., Tadhunter, C. N., & González Delgado, R. M. 2009, MNRAS, 400, 1139
- Rojas-Bravo & Araya (2016) Rojas-Bravo, C., & Araya, M. 2016, MNRAS, 463, 1068
- Romani et al. (2014) Romani, R. W., Forman, W. R., Jones, C., et al. 2014, ApJ, 780, 149
- Sadler (2016) Sadler, E. M. 2016, Astronomische Nachrichten, 337, 105
- Sazonov et al. (2012) Sazonov, S., Willner, S. P., Goulding, A. D., et al. 2012, ApJ, 757, 181
- Schoenmakers et al. (2000) Schoenmakers, A. P., de Bruyn, A. G., Röttgering, H. J. A., et al. 2000, MNRAS, 315, 371
- Siemiginowska et al. (2008) Siemiginowska, A., LaMassa, S., Aldcroft, T. L., Bechtold, J., & Elvis, M. 2008, ApJ, 684, 811
- Siemiginowska et al. (2009) Siemiginowska, A. 2009, AStronomische Nachrichten, 330, 264
- Siemiginowska et al. (2016) Siemiginowska, A., Sobolewska, M., Migliori, G., et al. 2016, ApJ, 823, 57
- Singal et al. (2019) Singal, J., Petrosian, V., Haider, J., et al. 2019, ApJ, 877, 63
- Sobolewska et al. (2019a) Sobolewska, M., Siemiginowska, A., Guainazzi, M., et al. 2019a, ApJ, 871, 71
- Sobolewska et al. (2019b) Sobolewska, M., Siemiginowska, A., Guainazzi, M., et al. 2019b, ApJ, 884, 166
- Stanghellini et al. (1998) Stanghellini, C., O’Dea, C. P., Dallacasa, D., et al. 1998, A&AS, 131, 303
- Stawarz et al. (2008) Stawarz, Ł., Ostorero, L., Begelman, M. C., et al. 2008, ApJ, 680, 911
- Stern (2015) Stern, D. 2015, ApJ, 807, 129
- Stern et al. (2012) Stern, D., Assef, R. J., Benford, D. J., et al. 2012, ApJ, 753, 30
- Tadhunter (2016) Tadhunter, C. 2016, Astronomische Nachrichten, 337, 159
- Tadhunter et al. (2011) Tadhunter, C., Holt, J., González Delgado, R., et al. 2011, MNRAS, 412, 960
- Taylor et al. (1998) Taylor, G. B., Wrobel, J. M., & Vermeulen, R. C. 1998, ApJ, 498, 619
- Tengstrand et al. (2009) Tengstrand, O., Guainazzi, M., Siemiginowska, A., et al. 2009, A&A, 501, 89
- Tingay et al. (1997) Tingay, S. J., Jauncey, D. L., Reynolds, J. E., et al. 1997, AJ, 113, 2025
- Tingay & de Kool (2003) Tingay, S. J., & de Kool, M. 2003, AJ, 126, 723
- Torresi et al. (2018) Torresi, E., Grandi, P., Capetti, A., Baldi, R. D., & Giovannini, G. 2018, MNRAS, 476, 5535
- Ueda et al. (2005) Ueda, Y., Ishisaki, Y., Takahashi, T., Makishima, K., & Ohashi, T. 2005, ApJS, 161, 185
- Van Velzen et al. (2015) van Velzen S., Falcke H., Körding E. 2015, MNRAS, 446, 2985
- Vink et al. (2006) Vink, J., Snellen, I., Mack, K.-H., & Schilizzi, R. 2006, MNRAS, 367, 928
- Wagner et al. (2016) Wagner, A. Y., Bicknell, G. V., Umemura, M., Sutherland, R. S., & Silk, J. 2016, Astronomische Nachrichten, 337, 167
- Watson et al. (2009) Watson, M. G., Schröder, A. C., Fyfe, D., et al. 2009, A&A, 493, 339
- Willett et al. (2010) Willett, K. W., Stocke, J. T., Darling, J., & Perlman, E. S. 2010, ApJ, 713, 1393
- Wójtowicz et al. (2019) Wójtowicz, A., Stawarz, Ł., Cheung, C. C., et al. 2019, arXiv e-prints, arXiv:1911.01197
- Wright et al. (2010) Wright, E. L., Eisenhardt, P. R. M., Mainzer, A. K., et al. 2010, AJ, 140, 1868
Appendix A Non-thermal X-ray Emission of Young Radio Galaxies
Below we provide a very simplified approximation for the expected X-ray luminosity of compact radio lobes in compact radio galaxies, following Stawarz et al. (2008). In this model, the monochromatic lobes’ luminosity is
| (A1) |
where is the volume of the lobes, is the energy density of the circumnuclear dust emission at the position of the lobes, is the energy spectrum of ultrarelativistic electrons with Lorentz factors , and is the energy of the Compton-upscattered seed photon. By following the evolution of the electrons subjected to radiative and adiabatic energy losses within the expanding lobes, Stawarz et al. (2008, section 3.1. therein) showed that in the case of a single power-law injection rate with and the normalization constant , for a given age of a source the electron spectrum can be approximated by , where for and otherwise, and is the cooling break energy depending on the jet’s total kinetic luminosity . We further assume an energy equipartition between ultrarelativistic electrons and the lobes’ magnetic field, meaning , where is the electron energy density. Note that , where LS is the linear size of the lobes, taken as the distance between the the jet termination shocks (hereafter “hotspots”) in a given source, and is the expansion velocity of the lobes, measured as the separation velocity between the hotspots.
For the seed photon’s energy density at the position of the lobes, we simply take , where is the effective radius of the lobes, approximated as an ellipsoid with a semi-major axis and semi-minor axis (see in this context Kawakatu et al., 2008; Wójtowicz et al., 2019), and is the total MIR luminosity of the hot dusty torus, with a mean photon energy for m. Given all the above, one may find
| (A2) |
where . We next note, for the injection index corresponding to the mean radio spectral index of compact radio galaxies (de Vries et al., 1997), the last term in the above relation containing integrals over , depends only weakly on the jet kinetic power, and within a wide range of reads as . Hence, a very simple approximate scaling emerges
| (A3) |
One should keep in mind that the scaling relation derived above relies on several crude approximations, in particular the spectral shape of the electron injection function, so it is possible that in several cases a more detailed modelling, taking into account the exact shape of the radio continua of the studied sources (as presented in Ostorero et al., 2010), could result in an elevated level of the expected inverse-Compton emission of compact lobes in the X-ray domain. Additionally, the true jet kinetic luminosities may be larger than the minimum values utilized here. Keeping all these caveats in mind, we conclude that a significant contribution of the non-thermal emission of compact lobes to the observed radiative output of compact radio galaxies in the X-ray domain, remains a plausible option, and that the resulting X-ray luminosity should scale with the MIR luminosity of dusty tori, albeit with a wider scatter due to the dependance of the ratio on the jet kinetic luminosity , the linear size of radio lobes, and the expansion velocity of compact lobes .