Anomalous Anisotropy of the Lower Critical Field and Meissner Effect in UTe2
Abstract
We report on low temperature susceptibility and magnetization measurements made on single crystals of the recently discovered heavy-fermion superconductor UTe2 and compare the results with the two ambient pressure ferromagnetic superconductors URhGe and UCoGe. Hysteresis curves in the superconducting phase show a familiar diamond shape superimposed on a large paramagnetic background. The Meissner state was measured by zero field cooling in small fields of a few Oe as well as ac susceptibility measurements in small fields and resulted in 100% shielding, with a sharp transition. However the field cooling Meissner-Ochsenfeld effect (expulsion of flux) was negligible in fields greater than just a few Oe, but becomes nearly 30% of the perfect diamagnetic signal when the field was reduced to 0.01 Oe. The critical current due to flux pinning was studied by ac susceptibility techniques. Over the range in fields and temperature of this study, no signature of a ferromagnetic transition could be discerned. The lower critical field has been measured along the three crystalographic axes, and surprisingly, the anisotropy of contradicts that of the upper critical field. We discuss this discrepancy and show that it may provide additional support for a magnetic field-dependent pairing mediated by ferromagnetic fluctuations in UTe2.
Spin triplet superconductivity (SC) in itinerant ferromagnets close to the ferromagnetic (FM) – paramagnetic (PM) instability was proposed four decades ago Fay and Appel (1980). The discovery of the coexistence of ferromagnetism and SC in UGe2 opened the “rush” to a large variety of experiments Saxena et al. (2000). The strong first order nature of the FM – PM transition under pressure at GPa leads to SC occuring only in the FM domain in the pressure range from 1.2 GPa to 1.6 GPa; the maximum of the superconducting temperature is 0.8 K, but the Curie temperature K.Aoki et al. (2019a)
The field was enriched by the discoveries of two ambient pressure superconducting ferromagnets, URhGe Aoki et al. (2001) and UCoGe Huy et al. (2007), with K and 0.8 K, much lower than the respective K and 2.7 K. The rapid suppression of in UCoGe with pressure leads a the PM ground state above 1 GPa with the persistence of SC far above the critical pressure Bastien et al. (2016). For both systems, the weakness of the FM interaction means that transverse magnetic fields () applied along the axis, perpendicular to the easy magnetization axis , of these orthorhombic crystals gives rise to a spectacular field-enhancement of SC Lévy et al. (2005); Aoki et al. (2009, 2019a).
The recent observation of SC in orthorhombic UTe2 Ran et al. (2019a); Aoki et al. (2019b) at K opens the possibility to study at ambient pressure spin-triplet SC in a system with a PM ground state located very close to a PM - FM instability. UTe2 has the highest susceptibility Ikeda et al. (2006) and strong magnetic fluctuations Tokunaga et al. (2019) along the axis. However, the transverse field configuration with attracted the most attention, due to the observation of a strong field-induced reinforcement of SC on approaching the metamagnetic field T.Miyake et al. (2019); Knafo et al. (2019); Knebel et al. (2019); Ran et al. (2019b) Most of the published magnetization data in FM SC investigate the field dependence of the FM interaction by longitudinal or transverse field variation. Hardy et al. (2011); Nakamura et al. (2017); Wu et al. (2017).
In URhGe and UCoGe the respective FM sublattice magnetization and 0.07 per U-atom produces an internal field of 800 G and 100 G far higher than the estimated value of the lower superconducting critical field of a few gauss. Thus even at , self-induced vortices should occur, as shown for example in the magnetization studies on UCoGe Paulsen et al. (2012).
In this Letter we report low temperature susceptibility and magnetization measurements on two crystals of UTe2 ( and 1.6 K). The experiments concentrate on (i) the persistence of the PM state well below K, (ii) the strength of the Meissner effect in field-cooled (FC) experiments, (iii) the proof of a complete superconducting screening in zero field cooled (ZFC) magnetization measurements, (iv) the determination of , and (v) the determination of the London penetration depth and of the the superconducting coherence length from and from the upper critical field . We compare the results with the FM superconductors URhGe and UCoGe.sup
All the measurements were made using two low-temperature superconducting quantum interference device (SQUID) magnetometers developed at the Institut Néel in Grenoble. A unique feature of the setup is that absolute values of the magnetization can be measured using the extraction method in a field range from 0.01 Oe up to 8 T (for details see the Supplemental Material sup ).
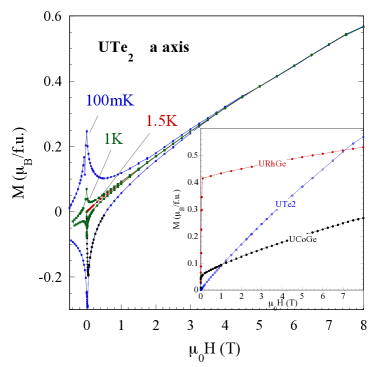
Figure 1 shows hysteresis loops for UTe2 measured at 100 mK and 1 K below , and at 1.5K in the normal phase for UTe2 with the field direction along the easy magnetization axis. The slope of the initial magnetization [also shown later more clearly in Fig. 4(a)] corresponds to 100% shielding. The insert of Fig 1 compares UTe2 at 1.5K to the two FM superconductors URhGe and UCoGe, with the field applied along their easy axis, at 500 mK and 600 mK above their respective superconducting states, but far below their respective Curie temperatures. The spontaneous moment of both ferromagnetic superconductors appears clearly, however, it is not a saturated moment: keeps growing with increasing field. Although there is no spontaneous moment for UTe2, the PM magnetization increases quickly and becomes larger than in UCoGe at about 1 T, and then greater than in URhGe above 7 T.
The hysteresis loops for UTe2 have a familiar superconducting diamond shape which is superimposed on a very large PM background response. More hysteresis loops taken close to are shown in Fig. S5 in the Supplemental Material, as well as a comparison with UCoGe in Figs. S6 and S7. In contrast to UCoGe where the superconducting and FM signals are fused together with the FM response dominating Paulsen et al. (2012), our measurements of UTe2 over the full temperature and field range show that there is no hint of FM behavior down to 80 mK in agreement with muon spin rotation (SR) experiments.Sundar et al. (2019)
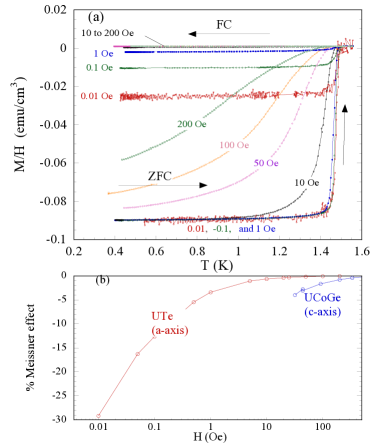
In Fig. 2(a) the dc susceptibility is plotted against temperature for various applied fields ranging from 0.01 to 200 Oe. Each curve was made by first zero-field-cooling (ZFC) the sample. A dc field was then applied and the sample was slowly warmed above , after which it was re-cooled in the same field, giving the field-cooled (FC) curve. In small dc fields the value of the ZFC susceptibility corresponds to 100% shielding of the field (when demagnetization corrections are made), and the transition is sharp. As the fields are increased, the transition becomes broader and shifts to lower temperatures. The FC susceptibility shows that the Meissner-Ochsenfeld effect (the reversible expulsion of flux as the sample is field-cooled and warmed through ) for fields greater than a few Oe is negligible. However for very small fields, the effect becomes more important, reaching about 30% expulsion in a field of 0.01 0e.
We compare this last result to UCoGe along the easy axis in Fig. 2(b). There are important differences. First, the internal fields that are present in UCoGe, of the order 50-100 G, are much greater than , and as a result UCoGe is always in the mixed state, and never achieves 100% shielding. In addition, to measure the Meissner-Ochsenfeld effect in UCoGe means taking into account hysteresis and a coercive field such that the applied field has no meaning while the sample is multi-domain Paulsen et al. (2012). Nevertheless, a typical value of the percent expulsion of the flux from UCoGe compared to its effective shielding would be about 3% expulsion at 50 Oe, which decreases with increasing field. Although small, this is much greater than the Meissner-Ochsenfeld effect observed in UTe2 in the same field range as can be seen in Fig. 2(b). The other remarkable feature observed in Fig. 2(b) is the non-saturating rate of increase of the Meissner effect down to fields as low as 0.01 Oe in UTe2: if any internal field exists due to a weak FM phase inside the superconducting phase, the resulting dipolar field has to be much smaller than 0.01 G, or in other words, the ordered moment should be much smaller than .
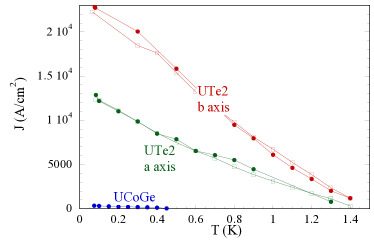
A strong hysteresis and a weak Meissner-Ochsenfeld effect suggests strong flux pinning. To confirm this we measured the ac susceptibility as a function of the ac driving field: An example can be seen in the Supplemental Material Fig. S20 for the axis. When flux begins to enter the sample, and of the ac susceptibility will deviate from their 100% shielding values. The deviations are linear in the applied driving field and the slopes are proportional to for , and for , where is the current density in the critical state model, and is the sample width, where we approximate the sample shapes as slabsGömöry (1997). The resulting for UTe2 is plotted in Fig. 3, along with for UCoGe measured along the axis. Clearly flux pinning is far greater in UTe2.
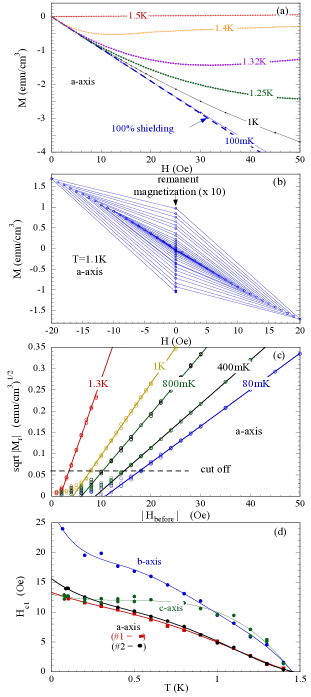
The initial magnetization vs taken at various constant temperatures is shown in Fig. 4(a). For each curve, the sample was first ZFC. The blue dashed line is a linear fit to the 100 mK data over a field range 0 - 10 Oe The slope of this fit (when corrected for demagnetization effects) corresponds to a susceptibility of ( in SI units) or 100% shielding of the magnetic field. For a given temperature, as the field is increased, the curves deviate from this slope, and this is an indication that flux is entering the sample because has been exceeded. As can be seen in Fig. 4(a), due to the strong pinning, flux enters the sample almost asymptotically and makes the determination of difficult. In addition, because the samples used in this study are not perfect ellipsoids, the field enters the samples sooner around the edges due to demagnetization effects, further obscuring the real .
A better way to determine is to measure the remanent magnetization as shown in Fig. 4(b) and 4(c) and discussed in detail in the the Supplemental Material. Figure 4(b) is an example of a series of minor hysteresis loops at 1.1 K for sample 1 where the magnitude of the field was systematically increased in small steps, and then returned to zero to measure the point where flux begins to enter the sample. While the cycles are reversible. However, when is exceeded, flux begins to enter the sample and the magnetization deviates from the shielding. When the field is then returned to zero, half the flux remains trapped in the sample, and a remanent moment appears. According to the Bean critical state model , i.e. the last field value before the field was reduced to zero and the remanence was measured Bean (1964). In order to estimate , we modify the critical state model following Naito et al. (1990) by assuming two regimes: when , and when , .
In Fig. 4(c) we plot an example of the remanent magnetizations for sample 1 as vs . The solid lines are linear fits to the high field data above the cut-off line, thus omitting the low field values where we expect rounding to occur. The intercept gives .
In Fig. 4(d) along the axis is plotted versus temperature for sample 1, and for sample 2 for the , and axes, where has been corrected for demagnetization effects: Both samples have a platelet shape, with the field applied parallel to the platelet, except for the axis measurements which was performed perpendicular to the surface. We estimate the value of at to be 14 Oe along the and axis, and 24 Oe along the axis.
We have also studied along the axis using bulk ac susceptibility as shown in Fig. S21 of the Supplemental Material and we found T along the axis, in good agreement with published resistivity measurements Ran et al. (2019a); Aoki et al. (2019b).
However, a comparison of and data reveals a major inconsistency. Indeed, close to in the Ginzburg-Landau (GL) regime, the anisotropy of should be opposite to that of as , where is the (isotropic) thermodynamic critical field and the anisotropic GL parameter. Hence, neglecting the anisotropy of due to the logarithm, with , one expects . In contrast, Fig. 4(c) shows that the relative anisotropies anticipated from are wrong in all directions. Quantitatively, this is a major effect, as the measured anisotropy between and is a factor 3, whereas the anisotropy between and is between 3 and 5, depending on the measurements notably for (see, e.g., Ref. Aoki et al., 2019b). Knebel et al. (2019); Ran et al. (2019b)
Such a large discrepancy calls for an explanation. Measurement errors of for might come from stronger pinning in this direction. The critical current has been found indeed twice as large for , see Fig. 3(b), but it is very unlikely that it could explain a factor of 10 error between the two directions. The sample geometries are also similar in both cases, excluding an explanation through a bad estimation of the demagnetisation corrections.
So the next step is to question the estimate of from the relations with the GL parameter: for single band -wave superconductors, these relations hold even in very anisotropic cases (see e.g. Morosan et al. (2007)). However UTe2 is most likely -wave, multigap (like most other heavy-fermion superconductors) and topological Jiao et al. (2020). The last feature, implying the existence of low energy surface states might influence pinning, but if it has any influence on the determination of , it should also be reflected in the critical current measurements. More interestingly, the multigap character (or the nodal gap structure Kogan et al. (2019) for one-dimensional (1D) irreducible representations) has been shown, theoretically (e.g., Ref. Kogan, 2002) and experimentally (e.g., Ref. Fletcher et al., 2005) to induce strong deviations of the anisotropy of the critical fields from the estimations through the GL parameter: But this holds at low temperature, not close to .
Last, several works have reported double transitions in their UTe2 crystals at zero pressure Thomas et al. (2020); Hayes et al. (2020). Note however that and measurements are only sensitive to the upper transition, until both transition eventually cross under field, which does not happen below 8 T according to Ref. Hayes et al. (2020). Hence, whatever the origin of this double transition (intrinsic or due to inhomogeneities), it cannot help to understand the reported anomalous relative anisotropies of and .
A possible explanation for the puzzling anisotropy of , which cannot be completely ruled out, is a low-field change of slope of . This is suggested for example by specific heat measurements Kittaka et al. (2020), which find a weak anisotropy between and axis due to a strong curvature of along (hence a much larger slope at low fields), but still a smaller slope along the axis. This may partially help to reduce the discrepancy between and anisotropies of and , but is still not enough to explain the result, requiring .
A key to understanding this anomalous anisotropy might be to take into account that the pairing mechanism in UTe2 can be tuned by a magnetic field Ran et al. (2019a); Knebel et al. (2019), a mechanism inducing a change of slopes of Nakamura et al. (2017); Wu et al. (2017), which is not taken into account by GL. A field-dependent pairing induces a field dependence of the “bare” critical temperature that is independent of the mixed state formation, as well as of the Fermi velocities ()Wu et al. (2017). Hence, with field-dependent pairing, both critical fields are functions of field (through and ) and temperature and it is easy to show that the measured slope at is: . Here, is the “usual” slope defined for field-independent pairing, for which GL relations should hold. This relation between the measured and shows that, because is three to four orders of magnitudes smaller than , corrections due to should be negligible on , which should reflect the true bare anisotropies. A T/K for and T/K for , (assuming for ) could reconcile the lower and upper critical field measurements (see Supplemental Material for more details sup ).
To summarize, the surprising contradiction between lower and upper critical field anisotropies can be understood as a manifestation of the strong field dependence of the pairing strength in UTe2, which is strongly suppressed along the easy axis and boosted along the hard axis. Moreover, this is an indication that pairing is suppressed by field along the easy axis in this system, an effect comparable to, although weaker than in UCoGe Nakamura et al. (2017); Wu et al. (2017), which can be seen as additional support for ferromagnetic fluctuations mediated pairing.
Moreover, from our very low-field measurements of the Meissner state, we can put an upper limit to any FM ordered moment above 100 mK of in UTe2. Restricted Meissner-Ochsenfeld expulsion is coherent with the observed strong pinning. A possible link between the present strong pinning and singular topological properties of the superconducting phase deserve to be clarified.
Acknowledgements.
We thank K. Behnia and T. Klein for fruitful discussions. We acknowledge the financial support of the Cross-Disciplinary Program on Instrumentation and Detection of CEA, the French Alternative Energies and Atomic Energy Commission, and KAKENHI (JP15H05882, JP15H05884, JP15K21732, JP16H04006, JP15H05745, JP19H00646).References
- Fay and Appel (1980) D. Fay and J. Appel, Phys. Rev. B 22, 3173 (1980).
- Saxena et al. (2000) S. S. Saxena, P. Agarwal, K. Ahilan, F. M. Grosche, R. K. W. Haselwimmer, M. J. Steiner, E. Pugh, I. R. Walker, S. R. Julian, P. Monthoux, G. G. Lonzarich, A. Huxley, I. Sheikin, D. Braithwaite, and J. Flouquet, Nature 406, 587 (2000).
- Aoki et al. (2019a) D. Aoki, K. Ishida, and J. Flouquet, J. Phys. Soc. Jpn. 88, 022001 (2019a), https://doi.org/10.7566/JPSJ.88.022001 .
- Aoki et al. (2001) D. Aoki, A. D. Huxley, E. Ressouche, D. Braithwaite, J. Flouquet, J. Brison, E. Lhotel, and C. Paulsen, Nature 413, 613 (2001).
- Huy et al. (2007) N. T. Huy, A. Gasparini, D. E. de Nijs, Y. Huang, J. C. P. Klaasse, T. Gortenmulder, A. de Visser, A. Hamann, T. Görlach, and H. v. Löhneysen, Phys. Rev. Lett. 99, 067006 (2007).
- Bastien et al. (2016) G. Bastien, D. Braithwaite, D. Aoki, G. Knebel, and J. Flouquet, Phys. Rev. B 94, 125110 (2016).
- Lévy et al. (2005) F. Lévy, I. Sheikin, B. Grenier, and A. D. Huxley, Science 309, 1343 (2005).
- Aoki et al. (2009) D. Aoki, T. D. Matsuda, V. Taufour, E. Hassinger, G. Knebel, and J. Flouquet, J. Phys. Soc. Jpn. 78, 113709 (2009), http://dx.doi.org/10.1143/JPSJ.78.113709 .
- Ran et al. (2019a) S. Ran, C. Eckberg, Q.-P. Ding, Y. Furukawa, T. Metz, S. R. Saha, I.-L. Liu, M. Zic, H. Kim, J. Paglione, and N. P. Butch, Science 365, 684 (2019a).
- Aoki et al. (2019b) D. Aoki, A. Nakamura, F. Honda, D. Li, Y. Homma, Y. Shimizu, Y. J. Sato, G. Knebel, J.-P. Brison, A. Pourret, D. Braithwaite, G. Lapertot, Q. Niu, M. Vališka, H. Harima, and J. Flouquet, J. Phys. Soc. Jpn. 88, 043702 (2019b), https://doi.org/10.7566/JPSJ.88.043702 .
- Ikeda et al. (2006) S. Ikeda, H. Sakai, D. Aoki, Y. Homma, E. Yamamoto, A. Nakamura, Y. Shiokawa, Y. Haga, and Y. Ōnuki, J. Phys. Soc. Jpn. 75, 116 (2006), https://doi.org/10.1143/JPSJS.75S.116 .
- Tokunaga et al. (2019) Y. Tokunaga, H. Sakai, S. Kambe, T. Hattori, N. Higa, G. Nakamine, S. Kitagawa, K. Ishida, A. Nakamura, Y. Shimizu, Y. Homma, D. Li, F. Honda, and D. Aoki, J. Phys. Soc. Jpn. 88, 073701 (2019), https://doi.org/10.7566/JPSJ.88.073701 .
- Miyake et al. (2019) A. Miyake, Y. Shimizu, Y. J. Sato, D. Li, A. Nakamura, Y. Homma, F. Honda, J. Flouquet, M. Tokunaga, and D. Aoki, J. Phys. Soc. Jpn. 88, 063706 (2019), https://doi.org/10.7566/JPSJ.88.063706 .
- Knafo et al. (2019) W. Knafo, M. Vališka, D. Braithwaite, G. Lapertot, G. Knebel, A. Pourret, J.-P. Brison, J. Flouquet, and D. Aoki, J. Phys. Soc. Jpn. 88, 063705 (2019), https://doi.org/10.7566/JPSJ.88.063705 .
- Knebel et al. (2019) G. Knebel, W. Knafo, A. Pourret, Q. Niu, M. Vališka, D. Braithwaite, G. Lapertot, M. Nardone, A. Zitouni, S. Mishra, I. Sheikin, G. Seyfarth, J.-P. Brison, D. Aoki, and J. Flouquet, J. Phys. Soc. Jpn. 88, 063707 (2019), https://doi.org/10.7566/JPSJ.88.063707 .
- Ran et al. (2019b) S. Ran, I.-L. Liu, Y. S. Eo, D. J. Campbell, P. M. Neves, W. T. Fuhrman, S. R. Saha, C. Eckberg, H. Kim, D. Graf, F. Balakirev, J. Singleton, J. Paglione, and N. P. Butch, Nat. Phys. 15, 1250 (2019b).
- Hardy et al. (2011) F. Hardy, D. Aoki, C. Meingast, P. Schweiss, P. Burger, H. V. Löhneysen, and J. Flouquet, Phys. Rev. B 83, 3 (2011), arXiv:1012.5097 .
- Nakamura et al. (2017) S. Nakamura, T. Sakakibara, Y. Shimizu, S. Kittaka, Y. Kono, Y. Haga, J. c. v. Pospíšil, and E. Yamamoto, Phys. Rev. B 96, 094411 (2017).
- Wu et al. (2017) B. Wu, G. Bastien, M. Taupin, C. Paulsen, L. Howald, D. Aoki, and J.-P. Brison, Nat. Commun. 8, 14480 (2017).
- Paulsen et al. (2012) C. Paulsen, D. J. Hykel, K. Hasselbach, and D. Aoki, Phys. Rev. Lett. 109, 237001 (2012).
- (21) In the Supplemental Material we (1) report details on the single crystal growth, (2 )indicate the determination of the thermodynamic critical field, (3) show additional hysteresis very close to , (4) show different methods to determine the lower critical field , and discuss the anisotropy of . The Supplemental Material includes additional Refs. Aoki et al. (2011); Deguchi et al. (2010); Imajo et al. (2019); Knebel et al. (2020).
- Sundar et al. (2019) S. Sundar, S. Gheidi, K. Akintola, A. M. Côté, S. R. Dunsiger, S. Ran, N. P. Butch, S. R. Saha, J. Paglione, and J. E. Sonier, Physical Review B 100, 140502 (2019), arXiv:1905.06901 .
- Gömöry (1997) F. Gömöry, Superconductor Science and Technology 10, 523 (1997).
- Bean (1964) C. P. Bean, Rev. Mod. Phys. 36, 31 (1964).
- Naito et al. (1990) M. Naito, A. Matsuda, K. Kitazawa, S. Kambe, I. Tanaka, and H. Kojima, Phys. Rev. B 41, 4823 (1990).
- Morosan et al. (2007) E. Morosan, L. Li, N. P. Ong, and R. J. Cava, Phys. Rev. B 75, 104505 (2007).
- Jiao et al. (2020) L. Jiao, S. Howard, S. Ran, Z. Wang, J. O. Rodriguez, M. Sigrist, Z. Wang, N. P. Butch, and V. Madhavan, Nature 579, 523 (2020).
- Kogan et al. (2019) V. G. Kogan, R. Prozorov, and A. E. Koshelev, Phys. Rev. B 100, 014518 (2019).
- Kogan (2002) V. G. Kogan, Phys. Rev. B 66, 020509 (2002).
- Fletcher et al. (2005) J. D. Fletcher, A. Carrington, O. J. Taylor, S. M. Kazakov, and J. Karpinski, Phys. Rev. Lett. 95, 097005 (2005).
- Thomas et al. (2020) S. M. Thomas, F. B. Santos, M. H. Christensen, T. Asaba, F. Ronning, J. D. Thompson, E. D. Bauer, R. M. Fernandes, G. Fabbris, and P. F. S. Rosa, Science Advances 6 (2020), 10.1126/sciadv.abc8709.
- Hayes et al. (2020) I. M. Hayes, D. S. Wei, T. Metz, J. Zhang, Y. S. Eo, S. Ran, S. R. Saha, J. Collini, N. P. Butch, D. F. Agterberg, A. Kapitulnik, and J. Paglione, “Weyl superconductivity in ute2,” (2020), arXiv:2002.02539 [cond-mat.str-el] .
- Kittaka et al. (2020) S. Kittaka, Y. Shimizu, T. Sakakibara, A. Nakamura, D. Li, Y. Homma, F. Honda, D. Aoki, and K. Machida, Phys. Rev. Research 2, 032014 (2020).
- Aoki et al. (2011) D. Aoki, T. D. Matsuda, F. Hardy, C. Meingast, V. Taufour, E. Hassinger, I. Sheikin, C. Paulsen, G. Knebel, H. Kotegawa, and J. Flouquet, J. Phys. Soc. Jpn. 80, SA008 (2011), arXiv:1012.1987 .
- Deguchi et al. (2010) K. Deguchi, E. Osaki, S. Ban, N. Tamura, Y. Simura, T. Sakakibara, I. Satoh, and N. K. Sato, J. Phys. Soc. Jpn. 79, 083708 (2010), arXiv:1007.1344 .
- Imajo et al. (2019) S. Imajo, Y. Kohama, A. Miyake, C. Dong, M. Tokunaga, J. Flouquet, K. Kindo, and D. Aoki, J. Phys. Soc. Jpn. 88, 083705 (2019), 1907.03033 .
- Knebel et al. (2020) G. Knebel, M. Kimata, M. Vališka, F. Honda, D. Li, D. Braithwaite, G. Lapertot, W. Knafo, A. Pourret, Y. J. Sato, Y. Shimizu, T. Kihara, J.-p. Brison, J. Flouquet, and D. Aoki, J. Phys. Soc. Jpn. 89, 053707 (2020), arXiv:2003.08728 .