Exploring the differences of integrated and spatially resolved analysis using integral field unit data: The case of Abell 14
Abstract
We present a new approach to study planetary nebulae using integral field spectroscopy. VLT@VIMOS datacube of the planetary nebula Abell 14 is analysed in three different ways by extracting: (i) the integrated spectrum, (ii) 1-dimensional simulated long slit spectra for different position angles and (iii) spaxel-by-spaxel spectra. These data are used to built emission-line diagnostic diagrams and explore the ionization structure and excitation mechanisms combining data from 1- and 3- dimensional photoionization models. The integrated and 1D simulated spectra are suitable for developing diagnostic diagrams, while the spaxel spectra can lead to misinterpretation of the observations. We find that the emission-line ratios of Abell 14 are consistent with UV photo-ionized emission; however, there are some pieces of evidence of an additional thermal mechanism. The chemical abundances confirm its previous classification as a Type I planetary nebula, without spatial variation. We find, though, variation in the ionization correction factors (ICFs) as a function of the slit position angle. The star at the geometric centre of Abell 14 has an A5 spectral type with an effective temperature of = 7909135 K and surface gravity log() = 1.40.1 cm s-2. Hence, this star cannot be responsible for the ionization state of the nebula. Gaia parallaxes of this star yield distances between 3.6 and 4.5 kpc in good agreement with the distance derived from a 3-dimensional photoionization modelling of Abell 14, indicating the presence of a binary system at the centre of the planetary nebula.
keywords:
techniques: imaging spectroscopy; techniques: spectroscopic; (stars:) binaries: general ISM: abundances(ISM:) planetary nebulae: individual: Abell 141 Introduction
Integral field spectroscopy (IFS) provides unique information of extended sources. The disadvantages of the first-generation integral field units (IFUs) such as the small field of view and low spectral resolution have been overcome by the new generations of instruments developed over the past few yr either in the optical regime (e.g. MUSE, MEGARA, WiFeS, and SITELLE)111Multi Unit Spectroscopic Explorer ((MUSE; Bacon et al., 2010), Multi-Espectrógrafo en GTC de Alta Resolución para Astronomía (MEGARA;, Gil de Paz et al., 2016), Wide-Field Spectrograph (WiFeS; Dopita et al., 2007), Spectro-Imageur à Trasformée de Fourier pour l’Étude en Long et en Large desraies d’Émission (SITELLE; Grandmont et al., 2012) or in the infrared regime (e.g. SIFONI, NIFS, and FRIDA)222Spectrograph for INtegral Field Observations in the Near Infrared (SINFONI; Eisenhauer et al., 2003; Bonnet et al., 2004), Near-Infrared Integral Field Spectrometer (NIFS; McGregor et al., 2003), inFRared Imager and Dissector for the Adaptive optics system of the Gran Telescopio Canarias (FRIDA; Cuevas et al., 2008).. All these IFUs have been widely used to study galaxies and emission-line objects such as H ii regions and planetary nebulae (PNe). The Calar Alto Legacy Integral Field Area Survey (CALIFA; Sánchez et al., 2012) corroborates the power of IFS in the study of extended galaxies.
IFU data have made possible the development of more sophisticated emission-line diagnostic diagrams (DDs) and the investigations of the mechanisms responsible for the spectral emission-lines in both spatial directions. Different regions across galaxies have been found to display different emission-line ratios (e.g. LINERs-like, Seyfert-like, star formation-like) and occupy distinct regimes on the Baldwin, Phillips & Terlevich (BPT, Baldwin et al., 1981) DDs (e.g. Singh et al., 2013; Ho et al., 2014; Belfiore et al., 2016). The same methodology has also been applied to H ii regions (Sánchez, 2013). However, only a few PNe had been observed and studied with IFS, the majority of them during the last 5-6 yr (e.g. Tsamis et al., 2008; Danehkar et al., 2013; Monteiro et al., 2013; Danehkar et al., 2014; Ali et al., 2015, 2016; Danehkar, 2015; Danehkar & Parker, 2015; Basurah et al., 2016; Danehkar et al., 2016; Walsh et al., 2016; Ali & Dopita, 2017; Dopita et al., 2017, 2018; Walsh et al., 2018; Ali & Dopita, 2019) and imaging fourier transform spectroscopy (Lagrois et al., 2015).
In contrast to IFS, the position of the slit(s) in long-slit spectroscopy is usually selected based on the morphology of the nebula and/or on the position of distinct features, such as low-ionization structures (LISs: knots, jets, and filaments; e.g., Balick et al., 1993, 1994; Akras & Gonçalves, 2016; Derlopa et al., 2019) or bipolar outflows (e.g. Guerrero et al., 2013; Akras et al., 2015; Ramos-Larios et al., 2018).
In this work, we present the first VLT@VIMOS (VIsible Multi-Object Spectrograph) IFU data of Abell 14, an intriguing nebula for which strong [O i] 6300 (Henry et al., 2010) and [N i] 5200 (Bohigas, 2003) emission-lines have been reported. The detection of only one of these lines is confirmed in each study above. Such discrepancy may be related to the slit position in each observation. Based on 3D photoionization modelling, Akras et al. (2016) argued for an additional thermal mechanism, probably shock interactions, to explain the observed intensities of these two emission-lines. All these make Abell 14 an ideal object to be studied through IFS and explore the distribution of emission-lines in two spatial dimensions as well as its BTP DDs in a spatially resolved manner.
The paper is organized as follows. The VLT observations and data reduction are presented in Section 2. In Section 3, we describe the different approaches used in this work to analyse the VIMOS datacubes: integrated spectrum, simulated 1D long-slit spectroscopy and spaxel-by-spaxel analysis. In Section 4, we present a number of emission-line DDs generated using the fluxes obtained from the three aforementioned methods, as well as emission-line fluxes from a grid of cloudy (Ferland et al., 2017) models obtained from the Mexican Million Models data base (3MdB; Morisset et al., 2015). In this section, we also discuss how chemical abundances and ICFs vary as function of the slit position. The optical spectrum of the central star of Abell 14 is also presented and we discuss the possibility of being a binary system. We summarize our conclusions in Section 5.
2 Observations and data reduction
| Name | Date | Grism | Exp. time | RA. | Dec. |
|---|---|---|---|---|---|
| (s) | (J2000.0) | (J2000.0) | |||
| HRblue | 28/01/2017 | HR blue | 2x1000 | 06:11:08.7 | 11:46:34.2 |
| HRorange | 21/02/2017 | HR orange | 2x1000 | 06:11:08.7 | 11:46:34.2 |
| Sky HRblue | 28/01/2017 | HR blue | 1x300 | 06:11:05.7 | 11:46:20.1 |
| Sky HRorange | 21/02/2017 | HR orange | 1x300 | 06:11:05.7 | 11:46:20.1 |
| LTT 3864† | 28/01/2017 | HR blue | 1x128 | 10 32 13.6 | 10 32 13.6 |
| CD -32 9927† | 21/02/2017 | HR orange | 1x29 | 14 11 46.3 | -33 03 14.3 |
† Sky calibrations sources.
Abell 14 was observed at the VLT of ESO (UT3 Melipa) using the IFU mode of the VIMOS instrument (Le Fèvre et al., 2003). The data were obtained on 2017 January 28 and February 21 [ID: 098.D-0436(A); PI: S. Akras] in service mode.
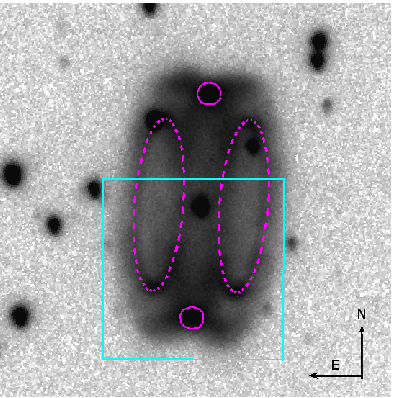
The high resolution blue grism (HRblue) with a dispersion of 0.571 Å pixel-1 and a spectral resolution of 1440 was used to cover the spectral range from 3700 to 5220 Å. The orange grism (HRorange) and the blocking filter GG435 with dispersion of 0.6 Å pixel-1 were used to cover the spectral range from 5250 to 7400 Å. The field of view of 27 27 arcsec with a spatial resolution of 0.67 arcsec pixel-1 and 40 40 fibres (i.e. spaxels), available for these two high resolution grisms, was selected. Such a configuration was chosen to allow the observation of the entire Abell 14 (41 23 arcsec; Akras et al., 2016) with two pointings (north and south).
Because of the presence of two field stars at the northern part of the nebula (see Figure 1), the priority was given to the southern part, which is free from field stars. Due to bad weather conditions, only the southern part of Abell 14 was eventually observed. Abell 14 is a highly symmetrical and homogeneous nebula with negligible flux variations, as it can be seen in Figure 1 (see also Akras et al., 2016). This symmetry assures that our results and conclusions obtained for the southern half of the nebula can also be applied to the other half. The ring-like structures in the eastern and western directions of the nebula as well as the bright-spots in the equatorial regions (along the north-south direction) can easily be seen in the [N ii] 6583 line image.
To increase the signal-to-noise (S/N) ratio of emission-lines, two exposures of 1000 s per grism were obtained as well as one additional exposure of 300 s in an area close to Abell 14 in order to subtract the background skylines from the emission-line images. The seeing during the observations was varying between 0.7 and 1.3 arcsec. For the flux calibration of the data, two standard stars were observed, one for each grism. In Table 1, we present the observing log.
The reduction of the data was carried out with the VIMOS pipelines available in the instrument website333http://www.eso.org/sci/facilities/paranal/instruments and our own code to reconstruct the final datacubes and extract the emission-lines maps.
3 Methodology
Originally, BPT diagnostic diagrams were first constructed using long-slit spectroscopic data (Baldwin et al., 1981). It is thus coherent to explore whether emission-line ratios derived from a spaxel-by-spaxel analysis of IFU datacubes can be used to study resolved PNe and trace their excitation mechanisms through the BPT diagrams.
Three approaches were followed for the analysis of Abell 14: (1) integrated spectrum, (2) spaxel-by-spaxel (emission-line maps), and (3) 1D simulated long-slit spectra in distinct position angles (PAs) relative to the position of the central star.
The line fluxes in each spaxel (integrated spectrum or 1D simulated long-slit spectra) are corrected for interstellar extinction using the extinction coefficient c(H ) derived from the Balmer H /H line ratio (equation 1), from the same spaxel (the observed southern part of the nebula or the simulated slits) considering for all the cases the interstellar extinction law by Fitzpatrick (1999) and Rv=3.1. The formulae used are:
| (1) |
| (2) |
where is the flux of the line in the spaxel , is the extinction coefficient in the spaxel , and is the extinction law. The H /H ratio is not used to estimate the extinction coefficient due to the very low S/N of H .
The integrated emission-line fluxes from the observed portion of Abell 14 are derived by summing up all the spaxels and discarding those with (i) stellar emission, (ii) low signal-to-noise fluxes, and (iii) F(H )F(H )*2.85 (after reddening correction), which implies unrealistic (negative) values for the extinction coefficient c(H ). The 1D long-slit spectra were extracted simulating slits of 2 arcsec widths in different PAs relative to the central star’s position from -90 to 90∘. The final flux was calculated by summing up the spaxels’ fluxes.
All the nebular emission-lines measured from the integrated spectrum and the 1D simulated long-slit spectra are listed in Table 2. The observed line fluxes from the long-slit spectra of Bohigas (2003) and Henry et al. (2010) are also presented for direct comparison with the new data.
3.1 0D approach: Integrated spectrum
For the integrated spectrum, we simulated a slit of width and length such that the whole observed nebula was fitted in this slit. The extinction coefficient c(H ) and emission-line ratios were calculated several times by rotating the line maps from 0 to 360∘ in steps of 2∘. This exercise was performed to ensure that the rotation of line maps or of the simulated slit does not affect the resultant line fluxes. We find a c(H ) equal to 0.46 with a standard deviation (SD) of 0.003. The very low SD confirms the negligible effect of rotation. Integrated emission-lines are also described by very low SDs. The line fluxes of the integrated spectrum (PA=0∘) are presented in the fourth column of Table 2.
Due to the versatility of IFU data, the datacube was also used as input to the alfa444Automated Line Fitting Algorithm alfa identifies and fits the lines in a spectrum with a Gaussian profile (Wesson, 2016). All line intensities obtained from this procedure can be seen in the third column of Table 2.. The c(H ) value is estimated to be 0.690.05. This value is higher than the one derived from the line maps because alfa does not apply any criteria to the emission-line in each spaxel.
The extinction coefficient of Abell 14 is evidently lower than the previous long-slit studies (0.98, Bohigas 2003; 0.88, Henry et al. 2010). This implies a difference in the H and/or H fluxes. Nevertheless, a reasonable agreement between our H flux from the simulated slit at PA=0∘ and that from Bohigas (2003) is found (see Table 2).
Our integrated line intensities agree better with the results obtained from Bohigas (2003) than those from Henry et al. (2010). Even the [N i] 5200 line is consistent with Bohiga’s results. On the other hand, the [O i] 6300 line, which is detected by Henry but not in Bohigas’s data, is marginally detected in our IFU data with half of the intensity measured by Henry et al. (2010) and very low S/N ratio. The [O i] 6300 line map shows no clear morphological structure which can be indicative of poor sky subtraction.
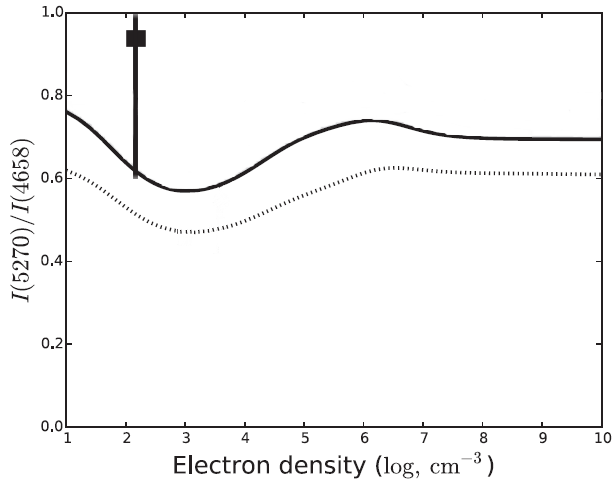
Besides the detection of the common nebular emission-lines, two [Fe iii] lines centred at 4658 Å and 5270 Å are also detected very close to the noise level with values of 13.5 and 12.9 relative to H =100, respectively. The [Fe iii] 5270/4658 line ratio can be used as a density-indicator (see Laha et al., 2017). Its value is calculated (0.950.33) and it is consistent with the electronic density of 100-200 cm-3 derived from the [S ii] diagnostic lines (Bohigas, 2003; Henry et al., 2010; Akras et al., 2016) for an electronic temperature of 10000 K (Figure 2). Both the lines have been detected in several PNe, for instance Mz 3, NGC 2392, NGC 6543, and NGC 7027, with X-ray emission also detected (Perinotto et al., 1999; Zhang & Liu, 2002; Zhang et al., 2012).
Due to the very low S/N of the [Fe iii] and [O i] lines, this should be considered as a tentative detection and further high S/N observations should be carried out.
| Ion | PA | B03a | H10b | ||||||
|---|---|---|---|---|---|---|---|---|---|
| Ion | Å | alfa | Maps | -90∘ | -80∘ | -20∘ | 0∘ | ||
| [O ii] | 3727.00 | 486 82 | 442 | 366 | 421 | 347 | 604 | - | 326 |
| [Ne iii] | 3868.75 | 95.5 20.2 | 82.4 | 112 | 110 | 74.3 | 58.6 | - | 63.5 |
| H i | 3970.07 | 64.7 19.1 | - | - | - | - | - | - | - |
| H i | 4340.47 | 37.6 5.7 | - | - | - | - | - | 41.0 | 60.7 |
| [Fe iii] | 4658.10 | 13.5 2.0 | - | - | - | - | - | - | - |
| He ii | 4685.68 | 24.0 2.4 | 25.8 | 43.5 | 43.6 | 25.8 | 24.3 | 33.7 | 26.4 |
| H i | 4861.33 | 100 3 | 100 | 100 | 100 | 100 | 100 | 100 | 100 |
| [O iii] | 4958.91 | 103 2 | 94.4 | 146 | 149 | 101 | 88.3 | 98.5 | 157 |
| [O iii] | 5006.84 | 304 3.0 | 281 | 449 | 453 | 310 | 260 | 307 | 475 |
| [N i] | 5200.26 | 24.5 3.0 | 36.6 | 36.5 | 33.7 | 42.8 | 23.5 | 28.8 | - |
| [Fe iii] | 5270.40 | 12.9 4.2 | - | - | - | - | - | - | - |
| [N ii] | 5754.60 | 24.0 2.7 | 26.1 | 21.5 | 20.9 | 18.4 | 22.5 | 29.0 | 40.7 |
| He i | 5875.66 | 17.0 3.3 | 18.6 | 10.7 | 12.3 | 17.7 | 16.9 | 15.6 | 22.4 |
| [O i] | 6300.34 | 14.7 4.1 | - | - | - | - | - | - | 30.5 |
| [N ii] | 6548.10 | 436 16 | 422 | 301 | 316 | 420 | 439 | 479 | 552 |
| H i | 6562.77 | 276 9 | 284 | 282 | 283 | 286 | 285 | 280 | 286 |
| [N ii] | 6583.50 | 1350 50 | 1298 | 956 | 989 | 1308 | 1365 | 1435 | 1650 |
| [S ii] | 6716.44 | 65.4 3.1 | 62.7 | 43.4 | 45.7 | 58.5 | 60.4 | 57.1 | 66.5 |
| [S ii] | 6730.82 | 44.2 3.4 | 44.9 | 33.6 | 31.8 | 44.1 | 42.7 | 42.9 | 48.7 |
| [Ar iii] | 7135.80 | 21.3 2.2 | 19.6 | 21.9 | 19.2 | 19.9 | 18.3 | 19.5 | 10.8 |
| F(H )c | 34.6 | 2.9 | 3.0 | 5.9 | 6.2 | 5.9 | 1.51 | ||
| c(H ) | 0.69 0.05 | 0.51 | 0.54 | 0.56 | 0.43 | 0.46 | 0.98 | 0.88 | |
† Line intensities have been estimated from the whole nebula observed with VIMOS (integrated spectra) using the code alfa
†† Line intensities have been estimated from the whole nebula observed with VIMOS (integrated spectra) using the line maps
3.2 1D approach: Simulated long-slit spectra
For the 1D long-slit approach, we simulated a number of slits with 3 spaxel width (equivalent to 2 arcsec), for different PAs from -90 (eastern) to 90∘ (western) with a step of 2∘. The average value of c(H ) is 0.47 with SD=0.05 and agrees with the value derived from the integrated spectrum, but its higher SD implies some variation with PA.
3.3 2D approach: Spaxel-by-spaxel analysis
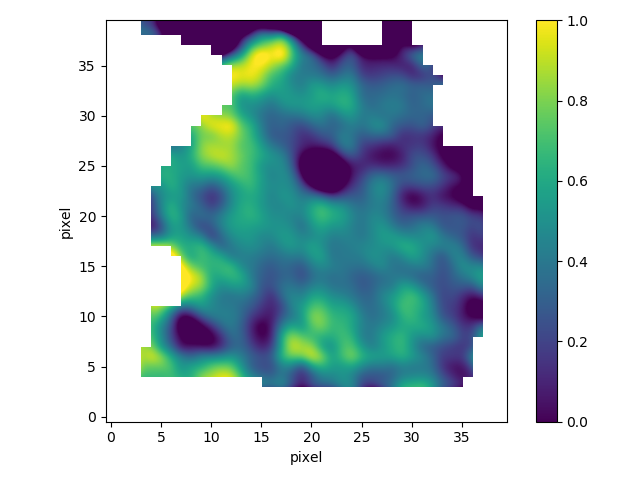
An analysis of the emission-line maps spaxel-by-spaxel was also performed. In this case, we calculated the c(H ) and the emission-line fluxes for each individual spaxel. The average c(H ) of Abell 14 is equal to 0.55 with SD=0.45. This clearly demonstrates a significant variation in the extinction coefficient from one spaxel to another. Figure 3 displays the map of the extinction coefficient showing its spatial variation. Particularly is noticeable the large extinction in the region of the western ring.
Given that VIMOS IFU has 4040 fibres (i.e. spaxels), there are available 1600 spectra. It is, thus, very likely that some of the measurements are problematic, for instance at the border of the CCD with very low SN ratio. Therefore, it is necessary to find (if there are) those problematic values (outliers) and exclude them from the final calculations.
To find the outliers, we first calculated the upper (Q1, 25 percent) and lower (Q3, 75 percent) quartiles. Then, the outliers were found as those data points (spaxels’ measurements) in the emission-line maps with values Q1-1.5*(Q3-Q1) and Q3+1.5*(Q3-Q1) (Upton & Cook, 1997; Kokoska & Zwillinger, 2000). The new value of c(H ), excluding 5 per cent of the total number of spaxels’ measurements, is found to be 0.47 with SD=0.29. This result agrees better with the value derived from the integrated spectrum and it implies that the outliers, mainly from areas with low S/N, affect the resultant average values from spaxels. The same procedure is followed for all the emission-lines.
4 Results
In the following subsections, we present the 2D maps for the most representative emission-lines of Abell 14 together with a morphological analysis. Then, we discuss the excitation mechanisms of Abell 14 through the BPT DDs. These diagrams are constructed combining data from the 1D simulated long-slit VIMOS spectra, the spaxel-by-spaxel spectra, the 1D photoionization models from the Mexican Million Models data base (3MdB, Morisset et al. 2015) and a 3D photoionization model (Akras et al., 2016). We finish with the analysis of the electronic density and temperature as well as the ionic and total chemical abundances of the nebula.
Concerning the 3MdB, it is worth mentioning some information about the grid of photoionization models. This grid of models models was constructed by Morisset et al. (2015) using the code cloudy (Ferland et al., 2017). Various parameters were set as free variables and varied within a specific range of values. These parameters are as follows: the effective temperature () and luminosity (L) of the central star, the hydrogen density, the inner radius of the nebular shell, the metallicity, and the chemical and dust composition.
Yet, not all the models of the grid depict real PNe and a number of criteria were considered in order to get a more representative grid of models (Delgado-Inglada et al., 2014). These criteria are as follows: (a) hydrogen mass1 M, (b) and L consistent with evolutionary models, (c) 10surface brightness10-11 erg s-1 cm-2 arcsec-2, and (d) 21031056. For more details about the grid of PNe models, we refer the interested readers to the paper from Delgado-Inglada et al. (2014). In order to assure that Abell 14 is compared with the equivalent models (e.g. spectral energy distribution, ionization degree), we plot in the BPT diagrams only those models for which the temperature of the central star covers a range of values from 100000 to 200000 K and the nebula is 80% matter bounded.
4.1 Morphological analysis from line maps
Figure 4 illustrates the 2D maps of the brightest emission-lines of Abell 14, i.e., H , [N ii] 6584 Å, [S ii] 6716,6731 Å, He ii 4846 Å, [N i] 5200 Å and [O iii] 5007 Å. The two ring-like structures in the eastern and western parts of the nebula, as well as the bright spot in the southern direction of the equatorial region can barely be seen in the [N ii] and [S ii] lines and almost disappear in the H line. The reason for that is the very low spatial resolution of the VIMOS images compared to the narrow-band images obtained from the Aristarchos telescope (see Figure 1).
The two ring-like structures appear brighter at the southern edge displaying a bright spot. Moreover, the western ring is brighter compared to the eastern one due to the orientation to the nebula. This is consistent with its recent 3D morpho-kinematic model (Akras et al., 2016). The southern bright spot at the equatorial region, which is noticeable in all lines besides [O iii] and He ii may be the result of the projection of a larger fainter hourglass structure or the interaction between two larger but fainter ring-like structures. The angular size of the observed portion of the nebula in the [N ii] and [S ii] lines, measured from the outer edge to the central star, is 20 arcsec in the NS direction and 22 arcsec in the EW direction.
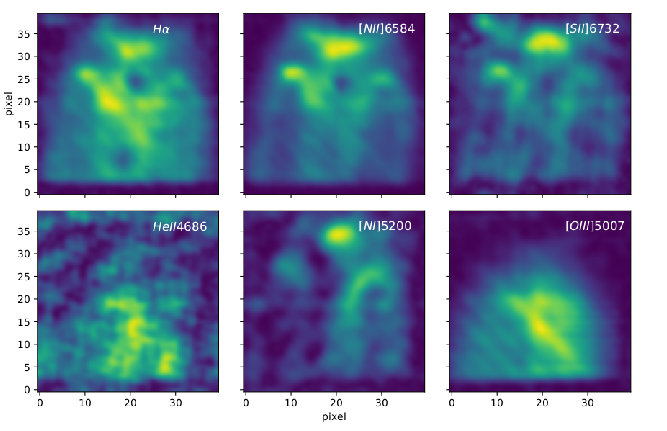

Regarding the high-excitation lines such as the He ii and [O iii] lines, none of the ring-like structures or the southern bright spot are detected. The nebula displays a more ellipsoidal structure concentrated in the centre. The size of the observed part of the nebula in the [O iii] line is 15x20 arcsec. In the [N i] 5200 Å emission-line map, Abell 14 displays a diffuse emission in the eastern ring as well as the southern bright spot. Shock interactions may be responsible for the strong [N i] 5200 Å emission in these particular regions of the nebula.
Hydrodynamic simulations have shown that the interaction of jets or collimated outflows in the polar direction, due to the presence of a binary system, with a dense shell can explain the formation of barrel-like PNe (Akashi et al., 2018). The hydrodynamic simulations R1, R3 and R5 resemble the morphology of Abell 14 (see Figure 10 in Akashi et al., 2018). In particular, the R1 model reproduces the bright spots at each ring-like structure observed in Abell 14. Surprisingly, the viewing angle of the R1 model (20∘) matches with the inclination angle of 22∘4∘ in the east-west direction obtained from its 3D morpho-kinematic model (Akras et al., 2016).


4.2 Emission-line diagnostic diagrams
First Baldwin et al. (1981) and later Veilleux & Osterbrock (1987) proposed a number of DDs for galaxy classification based on the [O iii]/H , [N ii]/H , [S ii]/H , and [O i]/H line ratios, known as BPT or VO diagrams. The physical separation between star-forming, Seyfert and LINER galaxies on the emission-line ratios is attributed to the ionization mechanism. Shock with velocities higher than 100 km s-1 can provide a reasonable explanation for the strong emission of low-ionization lines and the position of LINER on the BPT diagrams (e.g. Ho et al., 2014).
Despite all the effort to distinguish different type of galaxies and explore the ionization structure, only few studies have been done in PNe. The most common and widely known DD is between log(H /[N ii]) and log(H /[S ii]) line ratios proposed by Sabbadin et al. (1977) (SMB). A statistical analysis of this DD has been made by Riesgo & López (2006) providing the 85 percent probability density ellipse. PNe with log(H /[N ii])0 and log(H /[S ii])0.4 (below the region occupied by supernova remnants, hereafter SNRs) may experience some shock activity (e.g. Riesgo & López, 2006; Bohigas, 2008; Akras et al., 2016; Akras & Gonçalves, 2016). BPT diagrams for PNe, SNRs, and H ii regions based on observations are presented by Frew & Parker (2010); Sabin et al. (2013). Very recently, the so-called “2D extended diagnostic diagram ” was used by Barría & Kimeswenger (2018a, b); Barría et al. (2018) to search for shocked regions or identify low-ionization structures in PNe.
4.2.1 Log(H /[S ii]) versus log(H /[N ii])
Figure 5 displays the SMB log(H /[N ii]) versus log(H /[S ii]) DD for Abell 14. The line ratios from each individual spaxel (cyan dots), the 1D simulated long-slit spectra [observed: purple circles and modelled (Akras et al., 2016): red triangles] and the 1D photoionization models from the 3MdB (open black squares, Morisset et al., 2015) are presented. The size of the open black squares corresponds to the logU555The dimensionless parameter U is also known as ionization parameter and it is defined as the ratio of the hydrogen-ionizing photon number to the total-hydrogen density. parameter of each cloudy model (the bigger the symbol the higher the logU parameter). The inner plot illustrates the distribution of the observed and modelled (Akras et al., 2016) simulated long-slit emission-line ratios as a function of the slits’ position angle from -90 to 90∘. The black cross indicates the mean value of the corresponding line ratios obtained from all the 1D simulated long-slit VIMOS spectra.
Abell 14 lies in the left-bottom corner and it is characterized by 0.4log(H /[S ii])0.6. These values barely indicate shocks in Abell 14. It is worth mentioning that the distribution of individual spaxels is quite different compared to the simulated long-slit ratios. Spaxels’ values cover a wider range in log(H /[S ii]) (from 0 to 0.8) and log(H /[N ii]) (from -1.0 to -0.5). This bias to lower ratios from the individual spaxels and higher ratios from the integrated 1D long-slit spectra may lead to the misinterpretation of excitation mechanism: in the first case, towards the existence of shocks and in the second case towards the excitation by the UV stellar radiation field. This delicate point has also been pointed out by Morisset (2018).
The comparison between the line ratios derived from the 1D simulated long-slits of the VIMOS datacube and those from the 3D photoionization model (Akras et al., 2016) developed using the mocassin666MOnte CArlo SimulationS of ionized Nebulae (Ercolano et al., 2003; Ercolano et al., 2005). code reveals a significant difference of the order of 0.3-0.4 dex. Moreover, one can see that photoionization models can reproduce very low line ratios [log(H /[S ii])-0.4 and log(H /[N ii])-1], without considering shocks (Figure 5). The common characteristic of this group of models is the very low logU parameter (-3.4), i.e., very low-excitation nebulae. It is also evident that both line ratios, H /[N ii] and H /[S ii], decrease (i.e. the [N ii] and [S ii] lines become stronger) with the decrease of logU (smaller squares). Therefore, the log(H /[N ii]) versus log(H /[S ii]) DD itself is not enough to distinguish nebular gas excited by shocks or UV stellar radiation. The criterion, log(H /[S ii])0.4, which commonly applied for supernova remnants (e.g. Leonidaki et al., 2013), is not adequate to argue for the presence of shocks in PNe.
4.2.2 Log([S ii]/H ) versus log([O iii]/H )
Figure 6 presents the classical BPT diagram log([S ii]/H ) versus log([O iii]/H ). The majority of the cloudy models with logU-3.4 lie in the regime where PNe are expected (Frew & Parker, 2010; Sabin et al., 2013). All these models have 0.6log([O iii]/H )1.5 and -2.5log([S ii]/H )-0.4. For the very low-excitation models (logU-3.4), log([O iii]/H ) is lower than 0.5, while log([S ii]/H ) varies between -1.5 and 0.5.
Spaxels, on the other hand, cover a wider range of values, -0.5log([O iii]/H )0.70 and -0.75log([S ii]/H )0.1. According to these values, it could be suggested that some regions in Abell 14 are UV excited, while some others are affected by shock interactions [cyan points with log([S ii]/H )>-0.4 occupy the same area with young and evolved SNRs (Frew & Parker, 2010; Sabin et al., 2013)]. However, all these models lie within the PNe limits (brown lines). Photoionization cloudy models with logU-3.4 can successfully produce low log([O iii]/H ) and high log([S ii]/H ) line ratios. The line ratios obtained from the 1D simulated long-slit spectra indicate that Abell 14 lies in a transition region between PNe and SNRs with no extreme values like those obtained from individual spaxels.
4.2.3 Log([N ii]/H ) versus log([O iii]/H )
The log([N ii]/H ) versus log([O iii]/H ) DD of Abell 14 is illustrated in Fig. 7. Similarly to the previous diagram, log([N ii]/H ) also increases as logU decreases, and its maximum value is close to 0.8. Abell 14 lies at the outskirts of the grid of cloudy models consistent with very low-ionization models (logU-3.4). It is evident that Abell 14 is not characterized by line ratios typical to PNe.
4.2.4 Log([N i]/H ) versus log([O iii]/H )
Although strong [N i] and [O i] lines are usually attributed to shock activity (e.g. Phillips & Guzman, 1998), there is no proper DD of these lines for PNe. These lines are not always detected in PNe (or they are very weak), and this makes very difficult to construct a trustworthy DD from observations. A grid of photoionization models, as the Mexican Million Models, may be of great help in such an analysis.
Figure 8 displays the log([N i]/H ) versus log([O iii]/H ) DD. Both the individual spaxels and the 1D simulated long-slit spectra show an overlap with cloudy models only for logU between -4.4 and -3.4, and [N i]/H between -0.75 and -0.25. Note that there are spaxels with [N i]/H 1, which could be easily interpreted as shock collisions, even if they can be reproduced by photoionization models with very low logU.
The observed and modelled line ratios display a difference in log([N i]/H ) of almost 1.5 dex (see the inner plot in Figure 8). Recall that the mocassin model of Abell 14 does not reproduce the intensity of [N i] 5200. It can also be observed that the eastern part (PA0, blue points) has systematically higher log([N i]/H ) compared to the western part (PA0, red points) of 0.3 dex. This may be associated with the orientation of the nebula, resulting in a fainter [N i] 5200 line in the western part (see Fig. 4).
4.3 The 3MdB grid
In order to verify if there is any additional thermal mechanism as suggested by Akras et al. (2016), we searched the 3MdB for the cloudy model(s) that reproduces simultaneously the log([O iii]/H ), log([S ii]/H ), and log([N ii]/H ) line ratios, considering a variance equal to the errors of their observed values (see section 4.5). Two models, a radiation bounded and an 80% matter-bounded model, with negligible differences in line ratios and stellar parameters, are found. For our analysis below, we use the 80% matter-bounded model.
For this best model, we get =150 000 K, log(L/L⊙)=3.0, and logU=-3.8, i.e., a hot and faint evolved white dwarf. The size of the nebula (rout) is 1017 cm with a low electron density (100 cm3). All these parameters are consistent with the results from our previous study of Abell 14 (Akras et al., 2016). A very good agreement is also found for the remaining emission-line ratios: log([O iii]/H ) (modelled=0.46; observed=0.42), log([S ii]/H ) (-0.43; -0.40), log([N ii]/H ) (0.82; 0.79), log([N ii] 5755/H ) (-0.62; -0.62), log(He ii/H ) (-0.61; -0.58), and log(He i/H ) (-0.77; -0.72). Therefore, most of the emission-line ratios of Abell 14 can be reproduced from the UV stellar radiation field.
However, a notable difference is found in the log([N i]/H ) (-1.10; -0.39) and log([O ii]/H ) (0.25; 0.60) line ratios. The deviation of these two lines from the pure photoionization models cannot be explained without considering an additional thermal mechanism. Log([O i]/H ) ratio is also found to be inconsistent with the 3MdB models (0.04; -1.27777The [O i] 6300 line is very weak and no line map is constructed. This value has been taken from the integrated spectrum after using the VIMOS datacube as direct input to the alfa code.). Such a bright [O i] 6300 line should have easily been observed. On the contrary, our VIMOS data indicate a much weaker emission.
Two possible solutions were explored to explain the high [N i]/H , [O ii]/H , and [O i]/H line ratios: i) the effect of the stopping criteria on the emission-line ratios in the cloudy simulations (see Bohigas, 2008), but it does not explain the observed discrepancy, and ii) the high O abundance of the 3MdB cloudy models, 1 dex more abundant than the observations indicate. Such difference in O abundance, the most important coolant element, will significantly alter the ionization structure of the model and the rest of the emission-lines ratios.
| Ion | PA | B03a | H10b | |||||
| neat | Maps | -90∘ | -80∘ | -20∘ | 0∘ | |||
| He+/H | 1.3 0.3(-1) | 1.4(-1) | 0.8(-1) | 0.9(-1) | 1.3(-1) | 1.3(-1) | 1.19(-1) | 1.72(-1) |
| He2+/H | 2.0 0.2(-2) | 2.1(-2) | 3.7(-2) | 3.6(-2) | 2.1(-2) | 2.0(-2) | 3.70(-2) | 2.40(-2) |
| He/H | 1.5 0.3(-1) | 1.6(-1) | 1.2(-1) | 1.3(-1) | 1.5(-1) | 1.5(-1) | 1.56(-1) | 1.96(-1) |
| N+/H | 1.83 0.25(-4) | 1.55(-4) | 1.01(-4) | 1.11(-4) | 2.25(-4) | 1.99(-4) | 1.80(-4) | 2.16(-4) |
| ICF(N) | 1.77 0.13 | 1.80 | 2.66 | 2.46 | 1.96 | 1.55 | - | 4.84 |
| N/H | 3.26 0.48(-4) | 2.79(-4) | 2.66(-4) | 2.71(-4) | 4.41(-4) | 3.08(-4) | 3.90(-4) | 1.050(-3) |
| O+/H | 11.9 3.4(-5) | 8.9(-5) | 6.1(-5) | 7.6(-5) | 1.3(-4) | 1.7(-4) | - | 5.35(-5) |
| O2+/H | 7.94 1.31(-5) | 6.19(-5) | 8.28(-5) | 9.13(-5) | 11.10(-5) | 7.56(-5) | 4.8(-5) | 16.90(-5) |
| ICF(O) | 1.09 0.02 | 1.08 | 1.26 | 1.22 | 1.09 | 1.09 | - | 1.14 |
| O/H | 2.17 0.48(-4) | 1.64(-4) | 1.81(-4) | 2.04(-4) | 2.64(-4) | 2.68(-4) | 1.30(-4) | 2.54(-4) |
| S+/H | 2.18 0.30(-6) | 1.91(-6) | 1.23(-6) | 1.23(-6) | 2.64(-6) | 2.22(-6) | 1.33(-6) | 1.77(-6) |
| ICF(S) | 3.14 0.25 | 3.21 | 4.19 | 3.95 | 3.49 | 2.73 | - | 1.19 |
| S/H | 6.9 1.1(6) | 6.1(-6) | 5.2(-6) | 5.0(-6) | 9.2(-6) | 6.1(-6) | 9.3(-6) | 3.15(-6) |
| Ar2+/H | 1.58 0.25(-6) | 1.29(-6) | 1.30(-6) | 1.20(-6) | 1.85(-6) | 1.46(-6) | 1.14(-6) | 1.02(-6) |
| ICF(Ar) | 1.19 0.04 | 1.18 | 1.34 | 1.28 | 1.16 | 1.27 | - | 1.44 |
| Ar/H | 1.88 0.31(-6) | 1.53(-6) | 1.73(-6) | 1.53(-6) | 2.14(-6) | 1.85(-6) | 2.10(-6) | 1.46(-6) |
| Ne2+/H | 7.28 2.15(-5) | 5.18(-5) | 5.80(-5) | 6.24(-5) | 8.43(-5) | 5.09(-5) | 6.55(-5) | |
| ICF(Ne) | 1.09 0.02 | 1.09 | 1.26 | 1.22 | 1.09 | 1.09 | 1.49 | |
| Ne/H | 7.96 2.35(-5) | 5.63(-5) | 7.31(-5) | 7.63(-5) | 9.20(-5) | 5.55(-5) | 9.79(-5) | |
| (K) | 11000 500 | 11532 | 12194 | 11863 | 9912 | 10589 | 12000 | 13270 |
| (cm3) | 10 40 | 32 | 118 | 10 | 82 | 21 | 85 | 55 |
† Nebular parameters calculated from the observed portion of Abell 14 observed using the code neat (integrated spectra).
†† Nebular parameters calculated from the observed portion of Abell 14 observed using the line maps (integrated spectra).
4.4 Nebular electron density and temperature
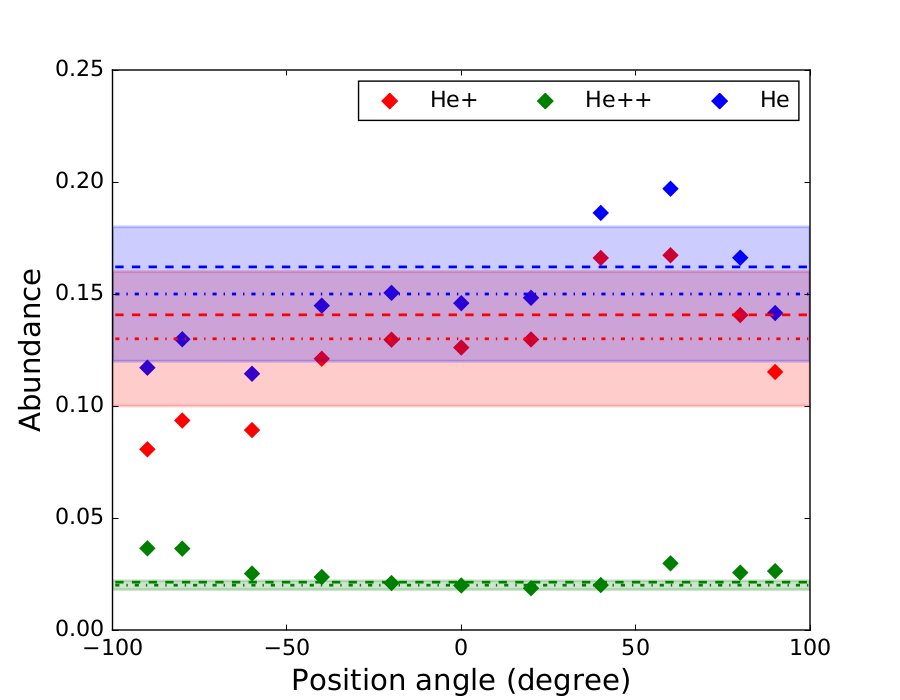
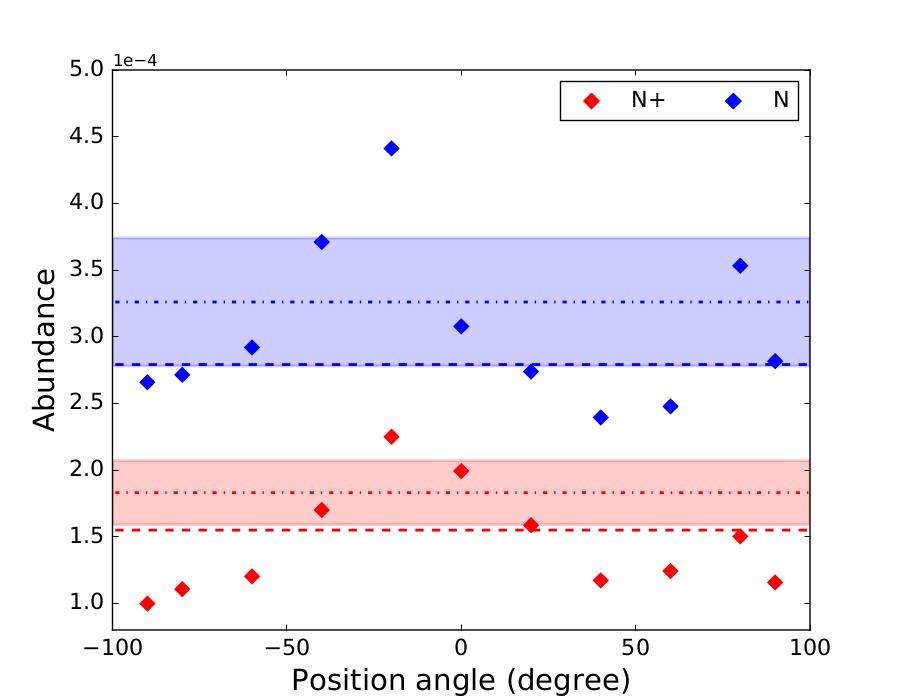


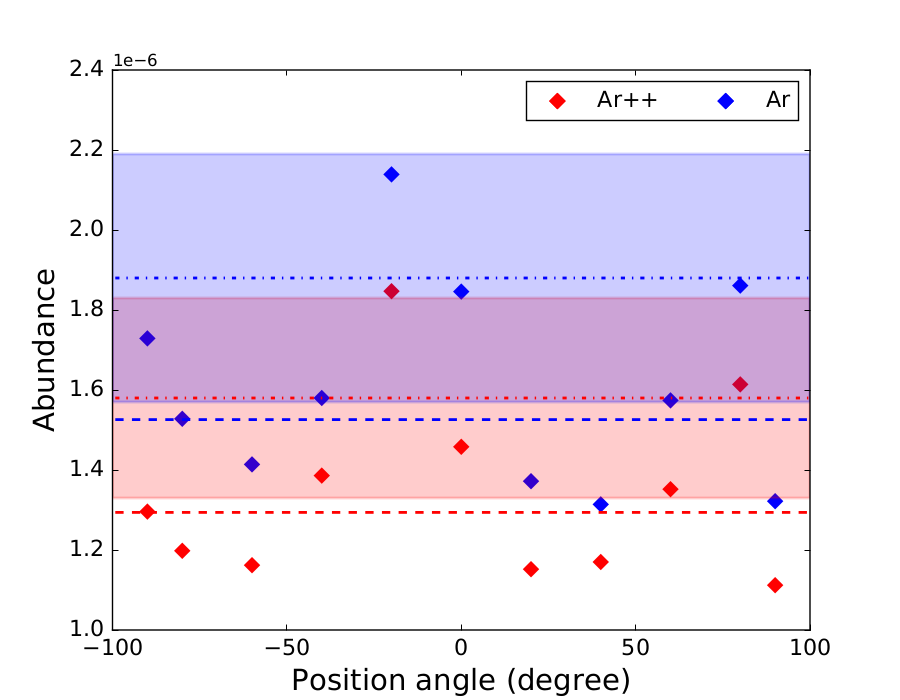
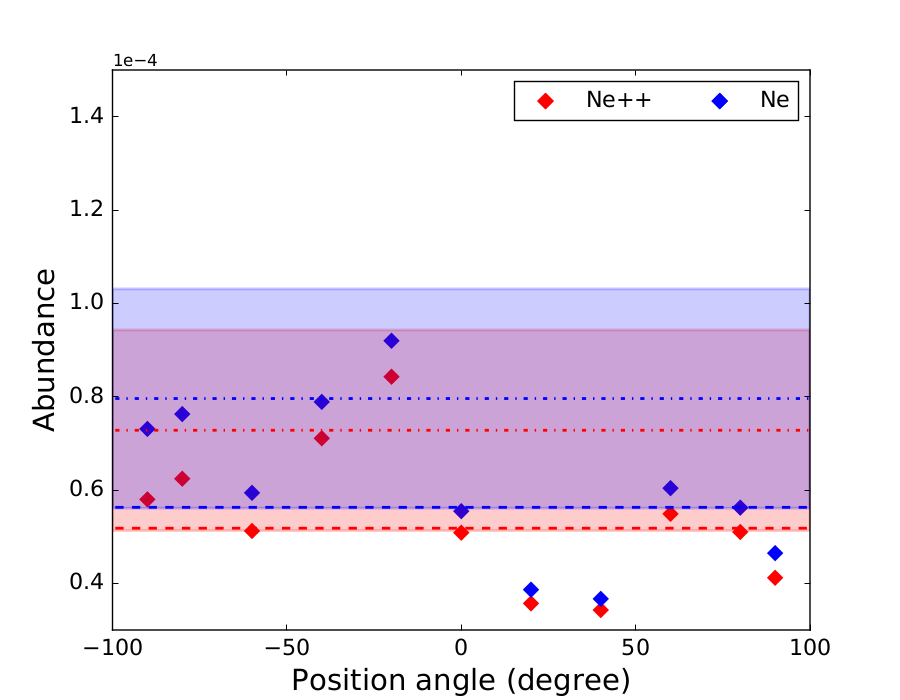
The electron density and temperature of the nebular gas are also derived using the classical indicators (e.g. : [S ii] 6716/6731, : [N ii] 6548+6584/5755) available for Abell 14. Both the parameters are derived using the integrated spectrum and the 1D simulated long-slit spectra. The latter allow us to explore for possible variations within the nebula based on the PA of each slit. Table 3 lists the resulting values of these two parameters.
Abell 14 does not show any significant variation in the electron density or temperature as a function of the PA of slit. Electron temperature varies from 10000 to 12500 K, which is common in PNe, as the recent spatially resolved analysis of NGC 7009 (Walsh et al., 2016), NGC 40 (Leal-Ferreira et al., 2011) and NGC 2438 (Öttl et al., 2014) has also shown. The error of the electron temperature derived from the simulated slits is of the order of 2000 K. The integrated spectra obtained from the alfa code and the line maps give very similar values of 11000 and 11500 K, respectively. Electron density, on the other hand, is found to be systematically lower than 200 cm-3, consistent with the previous studies.
4.5 Ionic and total abundances
With the and of the nebular gas calculated, the ionic and total chemical abundances of Abell 14 can also be derived. Given that only a limited number of ions of a given species are detected in the optical wavelengths, the ionization correction factors (ICFs) from Delgado-Inglada et al. (2014) are used to calculate the total abundances. ICFs are used in order to take into account the contribution of the unobserved ions in the total chemical abundances. The ionic and total abundances of He, N, O, S, Ne and Ar, as well as their corresponding ICFs are given in Table 3 for the integrated spectra and 1D four simulated long-slit spectra with the same orientation as the observed spectra in Bohigas (2003) and Henry et al. (2010).
Figure 9 displays the ionic and total abundances as a function of the PA of the simulated slits. All chemical abundances, from the integrated neat spectrum (dot-dashed lines), the line maps (dashed lines), and the 1D simulated long-slit spectra (coloured diamonds), were calculated using the code neat888Nebular Empirical Analysis Tool (neat; Wesson et al., 2012). The coloured areas indicate the abundance errors for the integrated neat spectrum. No errors are given for the abundances derived from the line maps or 1D simulated long-slit spectra but they are always larger than those derived from the integrated neat spectrum. Both ionic and total abundances show some variation within the nebula but it is smaller compared to their uncertainties. Moreover, some differences in the chemical abundances derived from the integrated neat spectrum and the line maps have been found, which we attributed to the criteria used to determine the line fluxes from the line maps (see Sect. 3).
Variations in the chemical composition of PNe have been reported for a few PNe but their large errors have prevented their confirmation (Leal-Ferreira et al., 2011; Monteiro et al., 2013). The MUSE data of NGC 7009 have also shown spatial variations in the ionic abundances of various elements from 0.5 up to even 2 dex (see Walsh et al., 2018).
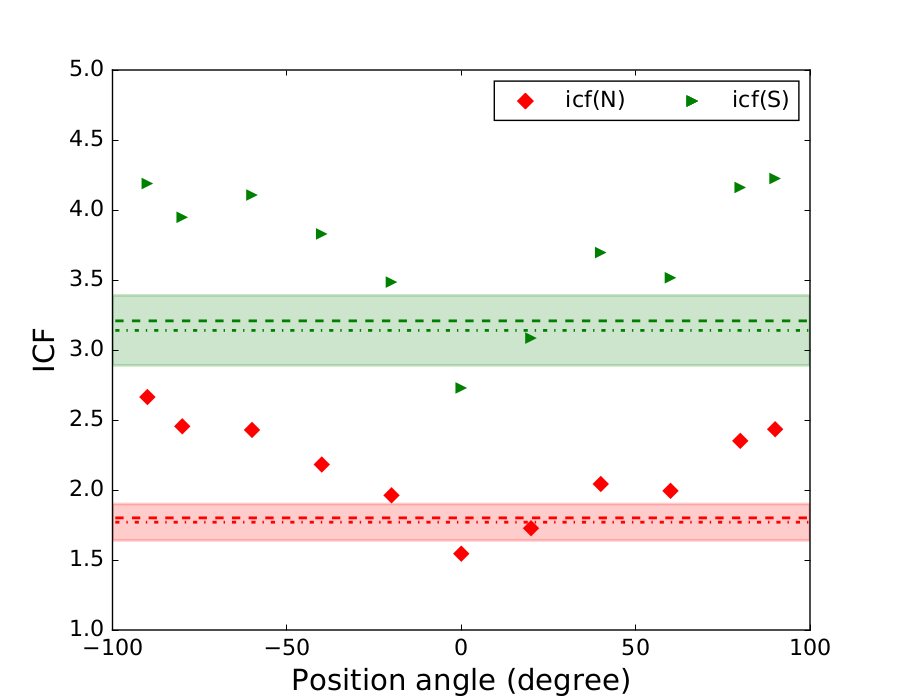
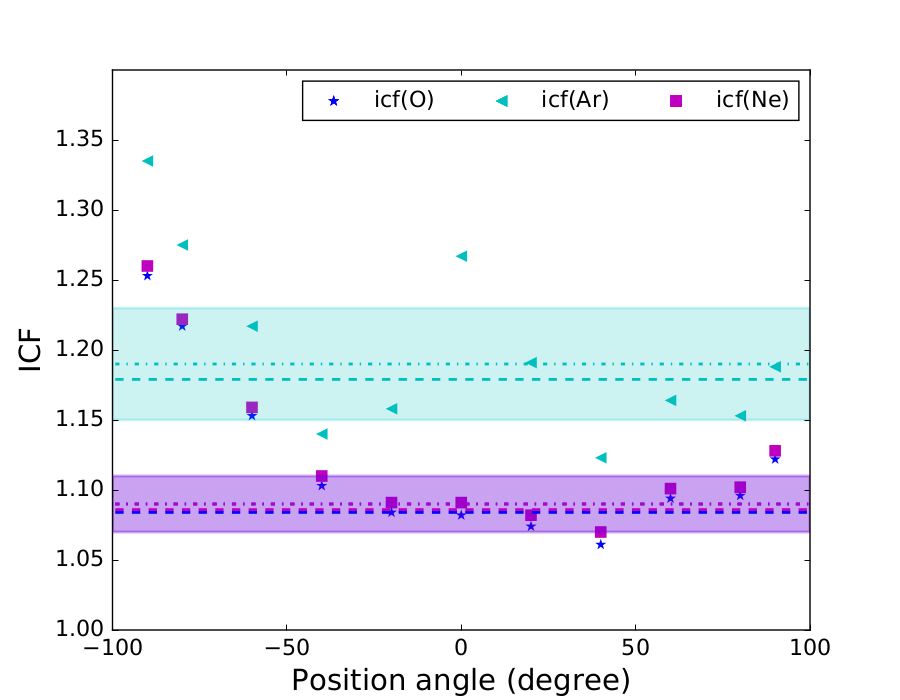
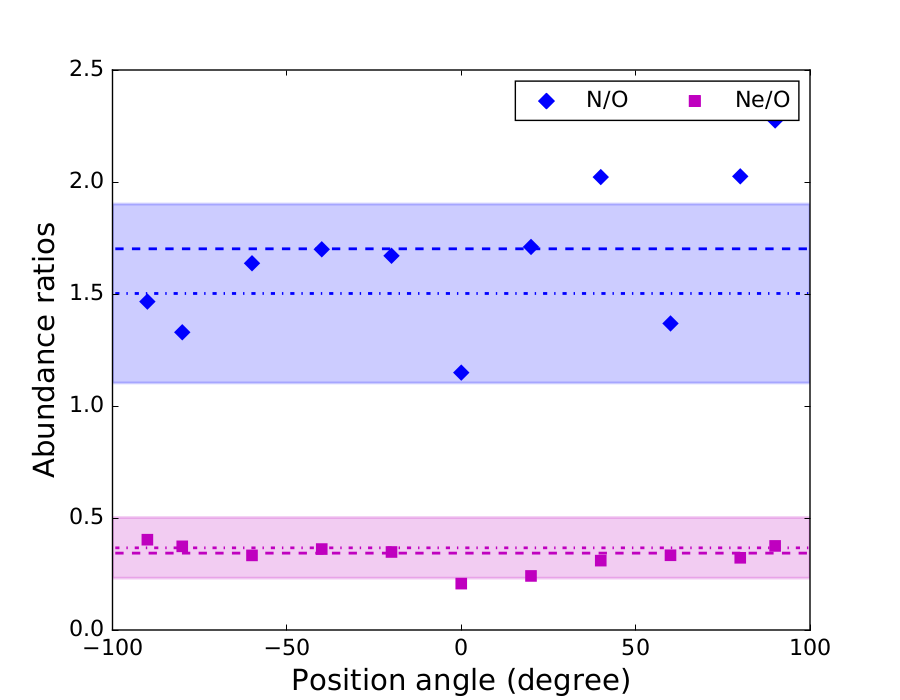
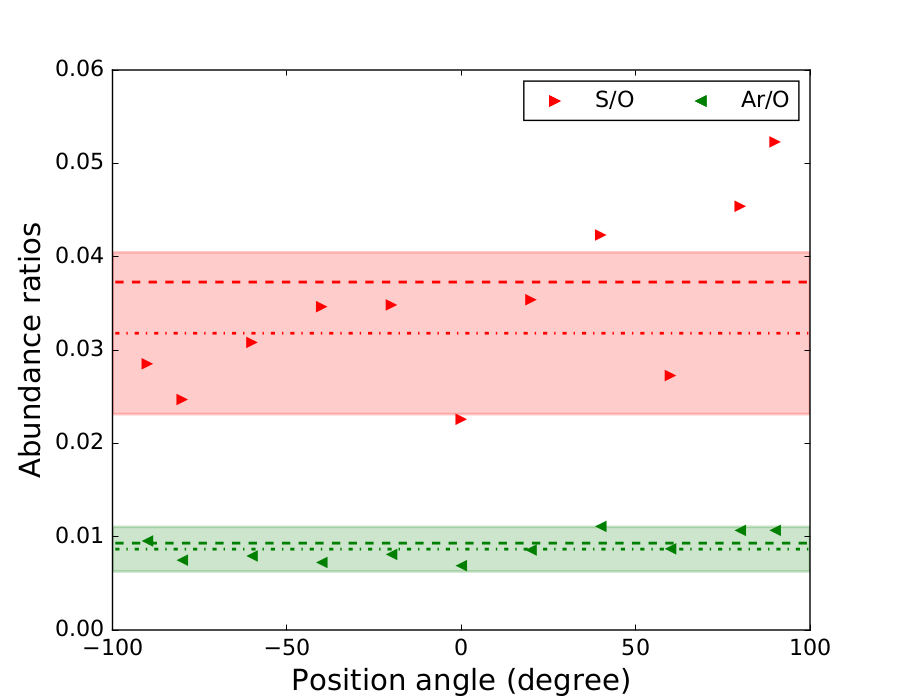
In Figure 10, we present the ICFs and abundances ratios as a function of the PA for the 1D simulated long-slits VIMOS spectra (coloured diamonds), the integrated neat spectrum (dot-dashed) and the line maps (dashed lines). For the ICFs, we get a significant variability within the nebula. All the elements except for Ar have higher ICFs in the polar direction and lower in the equatorial region (Figure 10). 3D photoionization models have demonstrated that the ICFs vary within the nebula (Morisset, 2017). Moreover, it has also been suggested that a correction on the ICFs may be needed when we deal with non-spherical nebulae (Gonçalves et al., 2012) and Abell 14 is one of these cases.
Regarding the N/O, S/O, Ar/O and Ne/O abundance ratios, we find a reasonable agreement between the integrated spectra and the 1D simulated long-sit spectra (Figure 10). These results denote that the variation found in ICFs is likely real and responsible for the homogeneous abundance ratios. Deep, high quality IFU data from more PNe are needed in order to verify the variation of ICFs and homogeneity in the abundance ratios.
Based on the chemical abundances, Abell 14 is classified as a Type I PN (Peimbert, 1978). The high log(N/O) ratio (alfa, 0.18; maps, 0.23) and He abundance (0.15 and 0.16) are comparable with those found in bipolar PNe (Pottasch & Bernard-Salas, 2010) and they are consistent with the prediction of high metallicity evolutionary models of massive PN progenitors (Karakas, 2010).
4.6 Comparison with previous long-slit spectra
Our methodology allows us to directly compare our results with those obtained from previous long-slit spectroscopy. The 1D simulated long-slit spectrum at PA=0∘ can be directly compared with the observed spectrum from Bohigas (2003). A good agreement is found for the H flux, as well as for the total abundances of He, N, and Ar, except O and S. Our O abundance is almost twice Bohigas’s value, while S is almost 35 percent less abundant. Bohigas (2003) does not provide the abundance for the singly ionized O, because [O ii] 3727 is not detected in his spectrum. Our O+ abundance is almost two times larger than O++ (Table 3), and it can explain the discrepancy in the O total abundance.
The observed spectrum from Henry et al. (2010) can be compared with the simulated slit at PA=-80∘. The two spectra are found to be very different. First of all, the H flux reported by Henry et al. (2010) does not agree with the fluxes of any of our simulated spectra. A significant difference is also observed between the fluxes of the doublet lines [N ii] and [S ii], which are 30-50 percent weaker in our data. He is also found 33 percent less abundance compared to the previous studies.
The very high N abundance reported by Henry et al. (2010) is not supported by our VIMOS data. The different formulae of ICFs used in this work as well as the different oxygen ionic abundances may be responsible for this discrepancy in N abundances. For instance, Henry et al. (2010) estimated ICF(N)=4.8 using the expressions of Kingsburgh & Barlow (1994) while our estimations using the formula of Delgado-Inglada et al. (2014) are between 1.5 and 2.5. The high ratio of O/O+=5.1 (Henry et al., 2010) results in the high ICF(N).
The total O and S abundances are also found to be significantly different. Our O abundance is 20 percent lower than the value derived by Henry et al. (2010), while S is 40 percent more abundant. This discrepancy in the abundance of S is also attributed to the different O ionic abundances. The high O2+/O+ (3.2) and low O+/O (0.2) ratios reported by Henry et al. (2010) yield a low ICF(S), and consequently a low total abundance for S. Our O2+/O+ and O+/O ratios derived from the PA=-80∘ simulated long-slit spectrum are determined 1.20 and 0.37, respectively. Even if the ICFs from Kingsburgh & Barlow (1994) were used, a higher ICF(S) and total S abundance should be obtained considering our ionic abundances.
4.7 The apparent central star
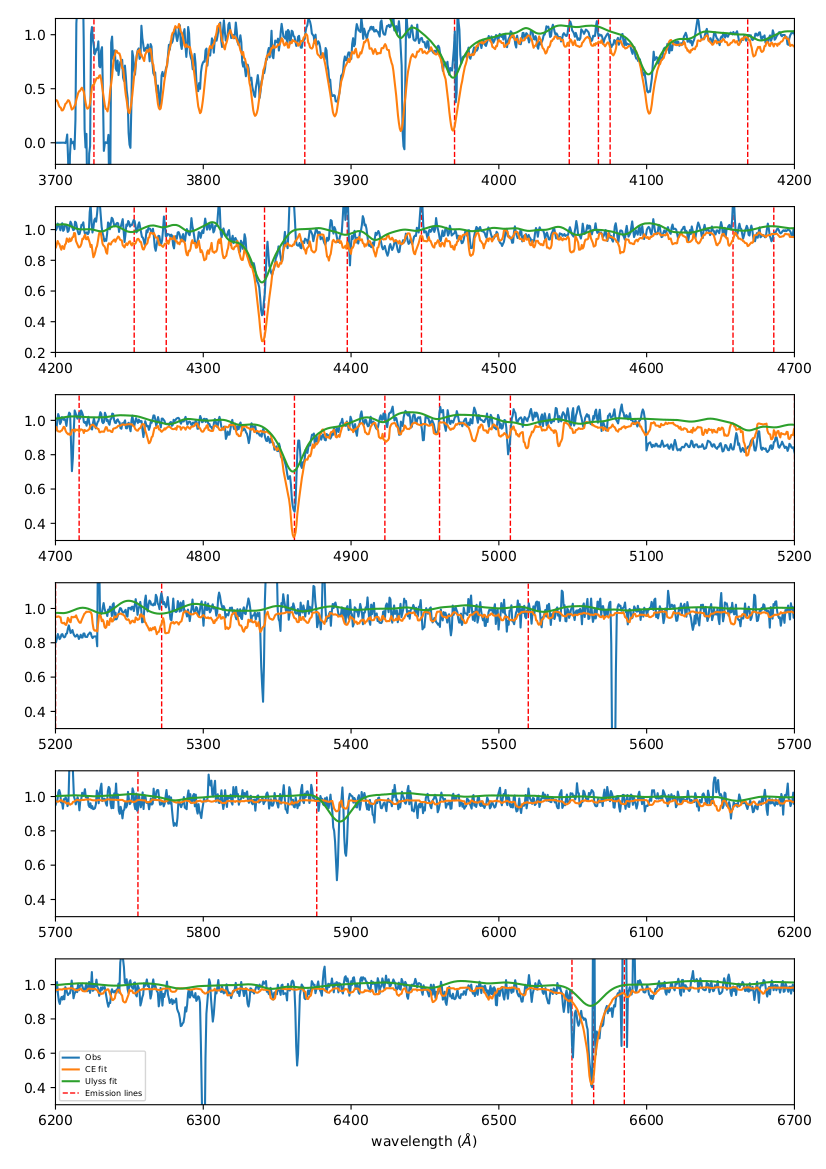
One of the advantages of observing PNe with IFS is that besides the nebula, the central star(s) (if detected) can also be studied. In the case of Abell 14, we studied its apparent central star, i.e., the star at the geometrical centre of the nebula. From our datacube, we extracted its spectrum using a 2D Gaussian model fitted along the dispersion axis. The stellar integrated spectrum is presented in Figure 11. Our results indicate that this star cannot be the ionizing star of Abell 14, as we will discuss in the following.
Two different methods were used to obtain the spectral classification of the central star. In the first, we compared the spectrum of the star with the grid of theoretical spectra from Coelho (2014). This theoretical library consists of 3727 spectra with effective temperature ranging from 3000 to 25000 K, log(g) from -0.5 to 5.5 and metallicity Fe/H from -1.3 to +0.2. We wrote an IDL code to obtain an interpolated spectrum from the grid and fit it to the observed VIMOS data using the global optimization method called Cross Entropy ((CE); further details of the method can be found in Monteiro et al., 2010). With this method, we estimated values for the stellar atmospheric parameters obtaining 76852937 K, log(g) = 1.71.0 and log(Fe/H) = 0.30.3.
We validated the results using a second well-established procedure. We used the code ulyss (Université de Lyon Spectroscopic analysis Software) developed by Koleva et al. (2009). The code obtains the atmospheric parameters by fitting the observed spectrum with an interpolated spectrum of the empirical library ELODIE (Prugniel & Soubiran, 2001; Prugniel et al., 2007). The fitting procedure uses minimization.
The fits obtained with ulyss resulted in the atmospheric parameters 7909135 K, log(g) = 1.40.1 and log(Fe/H) = -1.70.1. While the effective temperature and surface gravity are in good agreement with the value we obtained with the first method, the metallicity is significantly different.
In Figure 11, we show the observed spectrum and both fitted spectra discussed above. The ulyss fit does not reproduce the major absorption lines as well as our code. Our code also manages to fit further to the blue. The star has been previously classified by Weidmann & Gamen (2011) as a B8-9 type due to the presence of Balmer and He absorption lines. Our analysis indicates an A5 type star. In any case, such a star is not able to ionise a nebula as Abell 14. We note also that the stellar absorption lines are aligned with the nebula emission-lines (i.e., both show the similar radial velocities), as shown in Fig. 11.
The probability that the central star of Abell 14 is aligned with a field star at such small distance is extremely low. If this alignment is true, we must agree with Henry Boffin that “Nature likes to play tricks with us! ”(Boffin et al., 2018).
The star has also been observed by the Gaia satellite. Its parallax is provided in the second data release (=0.19480.036, Gaia Collaboration et al. 2018). The low fractional error of the parallax measure (/ = 0.18) allows us to get the distance from the inverse of parallax, D = 1/ = 5.10.9 kpc. For comparison, the distance of this star has also been derived using a robust probabilistic approach Bailer-Jones et al. (2018) and it is found to be 4.34 kpc with 1 minimum and maximum values of 3.74 and 5.15 kpc, respectively. Note that Akras et al. (2016) also got a distance of 4 kpc from their best-fitting 3D model.
It is worth mentioning here that a systematic offset in the Gaia DR2 parallaxes has been reported by several authors. This offset is likely between 10 and 100 mas, strongly depending on the magnitudes and colours of the sources as well as their position on the sky (Lindegren et al., 2018). More specifically, the offset has been estimated 0.029 mas from a sample of quasars (Lindegren et al., 2018), 0.046 and 0.048 mas from a sample of Cepheids (Riess et al., 2018; Groenewegen, 2018), 0.057 mas from a sample of RR-Lyrae stars (Muraveva et al., 2018), 0.082 mas from eclipsing binaries. A year later, more studied concluded to a non-negligible parallax offset in the Gaia DR2 [0.031 mas, Graczyk et al. (2019); 0.054 mas, Schönrich et al. (2019); 0.0523 mas, Leung & Bovy (2019); 0.0517 mas, Khan et al. (2019); 0.0528 mas, Zinn et al. (2019); 0.03838 mas, Hall et al. (2019); 0.075 mas, Xu et al. (2019)].
It is not evident which parallax offset is applicable for the central star of Abell 14. Therefore, the lowest (0.029 mas), the highest (0.082 mas) and the weighted average from all the aforementioned parallax offsets (0.051 mas) were considered to correct its parallax and distance (see also Gómez-Gordillo et al., 2020). These offsets yield distances of 4.46, 3.6, and 4.08 kpc, respectively, and they agree with the 4 kpc distance derived from 3D modelling (Akras et al., 2016). We argue that the A-type star at the centre of Abell 14 is likely a companion star in a binary system.
5 Discussion and Conclusions
The ionization structure and chemical composition of Abell 14 were studied using new the VLT@VIMOS IFU data. This new data set allowed us to investigate how emission-line ratios are distributed in two spatial directions following three approaches: (1) the integrated spectrum, (2) spaxel-by-spaxel spectra, and (3) 1D simulated long-slit spectra in various position angles.
The BPT and SMB diagnostic diagrams were constructed using our VIMOS data and photoionization models. A spaxel-by-spaxel analysis of the emission-lines in the BPT diagrams may lead to misinterpretation of the results, since they cover a wider range of values and substantially different from those derived by the 1D simulated long-slit spectra. The common log([S ii]/H )0.4 criterion to trace shock-excited gas is not directly applicable for PNe. The contribution of the UV radiation from the central star and shock interactions cannot be distinguished using only emission-line ratios.
The 3MdB grid of photoionization models was also explored in order to seek for those models that are capable to reproduce high line ratios usually attributed to shock excitation. Despite the photoionization models have a spherically symmetry, we found two models (one radiation bounded and one 80 percent matter bounded), which can reproduce, within the uncertainties, the observed line ratios. These models indicate a very large and evolved nebula, with a low -luminosity central star in agreement the previous studies. However, the log([N i]/H ) and log([O ii]/H ) line ratios derived from the observations and the models were significant different, and an additional thermal mechanism may be responsible for this discrepancy.
The ionic and total chemical abundances obtained from the 1D simulated long-slit spectra indicate some variation with the slit’s position angle. However, the large abundance errors did not allow us to confirm this behaviour for Abell 14. On the other hand, the abundance ratios (N/O, S/O, Ar/O and Ne/O) did not show any variation with the slit’s position angles. That result was attributed to the variability of ICFs, which were found to increase from the equator to the polar direction.
Besides the analysis of the nebular gas in distinct spatial directions, IFS also allowed us to study the spectral properties of the star at the geometric centre of the nebula. The star was classified as an A-type star with = 7909135 K and log() = 1.40.1 cm s-2, and it could not be the ionizing source of the nebula. This star and the nebula were found to located approximately at the same distance of 4 kpc, and we concluded that the central star of Abell 14 is very likely a binary system.
Acknowledgements
The authors would like to thank the anonymous referee for the valuable comments and constructive suggestions. SA acknowledges the financial support from the Brazilian agencies CNPq (grant 454794/2015-0) and CAPES for a fellowship from the National Postdoctoral Program (PNPD). IA acknowledges the support of CAPES, Ministry of Education, Brazil, through a PNPD fellowship. The authors wish to thank the VIMOS support staff at Paranal for taking these service mode observations [program ID: 098.D-0436(A)]. This research was performed using the facilities of the Laboratório de Astrofísica Computacional da Universidade Federal de Itajubá (LAC-UNIFEI). Finally, this publication makes use of many software packages in Python, including: Matplotlib (Hunter, 2007), NumPy (van der Walt et al., 2011), SciPy (Virtanen et al., 2020) and AstroPy Python (Astropy Collaboration et al., 2013; Muna et al., 2016; Astropy Collaboration et al., 2018).
References
- Akashi et al. (2018) Akashi M., Bear E., Soker N., 2018, MNRAS, 475, 4794
- Akras & Gonçalves (2016) Akras S., Gonçalves D. R., 2016, MNRAS, 455, 930
- Akras et al. (2015) Akras S., Boumis P., Meaburn J., Alikakos J., López J. A., Gonçalves D. R., 2015, MNRAS, 452, 2911
- Akras et al. (2016) Akras S., Clyne N., Boumis P., Monteiro H., Gonçalves D. R., Redman M. P., Williams S., 2016, MNRAS, 457, 3409
- Ali & Dopita (2017) Ali A., Dopita M. A., 2017, Publ. Astron. Soc. Australia, 34, e036
- Ali & Dopita (2019) Ali A., Dopita M. A., 2019, MNRAS, 484, 3251
- Ali et al. (2015) Ali A., Amer M. A., Dopita M. A., Vogt F. P. A., Basurah H. M., 2015, A&A, 583, A83
- Ali et al. (2016) Ali A., Dopita M. A., Basurah H. M., Amer M. A., Alsulami R., Alruhaili A., 2016, MNRAS, 462, 1393
- Astropy Collaboration et al. (2013) Astropy Collaboration et al., 2013, A&A, 558, A33
- Astropy Collaboration et al. (2018) Astropy Collaboration et al., 2018, AJ, 156, 123
- Bacon et al. (2010) Bacon R., et al., 2010, in Proc. SPIE. p. 773508, doi:10.1117/12.856027
- Bailer-Jones et al. (2018) Bailer-Jones C. A. L., Rybizki J., Fouesneau M., Mantelet G., Andrae R., 2018, AJ, 156, 58
- Baldwin et al. (1981) Baldwin J. A., Phillips M. M., Terlevich R., 1981, PASP, 93, 5
- Balick et al. (1993) Balick B., Rugers M., Terzian Y., Chengalur J. N., 1993, ApJ, 411, 778
- Balick et al. (1994) Balick B., Perinotto M., Maccioni A., Terzian Y., Hajian A., 1994, ApJ, 424, 800
- Barría & Kimeswenger (2018a) Barría D., Kimeswenger S., 2018a, Galaxies, 6, 84
- Barría & Kimeswenger (2018b) Barría D., Kimeswenger S., 2018b, MNRAS, 480, 1626
- Barría et al. (2018) Barría D., Kimeswenger S., Kausch W., Goldman D. S., 2018, A&A, 620, A84
- Basurah et al. (2016) Basurah H. M., Ali A., Dopita M. A., Alsulami R., Amer M. A., Alruhaili A., 2016, MNRAS, 458, 2694
- Belfiore et al. (2016) Belfiore F., et al., 2016, MNRAS, 461, 3111
- Boffin et al. (2018) Boffin H. M. J., et al., 2018, preprint, (arXiv:1807.11709)
- Bohigas (2003) Bohigas J., 2003, Rev. Mex. Astron. Astrofis., 39, 149
- Bohigas (2008) Bohigas J., 2008, ApJ, 674, 954
- Bonnet et al. (2004) Bonnet H., et al., 2004, The Messenger, 117, 17
- Coelho (2014) Coelho P. R. T., 2014, MNRAS, 440, 1027
- Cuevas et al. (2008) Cuevas S., et al., 2008, in Proc. SPIE. p. 70146D, doi:10.1117/12.788024
- Danehkar (2015) Danehkar A., 2015, ApJ, 815, 35
- Danehkar & Parker (2015) Danehkar A., Parker Q. A., 2015, MNRAS, 449, L56
- Danehkar et al. (2013) Danehkar A., Parker Q. A., Ercolano B., 2013, MNRAS, 434, 1513
- Danehkar et al. (2014) Danehkar A., Todt H., Ercolano B., Kniazev A. Y., 2014, MNRAS, 439, 3605
- Danehkar et al. (2016) Danehkar A., Parker Q. A., Steffen W., 2016, AJ, 151, 38
- Delgado-Inglada et al. (2014) Delgado-Inglada G., Morisset C., Stasińska G., 2014, MNRAS, 440, 536
- Derlopa et al. (2019) Derlopa S., Akras S., Boumis P., Steffen W., 2019, MNRAS, 484, 3746
- Dopita et al. (2007) Dopita M., Hart J., McGregor P., Oates P., Bloxham G., Jones D., 2007, Ap&SS, 310, 255
- Dopita et al. (2017) Dopita M. A., Ali A., Sutherland R. S., Nicholls D. C., Amer M. A., 2017, MNRAS, 470, 839
- Dopita et al. (2018) Dopita M. A., Ali A., Karakas A. I., Goldman D., Amer M. A., Sutherland R. S., 2018, MNRAS, 475, 424
- Eisenhauer et al. (2003) Eisenhauer F., et al., 2003, in Iye M., Moorwood A. F. M., eds, Society of Photo-Optical Instrumentation Engineers (SPIE) Conference Series Vol. 4841, Proc. SPIE. pp 1548–1561 (arXiv:astro-ph/0306191), doi:10.1117/12.459468
- Ercolano et al. (2003) Ercolano B., Barlow M. J., Storey P. J., Liu X. W., 2003, MNRAS, 340, 1136
- Ercolano et al. (2005) Ercolano B., Barlow M. J., Storey P. J., 2005, MNRAS, 362, 1038
- Ferland et al. (2017) Ferland G. J., et al., 2017, Rev. Mex. Astron. Astrofis., 53, 385
- Fitzpatrick (1999) Fitzpatrick E. L., 1999, PASP, 111, 63
- Frew & Parker (2010) Frew D. J., Parker Q. A., 2010, Publ. Astron. Soc. Australia, 27, 129
- Gaia Collaboration et al. (2018) Gaia Collaboration Brown A. G. A., Vallenari A., Prusti T., de Bruijne J. H. J., Babusiaux C., Bailer-Jones C. A. L., 2018, preprint, (arXiv:1804.09365)
- Gil de Paz et al. (2016) Gil de Paz A., et al., 2016, in Proc. SPIE. p. 99081K, doi:10.1117/12.2231988
- Gómez-Gordillo et al. (2020) Gómez-Gordillo S., Akras S., Gonçalves D. R., Steffen W., 2020, MNRAS, 492, 4097
- Gonçalves et al. (2012) Gonçalves D. R., Wesson R., Morisset C., Barlow M., Ercolano B., 2012, in IAU Symposium. pp 144–147 (arXiv:1110.2709), doi:10.1017/S174392131201085X
- Graczyk et al. (2019) Graczyk D., et al., 2019, ApJ, 872, 85
- Grandmont et al. (2012) Grandmont F., Drissen L., Mandar J., Thibault S., Baril M., 2012, in Proc. SPIE. p. 84460U, doi:10.1117/12.926782
- Groenewegen (2018) Groenewegen M. A. T., 2018, A&A, 619, A8
- Guerrero et al. (2013) Guerrero M. A., Miranda L. F., Ramos-Larios G., Vázquez R., 2013, A&A, 551, A53
- Hall et al. (2019) Hall O. J., et al., 2019, MNRAS, 486, 3569
- Henry et al. (2010) Henry R. B. C., Kwitter K. B., Jaskot A. E., Balick B., Morrison M. A., Milingo J. B., 2010, ApJ, 724, 748
- Ho et al. (2014) Ho I.-T., et al., 2014, MNRAS, 444, 3894
- Hunter (2007) Hunter J. D., 2007, Computing In Science & Engineering, 9, 90
- Karakas (2010) Karakas A. I., 2010, MNRAS, 403, 1413
- Khan et al. (2019) Khan S., et al., 2019, A&A, 628, A35
- Kingsburgh & Barlow (1994) Kingsburgh R. L., Barlow M. J., 1994, MNRAS, 271, 257
- Kokoska & Zwillinger (2000) Kokoska S., Zwillinger D., 2000, CRC Standard Probability and Statistics Tables and Formulae, Student Edition, student edn. Boca Raton : CRC Press, https://ebookcentral.proquest.com/lib/qut/detail.action?docID=263071
- Koleva et al. (2009) Koleva M., Prugniel P., Bouchard A., Wu Y., 2009, A&A, 501, 1269
- Lagrois et al. (2015) Lagrois D., Joncas G., Drissen L., Martin T., Rousseau-Nepton L., Alarie A., 2015, MNRAS, 448, 1584
- Laha et al. (2017) Laha S., Tyndall N. B., Keenan F. P., Ballance C. P., Ramsbottom C. A., Ferland G. J., Hibbert A., 2017, ApJ, 841, 3
- Le Fèvre et al. (2003) Le Fèvre O., et al., 2003, in Iye M., Moorwood A. F. M., eds, Proc. SPIEVol. 4841, Instrument Design and Performance for Optical/Infrared Ground-based Telescopes. pp 1670–1681, doi:10.1117/12.460959
- Leal-Ferreira et al. (2011) Leal-Ferreira M. L., Gonçalves D. R., Monteiro H., Richards J. W., 2011, MNRAS, 411, 1395
- Leonidaki et al. (2013) Leonidaki I., Boumis P., Zezas A., 2013, MNRAS, 429, 189
- Leung & Bovy (2019) Leung H. W., Bovy J., 2019, MNRAS, 489, 2079
- Lindegren et al. (2018) Lindegren L., et al., 2018, A&A, 616, A2
- McGregor et al. (2003) McGregor P. J., et al., 2003, in Iye M., Moorwood A. F. M., eds, Society of Photo-Optical Instrumentation Engineers (SPIE) Conference Series Vol. 4841, Proc. SPIE. pp 1581–1591, doi:10.1117/12.459448
- Monteiro et al. (2010) Monteiro H., Dias W. S., Caetano T. C., 2010, A&A, 516, A2
- Monteiro et al. (2013) Monteiro H., Gonçalves D. R., Leal-Ferreira M. L., Corradi R. L. M., 2013, A&A, 560, A102
- Morisset (2017) Morisset C., 2017, in Liu X., Stanghellini L., Karakas A., eds, IAU Symposium Vol. 323, Planetary Nebulae: Multi-Wavelength Probes of Stellar and Galactic Evolution. pp 43–50 (arXiv:1612.04242), doi:10.1017/S1743921317001004
- Morisset (2018) Morisset C., 2018, in Walking the Line 2018. p. 2, doi:10.5281/zenodo.1206115
- Morisset et al. (2015) Morisset C., Delgado-Inglada G., Flores-Fajardo N., 2015, Rev. Mex. Astron. Astrofis., 51, 103
- Muna et al. (2016) Muna D., et al., 2016, arXiv:1610.03159,
- Muraveva et al. (2018) Muraveva T., Delgado H. E., Clementini G., Sarro L. M., Garofalo A., 2018, MNRAS, 481, 1195
- Öttl et al. (2014) Öttl S., Kimeswenger S., Zijlstra A. A., 2014, A&A, 565, A87
- Peimbert (1978) Peimbert M., 1978, in Terzian Y., ed., IAU Symposium Vol. 76, Planetary Nebulae. pp 215–224
- Perinotto et al. (1999) Perinotto M., Bencini C. G., Pasquali A., Manchado A., Rodriguez Espinosa J. M., Stanga R., 1999, A&A, 347, 967
- Phillips & Guzman (1998) Phillips J. P., Guzman V., 1998, A&AS, 130, 465
- Pottasch & Bernard-Salas (2010) Pottasch S. R., Bernard-Salas J., 2010, A&A, 517, A95
- Prugniel & Soubiran (2001) Prugniel P., Soubiran C., 2001, A&A, 369, 1048
- Prugniel et al. (2007) Prugniel P., Soubiran C., Koleva M., Le Borgne D., 2007, VizieR Online Data Catalog, 3251
- Ramos-Larios et al. (2018) Ramos-Larios G., et al., 2018, MNRAS, 475, 932
- Riesgo & López (2006) Riesgo H., López J. A., 2006, Rev. Mex. Astron. Astrofis., 42, 47
- Riess et al. (2018) Riess A. G., et al., 2018, ApJ, 861, 126
- Sabbadin et al. (1977) Sabbadin F., Minello S., Bianchini A., 1977, A&A, 60, 147
- Sabin et al. (2013) Sabin L., et al., 2013, MNRAS, 431, 279
- Sánchez (2013) Sánchez S. F., 2013, Advances in Astronomy, 2013, 1
- Sánchez et al. (2012) Sánchez S. F., et al., 2012, A&A, 538, A8
- Schönrich et al. (2019) Schönrich R., McMillan P., Eyer L., 2019, MNRAS, 487, 3568
- Singh et al. (2013) Singh R., et al., 2013, A&A, 558, A43
- Tsamis et al. (2008) Tsamis Y. G., Walsh J. R., Péquignot D., Barlow M. J., Danziger I. J., Liu X.-W., 2008, MNRAS, 386, 22
- Upton & Cook (1997) Upton G., Cook I., 1997, Understanding statistics. Oxford : Oxford University Press
- Veilleux & Osterbrock (1987) Veilleux S., Osterbrock D. E., 1987, ApJS, 63, 295
- Virtanen et al. (2020) Virtanen P., et al., 2020, Nature Methods,
- Walsh et al. (2016) Walsh J. R., Monreal-Ibero A., Barlow M. J., Ueta T., Wesson R., Zijlstra A. A., 2016, A&A, 588, A106
- Walsh et al. (2018) Walsh J. R., et al., 2018, A&A, 620, A169
- Weidmann & Gamen (2011) Weidmann W. A., Gamen R., 2011, A&A, 526, A6
- Wesson (2016) Wesson R., 2016, MNRAS, 456, 3774
- Wesson et al. (2012) Wesson R., Stock D. J., Scicluna P., 2012, MNRAS, 422, 3516
- Xu et al. (2019) Xu S., Zhang B., Reid M. J., Zheng X., Wang G., 2019, ApJ, 875, 114
- Zhang & Liu (2002) Zhang Y., Liu X.-W., 2002, MNRAS, 337, 499
- Zhang et al. (2012) Zhang Y., Fang X., Chau W., Hsia C.-H., Liu X.-W., Kwok S., Koning N., 2012, ApJ, 754, 28
- Zinn et al. (2019) Zinn J. C., Pinsonneault M. H., Huber D., Stello D., 2019, ApJ, 878, 136
- van der Walt et al. (2011) van der Walt S., Colbert S. C., Varoquaux G., 2011, Computing in Science Engineering, 13, 22