Thermal and Pressure Ionization in Warm, Dense MgSiO3 Studied with First-Principles Computer Simulations
Abstract
Using path integral Monte Carlo and density functional molecular dynamics (DFT-MD) simulations, we study the properties of MgSiO3 enstatite in the regime of warm dense matter. We generate a consistent equation of state (EOS) that spans across a wide range of temperatures and densities (104–107 K and 6.42–64.16 g cm-3). We derive the shock Hugoniot curve, that is in good agreement with the experiments. We identify the boundary between the regimes of thermal ionization and pressure ionization by locating where the internal energy at constant temperature attains a minimum as a function of density or pressure. At low density, the internal energy decreases with increasing density as the weight of free states changes. Thermal ionization dominates. Conversely, at high density, in the regime of pressure ionization, the internal energy increases with density. We determine the boundary between the two regimes and show that the compression maximum along the shock Hugoniot curve occurs because K shell electrons become thermally ionized rather than pressure ionized.
I Introduction
Enstatite, MgSiO3, is one of the most abundant minerals on Earth’s crust and one of the few silicate minerals that has been observed in crystalline form outside the Solar System Molster et al. (2001). Therefore, it has been identified as one the primary building blocks of planetary formation Valencia et al. (2010); Bolis et al. (2016) and it is commonly used as a representative mantle material in exoplanet modeling Seager et al. (2007); Valencia, O’Connell, and Sasselov (2009); Valencia et al. (2010); Wagner et al. (2012). The equation of state (EOS) of silicate materials at high pressures and temperatures is fundamental to develop models of planetary formation González-Cataldo, Davis, and Gutiérrez (2016) and to interpret results from shock compression experiments Fratanduono et al. (2018). In planetary collision events, for example, the amount of heat generated during the shock can be sufficient to melt and even vaporize these minerals Kraus et al. (2012), and an accurate EOS is needed to describe these processes quantitatively. On the other hand, precise first-principles computer simulations of silicates can guide the design of inertial confinement fusion (ICF) experiments Lindl (1995); Gaffney et al. (2018); Zhang et al. (2019) under conditions where the K and L shell electrons are gradually ionized, which is challenging to predict accurately with analytical EOS models.
The properties of the liquid phase of MgSiO3 at high pressure have recently been explored in laser-driven shock compression experiments Spaulding et al. (2012); Bolis et al. (2016); Fratanduono et al. (2018), and suggest a metallic-like behavior over a wide range of pressure-temperature conditions. Similar findings were reported with first-principles calculations Soubiran and Militzer (2018) that demonstrated that super-Earth planets can generate magnetic fields within their mantles.
In this work, we combine path integral Monte Carlo (PIMC) and density functional theory molecular dynamics (DFT-MD) simulations to study the ionization in warm, dense MgSiO3. We distinguish the regimes of thermal ionization and pressure ionization, and show that the shock Hugoniot curve crosses from one regime into the other. The compression maximum along the Hugoniot curve is found to fall within the regime of thermal ionization. The K shell electrons of all three nuclei contribute to the compression maximum.
II Methodology
Rigorous discussions of the PIMC Ceperley (1995, 1996); Militzer and Driver (2015); Militzer, Pollock, and Ceperley (2019) and DFT-MD Car and Parrinello (1985); Payne et al. (1992); Marx and Hutter (2009) methods have been provided in previous works, and the details of our simulations have been presented in some of our previous publications Militzer, Magro, and Ceperley (1999); Driver and Militzer (2016); Soubiran et al. (2019). Here we summarize the methods and provide the simulation parameters specific to simulations of MgSiO3 plasma. The general idea of our approach is to perform simulations along isochores at high temperatures ( K) using PIMC and at low temperatures ( K) using DFT-MD simulations. We find the two methods produce consistent results at overlapping temperatures Zhang et al. (2018a, 2019).
For PIMC simulations, we use the CUPID code Militzer (2000); Militzer et al. (2001); Militzer (2009) with Hartree-Fock nodes Zhang et al. (2017); Driver and Militzer (2017); Driver, Soubiran, and Militzer (2018). For DFT-MD simulations, we employ Kohn-Sham DFT simulation techniques as implemented in the Vienna Ab initio Simulation Package (VASP) Kresse and Furthmüller (1996) using the projector augmented-wave (PAW) method Blöchl (1994); Kresse and Joubert (1999), and molecular dynamics is performed in the NVT ensemble, regulated with a Nosé thermostat. Exchange-correlation effects are described using the Perdew, Burke, and Ernzerhof Perdew, Burke, and Ernzerhof (1996) (PBE) generalized gradient approximation (GGA). The pseudopotentials used in our DFT-MD calculations freeze the electrons of the 1s orbital, which leaves 10, 12, and 6 valence electrons for Mg, Si, and O atoms, respectively. Electronic wave functions are expanded in a plane-wave basis with an energy cut-off as high as 7000 eV in order to converge the total energy. Size convergence tests with up to a 65-atom simulation cell at temperatures of 10 000 K and above, indicate that pressures are converged to better than 0.6%, while internal energies are converged to better than 0.1%. We find, at temperatures above 500 000 K, that 15-atom supercells are sufficient to obtain converged results for both energy and pressure, since the kinetic energy far outweighs the interaction energy at such high temperatures Driver and Militzer (2012, 2015); Driver, Soubiran, and Militzer (2018). The number of bands in each calculation was selected such that orbitals with occupation as low as were included, which requires up to 14 000 bands in an 15-atom cell at K and two-fold compression. All simulations are performed at the point of the Brillouin zone, which is sufficient for high temperature fluids, converging total energy to better than 0.01% compared to a grid of -points.
III Results
In Fig. 1, we show our EOS data points from Ref. González-Cataldo et al. (2020) in temperature-density and temperature-pressure space. Computations were performed for a series of densities and temperatures, ranging from 6.42–64.16 g cm-3 and – K, respectively. To provide a guide for future ramp compression experiments, we also plot different isentropes, derived from the relationship Militzer (2009). We find that the slope of the isentropes does not strongly depend on temperature, even though we compare conditions with differing degrees of ionization. Our results imply that the temperature rise with pressure along the isentropes approximately follows a power law, , with an exponent below K, increasing only up to for temperatures above K. This provides a simple rule for obtaining isentropic profiles in MgSiO3 with wide-range validity, without the need of developing models for other properties of the material, such as the Mie–Grüneisen model.
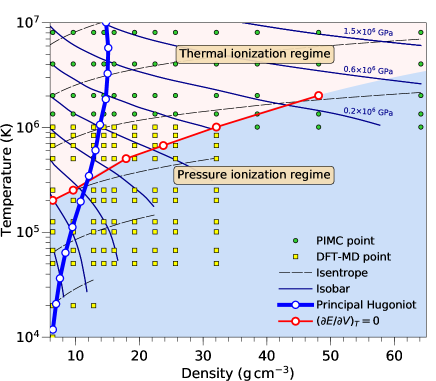
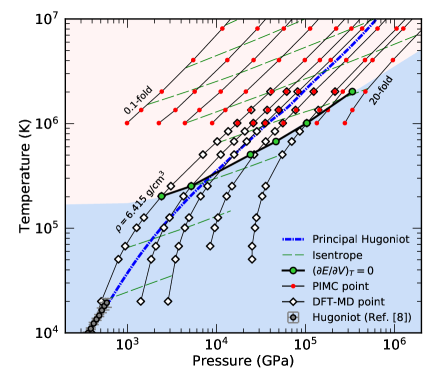
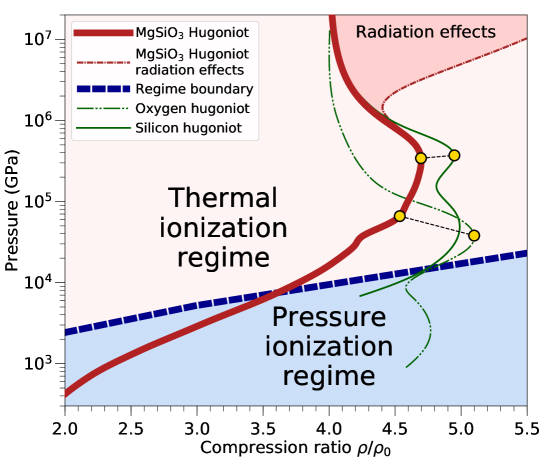
The Hugoniot curve of MgSiO3 obtained from shock experiments by Fratanduono et al. Fratanduono et al. (2018) is plotted along with our predicted Hugoniot curve on the temperature-pressure plot of Fig. 1. In the experiment, laser-driven shocks were used to compress enstatite up to 600 GPa, reaching temperatures as high as K. This allowed to explore the solid and liquid regimes of MgSiO3 and obtain a continuous measurement of the principal Hugoniot curve. We observe that our Hugoniot curve agrees very well with the experimental data.
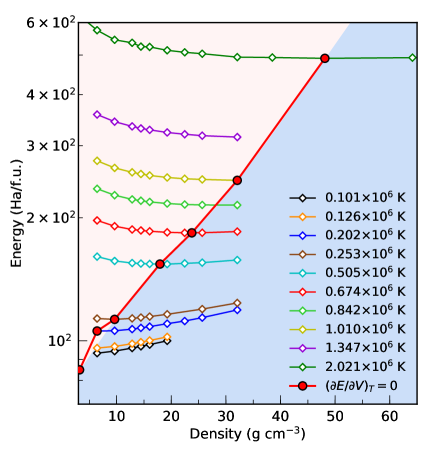
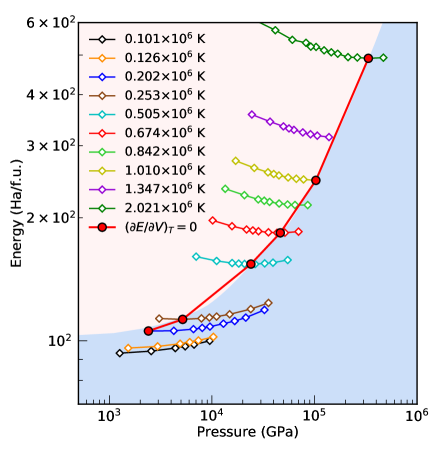
In Fig. 2, we plot the internal energy of the system at fixed temperature as a function of density. Most curves exhibit a minimum that satisfies the condition,
| (1) |
Because thermodynamic stability requires , this conditions is only satsified if . From the first law of thermodynamics, , it follows that
| (2) |
where we have used the Maxwell identity . Therefore, the condition in Equation (1) is satisfied if
| (3) |
where is the thermal pressure coefficient. Thus, the energy attains a mininum along an isotherm if the thermal pressure coefficient satisfies
| (4) |
We visualize this condition in the right panel of Fig. 3, where the dashed lines have a constant slope of 1 in the - space.
For example, along the K isotherm shown in Fig. 2, we find an energy minimum around g cm-3 while the slope becomes 1 at precisely the same temperature on the corresponding isochore, as we show in Fig. 3. This slope descreases with increasing temperature, but at some point along the isochore this trend reverses and the slope starts to increase, converging asymptotically to 1 in the ideal gas limit at very high temperature.
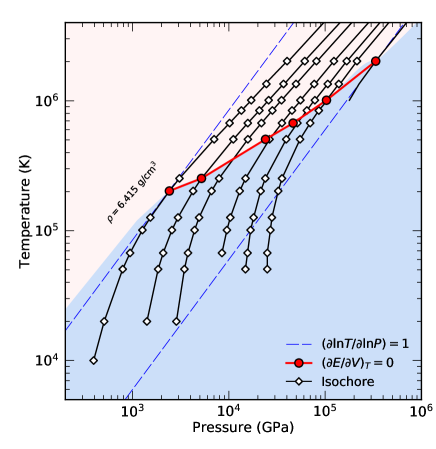
This condition is trivially fulfilled for an ideal gas, that satisfies at any condition. At very high temperature, where all atomic species are completely ionized, we find that MgSiO3 starts to behave like an ideal gas and the isochores approach a slope of 1. We confirm that this condition is satisfied in Fig. 1, that illustrates how all the isochores attain a slope of 1 at sufficiently high temperature.
From Equation (1) we infer that, if the energy attains a minimum as function of density it will also exhibit a corresponding minimum as a function of pressure, which we illustrate in the left panel of Fig. 3.
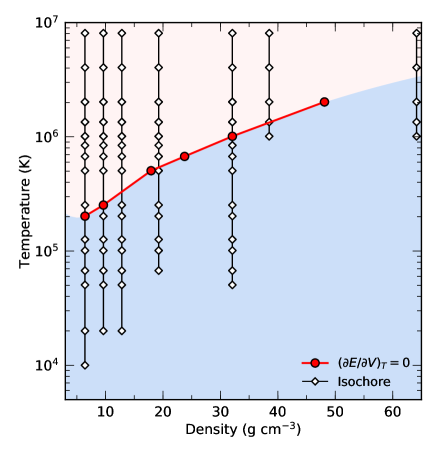
The degree of ionization is controlled by the statistical weights of free and bound states. In the limit of low density, where particles interact weakly, the internal energy increases with decreasing density because more and more free-particle states become accessible since their energies scale like . Let us assume the energies of bound states do not change, which is reasonable in the weak-coupling limit. Under these assumptions, the degree of ionization and the internal energy will always increase if density is decreased at constant temperature. This regime is typically described well by the Saha equation Ebeling, Kraeft, and Kremp (1976) and we refer to conditions with as the thermal ionization regime. Conversely, in the limit of high density, the internal energy increases with density and we refer to such conditions as the pressure ionization regime. Such an internal energy increase can only occur if the energy of the bound states increases. There may be several contributing factors including interaction and Pauli exclusion effects that modify the energy of bound but also of free states. In some cases, bound states merge with the continuum of free states. All these effects are expected to contribute to a rise in internal energy with increasing density, as we observed in our first-principles simulations at high density. We have shaded the thermal and pressure ionization regimes in the figures throughout this article. The condition in Equation (1) marks the boundary between the two regimes. From Fig. 4, we learn that the ionization of K shell electrons, that leads to a compression maximum along the shock Hugoniot curve, is a thermally driven process.
In the limit of low temperature, we expect the line to converge to the density of ambient MgSiO3 of g cm-3, which marks a minimum in internal energy. As any standard equation of state illustrates Birch (1947); Vinet et al. (1987), the internal energy of the solid will rise as the material is compressed or expanded without changing ionization state of the material. This is an example for an energy increase that is not associated with an noticible increase in the ionization fraction. In general, a density change will affect the energies of bound and free states if the system is strongly-coupled. It is only if the bound state energies are affected more severely that an increase in internal energy is associated with an increase in the degree of ionization. It is also possible that higher-lying bound states are affected by pressure ionization while lower-lying, confined states are not yet. Our energy criterion is not able to make such distinctions. Nevertheless, it detects increases in the energy of bound states, which is a necessary condition for pressure ionization to occur. So, in our view, this renders our energy criterion a useful approach to distinguish the regimes of thermal and pressure ionization.
IV Conclusion
We have constructed a consistent EOS of MgSiO3 over a wide range of temperature and density conditions by combining results from DFT-MD and PIMC simulations in order to bridge the warm dense matter and plasma regimes Zhang et al. (2018b, 2019). One goal of performing high-precision computer simulations based on first principles is to guide the design of inertial confinement fusion (ICF) experiments under conditions where the K and L shell electrons are gradually ionized, which is challenging to predict accurately with analytical EOS models.
Here we have introduced a simple thermodynamic criterion based on volume dependence of the internal energy that allows us to distinguish between the regimes of thermal ionization, , and pressure ionization . We conclude that the ionization of the K shell electrons is a thermally activated rather than pressure driven process under the condition where the compression maximum occurs on the principal shock Hugoniot curve.
Acknowledgements.
This work was in part supported by the National Science Foundation-Department of Energy (DOE) partnership for plasma science and engineering (grant DE-SC0016248), by the DOE-National Nuclear Security Administration (grant DE-NA0003842), and the University of California Laboratory Fees Research Program (grant LFR-17-449059). We thank the authors of Ref. Fratanduono et al. (2018) for providing the full data set from their experiments. F.G.-C. acknowledges support from the CONICYT Postdoctoral fellowship (grant 74160058). Computational support was provided by the Blue Waters sustained-petascale computing project (NSF ACI 1640776) and the National Energy Research Scientific Computing Center.References
- Molster et al. (2001) F. Molster, T. Lim, R. Sylvester, L. Waters, M. Barlow, D. Beintema, M. Cohen, P. Cox, and B. Schmitt, Astronomy & Astrophysics 372, 165 (2001).
- Valencia et al. (2010) D. Valencia, M. Ikoma, T. Guillot, and N. Nettelmann, Astronomy & Astrophysics 516, A20 (2010).
- Bolis et al. (2016) R. M. Bolis, G. Morard, T. Vinci, A. Ravasio, E. Bambrink, M. Guarguaglini, M. Koenig, R. Musella, F. Remus, J. Bouchet, N. Ozaki, K. Miyanishi, T. Sekine, Y. Sakawa, T. Sano, R. Kodama, F. Guyot, and A. Benuzzi-Mounaix, Geophysical Research Letters 43, 9475 (2016).
- Seager et al. (2007) S. Seager, M. Kuchner, C. A. Hier-Majumder, and B. Militzer, The Astrophysical Journal 669, 1279 (2007).
- Valencia, O’Connell, and Sasselov (2009) D. Valencia, R. J. O’Connell, and D. D. Sasselov, Astrophysics and Space Science 322, 135 (2009).
- Wagner et al. (2012) F. W. Wagner, N. Tosi, F. Sohl, H. Rauer, and T. Spohn, Astronomy & Astrophysics 541, A103 (2012).
- González-Cataldo, Davis, and Gutiérrez (2016) F. González-Cataldo, S. Davis, and G. Gutiérrez, Scientific Reports 6, 26537 (2016).
- Fratanduono et al. (2018) D. E. Fratanduono, M. Millot, R. G. Kraus, D. K. Spaulding, G. W. Collins, P. M. Celliers, and J. H. Eggert, Phys. Rev. B 97, 214105 (2018).
- Kraus et al. (2012) R. Kraus, S. Stewart, D. Swift, C. Bolme, R. Smith, S. Hamel, B. Hammel, D. Spaulding, D. Hicks, J. Eggert, et al., Journal of Geophysical Research: Planets 117 (2012).
- Lindl (1995) J. Lindl, Physics of plasmas 2, 3933 (1995).
- Gaffney et al. (2018) J. Gaffney, S. Hu, P. Arnault, A. Becker, L. Benedict, T. Boehly, P. Celliers, D. M. Ceperley, O. Čertík, J. Clérouin, et al., High Energy Density Physics 28, 7 (2018).
- Zhang et al. (2019) S. Zhang, A. Lazicki, B. Militzer, L. H. Yang, K. Caspersen, J. A. Gaffney, M. W. Däne, J. E. Pask, W. R. Johnson, A. Sharma, P. Suryanarayana, D. D. Johnson, A. V. Smirnov, P. A. Sterne, D. Erskine, R. A. London, F. Coppari, D. Swift, J. Nilsen, A. J. Nelson, and H. D. Whitley, Phys. Rev. B 99, 165103 (2019).
- Spaulding et al. (2012) D. K. Spaulding, R. S. McWilliams, R. Jeanloz, J. H. Eggert, P. M. Celliers, D. G. Hicks, G. W. Collins, and R. F. Smith, Phys. Rev. Lett. 108, 065701 (2012).
- Soubiran and Militzer (2018) F. Soubiran and B. Militzer, Nature Communications 9, 3883 (2018).
- Ceperley (1995) D. M. Ceperley, Rev. Mod. Phys. 67, 279 (1995).
- Ceperley (1996) D. Ceperley (Editrice Compositori, Bologna, Italy, 1996) p. 443.
- Militzer and Driver (2015) B. Militzer and K. P. Driver, Phys. Rev. Lett. 115, 176403 (2015).
- Militzer, Pollock, and Ceperley (2019) B. Militzer, E. L. Pollock, and D. Ceperley, High Energy Density Physics 30, 13 (2019).
- Car and Parrinello (1985) R. Car and M. Parrinello, Phys. Rev. Lett. 55, 2471 (1985).
- Payne et al. (1992) M. C. Payne, M. P. Teter, D. C. Allan, T. A. Arias, and J. D. Joannopoulos, Rev. Mod. Phys. 64, 1045 (1992).
- Marx and Hutter (2009) D. Marx and J. Hutter, Ab initio molecular dynamics: basic theory and advanced methods (Cambridge University Press, 2009).
- Militzer, Magro, and Ceperley (1999) B. Militzer, W. Magro, and D. Ceperley, Contributions to Plasma Physics 39, 151 (1999).
- Driver and Militzer (2016) K. P. Driver and B. Militzer, Phys. Rev. B 93, 064101 (2016).
- Soubiran et al. (2019) F. Soubiran, F. González-Cataldo, K. P. Driver, S. Zhang, and B. Militzer, The Journal of Chemical Physics 151, 214104 (2019).
- Zhang et al. (2018a) S. Zhang, B. Militzer, M. C. Gregor, K. Caspersen, L. H. Yang, J. Gaffney, T. Ogitsu, D. Swift, A. Lazicki, D. Erskine, R. A. London, P. M. Celliers, J. Nilsen, P. A. Sterne, and H. D. Whitley, Phys. Rev. E 98, 023205 (2018a).
- Militzer (2000) B. Militzer, Path Integral Monte Carlo Simulations of Hot Dense Hydrogen, Ph.D. thesis, University of Illinois at Urbana-Champaign (2000).
- Militzer et al. (2001) B. Militzer, D. M. Ceperley, J. D. Kress, J. D. Johnson, L. A. Collins, and S. Mazevet, Phys. Rev. Lett. 87, 275502 (2001).
- Militzer (2009) B. Militzer, Phys. Rev. B 79, 155105 (2009).
- Zhang et al. (2017) S. Zhang, K. P. Driver, F. Soubiran, and B. Militzer, J. Chem. Phys. 146, 074505 (2017).
- Driver and Militzer (2017) K. P. Driver and B. Militzer, Phys. Rev. E 95, 043205 (2017).
- Driver, Soubiran, and Militzer (2018) K. P. Driver, F. Soubiran, and B. Militzer, Phys. Rev. E 97, 063207 (2018).
- Kresse and Furthmüller (1996) G. Kresse and J. Furthmüller, Phys. Rev. B 54, 11169 (1996).
- Blöchl (1994) P. E. Blöchl, Phys. Rev. B 50, 17953 (1994).
- Kresse and Joubert (1999) G. Kresse and D. Joubert, Phys. Rev. B 59, 1758 (1999).
- Perdew, Burke, and Ernzerhof (1996) J. P. Perdew, K. Burke, and M. Ernzerhof, Phys. Rev. Lett. 77, 3865 (1996).
- Driver and Militzer (2012) K. P. Driver and B. Militzer, Phys. Rev. Lett. 108, 115502 (2012).
- Driver and Militzer (2015) K. P. Driver and B. Militzer, Phys. Rev. B 91, 045103 (2015).
- González-Cataldo et al. (2020) F. González-Cataldo, F. Soubiran, H. Peterson, and B. Militzer, Physical Review B 101, 024107 (2020).
- Ebeling, Kraeft, and Kremp (1976) W. Ebeling, W. Kraeft, and D. Kremp, Theory of bound states and ionization equilibrium in plasmas and solids, Ergebnisse der Plasmaphysik und der Gaselektronik, Band 5 (Akademie-Verlag, Berlin, 1976).
- Birch (1947) F. Birch, Phys. Rev. 71, 809 (1947).
- Vinet et al. (1987) P. Vinet, J. R. Smith, J. Ferrante, and J. H. Rose, Phys. Rev. B 35, 1945 (1987).
- Driver et al. (2015) K. P. Driver, F. Soubiran, S. Zhang, and B. Militzer, J. Chem. Phys. 143, 164507 (2015).
- Zhang et al. (2018b) S. Zhang, B. Militzer, L. X. Benedict, F. Soubiran, P. A. Sterne, and K. P. Driver, J. Chem. Phys. 148, 102318 (2018b).