A tale of two populations: surviving and destroyed dwarf galaxies and the build-up of the Milky Way’s stellar halo
Abstract
We use magneto-hydrodynamical simulations of Milky Way-mass haloes from the Auriga project to investigate the properties of surviving and destroyed dwarf galaxies that are accreted by these haloes over cosmic time. We show that the combined luminosity function of surviving and destroyed dwarfs at infall is similar in the various Auriga haloes, and is dominated by the destroyed dwarfs. There is, however, a strong dependence on infall time: destroyed dwarfs typically have early infall times of less than Gyr (since the Big Bang), whereas the majority of dwarfs accreted after Gyr have survived to the present day. Because of their late infall, the surviving satellites have higher metallicities at infall than their destroyed counterparts of similar mass at infall; the difference is even more pronounced for the present-day metallicities of satellites, many of which continue to form stars after infall, in particular for . In agreement with previous work, we find that a small number of relatively massive destroyed dwarf galaxies dominate the mass of stellar haloes. However, there is a significant radial dependence: while 90 percent of the mass in the inner regions (kpc) is contributed, on average, by only 3 massive progenitors, the outer regions (kpc) typically have main progenitors of relatively lower mass. Finally, we show that a few massive progenitors dominate the metallicity distribution of accreted stars, even at the metal-poor end. Contrary to common assumptions in the literature, stars from dwarf galaxies of mass make up less than 10 percent of the accreted, metal poor stars ([Fe/H] ) in the inner kpc.
keywords:
Milky Way - Stellar halo - dwarf galaxies - galaxy formation1 Introduction
The hierarchical nature of galaxy formation in the CDM cosmological model implies that galaxies are surrounded by a diffuse stellar halo formed by the accretion and disruption of lower mass galaxies (e.g. Bullock & Johnston, 2005; Cooper et al., 2010). This formation mechanism indicates that the halo is composed of relatively old, metal-poor stars, many still part of substructures associated with accretion events. The early discovery of the Sagittarius stream (Newberg et al., 2002; Majewski et al., 2003) and Helmi stream (Helmi et al., 1999) around the Milky Way, and later of the field of streams (Belokurov et al., 2006), as well as observations of nearby galaxies such as the Andromeda galaxy (McConnachie et al., 2009), strongly favour this overall picture for the formation of stellar haloes.
The Galactic halo, which, because of its proximity, can be resolved into individual stars and substructures, provides a unique window into the assembly history of the Milky Way (MW), and allows important tests of the galaxy formation framework. Recent surveys, in particular the Gaia mission, are revolutionising our understanding of the formation and evolution of our Galaxy, including its stellar halo, by providing 6D phase-space information and chemical data for a large number of stars (Gaia Collaboration, 2016, 2018). For example, the discovery of the Gaia-Sausage-Enceladus population of stars in highly eccentric orbits uncovered a significant accretion event in the history of the MW (Belokurov et al., 2018; Haywood et al., 2018; Helmi et al., 2018; Myeong et al., 2018)111Note, however, that there is some debate as to whether or not Gaia-sausage and Gaia-Enceladus refer to the same structure and event; see, e.g. Evans (2020); Elias et al. (2020).. This population is thought to have been brought in by a relatively massive dwarf galaxy whose destruction generated a significant fraction of the inner stellar halo (Fattahi et al., 2019; Mackereth et al., 2019; Bignone et al., 2019); this is consistent with predictions from cosmological simulations (Bullock & Johnston, 2005; Cooper et al., 2010).
Before evidence of the hierarchical formation of the stellar halo became available, a commonly held view was that the halo had formed by ‘monolithic collapse’ (Eggen et al., 1962). Early arguments against formation through accretion included the apparent lack of extremely metal-poor stars in dwarf galaxies and the different [/Fe] abundance patterns of the stellar halo and dwarf galaxies (see, e.g., Gilmore & Wyse, 1998; Helmi et al., 2006; Tolstoy et al., 2009). However, improving observational techniques in deriving metallicities and the discovery of very low metallicity stars in Sculptor and other dwarfs, addressed the first objection (Kirby et al., 2008; Frebel et al., 2010; Starkenburg et al., 2013). Moreover, it was recognized that the observed difference in the [/Fe] abundance patterns could be explained if the stellar halo formed from the early accretion of relatively massive dwarf galaxies (Robertson et al., 2005; Font et al., 2006). A second debate ensued as to whether the building blocks of the halo are analogueous to the dwarfs that survive at the present or whether they are fundamentally different kinds of galaxies (e.g Tolstoy et al., 2003; Venn et al., 2004). This is one of the main topics that we address in this work. Previous discussions of this topic may be found in Read et al. (2006); Purcell et al. (2007); Sales et al. (2007); Tissera et al. (2012); Chua et al. (2017); Fiorentino et al. (2017).
The basic features of galactic halo formation were established in N-body cosmological simulations of MW-mass haloes combined with simple models for the stellar component (such as particle tagging methods; Bullock & Johnston, 2005; Cooper et al., 2010). In particular, these models showed that the mass of galactic stellar haloes is dominated by a few massive destroyed dwarf galaxies and that the contribution from low-mass and ultra-faint dwarfs is negligible (Deason et al., 2015, 2016; Fiorentino et al., 2017; D’Souza & Bell, 2018; Amorisco, 2017; Monachesi et al., 2019). High-resolution hydrodynamical simulations of MW-mass haloes in CDM, where the dwarf galaxies responsible for the stellar halo are resolved, became possible in the past few years (e.g., APOSTLE, Auriga, Latte, ‘ELVIS on Fire’; Sawala et al., 2016; Fattahi et al., 2016; Grand et al., 2017; Wetzel et al., 2016; Garrison-Kimmel et al., 2018), leading to more detailed predictions and interpretation of the observational data. These simulations offer the opportunity to follow the formation of stellar haloes in a realistic and self-consistent way by including processes not modelled in N-body simulations, such as gas physics, star formation after infall, self-consistent metallicities, and the formation of an in-situ component of the stellar halo.
The in-situ halo component seen in hydrodynamical simulations consists of kinematically hot stars born in the main progenitor of the galaxy. The three main mechanisms for the formation of this kinematically hot in-situ component are: (i) heated disc stars, (ii) stars formed in the halo from cooling gas, (iii) stars formed from stripped gas from accreted dwarfs (Cooper et al., 2015). The fraction of these stars and the contribution from the various formation channels are simulation dependent and therefore highly debated (see also, Font et al., 2011; Zolotov et al., 2009; Pillepich et al., 2015, 2018; Monachesi et al., 2016b). Indeed, Monachesi et al. (2019) show that the mass of stellar haloes in the Auriga simulations are in better agreement with observations when only the accreted component is considered.
In this work, we analyze the Auriga suite of cosmological hydrodynamical simulations of MW-mass haloes. Our main goal is to compare the overall properties of dwarf galaxies that have been tidally disrupted and whose stars make up the accreted galactic stellar halo with the properties of the dwarf galaxies that survive as satellites. We then focus on the destroyed population and examine the radial assembly and metallicity build-up of stellar haloes. This latter part of the paper is complementary to the work of Monachesi et al. (2019) who studied the assembly history and general properties of galactic stellar haloes in the Auriga simulations. We extend that work to include an analysis of the radial dependence of the assembly history of the stellar halo, as well as the implications for the build-up of the dark matter halo and for the most metal-poor component of the stellar halo.
This paper is organized as the following; Sec. 2 describes the simulations; Sec. 3 compares the luminosity function, infall time, metallicity and gas content of destroyed and surviving satellites; Sec. 4 describes the assembly of Auriga stellar haloes, and Sec. 4.2 the metallicity build-up of the halo as a function of radius. We conclude with a summary in Sec. 6.
2 Auriga Simulations
In this study we use cosmological, magneto-hydrodynamical (MHD) simulations of MW-mass haloes from the Auriga project (Grand et al., 2017). The Auriga suite consists of ‘zoom-in’ simulations (Frenk et al., 1996) of relatively isolated haloes with virial masses of , which were chosen from the periodic cube of the EAGLE project (Schaye et al., 2015; Crain et al., 2015). The simulations start at from initial conditions made by Panphasia (Jenkins, 2013), and are developed to by the Tree-PM, moving-mesh code, arepo (Springel, 2011; Weinberger et al., 2019). The subgrid galaxy formation model is described in detail in Grand et al. (2017) and Marinacci et al. (2014). In summary, it includes metal line cooling, star formation, stellar evolution feedback, supermassive black hole formation and feedback, homogeneous UV photoionizing radiation with reionization redshift . The simulations assume cosmological parameters in accordance to Planck Collaboration (2015): , , , and a Hubble parameter of .
We analyze the original 30 Auriga haloes of mass, , at the fiducial level (L4) resolution, , with gas particle mass resolution, , and a maximum Plummer equivalent gravitational softening, pc. Six of the Auriga haloes have been simulated at the higher resolution level (L3), at which, , and pc.
Dark matter haloes in the simulations were identified using a Friends-of-Friends (FoF) algorithm (Davis et al., 1985) and bound structures and substructures within FoF groups were found iteratively using SUBFIND (Springel, 2005). MW analogues refer to the central subhalo (subhalo-0) of the main FoF groups. Grand et al. (2017) present an analysis of the galactic discs in the simulations and show that they reproduce the general properties of disc-dominated galaxies. Simpson et al. (2018) shows that the luminosity function of the dwarf satellites in Auriga matches that of the Milky Way satellites. Furthermore, the sizes and star formation histories of the dwarf satellites have also been shown to agree with observations (Bose et al., 2019; Digby et al., 2019).
In this work, we use merger trees to track galaxies in time only after ( Gyr since the Big Bang), due to the uncertainties in the identification of the main progenitors at earlier times. We refer to destroyed dwarfs as those that have fallen into the main host222Infall is defined as crossing the radius of the main halo for the first time. Infall parameters are based on the snapshot immediately before crossing . more recently than and retain no bound remnant (according to SUBFIND) at the present time. For the fiducial resolution (L4), being destroyed is equivalent to galaxy masses falling below and . Satellites are identified as surviving bound substructures within of the main haloes at . Stellar mass and average metallicities of dwarfs at any given time are defined based on the bound star particles inside twice their 3D stellar half mass radius (). The reference frames of the MW analogues are based on SUBFIND, i.e. the position of the particle with the minimum gravitational potential. The orientations of galactic discs are defined according to the angular momentum of stars within 10 kpc.
The results presented in this work include 28 Auriga haloes, rather than the full suite of 30, since we discard two of them (Au-11 and Au-20) as they are undergoing a merger at .
2.1 Accreted and in-situ forming stars
In this study, accreted or ex-situ333We use the terms ex-situ and accreted interchangeably throughout this paper. stars are defined as those that are bound to the MW analogues (not to satellites) at , but were born in a halo or subhalo other than the main progenitor of the MW. In practice, the birth location is established at the snapshot immediately following the formation of the star. Since we do not track galaxies before , stars that are formed before that redshift are flagged as accreted or in-situ according to their membership at . Such old stars make up percent of the final stellar mass in Auriga galaxies and therefore do not affect our results significantly.
According to our definition of accreted and in-situ stars, stars that are formed in satellite galaxies before and after infall are flagged as accreted, while stars that are formed out of stripped gas from satellites (i.e. gas that is no longer bound to the satellites) are flagged as in-situ. Indeed, Cooper et al. (2015), using a suite of three hydrodynamical simulations of MW-mass haloes, found that most of the gas stripped from satellites is accreted onto the disc of the galaxy and forms stars there.
3 Destroyed vs. surviving dwarf galaxies
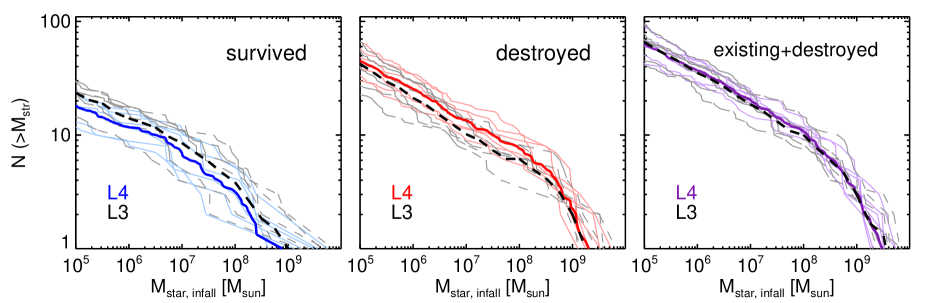
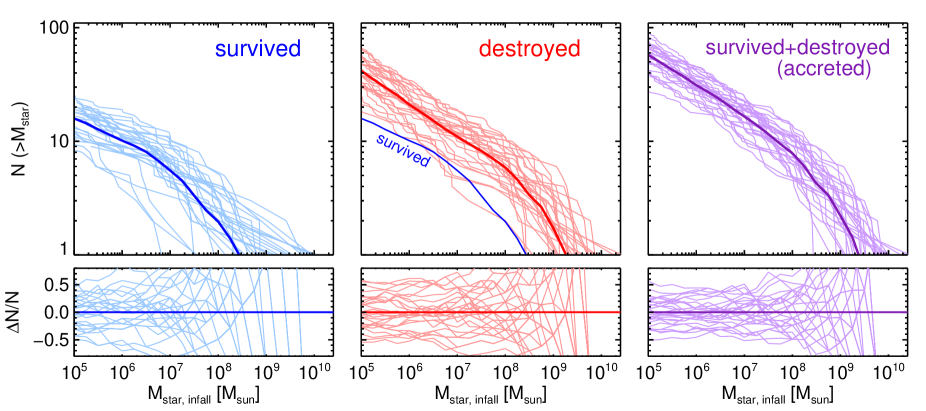
We present the cumulative stellar mass function (SMF) at infall of surviving satellites444We use the terms satellites and surviving satellites interchangeably in this work., destroyed dwarfs, and the combination of the two populations (i.e. all accreted) in the top row of Fig. 1. Lighter colour curves show individual haloes, while the thick solid lines show the average of all curves in each panel. This figure includes dwarf galaxies with only a few star particles. We discuss convergence using the L3 simulations in Appendix A, and show that the results are very well converged. We emphasize that the total accreted SMF (rightmost panel) does not suffer from potential numerical artifacts related to tidal stripping and disruption of subhaloes (van den Bosch & Ogiya, 2018; Errani & Peñarrubia, 2020), since those effects might, if anything, change the relative number of destroyed and survived dwarfs, but not the total number of accreted ones.
This total accreted (i.e. destroyed+survived) SMF is the outcome of the dark matter subhalo accretion history combined with the stellar mass-halo mass relation at different redshifts. The former is a prediction of the CDM structure formation model and has been shown to be relatively similar amongst haloes of similar mass (Guo & White, 2008; Fakhouri et al., 2010; Ludlow et al., 2013; Jiang et al., 2015). The stellar mass-halo mass relation depends on the galaxy formation model of the simulations, but has little scatter at fixed stellar mass, at the low mass end (Simpson et al., 2018). Therefore, it is not surprising that the overall accreted SMF also has relatively small scatter amongst various haloes.
Fig. 1 shows that there are fewer satellites, on average, relative to destroyed dwarfs; 28 percent of all accreted dwarfs with infall mass , and 33 percent of those with survive to . However, this does not necessarily imply that the mass of the accreted stellar halo in MW-mass galaxies is larger than the combined stellar mass of the surviving satellites. For example, not all of the accreted mass will end up in the stellar halo; a fraction will end up in the disc and a small fraction in the bulge (Gómez et al., 2017; Gargiulo et al., 2019). We checked that in these Auriga haloes the median ratio between the accreted mass inside and the combined stellar mass of the surviving satellites at is , with a large scatter of 1.0 dex. This ratio changes to when considering the accreted component outside the disc region ( kpc and kpc). Thus, the definition of “stellar halo” is an important consideration when comparing the total mass of accreted components with observations.
It is interesting to note that the halo-to-halo variation in the stellar mass of the very brightest destroyed dwarf galaxies in Fig. 1 is nearly a factor of 100, even though the masses of MW analogs are similar. Since it is the remnants of these bright dwarf galaxies that dominate the stellar haloes, this variation explains some of the observed diversity in the stellar haloes of MW-mass galaxies (see, also Deason et al., 2016; D’Souza & Bell, 2018; Monachesi et al., 2019). We discuss this further in Sec. 4.
3.1 Dependence on Infall time
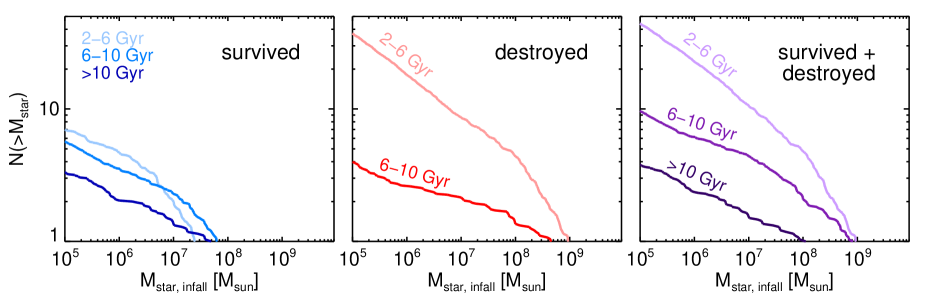
The SMF of satellites and destroyed dwarfs accreted over cosmic time have a similar shape (but different normalisation). How does this change as a function of infall time? Fig. 2 presents the SMFs for the same three populations as in the previous figure, but divided into three bins of infall time555Infall times throughout this work refer to the age of the Universe when the infall happens, not to lookback time; i.e. is the Big Bang and 13.8 Gyr corresponds to present day. (and averaged over the 28 Auriga haloes). Firstly, it is worth noting the relatively small variation in the SMF of surviving satellites to z=0 for different infall times, in contrast to the destroyed population SMF which shows a strong dependence on infall time666Note that only a few destroyed dwarfs over all the haloes, fell in after Gyr, hence there is no corresponding line in the middle panel.; in particular, the population is dominated by early infall dwarfs. Additionally, we note that the total accreted dwarfs are dominated, in terms of number and mass, by these early infall dwarfs ( Gyr) which are mostly destroyed by the present time.
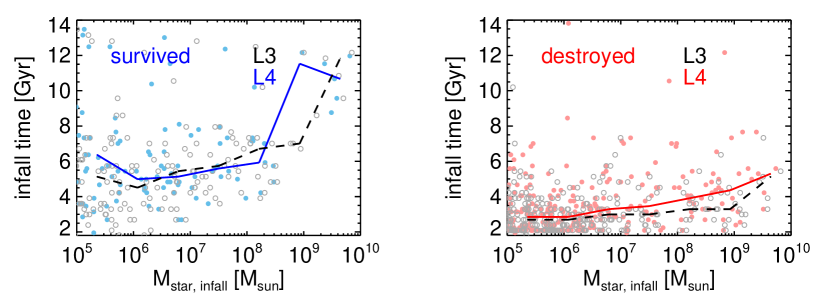
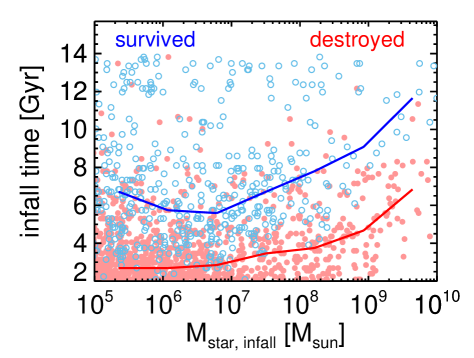
The bias in the infall time of the destroyed dwarfs compared to survived satellites, as a function of stellar mass, is shown more clearly in Fig. 3, where circles correspond to individual dwarf galaxies in the 28 Auriga haloes, and the lines represent the average as a function of infall stellar mass. Destroyed dwarfs fell in, on average, Gyr earlier than satellites, with very few (1 percent) falling after Gyr; by contrast a significant fraction ( percent) of surviving satellites have crossed the virial radius of the host for the first time after Gyr. Additionally, we note that the infall times of accreted dwarfs (either destroyed or surviving) increase with stellar mass. At a stellar mass of , the typical infall times for destroyed and surviving dwarfs are Gyr and Gyr, respectively; at stellar mass of these numbers change to Gyr and Gyr for destroyed and surviving dwarfs, respectively. This trend with mass reflects the hierarchical nature of galaxy formation in CDM , where more massive galaxies form later from the accretion and mergers of smaller constituents. We checked that these results are robust to changes in numerical resolution (see, Fig. 12).
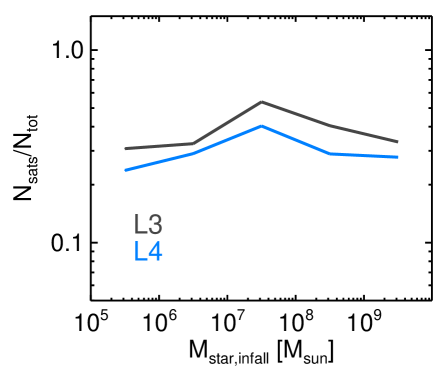
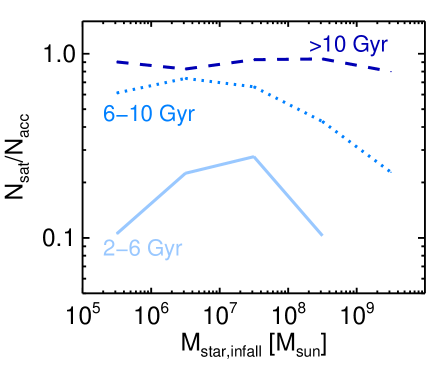
The survivability of accreted dwarfs depends both on their infall time and their infall mass. We examine this in Fig. 4 where we illustrate the fraction of surviving satellites at relative to the total number of accreted dwarfs, , as a function of infall stellar mass, and divided into different infall time bins. The curves show averages over all the 28 haloes. As expected, a large fraction of accreted dwarfs ( percent) which fell in after Gyr survive to , whereas only percent of the early infall () dwarfs survive as classical satellites () today.
There are two interesting points about the trends with stellar mass in Fig. 4. Firstly, more massive objects get destroyed more efficiently at a given infall time. This is well understood to be the result of dynamical friction, which strongly affects more massive objects and drags their orbit towards the centre, hence leading to more efficient tidal disruption. On the other hand, objects with lower stellar mass appear to have a higher chance of getting disrupted. We have checked these results in the L3 runs and confirm that this behaviour persists at higher resolution (see Fig. 13). Rather than a resolution artifact, the behaviour at the low mass end can be understood when considering the trend of infall time with mass (Fig. 3), and the fact that lower mass objects have lower densities and are less resilient to tides. Interestingly, the combined effects of tides at the low mass end and dynamical friction at the high mass end, result in a mass range, , where accreted dwarf galaxies have the highest chance of survival (at a fixed infall time).
3.2 Metallicity and gas content
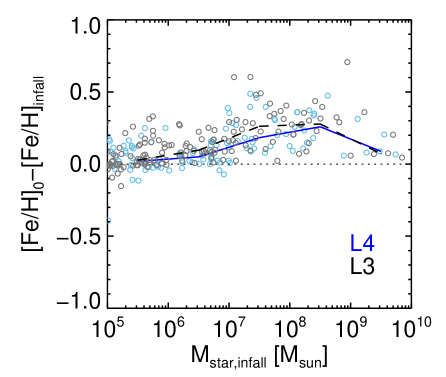
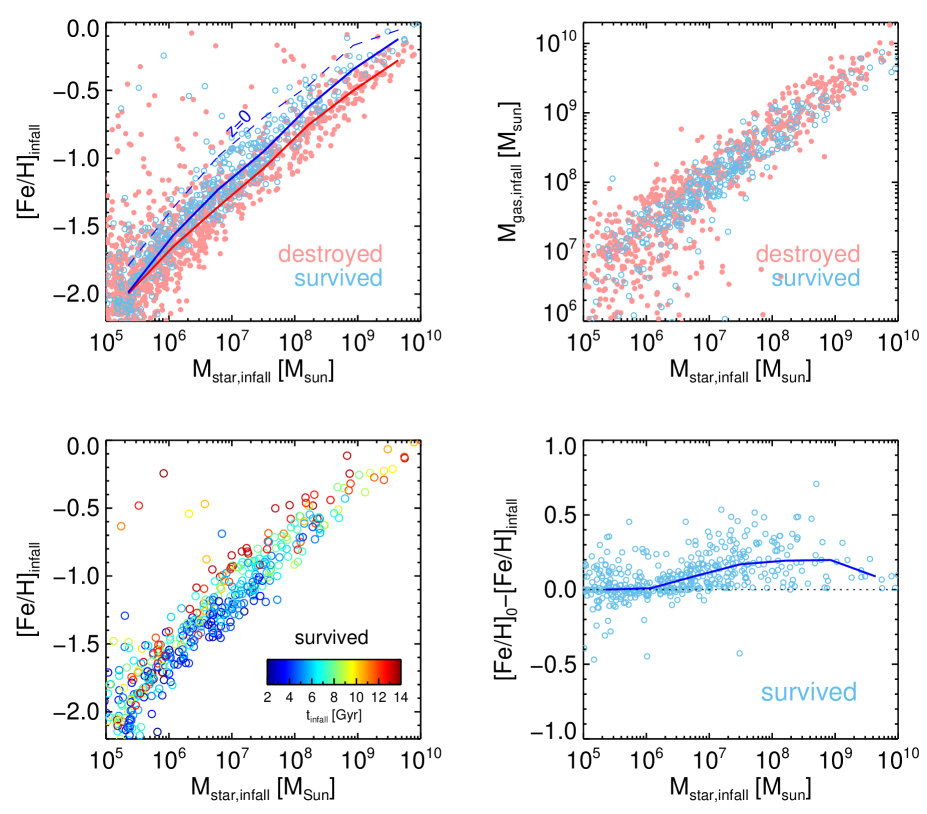
The different infall times of the two populations of destroyed and survived dwarfs results in interesting differences in the properties of the destroyed dwarfs that built up the stellar halo compared to the existing satellites. We examine this in Fig. 5. The top-left panel, which shows [Fe/H]777Defined as the median metallicity of star particles within . vs stellar mass at infall, indicates that surviving satellites have higher metallicities at infall, compared to their destroyed counterparts of similar . This is particularly evident at higher masses ([Fe/H]dex at ). This trend can be understood by considering the difference in the infall times of the two populations and the evolution of the stellar mass-metallicity relation with time. We see this in the bottom-left panel, where we show only satellites and colour code them according to infall times. Higher mass satellites fell in, on average, later and formed their stars over a longer a span of time from pre-enriched gas, than lower mass satellites. Thus, the later infall times of more massive satellite dwarfs leads them to have more metal-rich stellar populations than their destroyed dwarf counterparts, which have typical infall times of Gyr after the big bang (Fig. 3).
The dashed line in the top left panel shows the z=0 average stellar mass-[Fe/H] relation for surviving satellites. The difference compared to the relation prior to infall is twofold. The combination of stellar mass loss (moving left in this panel) and the increase of [Fe/H] after infall (see below) enhances the offset between the pre-infall stellar mass-metallicity relation and that of present day satellites.
All accreted dwarfs, but in particular the more massive ones, have a significant amount of gas before infall, as shown in Fig. 5; it is therefore not surprising that some dwarfs keep forming stars after infall. The bottom-right panel of Fig. 5 shows that the average metallicity of high mass satellites () has increased after infall by roughly 0.2 dex. This is due to their large gas (HI) reservoir, combined with their ability to keep their cold gas for longer after infall and form more stars. Simpson et al. (2018) presented a thorough analysis of star formation after infall for Auriga satellites, and show that higher mass dwarfs are more resilient to losing their gas due to ram pressure stripping and keep forming stars after infall. At the low mass end, the galaxies do not form many stars after infall, and a larger fraction of them are gas poor even before infall. These results are consistent with the environmental effects on star formation associated with infall as observed in dwarf galaxies in the Local Group and nearby galaxies (Geha et al., 2012; Slater & Bell, 2014; Fillingham et al., 2016).
The decrease in the metallicities of a number of low mass dwarfs after infall, seen in the bottom right panel of Fig. 5, is likely due to insufficient numerical resolution combined with tidal stripping. These galaxies have a small number of star particles (less than at ) and the loss of just a few particles due to tidal stripping can change the metallicity noticeably. A comparison with higher resolution Auriga simulations is provided in the Appendix.
Just as satellites, destroyed dwarfs would also have formed stars after infall and before they were fully destroyed, and deposited stars into the stellar halo. We find that these stars (i.e. formed after infall of their progenitor) constitute only percent of the mass of the accreted component, where the uncertainty is the rms scatter amongst Auriga haloes.
The previous results, mainly the evolution of mass-metallicity relation with time, imply that galactic stellar haloes, which are built up from destroyed dwarfs, are predicted to have a different metallicity content than existing satellites.
4 Build-up of the accreted stellar halo
In this section, we explore how the destroyed dwarf population builds up the accreted stellar halo of MW-mass galaxies. We extend the results of Monachesi et al. (2019) by focusing on the radial trends in the assembly of Auriga stellar haloes, as well as the metallicity and dark matter contribution of the destroyed dwarfs. We consider all accreted star particles inside . We find that, on average, percent of these stars end up in the inner 5 kpc (roughly the bulge region), and percent in the disc region ( kpc and kpc).
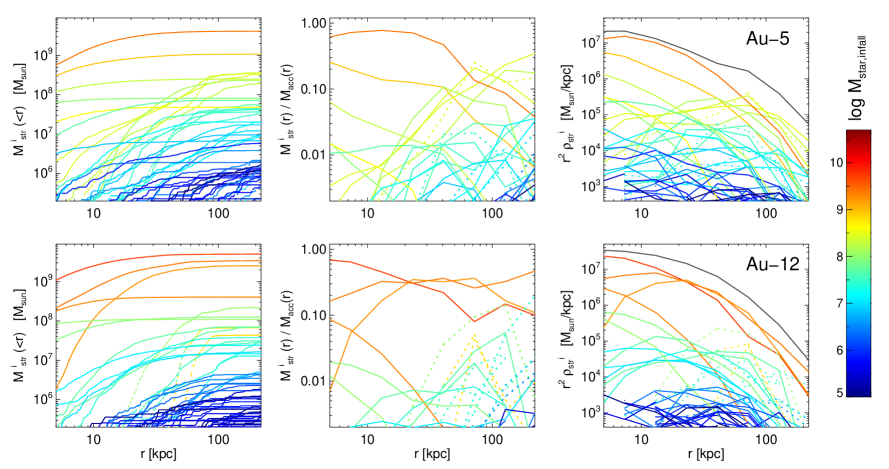
Fig. 6 shows the stellar mass contribution, as a function of radius, from all progenitors () of the accreted stellar mass for two example Auriga galaxies (top and bottom rows). Each solid curve corresponds to an individual destroyed dwarf galaxy; the dashed curves indicate debris from existing satellites. The lines are all colour-coded by the progenitors’ stellar mass at infall. The enclosed mass profiles (left panels) indicate that more massive dwarf galaxies contribute most to the total mass of the stellar halo within . Moreover, only a few massive dwarf galaxies make up most of the accreted stars, and the mass contribution from numerous low mass dwarfs is very small (see also, Cooper et al., 2010; Monachesi et al., 2019). However, the middle panels of Fig. 6 show that the previous statement does not hold at all radii, and that there is a notable radial dependence. These general trends are seen in all of the Auriga haloes (see Fig. 7). The right panels of Fig. 6 show the density profile (i.e. ) of individual progenitors and confirm the conclusions of the previous panels. The two examples in Fig. 6 are representative of cases where a single dwarf galaxy dominates the build-up of the stellar halo (top row), and where multiple massive dwarf galaxies form most of the halo mass (bottom row).
Both examples in Fig. 6 show that the most massive dwarfs typically deposit most of their stars in the inner regions ( kpc) and their contribution drops in the outer parts, while lower mass dwarf galaxies deposit their stellar mass further out and their contribution only becomes notable at kpc. This behaviour is mainly due to dynamical friction, which is stronger for more massive objects and causes their orbits to sink to the centre of the haloes on a relatively short timescale. Therefore, more massive objects are tidally stripped and deposit their debris mainly in the inner regions. On the other hand, the orbits of lower mass objects are less affected by dynamical friction, but they are more susceptible to tidal disruption and their debris is deposited along their orbits at relatively larger radii.
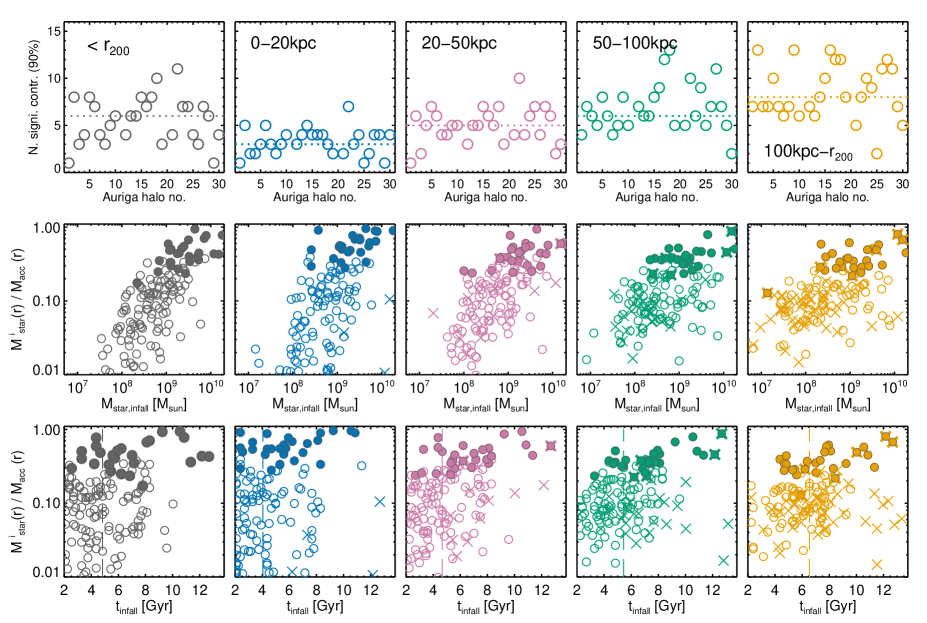
Fig. 7 summarises the previous results, but now extended to the whole Auriga sample. The top row shows the number of significant contributors to the stellar halo at various radii, defined as the top-ranked contributors which formed 90 percent of the accreted stellar mass in the given radial range. It is clear that the number of significant progenitors increases with radius in all haloes; the inner regions (kpc) are built, on average, from dwarf galaxies, while the outer regions (kpc) have 8 significant progenitors. The median number of significant contributors within (leftmost panel) is , as also shown by Monachesi et al. (2019). The result within is mainly dominated by the properties of the inner regions, as the stellar halo density decreases with radius, so most of the mass is in the inner regions.
Do all significant progenitors contribute equally to the stellar halo, and what are they properties? We address these questions in the middle and bottom rows of Fig. 7. Here, we show the top 5 progenitors of the given radial range for all halos, which are defined as those that have contributed the most stellar mass to the given radial range. As implied earlier, these typically build up 90 percent of the inner stellar halo888At radii larger than 50 kpc, one could show contributors which make up 90 percent of the halo; however, for clarity, we keep only the top 5 contributors.. Circles represent material originating in destroyed dwarf galaxies and the crosses indicate debris from existing (surviving) dwarfs. The contribution from this latter population is fairly minimal, but becomes more important at larger radii (see below).
The middle row of Fig. 7 shows the stellar mass at infall of the top 5 progenitors as a function of how much they contribute to the accreted stellar mass in the given radial bin (). These panels confirm our conclusions from the example haloes shown in Fig. 6: the inner regions (kpc) are strongly dominated by very few relatively massive dwarf galaxies. Filled circles highlight the top (main) contributor to each radial bin for all Auriga galaxies, and they indicate that in most Auriga haloes only one dwarf galaxy is enough to make up more than 50 percent of the accreted stellar mass in the inner regions. Moreover, there is a steep correlation between the stellar mass of the progenitor dwarf and how much they contribute to the halo, such that the mass contribution from dwarf galaxies less massive than is negligible ( percent).
The outer parts of the halo (kpc) behave differently to the inner regions. In most cases, there is no single progenitor that makes up more than half of the halo and the contribution from various progenitors becomes comparable. It is only in the outermost radial bin (kpc) that the contribution from dwarfs is non-negligible. Additionally, we can see that the debris from surviving dwarfs (crosses) can significantly contribute to the outer parts. On average percent of the mass in the kpc– radial range is made up of such debris. The uncertainty range corresponds to the rms scatter. In comparison, the debris fraction is negligible in the inner parts ( percent). It is worth mentioning that only a small fraction of the total accreted mass is in the outer regions, and the large fraction of satellite debris in the outskirts does not necessarily mean the majority of this debris mass is in the outer parts.
The bottom row of Fig. 7 is similar to the middle row but shows the infall time of the top 5 progenitors in each radial range. We can clearly see the inside out formation of the stellar halo in these panels: the top 5 progenitors of the inner regions typically fell in before Gyr, while infall times move towards the present as one considers larger radii. The median infall time of these top 5 progenitors, shown by the vertical lines, changes from Gyr () in the inner 20 kpc to Gyr () in the outer 100 kpc. Considering only the main contributor (filled circles) the infall times move closer to the present time. Additionally, the radial trend is less clear when one considers only the main contributor. This is because the main progenitors are more massive dwarfs (as can be seen from the middle row), and their mass is relatively dominant at all radii. Moreover, dynamical friction affects their orbits significantly and causes them to sink to the middle regardless of their infall time; hence the existence of late infall (Gyr) main progenitors in the innermost bin.
The diversity in the assembly of the stellar haloes is apparent in the left panels of Fig. 7; while some haloes are built up primarily by one or two dwarf galaxies, some require 8-10 dwarfs to account for 90 percent of their mass. Moreover, the contribution from the top progenitor of each halo (filled circles in the middle and bottom rows) can vary between 20 and almost 100 percent. These top progenitors span almost two orders of magnitude in mass at infall, and have a large range of infall times. It is therefore not surprising that observations of nearby MW-mass galaxies, e.g. the GHOST survey, Dragonfly, and PAndAS, show a variety of properties in their stellar haloes (Merritt et al., 2016; Monachesi et al., 2016a; Harmsen et al., 2017; McConnachie et al., 2009). These results are consistent with studies using other simulations (Cooper et al., 2010; Deason et al., 2016; D’Souza & Bell, 2018), and reconfirms the results from Monachesi et al. (2019) that used the Auriga simulations. The inside-out formation of the stellar halo and the radial trends shown in Fig. 7 have significant implications about the metallicity built-up of the stellar halo, which we discuss in Sec. 4.2.
4.1 Implications for accreted dark matter
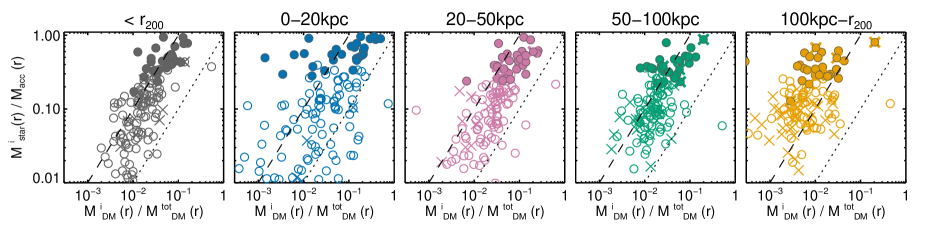
The dwarf galaxies that build up the stellar halo, also contribute to the dark matter halo of the galaxy. Due to the non-linear stellar mass-halo mass relation and to differences in tidal stripping, the dark matter dark matter contribution of these dwarf galaxies is expected to be different from their stellar contribution. For the top 5 contributors to the accreted stellar halo (Fig. 7), Fig. 8 shows their dark matter mass contribution at various radii (). This is calculated by flagging dark matter particles that were bound to the dwarf galaxy progenitors at infall, and, after disruption of the dwarf galaxy, are now (at ) bound to the host.
Generally, the dark matter contribution of individual dwarfs is significantly lower, by almost an order of magnitude, compared to their stellar contribution. These results can be understood by considering that, (i) a considerable fraction of the dark matter mass is built up by smooth accretion and the disruption of dark subhaloes (Fakhouri & Ma, 2010; Genel et al., 2010); and, (ii) the steep stellar-halo mass relation at low masses (Simpson et al., 2018; Moster et al., 2013; Behroozi et al., 2013) implies that dwarf galaxies over a large range of stellar mass contribute similarly to the dark matter. Moreover, the results have a larger scatter at each radial bin which is due to the difference in the tidal stripping of dark matter and stars from an accreted dwarf; stars are embedded deeply in the gravitational well of galaxies and are resilient to tides, as opposed to extended dark matter haloes which get stripped first in the outer parts of the halo. In other words, most of the stars from massive dwarfs are deposited in the inner regions while their dark matter is extended throughout the halo. The results from this section explain why the phase-space distribution of accreted stars is not directly linked to that of the total DM at a given Galactocentric distance, as pointed out by Bozorgnia et al. (2019).
4.2 Metallicity of the stellar halo
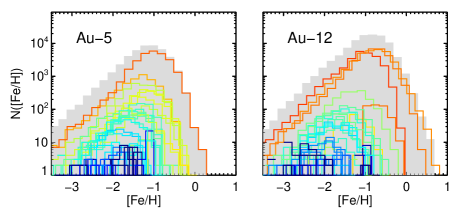
Lastly, we examine the metallicity contribution of various destroyed dwarf galaxies to the stellar halo. For the results presented in this work, the [Fe/H] values of stars have been shifted by roughly dex so that the median metallicity in the disc matches that measured from SDSS in the solar neighbourhood (see Fattahi et al., 2019, for more details). Fig. 9 illustrates, for two example haloes (the same ones as in Fig. 6), the [Fe/H] distribution of accreted stars in a spherical shell of kpc of the halo. The filled histogram in each panel shows the total distribution, while individual curves correspond to various accreted (and destroyed) dwarf galaxies, colour-coded by their stellar mass at infall. These examples demonstrate that the overall distribution is dominated by the most massive dwarfs, particularly at higher metallicities. As the mass of dwarf galaxies decreases, the peak of their [Fe/H] distribution moves towards lower values, a reflection of the stellar mass-metallicity relation. However, the lower mass dwarfs never dominate the overall distribution, even at metallicities as low as [Fe/H] (see also, Deason et al., 2016).
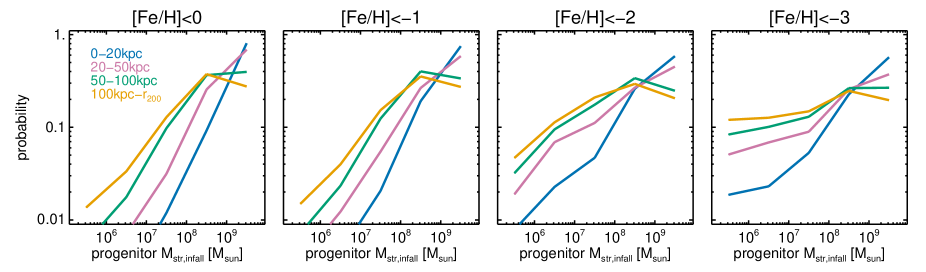
We illustrate this quantitatively in Fig. 10, where we extend the results to all Auriga haloes and various radial ranges. Each panel shows the probability (mass fraction) that accreted stars with [Fe/H] lower than a certain value, given in the legend, originate from progenitors of various stellar masses. Each panel presents results for four radial ranges. As expected, the higher metallicity bin ([Fe/H]<0) is dominated by massive dwarf galaxies of , at all radii. Interestingly, dwarf galaxies below a stellar mass only contribute a small fraction, even to the lowest metallicity bin ([Fe/H]); in particular in the innermost regions which are the most accessible to observations, less than 10 percent of stars originate from the lower mass dwarfs. These results have important implications for studies of metal poor stars in the halo, which are often assumed to come from the lowest mass dwarfs (Frebel & Norris, 2015).
5 Limitations
In the simulations the contribution of dwarf galaxies to the stellar halo depends on the stellar mass-halo mass (SMHM) relation, and this in turn depends on the subgrid model, which can differ in different simulations. The SMHM relation in the Auriga simulations tends to be systematically higher than the relation inferred from abundance matching, in the mass range of bright dwarf galaxies, (Simpson et al., 2018). We note, however, that abundance matching relations have a large scatter in the dwarf galaxies regime (see, e.g., Moster et al., 2018; Behroozi et al., 2019). The over estimation of stellar mass affects the total stellar halo masses but not the systematic trends we found or the relative differences between surviving and destroyed satellites. We therefore expect that our overall conclusions are not strongly dependent on the particular subgrid model of the Auriga simulations but it would be desirable to check our results with other simulations of comparable resolution and sample size.
Other limitations that demand caution concern the lowest metallicity stars. The Auriga simulations do not resolve ultra-faint dwarf galaxies and their contribution to the metal-poor end of the stellar halo metallicity is thus unknown. We anticipate that their contribution will be small, since their stellar mass is orders of magnitude smaller than that of the main progenitor of the halo, in particular in the inner halo. A final point to consider is that the Auriga galaxy formation models do not include the formation of first (Population-3) stars, which might affect the shape of the metallicity distribution at the most metal-poor end.
6 Summary and conclusions
We have used the Auriga CDM magneto-hydrodynamics simulations of 28 MW-mass haloes to study the dwarf galaxies that were accreted onto Galactic haloes after ( Gyr). We have considered the population of dwarfs that were destroyed and formed the accreted stellar halo and contrasted their properties with those of the dwarfs that survived to and constitute the satellite population. The summary of our conclusions is as follows:
-
•
The luminosity function of the total accreted population (destroyed + surviving) is similar in all Auriga haloes, with little halo-to-halo variation (dex scatter around the mean). This reflects the predictable average assembly history of haloes of a given mass in CDM (e.g. Fakhouri et al., 2010).
-
•
The number of destroyed dwarf galaxies is greater than the number of surviving satellites at all stellar masses. Averaged over all haloes, percent of accreted dwarfs with infall stellar mass, , survive to . This does not necessarily imply that the ex-situ stellar mass of the halo is larger than the combined mass of the surviving satellites since a significant fraction of destroyed dwarf debris is deposited in the disc and the very central regions of the haloes.
-
•
The fraction of surviving dwarf galaxies is strongly dependent on infall time as well as on the mass at infall. Roughly 90 percent of the dwarfs that were accreted later than Gyr (present day corresponds to Gyr) survive to the present; this fraction drops to only 15 percent for dwarfs that were accreted early (Gyr). The survival fraction also depends on the mass at infall, such that both high mass and low mass dwarfs are destroyed more efficiently while accreted dwarfs of are the most resilient.
-
•
The average infall time of surviving satellites is Gyr, with a dependence on the mass at infall. For satellites of and , the typical infall times are Gyr and Gyr respectively. In contrast, destroyed dwarfs have an average infall time, and Gyr, for and , respectively.
-
•
Due to the slight evolution of the stellar mass-metallicity relation with time, the later infall of surviving satellites results in their metallicity ([Fe/H]) at infall being higher than that of their destroyed counterparts of similar stellar mass. This difference is 0.2 dex at stellar mass . The higher mass satellites continue forming stars after infall, causing their [Fe/H] to increase further by dex to the present.
In the second part of the paper, we focused on the material deposited in the main galaxy by destroyed (and disrupted) dwarfs and on the assembly of their accreted stellar haloes. These results are complementary to those of Monachesi et al. (2019). We have extended the results of that work by examining progenitors of the accreted stellar halo as a function of radius. We also studied additional properties such as the dark matter and metallicity contributions of the destroyed dwarfs.
We identified all stars that formed later than (Gyr) in progenitors that are not the main progenitor of the central galaxy, but are bound to it at . Our results concerning this accreted component are:
-
•
In agreement with Monachesi et al. (2019), we find that the total accreted mass of the stellar halo within is brought in by a few relatively massive dwarf galaxies. However, we show that the number varies as a function of galactocentric radius (. The innermost regions, kpc, have typically significant dwarf progenitors which make up 90 percent of the mass; this number changes to and for kpc and kpc respectively.
-
•
In the inner 20 kpc, the contribution of individual dwarfs drops rapidly with the mass of the dwarf, such that more than 50 percent of the mass typically comes from a single massive galaxy (). In the outer regions, the contribution from various progenitors is comparable. The recent discovery of the Gaia-sausage-Enceladus component (Helmi et al., 2018; Belokurov et al., 2018) is consistent with our findings. Indeed, this merger is thought to dominate the mass of the inner Galactic stellar halo.
-
•
The contribution of debris from existing satellites is significant in the outer regions of the stellar haloes. On average, percent of the ex-situ mass in the kpc shell is made up of such stars. This fraction is much smaller, , in the inner kpc region.
-
•
The significant contributions of more massive dwarf galaxies to the galactic stellar haloes have important implications for the metallicity content of the halo. Unsurprisingly, the more massive destroyed dwarfs are the main origin of high metallicity ([Fe/H]) stars. However, we find that even at the more metal-poor tail of the distribution stars originating in low mass dwarf galaxies never dominate. In the inner kpc, stars more metal poor than [Fe/H] have less than 10 percent chance, on average, of having been deposited by dwarf galaxies of mass less than .
-
•
We show that the accreted stellar haloes are formed inside out; i.e. the top progenitors of the inner stellar haloes have median infall time of Gyr after the Big Bang, whereas the top progenitors of the outer 100 kpc fell in on average at Gyr.
-
•
We show that the build-up of the stellar halo is significantly different from that of the dark matter. The dark matter contribution from the stellar halo progenitors is typically an order of magnitude lower than their stellar contribution inside . This result is a consequence of the steep stellar mass-halo mass relation at the low mass end, and the fact that a significant fraction of dark matter halo mass is built up from dark subhaloes and smooth accretion. The radial differences are due to differences in the tidal stripping of dark matter and stars from accreted dwarf galaxies.
Our findings regarding both surviving satellites and destroyed dwarf galaxies indicate that the observed satellites at the present day are not the building blocks of the stellar halo. The building blocks of the stellar halo are a biased population of dwarf galaxies which fell in relatively early, and differ from the observed satellites in particular in their metallicity content. The metallicity of the stellar halo (which is formed from the destroyed dwarfs) is predicted to be lower than that of the existing satellites, which is consistent with observations of MW and Andromeda (Vargas et al., 2014; Escala et al., 2020; Kirby et al., 2020).
While the observed number of satellites is dominated by low mass dwarfs, low mass dwarf galaxies contribute negligibly to the mass of the inner stellar halo, even at low metallicities. This implies that the kinematic properties of the metal poor stars are biased and differ from what is expected from the accretion of numerous dwarf galaxies with a variety of orbital parameters. This will be the subject of future work.
Acknowledgements
We are thankful to the anonymous referee for their helpful feedback. AF is supported by an Marie-Curie COFUND/Durham Junior Research Fellowship (under EU grant agreement no. 609412), and AD by a Royal Society University Research Fellowship. AD, AF and CSF are also supported by the Science and Technology Facilities Council (STFC) [grant numbers ST/F001166/1, ST/I00162X/1,ST/P000541/1]. CSF is also supported by ERC Advanced Investigator grant, DMIDAS [GA 786910]. FM acknowledges support through the Program ‘Rita Levi Montalcini’ of the Italian MIUR. AM acknowledges financial support from CONICYT FONDECYT Regular 1181797. FAG acknowledges financial support from CONICYT through the project FONDECYT Regular Nr. 1181264. FAG and AM acknowledge funding from the Max Planck Society through a Partner Group grant.
This work used the DiRAC Data Centric system at Durham University, operated by the ICC on behalf of the STFC DiRAC HPC Facility (www.dirac.ac.uk). This equipment was funded by BIS National E-infrastructure capital grant ST/K00042X/1, STFC capital grant ST/H008519/1, and STFC DiRAC Operations grant ST/K003267/1 and Durham University. DiRAC is part of the National E-Infrastructure.
Data Availability
The data presented in figures will be shared on reasonable request to the corresponding author. Raw simulation data can be shared on reasonable request to the Auriga team (Grand et al., 2017).
References
- Amorisco (2017) Amorisco N. C., 2017, MNRAS, 464, 2882
- Behroozi et al. (2013) Behroozi P. S., Marchesini D., Wechsler R. H., Muzzin A., Papovich C., Stefanon M., 2013, ApJ, 777, L10
- Behroozi et al. (2019) Behroozi P., Wechsler R. H., Hearin A. P., Conroy C., 2019, MNRAS, 488, 3143
- Belokurov et al. (2006) Belokurov V., et al., 2006, ApJ, 642, L137
- Belokurov et al. (2018) Belokurov V., Erkal D., Evans N. W., Koposov S. E., Deason A. J., 2018, MNRAS, 478, 611
- Bignone et al. (2019) Bignone L. A., Helmi A., Tissera P. B., 2019, ApJ, 883, L5
- Bose et al. (2019) Bose S., et al., 2019, MNRAS, 486, 4790
- Bozorgnia et al. (2019) Bozorgnia N., Fattahi A., Cerdeño D. G., Frenk C. S., Gómez F. A., Grand R. J. J., Marinacci F., Pakmor R., 2019, J. Cosmology Astropart. Phys., 2019, 045
- Bullock & Johnston (2005) Bullock J. S., Johnston K. V., 2005, ApJ, 635, 931
- Chua et al. (2017) Chua K. T. E., Pillepich A., Rodriguez-Gomez V., Vogelsberger M., Bird S., Hernquist L., 2017, MNRAS, 472, 4343
- Cooper et al. (2010) Cooper A. P., et al., 2010, MNRAS, 406, 744
- Cooper et al. (2015) Cooper A. P., Parry O. H., Lowing B., Cole S., Frenk C., 2015, MNRAS, 454, 3185
- Crain et al. (2015) Crain R. A., et al., 2015, MNRAS, 450, 1937
- D’Souza & Bell (2018) D’Souza R., Bell E. F., 2018, MNRAS, 474, 5300
- Davis et al. (1985) Davis M., Efstathiou G., Frenk C. S., White S. D. M., 1985, ApJ, 292, 371
- Deason et al. (2015) Deason A. J., Belokurov V., Weisz D. R., 2015, MNRAS, 448, L77
- Deason et al. (2016) Deason A. J., Mao Y.-Y., Wechsler R. H., 2016, ApJ, 821, 5
- Digby et al. (2019) Digby R., et al., 2019, MNRAS, 485, 5423
- Eggen et al. (1962) Eggen O. J., Lynden-Bell D., Sandage A. R., 1962, ApJ, 136, 748
- Elias et al. (2020) Elias L. M., Sales L. V., Helmi A., Hernquist L., 2020, MNRAS, 495, 29
- Errani & Peñarrubia (2020) Errani R., Peñarrubia J., 2020, MNRAS, 491, 4591
- Escala et al. (2020) Escala I., Gilbert K. M., Kirby E. N., Wojno J., Cunningham E. C., Guhathakurta P., 2020, ApJ, 889, 177
- Evans (2020) Evans N. W., 2020, arXiv e-prints, p. arXiv:2002.05740
- Fakhouri & Ma (2010) Fakhouri O., Ma C.-P., 2010, MNRAS, 401, 2245
- Fakhouri et al. (2010) Fakhouri O., Ma C.-P., Boylan-Kolchin M., 2010, MNRAS, 406, 2267
- Fattahi et al. (2016) Fattahi A., et al., 2016, MNRAS, 457, 844
- Fattahi et al. (2019) Fattahi A., et al., 2019, MNRAS, 484, 4471
- Fillingham et al. (2016) Fillingham S. P., Cooper M. C., Pace A. B., Boylan-Kolchin M., Bullock J. S., Garrison-Kimmel S., Wheeler C., 2016, MNRAS, 463, 1916
- Fiorentino et al. (2017) Fiorentino G., et al., 2017, A&A, 599, A125
- Font et al. (2006) Font A. S., Johnston K. V., Bullock J. S., Robertson B. E., 2006, ApJ, 638, 585
- Font et al. (2011) Font A. S., McCarthy I. G., Crain R. A., Theuns T., Schaye J., Wiersma R. P. C., Dalla Vecchia C., 2011, MNRAS, 416, 2802
- Frebel & Norris (2015) Frebel A., Norris J. E., 2015, ARA&A, 53, 631
- Frebel et al. (2010) Frebel A., Kirby E. N., Simon J. D., 2010, Nature, 464, 72
- Frenk et al. (1996) Frenk C. S., Evrard A. E., White S. D. M., Summers F. J., 1996, ApJ, 472, 460
- Gaia Collaboration (2016) Gaia Collaboration 2016, A&A, 595, A2
- Gaia Collaboration (2018) Gaia Collaboration 2018, A&A, 616, A1
- Gargiulo et al. (2019) Gargiulo I. D., et al., 2019, MNRAS, 489, 5742
- Garrison-Kimmel et al. (2018) Garrison-Kimmel S., et al., 2018, arXiv e-prints,
- Geha et al. (2012) Geha M., Blanton M. R., Yan R., Tinker J. L., 2012, ApJ, 757, 85
- Genel et al. (2010) Genel S., Bouché N., Naab T., Sternberg A., Genzel R., 2010, ApJ, 719, 229
- Gilmore & Wyse (1998) Gilmore G., Wyse R. F. G., 1998, AJ, 116, 748
- Gómez et al. (2017) Gómez F. A., et al., 2017, MNRAS, 472, 3722
- Grand et al. (2017) Grand R. J. J., et al., 2017, MNRAS, 467, 179
- Guo & White (2008) Guo Q., White S. D. M., 2008, MNRAS, 384, 2
- Harmsen et al. (2017) Harmsen B., Monachesi A., Bell E. F., de Jong R. S., Bailin J., Radburn-Smith D. J., Holwerda B. W., 2017, MNRAS, 466, 1491
- Haywood et al. (2018) Haywood M., Di Matteo P., Lehnert M. D., Snaith O., Khoperskov S., Gómez A., 2018, ApJ, 863, 113
- Helmi et al. (1999) Helmi A., White S. D. M., de Zeeuw P. T., Zhao H., 1999, Nature, 402, 53
- Helmi et al. (2006) Helmi A., et al., 2006, ApJ, 651, L121
- Helmi et al. (2018) Helmi A., Babusiaux C., Koppelman H. H., Massari D., Veljanoski J., Brown A. G. A., 2018, Nature, 563, 85
- Jenkins (2013) Jenkins A., 2013, MNRAS, 434, 2094
- Jiang et al. (2015) Jiang L., Cole S., Sawala T., Frenk C. S., 2015, MNRAS, 448, 1674
- Kirby et al. (2008) Kirby E. N., Simon J. D., Geha M., Guhathakurta P., Frebel A., 2008, ApJ, 685, L43
- Kirby et al. (2020) Kirby E. N., Gilbert K. M., Escala I., Wojno J., Guhathakurta P., Majewski S. R., Beaton R. L., 2020, AJ, 159, 46
- Ludlow et al. (2013) Ludlow A. D., et al., 2013, MNRAS, 432, 1103
- Mackereth et al. (2019) Mackereth J. T., et al., 2019, MNRAS, 482, 3426
- Majewski et al. (2003) Majewski S. R., Skrutskie M. F., Weinberg M. D., Ostheimer J. C., 2003, ApJ, 599, 1082
- Marinacci et al. (2014) Marinacci F., Pakmor R., Springel V., 2014, MNRAS, 437, 1750
- McConnachie et al. (2009) McConnachie et al. 2009, Nature, 461, 66
- Merritt et al. (2016) Merritt A., van Dokkum P., Abraham R., Zhang J., 2016, ApJ, 830, 62
- Monachesi et al. (2016a) Monachesi A., Bell E. F., Radburn-Smith D. J., Bailin J., de Jong R. S., Holwerda B., Streich D., Silverstein G., 2016a, MNRAS, 457, 1419
- Monachesi et al. (2016b) Monachesi A., Gómez F. A., Grand R. J. J., Kauffmann G., Marinacci F., Pakmor R., Springel V., Frenk C. S., 2016b, MNRAS, 459, L46
- Monachesi et al. (2019) Monachesi A., et al., 2019, MNRAS, 485, 2589
- Moster et al. (2013) Moster B. P., Naab T., White S. D. M., 2013, MNRAS, 428, 3121
- Moster et al. (2018) Moster B. P., Naab T., White S. D. M., 2018, MNRAS, 477, 1822
- Myeong et al. (2018) Myeong G. C., Evans N. W., Belokurov V., Sand ers J. L., Koposov S. E., 2018, ApJ, 863, L28
- Newberg et al. (2002) Newberg H. J., et al., 2002, ApJ, 569, 245
- Pillepich et al. (2015) Pillepich A., Madau P., Mayer L., 2015, ApJ, 799, 184
- Pillepich et al. (2018) Pillepich A., et al., 2018, MNRAS, 475, 648
- Planck Collaboration (2015) Planck Collaboration 2015, preprint, (arXiv:1502.01589)
- Purcell et al. (2007) Purcell C. W., Bullock J. S., Zentner A. R., 2007, ApJ, 666, 20
- Read et al. (2006) Read J. I., Pontzen A. P., Viel M., 2006, MNRAS, 371, 885
- Robertson et al. (2005) Robertson B., Bullock J. S., Font A. S., Johnston K. V., Hernquist L., 2005, ApJ, 632, 872
- Sales et al. (2007) Sales L. V., Navarro J. F., Abadi M. G., Steinmetz M., 2007, MNRAS, 379, 1464
- Sawala et al. (2016) Sawala T., et al., 2016, MNRAS, 457, 1931
- Schaye et al. (2015) Schaye J., et al., 2015, MNRAS, 446, 521
- Simpson et al. (2018) Simpson C. M., Grand R. J. J., Gómez F. A., Marinacci F., Pakmor R., Springel V., Campbell D. J. R., Frenk C. S., 2018, MNRAS, 478, 548
- Slater & Bell (2014) Slater C. T., Bell E. F., 2014, ApJ, 792, 141
- Springel (2005) Springel V., 2005, MNRAS, 364, 1105
- Springel (2011) Springel V., 2011, arXiv e-prints, p. arXiv:1109.2218
- Starkenburg et al. (2013) Starkenburg E., et al., 2013, A&A, 549, A88
- Tissera et al. (2012) Tissera P. B., White S. D. M., Scannapieco C., 2012, MNRAS, 420, 255
- Tolstoy et al. (2003) Tolstoy E., Venn K. A., Shetrone M., Primas F., Hill V., Kaufer A., Szeifert T., 2003, AJ, 125, 707
- Tolstoy et al. (2009) Tolstoy E., Hill V., Tosi M., 2009, ARA&A, 47, 371
- Vargas et al. (2014) Vargas L. C., Geha M. C., Tollerud E. J., 2014, ApJ, 790, 73
- Venn et al. (2004) Venn K. A., Irwin M., Shetrone M. D., Tout C. A., Hill V., Tolstoy E., 2004, AJ, 128, 1177
- Weinberger et al. (2019) Weinberger R., Springel V., Pakmor R., 2019, arXiv e-prints, p. arXiv:1909.04667
- Wetzel et al. (2016) Wetzel A. R., Hopkins P. F., Kim J.-h., Faucher-Giguère C.-A., Kereš D., Quataert E., 2016, ApJ, 827, L23
- Zolotov et al. (2009) Zolotov A., Willman B., Brooks A. M., Governato F., Brook C. B., Hogg D. W., Quinn T., Stinson G., 2009, ApJ, 702, 1058
- van den Bosch & Ogiya (2018) van den Bosch F. C., Ogiya G., 2018, MNRAS, 475, 4066
Appendix A Convergence
We quantify the degree of convergence between the L4 and L3 Auriga simulations in Figs. 11, 12, and 13 which are the equivalent of Figs. 1, 3, and 4 in the main text. Fig. 14 is equivalent to the bottom-right panel of Fig. 5. All these convergence plots include only the 6 haloes that were simulated at both resolutions.
The luminosity function of the total accreted population (right panel of Fig. 11) shows excellent convergence between the two resolution simulations. However, we note that percent of dwarfs have moved from the destroyed population to the surviving one.
The definition of “destroyed” in the L3 simulations presented here is the same as in the L4 resolution simulation: a halo mass less than or a stellar mass, . We tried relaxing this definition to include any accreted dwarf that was completely destroyed by , and the result did not change in any meaningful way. We note that dwarf galaxies form in relatively massive, well-resolved haloes ( haloes or particles in L4), not in haloes at the resolution limit.
As implied in Fig. 11, dwarf galaxies in the higher resolution runs have a percent higher chance of surviving. This is independent of stellar mass, and indicates that the downturn in the surviving fraction at lower masses is not a resolution effect.