Segmentation of carotid vessel wall using U-Net and segmentation average network
Abstract
Segmentation of carotid vessel wall is required in vessel wall volume (VWV) and local vessel-wall-plus-plaque thickness (VWT) quantification of the carotid artery. Manual segmentation of the vessel wall is time-consuming and prone to interobserver variability. In this paper, we proposed a convolutional neural network to segment the common carotid artery (CCA) from 3D carotid ultrasound images. The proposed CNN involves three U-Nets that segmented the 3D ultrasound (3DUS) images in the axial, lateral and frontal orientations. The segmentation maps generated by three U-Nets were consolidated by a novel segmentation average network (SAN) we proposed in this paper. The experimental results show that the proposed CNN improved the segmentation accuracies. Compared to only using U-Net alone, the proposed CNN improved the Dice similarity coefficient (DSC) for vessel wall segmentation from to , the sensitivity from to , and the area under receiver operator characteristic curve (AUC) from 0.89 to 0.94.
1 Introduction
Stroke is the second global leading cause of death [1]. Atherosclerosis is a major cause of ischemic stroke. Fortunately, for patients with high stroke risk, lifestyle, dietary and medical therapies reduce the occurrence of stroke by [2]. With the advances in the pathogenesis of atherosclerosis, new therapeutic targets and corresponding treatments are expected to be developed. In parallel to the development of new treatment strategies, there is a critical need for sensitive biomarkers that are able to detect treatment effects in clinical trials.
Ainsworth et al. [3] reported that 3D Carotid Ultrasound (3DUS) Total Plaque volume (TPV) is a sensitive way to measure effects of atorvastatin on atherosclerosis. Krasinski et at. [4] reported that carotid 3DUS vessel wall volume (VWV) is a biomarker sensitive to the effect of atorvastatin therapies. Cheng et al. [2] showed that carotid vessel-wall-plus-plaque thickness (VWT) measured from 3DUS is sensitive to B-Vitamin treatments, which are expected to confer a smaller beneficial effect than medical therapies, such as statins. Segmentation of vessel wall is required in VWV and VWT quantification of the carotid artery. However, manual segmentation of vessel wall is time-consuming and prone to interobserver variability. Therefore, there is a need for efficient and automatic methods for segmenting the carotid vessel wall, bounded by the media-adventitia (MAB) and lumen-intima (LIB).
Deep-learning segmentation models, such as U-Net [5, 6, 7, 8, 9], have achieved high performance in biomedical image segmentation. In particular, Zhou et al. [10] have used U-Net to segment axial slices of 3DUS images. The method required a human observer to identify a number of points lying on the MAB, from which an initial MAB was generated. At each point on the initial MAB, image patches were generated by sliding a window along the normal of the initial MAB. These image patches were then fed to a dynamic convolutional neural network (CNN) to obtain the final MAB contour. The common carotid artery (CCA) images were then cropped based on the segmented MAB contour, from which the LIB contours were segmented using the U-Net. This method requires 13.2s for a human observer to initialize the MAB. Considering 25 slices are typically needed for a clinical study [11], the time required from a human observer is high in a clinical trial involving hundreds of patients, such as the risk stratification study in [12, 13]. The goal of this study was to develop a fully automatic vessel wall segmentation method. Since 3DUS images were reconstructed from contiguous 2D axial images acquired by the ultrasound machine [14] and the in-plane resolution is higher than the elevational resolution, carotid segmentation is typically performed on the axial images either manually [11] or semi-automatically [10, 15]. In addition to segmenting the axial plane, we propose in this paper to segment the carotid arteries on two perpendicular longitudinal views, which we call lateral and frontal views. The segmentation results obtained on these three perpendicular planes were consolidated by a CNN proposed in this paper, which we call segmentation average network (SAN). In this work, we aim at validating the hypothesis that this approach provides more accurate segmentation results than U-Net.
2 Method
2.1 Image preprocessing
The proposed algorithm was evaluated on 3DUS images of the CCA acquired for 22 subjects with diabetic nephropathy. The subjects were recruited from the Nephrology Clinics and Diabetes Clinics at the London Health Science Centre (London, Canada), and they provided written informed consent to the study protocol approved by a local research ethics board [2]. High-resolution 3DUS images were obtained by translating an ultrasound tranducer (L12-5, Philips, Bothel, WA, USA) mounted on a mechanical assembly along the neck of the subjects for approximately 4 cm. The 2D ultrasound frames from the ultrasound machine (ATL HDI 5000, Philips, Bothel, WA, USA) were captured by a frame grabber and reconstructed into a 3D image.
For the implementation of segmentation networks, we resize all the axial, lateral and frontal images into , and , respectively, then we prepared three separate training sets , and , consisting of the axial, lateral and frontal slices, respectively. The number of slices used for training and testing for , and are shown in Table 1.
Training 5428 5917 7305 Testing 1387 1602 2169
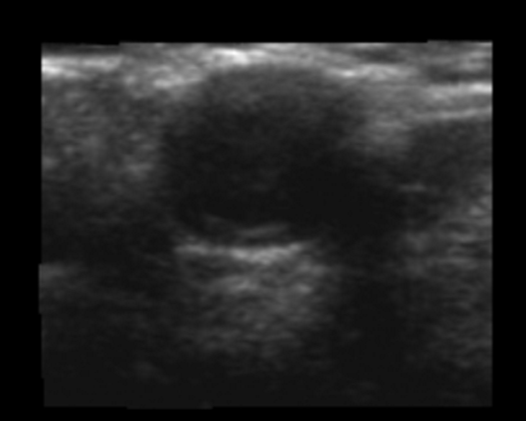
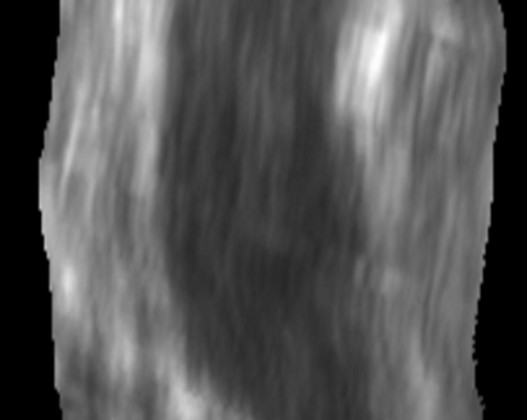
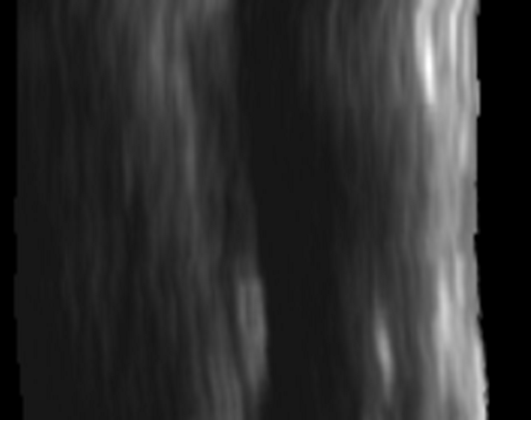
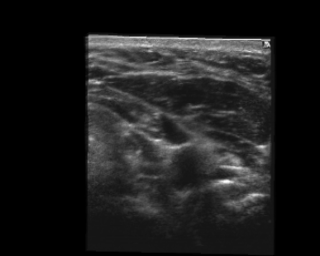
Fig 1 shows example axial, lateral and frontal slices for the common carotid artery of a subject. The resliced images were rescaled to as follows:
where and denotes the minimal and maximal pixel values of an image , respectively.
2.2 Network architecture and training
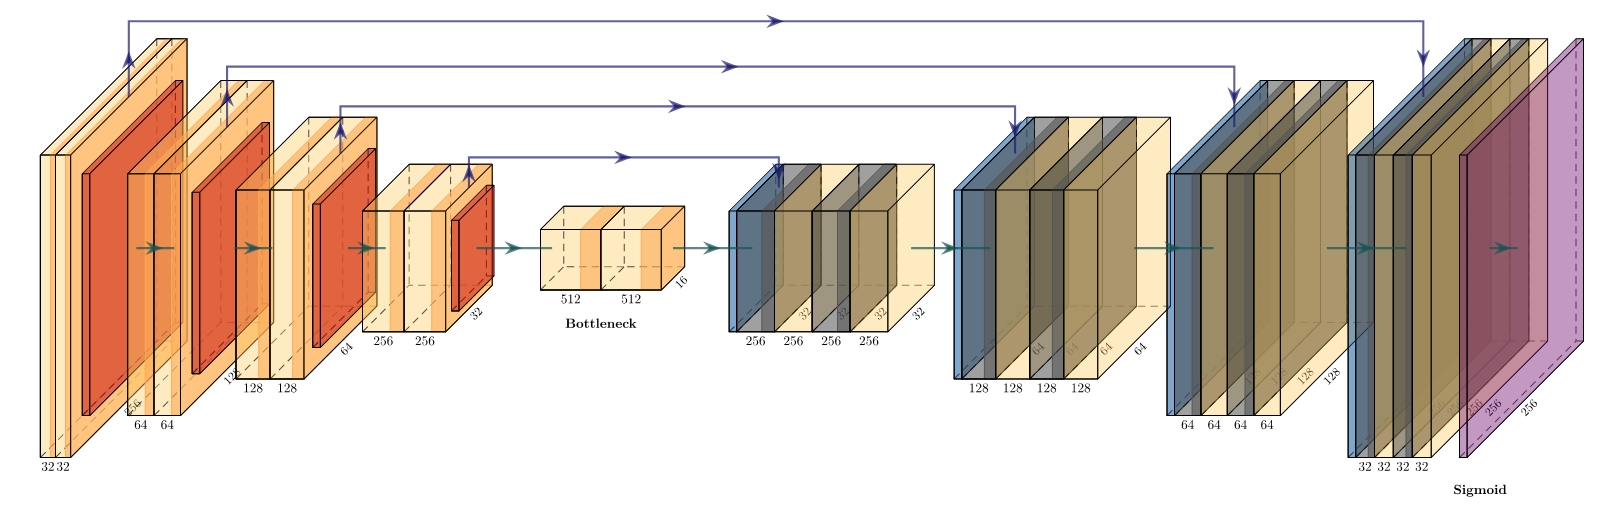
Our segmentation model is based on U-Net [5] and batch normalization [16], which is added between convolution and activation function. Fig 2 shows the U-Net architecture used in this study.
The stochastic optimization tool Adam [17] was used to train our networks and the related hyperparameters setting are given as follows: , , , , batch size , number of epochs .
The loss function in training is based on DSC and mean-squared difference between the algorithm and manually segmented results:
where is the number of pixels; , refer to the segmentation label generated by the algorithm and manual segmentation, respectively.
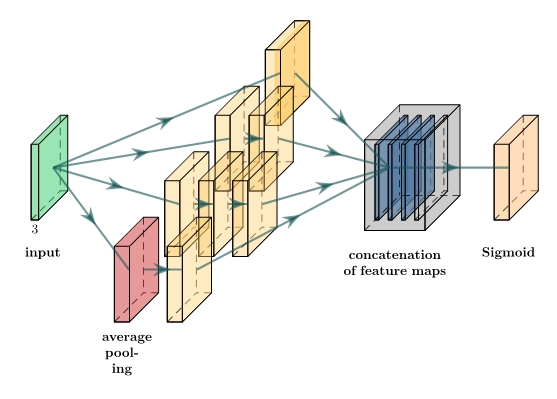
We built three U-Net models trained with , and separately, and we call these models , and . After we trained these models, we built a small CNN, segmentation average network (SAN), to average the segmentation results of , and . The architecture of SAN is based on an inception block [18] shown in Fig 3, where yellow block denotes convolution layer and red block represents average pooling.
2.3 Inference
Fig 4 shows how we combined the segmentation results generated by , and . First, we resliced a 3DUS image into axial, lateral and frontal slices, respectively. Then we input axial slices into and input lateral and frontal slices into and . Finally, we resliced the binary segmentation volume generated by and so that the resliced binary maps have the same orientation as that generated by . Three different binary segmentation maps in the axial orientation were available after the reslicing operations. These three maps were fed to SAN to obtain the final segmentation map for each axial image.
3 Experimental results
We used Python 3.7 as programming language, and employed the deep learning framework Keras [19] with TensorFlow [20] as a backend. We trained our CNN models with an NVIDIA RTX2080 Ti GPU. The training and segmentation time is shown in Table 2.
model Total training time segmentation time (per slice) U-Net (axial) U-Net (lateral) U-Net (frontal) SAN
We quantified segmentation performance of our method by DSC, sensitivity and Intersection-Over-Union (IoU) defined below: , , .
model DSC Sensitivity IoU U-Net U-NetSAN


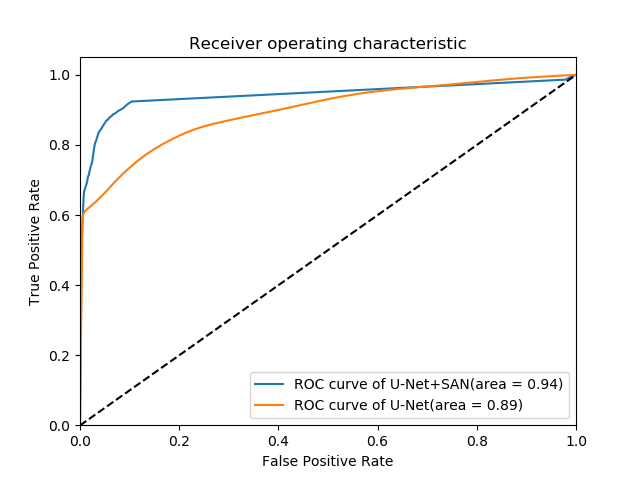
Since the sigmoid function was used as the activation function in the output layer, each pixel value of the output is between 0 and 1. We varied the threshold between 0 and 1 to compute the true positive rate and the false positive rate, and generated the receiver operating characteristic (ROC) curves of U-Net and U-Net+SAN, which are shown in Fig 6. The area-under-curve (AUC) of U-NetSAN (0.94) is higher than the AUC of U-Net (0.89).
4 Discussion and Conclusion
In this paper, we used three U-Nets to segment the axial, lateral and frontal slices of 3DUS CCA images and proposed a very small CNN, which we call SAN, to consolidate the segmentation results. This method can incorporate the information of the slices of three directions of 3D images amd provide higher segmentation accuracy than solely using U-Net in the axial images.
The most substantial advantage of our fully automatic method as compared against semi-automatic segmentation method is that no human interaction time is needed. Compared to Zhou et al. [10] and Ukwatta et al. [21], which requires 10s for a user to initialize contours on an axial slice, the proposed fully automated method is more suitable for clinical trials that involves evaluation of hundreds of patients [12, 13]. Although the DSC we reported in this study is around compared to over in Zhou et al. [10] and Ukwatta et al. [21], we would emphasize that the DSC is quantified for the vessel wall here (i.e., the region between the LIB and MAB contours), whereas the DSC is quantified separately for the LIB and MAB contours in Zhou et al and Ukwatta et al.. The two results are not comparable as DSC penalizes contours with smaller area more heavily. Given the same distance error between a larger and a smaller object (such as the distance error synthetically generated by rigid translating the gold standard boundary for a fixed distance), DSC is higher for the larger object as the area overlap (expressed as the percentage of the entire region covered by either the algorithm or manual segmentation) is higher for the larger object. When evaluated separately for MAB and LIB, the DSC attained by our algorithm is also over . Another advantage of the proposed method is that we segmented the vessel wall directly, which guarantees that the lumen lies completely inside the MAB. There is no such guarantee for methods segmenting MAB and LIB separately, such as Zhou et al. and Ukwatta et al. However, a limitation of the proposed algorithm is that it does not guarantee a closed vessel wall (e.g., Fig. 6). The next version of our algorithm will guarantee closed vessel walls.
Acknowledgement
Dr. Chiu is grateful for funding support from the Research Grant Council of the HKSAR, China (Project nos. CityU 11205917, CityU 11203218) and the City University of Hong Kong Strategic Research Grants (nos. 7004617, 7005226).
References
- [1] World Health Organization et al. Global health estimates 2016: Deaths by cause, age, sex, by country and by region, 2000-2016. geneva: 2018, 2019.
- [2] Jieyu Cheng, Eranga Ukwatta, Shadi Shavakh, Tommy WS Chow, Grace Parraga, J David Spence, and Bernard Chiu. Sensitive three-dimensional ultrasound assessment of carotid atherosclerosis by weighted average of local vessel wall and plaque thickness change. Medical physics, 44(10):5280–5292, 2017.
- [3] Craig D Ainsworth, Christopher C Blake, Arturo Tamayo, Vadim Beletsky, Aaron Fenster, and J David Spence. 3d ultrasound measurement of change in carotid plaque volume: a tool for rapid evaluation of new therapies. Stroke, 36(9):1904–1909, 2005.
- [4] Adam Krasinski, Bernard Chiu, J David Spence, Aaron Fenster, and Grace Parraga. Three-dimensional ultrasound quantification of intensive statin treatment of carotid atherosclerosis. Ultrasound in medicine & biology, 35(11):1763–1772, 2009.
- [5] Olaf Ronneberger, Philipp Fischer, and Thomas Brox. U-net: Convolutional networks for biomedical image segmentation. In International Conference on Medical image computing and computer-assisted intervention, pages 234–241. Springer, 2015.
- [6] Hao Dong, Guang Yang, Fangde Liu, Yuanhan Mo, and Yike Guo. Automatic brain tumor detection and segmentation using u-net based fully convolutional networks. In annual conference on medical image understanding and analysis, pages 506–517. Springer, 2017.
- [7] Ozan Oktay, Jo Schlemper, Loic Le Folgoc, Matthew Lee, Mattias Heinrich, Kazunari Misawa, Kensaku Mori, Steven McDonagh, Nils Y Hammerla, Bernhard Kainz, et al. Attention u-net: Learning where to look for the pancreas. arXiv preprint arXiv:1804.03999, 2018.
- [8] Zongwei Zhou, Md Mahfuzur Rahman Siddiquee, Nima Tajbakhsh, and Jianming Liang. Unet++: A nested u-net architecture for medical image segmentation. In Deep Learning in Medical Image Analysis and Multimodal Learning for Clinical Decision Support, pages 3–11. Springer, 2018.
- [9] Simon Kohl, Bernardino Romera-Paredes, Clemens Meyer, Jeffrey De Fauw, Joseph R Ledsam, Klaus Maier-Hein, SM Ali Eslami, Danilo Jimenez Rezende, and Olaf Ronneberger. A probabilistic u-net for segmentation of ambiguous images. In Advances in Neural Information Processing Systems, pages 6965–6975, 2018.
- [10] Ran Zhou, Aaron Fenster, Yujiao Xia, J David Spence, and Mingyue Ding. Deep learning-based carotid media-adventitia and lumen-intima boundary segmentation from three-dimensional ultrasound images. Medical physics, 2019.
- [11] Micaela Egger, J David Spence, Aaron Fenster, and Grace Parraga. Validation of 3d ultrasound vessel wall volume: an imaging phenotype of carotid atherosclerosis. Ultrasound in medicine & biology, 33(6):905–914, 2007.
- [12] Thapat Wannarong, Grace Parraga, Daniel Buchanan, Aaron Fenster, Andrew A House, Daniel G Hackam, and J David Spence. Progression of carotid plaque volume predicts cardiovascular events. Stroke, 44(7):1859–1865, 2013.
- [13] Arna van Engelen, Thapat Wannarong, Grace Parraga, Wiro J Niessen, Aaron Fenster, J David Spence, and Marleen de Bruijne. Three-dimensional carotid ultrasound plaque texture predicts vascular events. Stroke, 45(9):2695–2701, 2014.
- [14] Aaron Fenster and Donal B Downey. 3-d ultrasound imaging: A review. IEEE Engineering in Medicine and Biology magazine, 15(6):41–51, 1996.
- [15] E Ukwatta, J Awad, AD Ward, A Krasinski, and A Fenster. Sci—fri am: Imaging—07: Semi-automated segmentation of carotid artery lumen and wall from three-dimensional ultrasound images using level sets. Medical Physics, 37(7Part3):3903–3903, 2010.
- [16] Sergey Ioffe and Christian Szegedy. Batch normalization: Accelerating deep network training by reducing internal covariate shift. arXiv preprint arXiv:1502.03167, 2015.
- [17] Diederik P Kingma and Jimmy Ba. Adam: A method for stochastic optimization. arXiv preprint arXiv:1412.6980, 2014.
- [18] Christian Szegedy, Wei Liu, Yangqing Jia, Pierre Sermanet, Scott Reed, Dragomir Anguelov, Dumitru Erhan, Vincent Vanhoucke, and Andrew Rabinovich. Going deeper with convolutions. In Proceedings of the IEEE conference on computer vision and pattern recognition, pages 1–9, 2015.
- [19] François Chollet et al. Keras. https://github.com/fchollet/keras, 2015.
- [20] Martín Abadi, Ashish Agarwal, Paul Barham, Eugene Brevdo, Zhifeng Chen, Craig Citro, Greg S. Corrado, Andy Davis, Jeffrey Dean, Matthieu Devin, Sanjay Ghemawat, Ian Goodfellow, Andrew Harp, Geoffrey Irving, Michael Isard, Yangqing Jia, Rafal Jozefowicz, Lukasz Kaiser, Manjunath Kudlur, Josh Levenberg, Dandelion Mané, Rajat Monga, Sherry Moore, Derek Murray, Chris Olah, Mike Schuster, Jonathon Shlens, Benoit Steiner, Ilya Sutskever, Kunal Talwar, Paul Tucker, Vincent Vanhoucke, Vijay Vasudevan, Fernanda Viégas, Oriol Vinyals, Pete Warden, Martin Wattenberg, Martin Wicke, Yuan Yu, and Xiaoqiang Zheng. TensorFlow: Large-scale machine learning on heterogeneous systems, 2015. Software available from tensorflow.org.
- [21] E Ukwatta, J Yuan, D Buchanan, B Chiu, J Awad, W Qiu, G Parraga, and A Fenster. Three-dimensional segmentation of three-dimensional ultrasound carotid atherosclerosis using sparse field level sets. Medical physics, 40(5):052903, 2013.