Effects of bonded and non-bonded B/N codoping of graphene on its stability,interaction energy, electronic structure, and power factor
Abstract
We model boron and nitrogen doped/codoped monolayer graphene to study its stability, interaction energy, electronic and thermal properties using density functional theory. It is found that a doped graphene sheet with non-bonded B or N atoms induces an attractive interaction and thus opens up the bandgap. Consequently, the power factor is enhanced. Additionally, bonded B or N atoms in doped graphene generate a repulsive interaction leading to a diminished bandgap, and thus a decreased power factor. We emphasis that enhancement of the power factor is not very sensitive to the concentration of the boron and nitrogen atoms, but it is more sensitive to the positions of the B or N atoms in ortho, meta, and para positions of the hexagonal structure of graphene. In the B and N codoped graphene, the non-bonded dopant atoms have a weak attractive interaction and interaction leading to a small bandgap, while bonded doping atoms cause a strong attractive interaction and a large bandgap. As a result, the power factor of the graphene with non-bonded doping atoms is reduced while it is enhanced for graphene with bonded doping atoms.
keywords:
Energy harvesting , Thermal transport , Graphene , Density Functional Theory , Electronic structure1 Introduction
The 2D graphene structure consisting of carbon atoms arranged in a honeycomb structure with an sp2 hybridization has been of interest for future nanotechnology [1], and it is the most promising material for implementing the next generation of electronic devices [2]. Fascinating properties of graphene such as ballistic transport at room temperature, high mobility, high electronic conductivity, quantum Hall effect, electrically controllable spin transportand [3, 4], and mechanical strength make graphene a potential candidate for an enormous breadth of applications [5, 6] in electronic [7], optical [8, 9, 10, 11], and thermoelectric [12, 13] devices.
Pristine graphene itself is usually not considered a good thermoelectric material for application of thermal energy conversion because it has a small Seebeck coefficient or power factor, and a high conductivity due to the vanishing gap, facilitating opposite and canceling contributions of electrons and holes. This behavior leads to a very weak thermoelectric figure of merit which in turn produces a very limited performance or efficiency of pristine graphene [14]. Consequently, it affects the application of graphene based materials for super capacitors, batteries, and fuel cells.
Scientists have been looking for semiconducting bandgap behavior in graphene systems which would be important for thermal devices. It can be obtained by the means of opening up a bandgap that could lead to efficient devices [15, 16]. An appropriate nanostructuring and bandgap engineering of graphene can increase the Seebeck coefficient or the power factor and decrease to an extreme degree the lattice thermal conductance without dramatically reducing the electronic conductance. Basically, the opening of a bandgap in graphene is achieved by a symmetry breaking of the hexagonal structure of graphene [17]. Therefore, several methods have been proposed to break the high symmetry of monolayer and bilayer graphene, such as strain [18, 19], magnetic field [20], oxidation [21], application of a transverse electric field [22, 23], chemical modification [24, 25], and doping processes [26, 27, 28].
In the doping process of graphene, boron (B) and nitrogen (N) atoms have been used because the sizes of these two atoms are close to the carbon (C) atom [29, 30]. This affects the bonding of the B and N with the carbon atoms. Equilibrium molecular dynamics simulations based on the Green-Kubo method have been utilized to investigate the thermal conductivity and the heat transfer of N-doped graphene showing that the thermal conductivity of N-doped graphene is less sensitive to temperature than in pure graphene [31]. Additionally, it has been shown that the N atoms at the edge of a triangle doping defect can increase the thermal conductivity of graphene nanoribbons, but with increasing N-doping concentrations the thermal conductivity decreases sharply [32]. The site-dependent effects of a substitutional N or B atom on quantum transport have been investigated and shown that Coulomb interaction drops the transmission features [33]. Furthermore, the power factor has been found to be high in various B and N codoped graphene nanostructures which makes them appropriate for energy conversion [34].
We believe that information on the effects of bonding between the B and N atoms in doped/codoped graphene on its electronic and thermal characteristics is still lacking. We thus theoretically study the electronic and thermal properties of a substitutionally B and N doped graphene using a self-consistent field approximation via the Kohn-Sham density functional theory (KS-DFT). We examine the effect of bonding and non-bonding of B and N atoms in doped graphene on its electronic and thermal properties. In Sec. 2 the structure of graphene nanosheet is briefly overviewed. In Sec. 3 the main achieved results are analyzed. In Sec. 4 the conclusions of the results is presented.
2 Model and Computational Details
A 2D graphene nanosheet in the -plane with a super-cell is modeled. First-principles calculations are utilized to study the structural stability, and the electronic structure of the system. The calculations are carried out within the framework of a DFT [35] in which the PAW potentials and the Perdew-Burke-Ernzerhof exchange and correlation (XC) functionals of the generalized gradient approximation are used [36]. In the DFT, the wavefunctions and the ground state electronic density of the crystal are calculated by a self-consistent (SCF) procedure for a coupled set of single-electron equations. The total energy of the system is calculated using the SCF Kohn-Sham equations. The DFT calculations with a plane-wave projector-augmented wave method are implemented in the Quantum Espresso (QE) package [37]. The plane wave cut-off energy is assumed to be eV and the -mesh points in the unit cell are selected to be with centered -points. We assume a fully relaxed structure when the calculated force is less than eV/Å. In addition, for calculating non self-consistently (NSCF) the density of states (DOS) we assume a mesh of -points.
3 Results
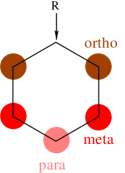
In this section, we present the main results of our calculations of pristine and doped graphene nanosheets. We focus on the effects of doping ratio and positions on the stability, interaction energy, electronic properties, and thermal properties of the system. It is well known that graphene has a hexagonal crystal structure as is schematically illustrated in Fig. 1. The carbon atoms fill up the three main positions consisting of the ortho-, the meta- and the para-positions with respect to R that is the reference point.
In the calculations, we manipulate the positions of doped atoms. We can thus determine the most stable doped graphene structure and investigate their electronic and thermal properties. The Fermi level is fixed to be at the zero energy for all the structures investigated here.
3.1 Boron- or Nitrogen-doped graphene structures
In this section, we assume only B or N atoms are substitutionally doped in graphene. For this purpose three concentration ratio of doped atoms are considered which are , , and .
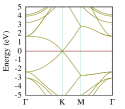
Before presenting the effects of B or N doped atoms on the physical properties of the graphene, we demonstrate the results for pristine graphene in the leftmost column of Fig. 2(a). The super-cell consisting of is shown in (a1) where the bond length of the C-C atoms is observed to be Å, and the lattice constant becomes Å, these values are in good agreement with the literature [39]. The electron density distribution is uniform for pristine graphene, with most of the electrons gathered between the C-C bonds, but rarely appearing in the center of the hexagons, as it is shown in (a2) [40, 41]. It is an indication of a strong covalent bond between the carbon atoms. At this point, the electrons are inert and cannot contribute to the transport properties. To ensure the dynamic stability, one may check the phonon dispersion that is shown in the third row of Fig. 2(a3). The positivity of the phonon dispersion of pure graphene indicates that the structure is stable [42]. The acoustic modes, for the long waves around the -points, are isotropic in the -plane as is appropriate for the symmetry of graphene [43].
| a | b | c | |
| 1 |
|
|
|
| 2 |
|
|
|
| 3 |
|
|
|
| 4 |
|
|
|
| 5 |
|
|
|
| 6 |
|
|
|
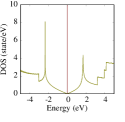
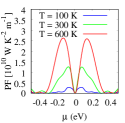
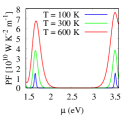
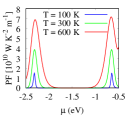
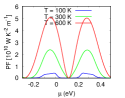
In a pristine graphene sheet, where both C atoms in the unit cell are equivalent, the and bands are degenerate at K, leading to a linear crossing of the two bands. The gap-less behavior of pristine graphene can be seen in the band structure (a4) where the Fermi level is at zero energy, and in turn, the corresponding zero value of the DOS is found in (a5). Furthermore, the power factor of the pristine graphene versus the chemical potential is presented in the sixth row of Fig. 2(a) for three different values of temperature, 100 (blue), 300 (green), and 600 K (red). The power factor is enhanced with increasing temperature since the Seebeck coefficient is directly proportional with temperature, [44]. The power factor is found to be WK-2m-1 for 600 K around the Fermi energy. The zero value of power factor at the Fermi energy is expected because the Seebeck coefficient is zero at the Fermi energy.
We start with the concentration ratio of where a single B- or N-atom is doped into a para-position of the super-cell of the graphene nanosheet shown in Fig. 2 for B-doped graphene (BG) in column b and N-doped graphene (NG) in column c. Although the B and the N atoms are expected to behave like p-type (or acceptor) and n-type (or donor) dopants, respectively, we observe a local depletion of the electron distribution around the B atom, and a local excess around the N atom, as shown in the second row of Fig. 2. These results are consistent with other calculations [45]. Although, the atomic radius decreases and the electronegativity increases in the sequence of B C N, the average bond lengths of C-B is Å which is larger than that of C-N, Å, respectively.
In the doped structure, it is important to see the most energetic stable structure. To check the energetic stability of doped graphene we need to calculate the formation energy () via
| (2) |
Herein, is the total energy of the doped graphene system, , and refer to the number and chemical potential of the carbon atoms, respectively, and and are the number and chemical potential of the doped atoms in the graphene nanosheet, respectively. From the formation energy equation, we find that the formation energy of BG is eV which is larger than that of NG, eV. The smaller formation energy, the more energetic stable the structure should be observed to be. As a result, the NG is more energetic stable than the BG system [46, 47]. We should remember that the formation energy is obtained from total energy calculations and does not take into account dynamic terms. The phonon dispersion delivers information about the dynamic stability, and the phonon dispersion of NG (see Fig. 2(c3)) demonstrates a structure less stable dynamically, when compared to pure and B-doped graphene because of a negativity in the out-of acoustic plane mode (ZA). In addition, the acoustic modes are anisotropic in the plane indicating a symmetry breaking of the two different sites by the B- and N-atoms.
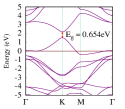
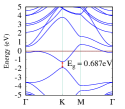
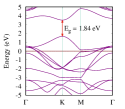
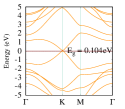
The corresponding band structures are shown in the fourth row of Fig. 2, where the valence bands cross the Fermi energy and open up the bandgap in the BG (b3) while the conduction bands cross the Fermi energy opening the bandgap in the NG (c3) with almost the same bandgap, eV. The crossing of the Fermi energy in both structures is expected because the B(N) atom has an electron less(more) than the C atom, respectively. A downward- or an upward-shift of the Fermi energy is thus seen in their band structures. These changes in the band structure are related to the symmetry breaking of the graphene structure due to the B- or N-doped atom. This can be seen from the wave functions of the and bands which are predominantly composed of atomic orbitals with an orientation perpendicular to the -plane, i.e. orbitals. It is known that the -band wave function is predominantly located at the N atom and the -band wave function at the B atom; this is because of the higher electronegativity of an N atom. Therefore, it is the strong difference in electronegativity between B or N and C atoms that leads to the band gap [48].
The upward- and downward-shift of the band structure and the opening of a bandgap lead to the zero value of the DOS around eV and eV in both the BG and NG, respectively, as is displayed in the fifth row. The crossing of valence bands in BG and conduction bands in NG increases the power factor of the system to almost times larger than that of the pristine graphene [see Fig. 2(b6)(c6)]. This enhancement refers to the increase of the Seebeck coefficient in both systems. We note that both B and N doped graphene have almost the same power factor because both structures have almost the same bandgap and the valence and conduction bands are shifted by the same amount of energy.
The mechanical characteristic of PG, BG and NG have been studied by performing uniaxial tensile simulation [42]. Results for the uniaxial stress found from DFT calculations of the PG, BG, and NG sheets along - (a) and -axis (b) are compared in Fig. 3. The elastic moduli of PG in the -direction is higher than that of -direction which is similar to elastic moduli found by Dewapriya, and et. al. [49] for PG. The linear elastic region along the - and -axis is similar for PG and NG indicating isotropic elastic response but for BG the elastic region is anisotropic character. Furthermore, the elastic moduli of PG is high in -axis, 170 GPa, and -axis, 140 GPa, comparing to BG and NG. This is attributed due to the stronger and larger binding energy of a C-C bond than a C-B or a C-N bond.
We emphasize that the position of an N- or a B-atom in the graphene structure does not influence the physical characteristics of the system in the case of a single B or N doped atom in a honeycomb structure. It means that if the N- or B-atom is substitutionally doped into the ortho or meta position, similar qualitative and quantitative results are obtained (not shown).
The doping ratio can be further increased to which leads to two atoms in the super-cell. For simplicity, we show only two B-atoms doped into the graphene structure as is shown Fig. 4 where the two B-atoms are doped into the ortho and para (a1), meta and para (b1), and ortho and meta (c1) positions.
| a (nonb-BG) | b (b-BG-1) | c (b-BG-2) | |
| 1 |
|
|
|
| 2 |
|
|
|
| 3 |
|
|
|
| 4 |
|
|

|
These three structures can be classified as the bonding and the non-bonding B-atoms, where bonding B-doped graphene means that the B atoms make bonding between themselves, but in the non-bonding B doped graphene there is no B-B bonding. For example, the two B-atoms doped at the ortho-para positions is called non-bonding B-doped graphene (nonb-BG) while the other two structures are called bonding B-doped graphene (b-BG). We identify the b-BG as b-BG-1 and b-BG-2 which refer to the two B-atoms doped at meta-para and ortho-meta position, respectively.
In general, a structure with a high doping ratio is less energetically and dynamically stable than one with a low doping concentration [50, 51]. The BG with two B-atoms is also less stable compared to the BG with one B-atom, because the formation energy of the BG with two B-atoms is larger than that of BG with one B-atom and negativity is seen in phonon dispersion in the case of two B atoms doped graphene (not shown) [51]. It shows that the two B atoms doped graphene is dynamically less stable than that of one B atom doped graphene.
In addition, we emphasize that the position of the B-doped atoms with high concentration ratio in the honeycomb structure of graphene influences its energetic and dynamic stability. For instance, the formation energy of the ortho-para BG forming nonb-BG (a1) is eV which is a slightly smaller than that of the meta-para position in b-BG-1 (a2), eV, and ortho-meta postion in b-BG-2 (a3), eV. We can thus confirm that the nonb-BG is the most energetic stable structure. Furthermore, the negativity of phonon dispersion for the nonb-BG is less than that of b-BG. We can thus say that the nonb-BG is dynamically more stable than b-BG (not shown).
The interaction energy should be taken into account in the case of nonb-BG and b-BG structures, and one can calculate the interaction energy between the doped atoms using [52]
| (3) |
where is the total energy of the pristine graphene, and and are the total energies of the BG with one atom and two B-atoms, respectively. The negative (positive) sign of the interaction energy displays that the two B-atoms attract (repel) each other, respectively [52]. The interaction energy between the two B-atoms in the nonb-BG (a1) is eV indicating an attractive interaction, while the interaction energies of the b-BG with two B-atoms (b1) and (c1) are equal to eV demonstrating the repulsive force between the two B-atoms. The repulsive interaction increases the bonding length of B-B atoms, comparing to the C-C bonding length, which is Å. The repelling of two B atoms in b-BG confirms the weaker B-B bond comparing to the B-C bond in nonb-BG. This effect can be seen in the electron charge distribution shown in the second row of Fig. 4, where the charge distribution between the covalent bond of B-B atoms is weaker than that of the C-B bond.
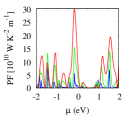
The attractive interaction between the B atoms in the nonb-BG leads to the average C-B bonding length of Å and the bandgap is thus further opened up to eV (a3). It has been shown in the literature that with increasing concentration ratio, the bandgap is also increased [53]. Our results of BG with two B-atoms confirm that not only the concentration ratio can increase the bandgap but also the position of doped atoms play a major role in the determination of the bandgap. For example, the bandgap of the b-BG-1 and b-BG-2 is eV (b3), and eV (c3), respectively. It is decreased compared to the BG with one B-atom. This is attributed to the repulsive interaction between the B-atoms. As a result, the power factor is further enhanced in the nonb-BG (a4) while it is decreased for the b-BG-1 and b-bG-2 shown in (b4) and (c4) compared to the BG with one B-atom.
We note that the same scenario of the BG with two B-atoms happens for the NG with two N-atoms except that the Fermi energy crosses the conduction band. Therefore, we do not present the results of NG with two N-atoms. In addition, our results of two bonded and non-bonded B atoms in graphene structure can be applied if the two B atoms are located at different isomer positions. It means that if the two B-atoms are located at para-para psoition, different result should be obtained.
The doping concentration ratio is now increased to , which can be realized by three B- or N-atoms doped into the honeycomb structure of graphene. For saving space, we only present the results of three B-atoms doped into the ortho-ortho-para positions (a1) forming nonb-BG , and the meta-meta-para (b1), and the ortho-meta-para positions (c1) identifying as b-BG-1 and b-BG-2, respectively, as is shown in the first row of Fig. 5.
| a (nonb-BG) | b (b-BG-1) | c (b-BG-2) | |
| 1 |
|
|
|
| 2 |
|
|
|
| 3 |
|
|
|
| 4 |
|
|
|
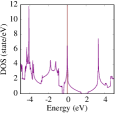
The formation energy of all three cases shown in the first row of Fig. 5 is almost the same which is equal to eV indicating a less stable energetic structure compared to the BG with one- and two B-atoms. But the formation energy of NG with three N-atoms is eV which is much smaller than that of the BG with three B-atoms. As a result, NG is much more energetic stable than BG. In addition, the negativity in the phonon dispersion is increased in BG with three B-atoms compared to BG with two B-atoms indicating a less dynamical stable structure (not shown).
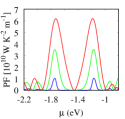
The attractive force between the B atoms in the nonb-BG is further increased leading to a larger bandgap eV as is shown in Fig. 5 (a3), while the repulsive interaction between the B-atoms in both types of b-BG closes the bandgap and causes an overlap of the valence and the conduction bands [see (b3) and (c3)]. Consequently, the power factor for the nonb-BG is still high but the overlapping energies in the b-BG generate a lot of “noise” in the power factor [see (b4) and (c4)] comparing to the nonb-BG (a4).
3.2 Boron and Nitrogen codoped graphene structures
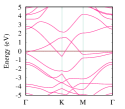
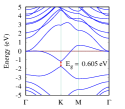
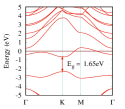
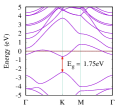
In this section we consider B- and N-codoped graphene with a configuration of two or three doped atoms in the honeycomb structure. In the case of two atoms configuration consisting of one B and one N atom, there will be three possible configurations which are: both B- and N-atoms are substitutionally doped at ortho positions (a1) showing non-bonding of B and N codoped graphene (nonb-BNG-1), ortho-para positions (b1) indicating the (nonb-BNG-2), and ortho-meta positions (c1) displaying bonded B and N codoped graphene (b-BNG), as are shown in the first row of Fig. 6. There are more configurations of the B and N atoms in the graphene structure. For example: if we exchange the position of B and N atoms in the structure shown in column (a), the physical properties should be unchanged. Furthermore, if both B and N atoms are put at meta-meta position, the physical characteristics will be similar to the ortho-ortho position structure shown in column (a). It has been shown that the nonb-BNG is an effective catalyst compared to b-BNG for an oxygen reducing reaction in batteries [54, 55]. Here, we show that this may not hold true for the application of thermal devices.
The nonb-BNG structures shown in (a1) and (b1) of Fig. 6 have almost the same formation energy, eV, while the formation energy of the b-BNG presented in (c1) is slightly lower, eV. It indicates that the b-BNG is the most energetically stable system among these structures.
In both nonb-BNG and b-BNG structures, the N atom attracts electrons and builds a high-electron region; while the B atom loses electrons and generates a low-electron region [see second row of Fig. 6]. But in the b-BNG, the lone-pair electrons from the N atom are neutralized by the vacant orbital of B atom, causing a high electron density between the B-N bond (c2). This indicates a strong and stiff covalent bond between the B and the N atoms compared to the B-C and the B-N bonds.
The phonon dispersion of all three configurations is shown in the third row. The positive value of the phonon dispersion indicates a dynamical stability of the structures. The interaction of the B and the N atoms with graphene structure results in pronounced changes in the phonon spectrum compared to pristine graphene shown in Fig. 2(a3). By introducing the BN domain in a graphene nanosheet, it was found that the electron states in graphene referring to the -electrons are sensitive for the redistribution of charge in graphene due to B and N atoms. This redistribution of electron charge breaks the local symmetry of graphene which is the main reason for the opening of a bandgap. Furthermore, the Coulomb dipole from the B and the N atoms breaks the symmetry of the graphene structure leading to the bandgap opening [26].
| a (nonb-BNG-1) | b (nonb-BNG-2) | c (b-BNG) | |
| 1 |
|
|
|
| 2 |
|
|
|
| 3 |
|
|
|
| 4 |
|
|
|
| 5 |
|
|

|
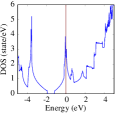
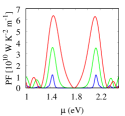
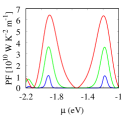
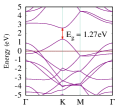
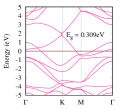
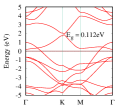
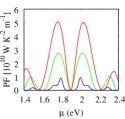
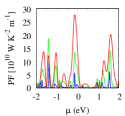
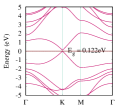
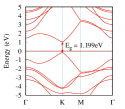
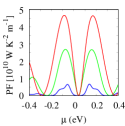
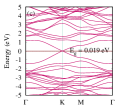
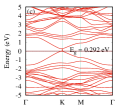
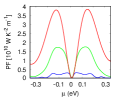
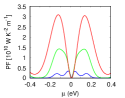
The strong attractive interaction between the B and N in the b-BNG opens up a bandgap to eV (c4) while the attractive interaction in nonb-BNG is weak leading to a small bandgap [see (a4) and (b4)]. The localized electron between the B-N bonds and the large bandgap in the b-BNG cause a weak contribution of the electrons to the transport leading to decrease in the electric conductivity and an increase in the Seebeck coefficient. As a result, the power factor for b-BNG is increased compared to the nonb-BNG structure shown in the fifth row of Fig. 6.
We notice that if the position of dopant atoms is exchanged but the bonding and non-bonding between the doped atoms are kept, the same results should be obtained. For example, exchanging the position of N and B atoms at ortho positions (a1), meta-position (b1), and ortho-meta position (c1) in Fig. 6 should not change the results of band structure and power factor.
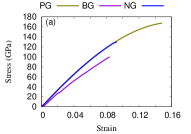
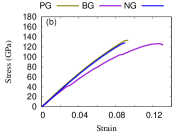
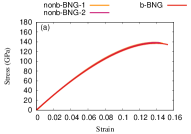
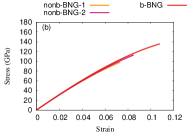
The stress-strain curves of nonb-BNG and b-BNG are shown in Fig. 7, where the stress is assumed to be along the -axis (a) and -axis (b) of the structures. The comparison of the stress-strain relations along the -axis, zigzag, and -axis, armchair, shows that the stress of the armchair sheet is larger than that of the zigzag sheet for the b-BNG (red color). Their failure strains are also different with for the zigzag, and for the armchair. This is attributed to the B-N bond in the armchair direction which is stronger than the B-C and the N-C bonds along the zigzag direction. On the other hand, in the nonb-BNG structures (orange and purple color), the zigzag sheet is stronger than the armchair sheet. In the nonb-BNG-1, the zigzag sheet has stress GPa at strain which is larger than that of the armchair sheet of GPa at strain 0.074 (orange color), while in nonb-BNG-2 the stress of zigzag sheet is larger than that of armchair sheet but with different frailer strain (purple color) [49]. We can conclude that the stress of the nonb-BNG and the b-BNG is almost the same in the zigzag sheet, while the stress of the b-BNG in armchair sheet is higher than that of the nonb-BNG.
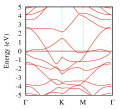
We further increase the doping ratio to in which the structures consist of a codoped graphene nanosheet with one B and two N atoms shown in Fig. 8. The configuration of doped atoms are: two N atoms at ortho-positions and a single B atom at a para-position (a1) indicating an (nonb-BNG), two N atoms at meta-positions and a single B atom at a para-position (b1) identifying as (nonb-BNG-1), and two N atoms at ortho-para positions and one B atom at a meta position (c1), showing as (b-BNG-2). The formation energy of the nonb-BNG structure is found to be eV which is smaller than that of the b-BNG, eV, demonstrating that the nonb-BNG is more energetically stable than the b-BNG. The phonon dispersion of these three structures shows that the b-BNG structures is dynamically stable but the the non-BNG structure is less stable (not shown).
| a (nonb-BNG) | b (b-BNG-1) | c (b-BNG-2) | |
| 1 |
|
|
|
| 2 |
|
|
|
| 3 |
|
|
|
| 4 |
|
|
|
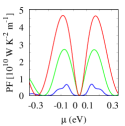
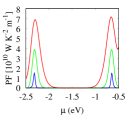
In the second row of Fig. 8, the corresponding electron density distribution of the first row are shown, where a high electron density between N-B bonds are found in the b-BNG-1 and b-BNG-2 [see (b2) and (c2)]. The “strong” attractive interaction between the B and N atoms in the b-BNG structures causes wide bandgaps which are and eV for the b-BNG with the meta-para and ortho-meta-para configurations of doped atoms shown in (b3) and (c3), respectively. But the bandgap of nonb-BNG is much smaller, eV, due to a weak attractive interaction (a3). In addition, since the number of N atoms is twice that of B atoms in the graphene sheets, the downward-shift in band structure is seen due to the predominant ratio of N atoms. Consequently, the power factor of the b-BNG is higher than that of the nonb-BNG, as is presented in the fourth row of Fig. 8.
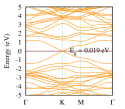
Finally, we present the case of two atoms of B and N doped in a 441 super-cell consisting of 32 atoms (see Fig. 9) with the same B and N atom configuration as presented in Fig. 6. Our aim here is to show that our previous results in a 221 super-cell can be generalized to a larger super-cell. It can be clearly seen that the band structure of all three atomic configurations are qualitatively similar to Fig. 6 except the band gap here is smaller which is due to the low concentration ratio () of doped atoms. Since the band gap of the b-BNG structure (Fig. 9(c3)) is larger than that of the nonb-BNG, we thus expect to have higher power factor in a b-BNG. The same qualitative result was obtained for 221.
| a | b | c | |
| 1 |
|
|
|
| 2 |
|
|
|
| 3 |
|
|
|
| 4 |
|
|
|
4 Conclusions
We have studied the stability, the electronic structure, and the thermal properties of the B and N doped and codoped graphene nanosheets using DFT calculations. Using the the PAW potentials and the Perdew-Burke-Ernzerhof exchange and correlation functionals of the generalized gradient approximation, one can calculate the electronic properties of the system by a SCF Kohn-Sham equation. We observe that a bandgap is opened up for the Boron- or Nitrogen-doped graphene due to the symmetry breaking of the doping atoms. As a result, the power factor representing the thermal efficiency of the system is enhanced. Increasing the doping ratio, the attractive interactions between the non-bonding atoms increase the bandgap, and the power factor is thus further enhanced. On the other hand, the repulsive interaction between bonded atoms decreases the bandgap and the power factor, likewise.
In the B and the N codoped graphene, the non-bonding of the doped atoms forms a weak attractive interaction between the atoms leading to a small bandgap, and correspondingly the power factor is decreased. But in the case of bonded B and N atoms, the attractive interaction is strong and the power factor is enhanced.
5 Acknowledgment
This work was financially supported by the University of Sulaimani and the Komar University of Science and Technology. The computations were performed on resources provided by the Division of Computational Nanoscience at the University of Sulaimani. VG acknowledges the financial support from the Research Fund of the University of Iceland, and the Icelandic Research Fund, grant no. 163082-051,
References
-
[1]
W. Ren, H.-M. Cheng, The global
growth of graphene, Nature Nanotechnology 9 (2014) 726 EP–.
URL https://doi.org/10.1038/nnano.2014.229 -
[2]
J. Kang, Y. Matsumoto, X. Li, J. Jiang, X. Xie, K. Kawamoto, M. Kenmoku, J. H.
Chu, W. Liu, J. Mao, K. Ueno, K. Banerjee,
On-chip
intercalated-graphene inductors for next-generation radio frequency
electronics, Nature Electronics 1 (1) (2018) 46–51.
doi:10.1038/s41928-017-0010-z.
URL https://doi.org/10.1038/s41928-017-0010-z -
[3]
Q. Zhang, J. Jiang, K. Chan,
Electrically
controllable spin transport in bilayer graphene with rashba spin-orbit
interaction, Physics Letters A 383 (24) (2019) 2957–2962.
doi:10.1016/j.physleta.2019.06.015.
URL http://www.sciencedirect.com/science/article/pii/S037596011930550X -
[4]
N. R. Abdullah, C.-S. Tang, A. Manolescu, V. Gudmundsson,
Spin-dependent
heat and thermoelectric currents in a rashba ring coupled to a photon
cavity, Physica E: Low-dimensional Systems and Nanostructures 95 (2018)
102–107.
doi:10.1016/j.physe.2017.09.011.
URL http://www.sciencedirect.com/science/article/pii/S1386947717311372 -
[5]
S. Syama, P. V. Mohanan,
Comprehensive application of
graphene: Emphasis on biomedical concerns, Nano-Micro Letters 11 (1) (2019)
6.
doi:10.1007/s40820-019-0237-5.
URL https://doi.org/10.1007/s40820-019-0237-5 -
[6]
D. W. Chang, H.-J. Choi, A. Filer, J.-B. Baek,
Graphene in photovoltaic
applications: organic photovoltaic cells (opvs) and dye-sensitized solar
cells (dsscs), J. Mater. Chem. A 2 (2014) 12136–12149.
doi:10.1039/C4TA01047G.
URL http://dx.doi.org/10.1039/C4TA01047G -
[7]
Y. Zhang, Y.-W. Tan, H. L. Stormer, P. Kim,
Experimental observation of the
quantum hall effect and berry’s phase in graphene, Nature 438 (7065) (2005)
201–204.
doi:10.1038/nature04235.
URL https://doi.org/10.1038/nature04235 -
[8]
P. Avouris, Graphene: Electronic and
photonic properties and devices, Nano Letters 10 (11) (2010) 4285–4294,
pMID: 20879723.
arXiv:https://doi.org/10.1021/nl102824h, doi:10.1021/nl102824h.
URL https://doi.org/10.1021/nl102824h -
[9]
N. R. Abdullah, C.-S. Tang, A. Manolescu, V. Gudmundsson,
Optical
switching of electron transport in a waveguide-qed system, Physica E:
Low-dimensional Systems and Nanostructures 84 (2016) 280–284.
doi:10.1016/j.physe.2016.06.023.
URL http://www.sciencedirect.com/science/article/pii/S1386947716306749 -
[10]
N. R. Abdullah,
Optical
control of spin-dependent thermal transport in a quantum ring, Physics
Letters A 382 (21) (2018) 1432 – 1436.
doi:https://doi.org/10.1016/j.physleta.2018.03.042.
URL http://www.sciencedirect.com/science/article/pii/S0375960118303177 -
[11]
N. R. Abdullah, V. Gudmundsson,
Single-photon
controlled thermospin transport in a resonant ring-cavity system, Physica E:
Low-dimensional Systems and Nanostructures 104 (2018) 223 – 228.
doi:https://doi.org/10.1016/j.physe.2018.07.036.
URL http://www.sciencedirect.com/science/article/pii/S1386947718301838 -
[12]
K. M. F. Shahil, A. A. Balandin,
Thermal
properties of graphene and multilayer graphene: Applications in thermal
interface materials, Solid State Communications 152 (15) (2012) 1331–1340.
URL http://www.sciencedirect.com/science/article/pii/S0038109812002402 -
[13]
N. R. Abdullah, T. Arnold, C.-S. Tang, A. Manolescu, V. Gudmundsson,
Photon-induced tunability
of the thermospin current in a rashba ring, Journal of Physics: Condensed
Matter 30 (14) (2018) 145303.
doi:10.1088/1361-648x/aab255.
URL https://doi.org/10.1088%2F1361-648x%2Faab255 -
[14]
Y. Xu, Z. Li, W. Duan,
Thermal
and thermoelectric properties of graphene, Small 10 (11) (2014) 2182–2199.
arXiv:https://onlinelibrary.wiley.com/doi/pdf/10.1002/smll.201303701,
doi:10.1002/smll.201303701.
URL https://onlinelibrary.wiley.com/doi/abs/10.1002/smll.201303701 -
[15]
M. Dvorak, W. Oswald, Z. Wu, Bandgap
opening by patterning graphene, Scientific Reports 3 (2013) 2289 EP–,
article.
URL https://doi.org/10.1038/srep02289 -
[16]
H. O. Rashid, N. R. Abdullah, V. Gudmundsson,
Silicon
on a graphene nanosheet with triangle- and dot-shape: Electronic structure,
specific heat, and thermal conductivity from first-principle calculations,
Results in Physics 15 (2019) 102625.
doi:10.1016/j.rinp.2019.102625.
URL http://www.sciencedirect.com/science/article/pii/S2211379719317140 -
[17]
S. Sahu, G. C. Rout, Band gap
opening in graphene: a short theoretical study, International Nano Letters
7 (2) (2017) 81–89.
doi:10.1007/s40089-017-0203-5.
URL https://doi.org/10.1007/s40089-017-0203-5 -
[18]
G. Gui, J. Li, J. Zhong,
Band structure
engineering of graphene by strain: First-principles calculations, Phys. Rev.
B 78 (2008) 075435.
doi:10.1103/PhysRevB.78.075435.
URL https://link.aps.org/doi/10.1103/PhysRevB.78.075435 -
[19]
M. Farjam, H. Rafii-Tabar,
Comment on “band
structure engineering of graphene by strain: First-principles
calculations”, Phys. Rev. B 80 (2009) 167401.
doi:10.1103/PhysRevB.80.167401.
URL https://link.aps.org/doi/10.1103/PhysRevB.80.167401 -
[20]
B. S. Jessen, L. Gammelgaard, M. R. Thomsen, D. M. A. Mackenzie, J. D. Thomsen,
J. M. Caridad, E. Duegaard, K. Watanabe, T. Taniguchi, T. J. Booth, T. G.
Pedersen, A.-P. Jauho, P. Bøggild,
Lithographic band structure
engineering of graphene, Nature Nanotechnology 14 (4) (2019) 340–346.
doi:10.1038/s41565-019-0376-3.
URL https://doi.org/10.1038/s41565-019-0376-3 -
[21]
A. Hussain, S. Ullah, M. A. Farhan,
Fine tuning the band-gap of
graphene by atomic and molecular doping: a density functional theory study,
RSC Adv. 6 (2016) 55990–56003.
doi:10.1039/C6RA04782C.
URL http://dx.doi.org/10.1039/C6RA04782C -
[22]
E. McCann, D. S. Abergel, V. I. Fal’ko,
Electrons
in bilayer graphene, Solid State Communications 143 (1) (2007) 110–115,
exploring graphene.
doi:10.1016/j.ssc.2007.03.054.
URL http://www.sciencedirect.com/science/article/pii/S0038109807002918 -
[23]
G. Nemnes, T. Mitran, A. Manolescu, D. Dragoman,
Electric
field effect in boron and nitrogen doped graphene bilayers, Computational
Materials Science 155 (2018) 175–179.
doi:10.1016/j.commatsci.2018.08.054.
URL http://www.sciencedirect.com/science/article/pii/S0927025618305822 -
[24]
X. Lin, Y. Xu, A. A. Hakro, T. Hasan, R. Hao, B. Zhang, H. Chen,
Ab initio optical study of
graphene on hexagonal boron nitride and fluorographene substrates, J. Mater.
Chem. C 1 (2013) 1618–1627.
doi:10.1039/C2TC00570K.
URL http://dx.doi.org/10.1039/C2TC00570K -
[25]
H. Liu, Y. Liu, D. Zhu, Chemical
doping of graphene, J. Mater. Chem. 21 (2011) 3335–3345.
doi:10.1039/C0JM02922J.
URL http://dx.doi.org/10.1039/C0JM02922J -
[26]
X. Fan, Z. Shen, A. Q. Liu, J.-L. Kuo,
Band gap opening of graphene by
doping small boron nitride domains, Nanoscale 4 (2012) 2157–2165.
doi:10.1039/C2NR11728B.
URL http://dx.doi.org/10.1039/C2NR11728B -
[27]
X.-K. Kong, C.-L. Chen, Q.-W. Chen,
Doped graphene for metal-free
catalysis, Chem. Soc. Rev. 43 (2014) 2841–2857.
doi:10.1039/C3CS60401B.
URL http://dx.doi.org/10.1039/C3CS60401B -
[28]
G. Nemnes, T. Mitran, A. Manolescu, D. Dragoman,
Electric
and thermoelectric properties of graphene bilayers with extrinsic impurities
under applied electric field, Physica B: Condensed Matter 561 (2019) 9–15.
doi:10.1016/j.physb.2019.02.044.
URL http://www.sciencedirect.com/science/article/pii/S0921452619301334 -
[29]
X. Fei, J. Neilson, Y. Li, V. Lopez, S. J. Garrett, L. Gan, H.-J. Gao, L. Gao,
Controlled synthesis of
nitrogen-doped graphene on ruthenium from azafullerene, Nano Letters 17 (5)
(2017) 2887–2894.
doi:10.1021/acs.nanolett.7b00038.
URL https://doi.org/10.1021/acs.nanolett.7b00038 -
[30]
S. Agnoli, M. Favaro, Doping
graphene with boron: a review of synthesis methods, physicochemical
characterization, and emerging applications, J. Mater. Chem. A 4 (2016)
5002–5025.
doi:10.1039/C5TA10599D.
URL http://dx.doi.org/10.1039/C5TA10599D -
[31]
E. K. Goharshadi, S. J. Mahdizadeh,
Thermal
conductivity and heat transport properties of nitrogen-doped graphene,
Journal of Molecular Graphics and Modelling 62 (2015) 74–80.
doi:10.1016/j.jmgm.2015.09.008.
URL http://www.sciencedirect.com/science/article/pii/S1093326315300516 -
[32]
B. Yang, D. Li, L. Qi, T. Li, P. Yang,
Thermal
properties of triangle nitrogen-doped graphene nanoribbons, Physics Letters
A 383 (12) (2019) 1306–1311.
doi:10.1016/j.physleta.2019.01.025.
URL http://www.sciencedirect.com/science/article/pii/S0375960119300453 -
[33]
S.-T. Pi, K.-P. Dou, C.-S. Tang, C.-C. Kaun,
Site-dependent
doping effects on quantum transport in zigzag graphene nanoribbons, Carbon
94 (2015) 196–201.
doi:10.1016/j.carbon.2015.06.069.
URL http://www.sciencedirect.com/science/article/pii/S0008622315300178 -
[34]
J. Duan, X. Wang, X. Lai, G. Li, K. Watanabe, T. Taniguchi, M. Zebarjadi, E. Y.
Andrei, High
thermoelectricpower factor in graphene/hbn devices, Proceedings of the
National Academy of Sciences 113 (50) (2016) 14272–14276.
arXiv:https://www.pnas.org/content/113/50/14272.full.pdf, doi:10.1073/pnas.1615913113.
URL https://www.pnas.org/content/113/50/14272 -
[35]
W. Kohn, L. J. Sham,
Self-consistent
equations including exchange and correlation effects, Phys. Rev. 140 (1965)
A1133–A1138.
doi:10.1103/PhysRev.140.A1133.
URL https://link.aps.org/doi/10.1103/PhysRev.140.A1133 -
[36]
J. P. Perdew, K. Burke, M. Ernzerhof,
Generalized
gradient approximation made simple, Phys. Rev. Lett. 77 (1996) 3865–3868.
doi:10.1103/PhysRevLett.77.3865.
URL https://link.aps.org/doi/10.1103/PhysRevLett.77.3865 -
[37]
P. Giannozzi, S. Baroni, N. Bonini, M. Calandra, R. Car, C. Cavazzoni,
D. Ceresoli, G. L. Chiarotti, M. Cococcioni, I. Dabo, A. D. Corso,
S. de Gironcoli, S. Fabris, G. Fratesi, R. Gebauer, U. Gerstmann,
C. Gougoussis, A. Kokalj, M. Lazzeri, L. Martin-Samos, N. Marzari, F. Mauri,
R. Mazzarello, S. Paolini, A. Pasquarello, L. Paulatto, C. Sbraccia,
S. Scandolo, G. Sclauzero, A. P. Seitsonen, A. Smogunov, P. Umari, R. M.
Wentzcovitch,
QUANTUM
ESPRESSO: a modular and open-source software project for quantum
simulations of materials, Journal of Physics: Condensed Matter 21 (39)
(2009) 395502.
doi:10.1088/0953-8984/21/39/395502.
URL https://doi.org/10.1088%2F0953-8984%2F21%2F39%2F395502 -
[38]
G. K. H. Madsen, D. J. Singh,
Boltztrap.
a code for calculating band-structure dependent quantities, Computer Physics
Communications 175 (1) (2006) 67–71.
URL http://www.sciencedirect.com/science/article/pii/S0010465506001305 -
[39]
P. Avouris, Graphene: Electronic and
photonic properties and devices, Nano Letters 10 (11) (2010) 4285–4294.
doi:10.1021/nl102824h.
URL https://doi.org/10.1021/nl102824h -
[40]
H. R. Jiang, T. S. Zhao, L. Shi, P. Tan, L. An,
First-principles study of
nitrogen-, boron-doped graphene and co-doped graphene as the potential
catalysts in nonaqueous li–o2 batteries, The Journal of Physical Chemistry
C 120 (12) (2016) 6612–6618.
arXiv:https://doi.org/10.1021/acs.jpcc.6b00136, doi:10.1021/acs.jpcc.6b00136.
URL https://doi.org/10.1021/acs.jpcc.6b00136 -
[41]
N. R. Abdullah, C.-S. Tang, A. Manolescu, V. Gudmundsson,
Competition of
static magnetic and dynamic photon forces in electronic transport through a
quantum dot, Journal of Physics: Condensed Matter 28 (37) (2016) 375301.
doi:10.1088/0953-8984/28/37/375301.
URL https://doi.org/10.1088%2F0953-8984%2F28%2F37%2F375301 -
[42]
B. Mortazavi, M. Shahrokhi, M. Raeisi, X. Zhuang, L. F. C. Pereira, T. Rabczuk,
Outstanding
strength, optical characteristics and thermal conductivity of graphene-like
bc3 and bc6n semiconductors, Carbon 149 (2019) 733 – 742.
doi:https://doi.org/10.1016/j.carbon.2019.04.084.
URL http://www.sciencedirect.com/science/article/pii/S0008622319304245 -
[43]
L. Falkovsky,
Symmetry
constraints on phonon dispersion in graphene, Physics Letters A 372 (31)
(2008) 5189 – 5192.
doi:https://doi.org/10.1016/j.physleta.2008.05.085.
URL http://www.sciencedirect.com/science/article/pii/S0375960108008761 -
[44]
H. Bark, W. Lee, H. Lee,
Correlation between seebeck
coefficients and electronic structures of nitrogen- or boron-doped reduced
graphene oxide via thermally activated carrier transport, J. Mater. Chem. A
6 (2018) 15577–15584.
doi:10.1039/C8TA03545H.
URL http://dx.doi.org/10.1039/C8TA03545H -
[45]
M. Wu, C. Cao, J. Z. Jiang,
Light
non-metallic atom (b, n, o and f)-doped graphene: a first-principles study,
Nanotechnology 21 (50) (2010) 505202.
doi:10.1088/0957-4484/21/50/505202.
URL https://doi.org/10.1088%2F0957-4484%2F21%2F50%2F505202 -
[46]
K. Reuter, M. Scheffler,
First-principles
atomistic thermodynamics for oxidation catalysis: Surface phase diagrams and
catalytically interesting regions, Phys. Rev. Lett. 90 (2003) 046103.
doi:10.1103/PhysRevLett.90.046103.
URL https://link.aps.org/doi/10.1103/PhysRevLett.90.046103 -
[47]
P. Li, R. Zhou, X. C. Zeng, The
search for the most stable structures of silicon–carbon monolayer
compounds, Nanoscale 6 (2014) 11685–11691.
doi:10.1039/C4NR03247K.
URL http://dx.doi.org/10.1039/C4NR03247K -
[48]
P. Ayala, R. Arenal, A. Loiseau, A. Rubio, T. Pichler,
The physical and
chemical properties of heteronanotubes, Rev. Mod. Phys. 82 (2010)
1843–1885.
doi:10.1103/RevModPhys.82.1843.
URL https://link.aps.org/doi/10.1103/RevModPhys.82.1843 -
[49]
M. A. N. Dewapriya, A. S. Phani, R. K. N. D. Rajapakse,
Influence of
temperature and free edges on the mechanical properties of graphene,
Modelling and Simulation in Materials Science and Engineering 21 (6) (2013)
065017.
doi:10.1088/0965-0393/21/6/065017.
URL https://doi.org/10.1088%2F0965-0393%2F21%2F6%2F065017 -
[50]
P. Rani, V. K. Jindal,
Stability and electronic
properties of isomers of b/n co-doped graphene, Applied Nanoscience 4 (8)
(2014) 989–996.
doi:10.1007/s13204-013-0280-3.
URL https://doi.org/10.1007/s13204-013-0280-3 -
[51]
S. Mann, P. Rani, R. Kumar, G. S. Dubey, V. K. Jindal,
Thermodynamic properties of pure
and doped (b, n) graphene, RSC Adv. 6 (2016) 12158–12168.
doi:10.1039/C5RA25239C.
URL http://dx.doi.org/10.1039/C5RA25239C -
[52]
T. M. Dieb, Z. Hou, K. Tsuda,
Structure prediction of boron-doped
graphene by machine learning, The Journal of Chemical Physics 148 (24)
(2018) 241716.
arXiv:https://doi.org/10.1063/1.5018065, doi:10.1063/1.5018065.
URL https://doi.org/10.1063/1.5018065 -
[53]
P. Rani, V. K. Jindal, Designing
band gap of graphene by b and n dopant atoms, RSC Adv. 3 (2013) 802–812.
doi:10.1039/C2RA22664B.
URL http://dx.doi.org/10.1039/C2RA22664B -
[54]
Y. Zhao, L. Yang, S. Chen, X. Wang, Y. Ma, Q. Wu, Y. Jiang, W. Qian, Z. Hu,
Can boron and nitrogen co-doping
improve oxygen reduction reaction activity of carbon nanotubes?, Journal of
the American Chemical Society 135 (4) (2013) 1201–1204, pMID: 23317479.
arXiv:https://doi.org/10.1021/ja310566z, doi:10.1021/ja310566z.
URL https://doi.org/10.1021/ja310566z -
[55]
Y. Shao, Z. Jiang, Q. Zhang, J. Guan,
Progress
in nonmetal-doped graphene electrocatalysts for the oxygen reduction
reaction, ChemSusChem 12 (10) (2019) 2133–2146.
arXiv:https://onlinelibrary.wiley.com/doi/pdf/10.1002/cssc.201900060,
doi:10.1002/cssc.201900060.
URL https://onlinelibrary.wiley.com/doi/abs/10.1002/cssc.201900060