The Rise of Active Galactic Nuclei in the GAlaxy Evolution and Assembly semi-analytic model.
Abstract
We present a new implementation of the GAlaxy Evolution and Assembly (gaea) semi-analytic model, that features an improved modelling of the process of cold gas accretion onto supermassive black hole (SMBHs), derived from both analytic arguments and high-resolution simulations. We consider different scenarios for the loss of angular momentum required for the available cold gas to be accreted onto the central SMBHs, and we compare different combinations of triggering mechanisms, including galaxy mergers and disc instabilities in star forming discs. We compare our predictions with the luminosity function (LF) observed for Active Galactic Nuclei (AGN) and we confirm that a non-instantaneous accretion timescale (either in the form of a low-angular momentum reservoir or as an assumed light curve evolution) is needed in order to reproduce the measured evolution of the AGN-LF and the so-called AGN-downsizing trend. Moreover, we also study the impact of AGN feedback, in the form of AGN-driven outflows, on the SF properties of model galaxies, using prescriptions derived both from empirical studies or from numerical experiments. We show that AGN-driven outflows are effective in suppressing the residual star formation rate in massive galaxies () without changing their overall assembly history. These winds also affect the SFR of lower mass galaxies, resulting in a too large fraction of passive galaxies at . Finally, we study the Eddington ratio distribution as a function of SMBH mass, showing that only objects more massive than are already in a self-regulated state as inferred from observations.
keywords:
galaxies: active - galaxies: formation - galaxies: evolution - galaxies: fundamental parameters - quasars: supermassive black holes1 Introduction
The role of Active Galactic Nuclei (AGN111In this paper we will define as AGN all sources powered by gas accretion onto SMBHs, irrespective of their luminosities. It is custom in the literature to refer to the brightest AGN (formally ) as Quasi-Stellar Objects or QSOs.) in the evolution of different galaxy populations has been at the centre of considerable debate in the last decade. An increasing consensus on a pivotal role played by AGN in galaxy evolution has been initially motivated by the existence of well defined correlations between the mass of the central super-massive black hole (SMBH) powering the AGN phenomenon and the properties (either velocity dispersion, luminosity or stellar mass ) of the spheroidal component (i.e. bulge) of the host galaxy (Magorrian et al., 1998; Häring & Rix, 2004). These relations are commonly referred to as the BH-Bulge relations. At the same time, from a theoretical point of view, AGN have been proposed as an ideal solution for a number of long standing problems in galaxy evolution. Indeed, luminous AGN can release large amounts of thermal and kinetic energy in a short time, possibly powering large scale galactic winds (Silk & Rees, 1998; Fabian, 1999) able to deplete the host galaxy from its cold gas content and abruptly stop the galaxy star formation activity (see e.g. Di Matteo et al., 2005; Monaco & Fontanot, 2005). Moreover, radio galaxies have been proposed (see e.g. Croton et al., 2006; Bower et al., 2006) as a viable solution to quench the expected large cooling flows in massive dark matter haloes (DMHs). In this case, inefficient accretion on the central SMBHs is believed to drive radio jets, that can efficiently transport the energy released in the central regions of the host galaxy to the outskirts of its parent DMH (Kaiser & Binney, 2003). One caveat with this scenario is that the predicted frequency of radio galaxies among massive galaxies and/or DMHs may be in tension with the observed fractions (see e.g. Fontanot et al., 2011).
The redshift evolution of the AGN population has been used as a constraint for theoretical models of galaxy formation (see e.g Fontanot et al., 2006; Menci et al., 2008; Hirschmann et al., 2012, 2014, among others). In particular, several authors have used the so-called “downsizing” observed in AGN luminosity functions (LFs), i.e. the evidence that the space density of luminous AGN peaks at an earlier redshift than that of fainter sources (Hasinger et al., 2005; La Franca et al., 2005), to understand the relative importance of physical mechanisms regulating the growth of SMBH via multiphase gas accretion. The BH-Bulge relation and its redshift evolution have also been long used as important constraints for the co-evolution of SMBHs and their host galaxies (Kormendy & Ho, 2013; Decarli et al., 2010) and actually also to tune the AGN feedback efficiency. In particular, from a theoretical point of view, it has been shown that different galaxy populations may follow a quite different evolution towards the relations, i.e. some of them grow their bulges faster than their central SMBHs and viceversa, depending on their individual histories (Lamastra et al., 2010; Volonteri, 2012). Moreover, recent studies have questioned the robustness of the local determination of these scaling relations both in terms of its overall shape (Graham & Scott, 2015; Fontanot et al., 2015) and normalization (Shankar et al., 2016), when additional galaxy populations and selection biases are taken into account. Moreover, recent statistical analyses favour velocity dispersion, and not stellar or bulge mass, as the leading galaxy property connected to BH mass (Shankar et al., 2019b; de Nicola et al., 2019; Marsden et al., 2020).
Another critical issue relates to the role of AGN feedback, and in particular of AGN-driven winds in regulating the star formation rates (SFRs) of host galaxies. Several observations probe the multiphase nature of the gaseous outflows and their connection with the central AGN activity (Feruglio et al., 2015; Fiore et al., 2017). The role of AGN-driven winds is complex. On the one hand they are supposed to suppress star formation by removing copious amounts of cold gas from the host galaxy (Feruglio et al., 2010), but there is also some evidence for “positive” feedback (Cresci et al., 2015), i.e. an enhancement of star formation in the regions affected by the outflow. However, both effects lead to a reduction of the cold gas available, thus to a deep connection with the overall star formation history of the host galaxy.
In order to investigate all these possible aspects of the AGN phenomenon, a detailed description of the gas accretion onto SMBHs is needed. Such a modelling should include all the different relevant phases: (a) the loss of angular momentum in the gas component - leading to gas infall towards the centre of the host galaxy, (b) the accretion of this low-J material onto the SMBH and (c) the triggering of the outflow and its feedback onto the host galaxy. The relevant physical mechanisms involve a wide range of physical scales, ranging from the Mpc/kpc scale characterizing the processes destabilising the host galaxy, to the sub-pc scales of the accretion region. Moreover, the dependence of the relevant mass/energy flows on the physical properties of the host galaxy are still highly uncertain. Inevitably, sub-grid models are still necessary in hydro-simulations to define plausible physical dependencies and explore the associated parameter space (see e.g. Hopkins et al. 2006 Barai et al. 2014, Sijacki et al. 2015, Choi et al. 2017). Semi-analytic models (SAMs) have been mostly adopted as flexible tools to probe the impact of AGN-driven winds (Fontanot et al., 2006), the origin of the downsizing trend (Hirschmann et al., 2012), the evolution of the AGN population along the BH-Bulge relation (Lamastra et al., 2010), and to explore the relation between accretion rate efficiency and the spin of the SMBH (Fanidakis et al., 2012).
In this study, we present new implementations for BH accretion in the state-of-the-art GAlaxy Evolution and Assembly (gaea) semi-analytic model. In our approach we assume that the cold gas present in galaxies must lose most of its angular momentum before reaching the sub-pc scales around the central SMBH, where it can be accreted and give rise to the AGN phenomenon and its feedback. We model separately the different timescales associated with the processes of loss and SMBH accretion as well as the physics of AGN-driven outflows. The inclusion of these timescales represents one of the main differences with the standard modelling implemented in the previous versions of the model, which assumed instantaneous accretion of the gas onto the SMBH. For each relevant physical process, we consider different options. In particular, we explore both empirically derived prescriptions and fitting formulae suggested by numerical experiments and analytic calculations.
This paper is organised as follows. In Section 2 we will describe our new modelling of SMBH accretion in gaea. The reference calibration set and a basic set of predictions will be shown in Section 3, and we will discuss the implications of our results in Section 4. Finally, we will summarise our conclusions in Section 5.
2 Semi-Analytic modelling
In this paper we will define and compare different prescriptions for BH growth in theoretical models of galaxy formation. In particular, we will implement them in the GAlaxy Evolution and Assembly (gaea) semi-analytic model (SAM). SAMs trace the evolution of galaxy populations inside DMHs by modelling the main physical mechanisms acting on the baryonic components, using physically and/or observationally motivated prescriptions. These processes include cooling and heating of baryonic gas, star formation, accretion of gas onto SMBHs and the related feedback processes. The overall architecture of these models results in a flexible tool to predict galaxy properties for large galaxy samples, and allows a fast exploration of the associated parameter space.
The gaea model represents an evolution of the model published in De Lucia & Blaizot (2007). Key improvements with respect to the original version include: (a) a detailed treatment of chemical enrichment (De Lucia et al., 2014), following explicitly the differential enrichment associated with Asymptotic Giant Branch (AGB) stars, Type II SNe and Type Ia SNe; (b) an updated modelling of stellar feedback (Hirschmann et al., 2016), featuring ejecting feedback in the form of stellar-driven outflows (inspired by results from hydrodynamic simulations), combined with a timescale of gas re-incorporation that depends on DMH mass (Henriques et al., 2013); (c) an improved modelling of disc sizes (Xie et al., 2017), that traces the evolution of angular momentum following the mass and energy exchanges among different galaxy components. In Fontanot et al. (2017b), we show that gaea is able to reproduce the evolution of the galaxy stellar mass function and cosmic star formation rate up to the highest redshifts at which measurements are available (). We will refer to the reference gaea run published in Hirschmann et al. (2016), and based on the “FIRE” feedback scheme, as H16F. H16F is also able to reproduce the gas fractions and mass metallicity relations at , but it overpredicts the activity levels of massive galaxies at low-z (Hirschmann et al., 2016), albeit correctly reproducing the fraction of passive galaxies as a function of stellar mass and hierarchy (De Lucia et al., 2019). Moreover, the predicted size-mass and angular momentum-mass relations for model galaxies (for both disc- and bulge-dominated morphologies) are in relatively good agreement with observational measurements both in the local Universe and at higher redshift (Zoldan et al., 2018, 2019). Other versions of the gaea model include a treatment of the cold gas partition in atomic and molecular hydrogen (Xie et al., 2017), and a modelling for a variable stellar initial mass function (Fontanot et al., 2017a, 2018). These two implementations will not be considered in the present study.
| H16F | f06-gaea | hq11-gaea | |
| Stellar Feedback parameters | |||
| 0.03 | 0.1 | 0.1 | |
| 0.3 | 0.13 | 0.09 | |
| 0.1 | 0.23 | 0.09 | |
| 1.0 | 0.6 | 2.7 | |
| 1.0 | 0.68 | 0.82 | |
| BH accretion parameters | |||
| — | 6. | — | |
| — | 0.09 | — | |
| — | — | 2.0 | |
| — | — | 14.5 | |
| — | 3.2 | — | |
| — | 3.0 | 1.7 | |
The model for SMBH accretion used in H16F is the same as in Croton et al. (2006) and De Lucia & Blaizot (2007) and is based on Kauffmann & Haehnelt (2000, KH00 hereafter). This implementation has known shortcomings in reproducing the space density of luminous AGN at high-redshift (Marulli et al., 2008). In this model, SMBHs growth is efficient only after mergers, where a fraction of cold gas is instantaneously accreted onto the SMBH. This fraction depends on the mass ratio () between the two merging galaxies, on the total amount of available cold gas () and on the virial velocity of the host DMH (), and it is modulated by the free parameter :
| (1) |
This accretion channel gives rise to the most luminous AGN, therefore it has been traditionally defined the QSO-mode of accretion. Radio-mode accretion of hot gas is instead modelled following Croton et al. (2006), and assumed to be proportional to the mass of the BH (), to the virial velocity and to the fraction of the hot gas in the DMH (), modulated by the free parameter :
| (2) |
It is worth stressing that the model for the growth of SMBHs implemented in H16F has been primarily calibrated against the evolution of the galaxy stellar mass function (GSMF) at . The free parameters in Eq. 1 and 2 have been chosen to reproduce the local - relation and the evolution of the massive end of the galaxy stellar mass function up to . In our reference model, the merger channel is not associated to an explicit AGN feedback on the cold gas component of the host galaxy. In this work, we do not attempt to retune the H16F run to reproduce the AGN-LF, and we just show the corresponding predictions as a reference.
In this work, we will present new implementations to describe SMBH accretion and its interaction with the host galaxy. We will mainly focus on cold gas accretion, i.e. the QSO-mode, while leaving the Radio-mode model as in Eq. 2. Our improved treatment uses a combination of empirical, numerical and analytic models, derived from observational constraints, high-resolution controlled experiments and analytic solutions to the equations governing the interplay between the multiphase gas and the accreting SMBHs. We describe the AGN phenomenon using a three step approach: (a) first, we model the -loss rate (Sec. 2.2) of cold gas in galactic discs, responsible for its accumulation at the centre of the galaxy and the creation of a gas reservoir222This gas reservoir mimics the role of the accretion disc around the SMBHs. We use the term reservoir following the same choice made in Fontanot et al. (2006) in order to stress that in our modelling we do not attempt to resolve the detailed structure of the accretion disc around the central SMBH. Moreover, we assume that the small amount of material transferred from the gaseous disc does not modify its structure. around the SMBH; (b) we then predict the actual accretion (Sec. 2.3) of cold gas from the reservoir onto the central object; (c) finally, we estimate the gas removal from the galaxy in AGN-driven outflow winds (Sec. 2.4). In addition to these processes we also consider different alternatives for the SMBH seeding (Sec. 2.1).
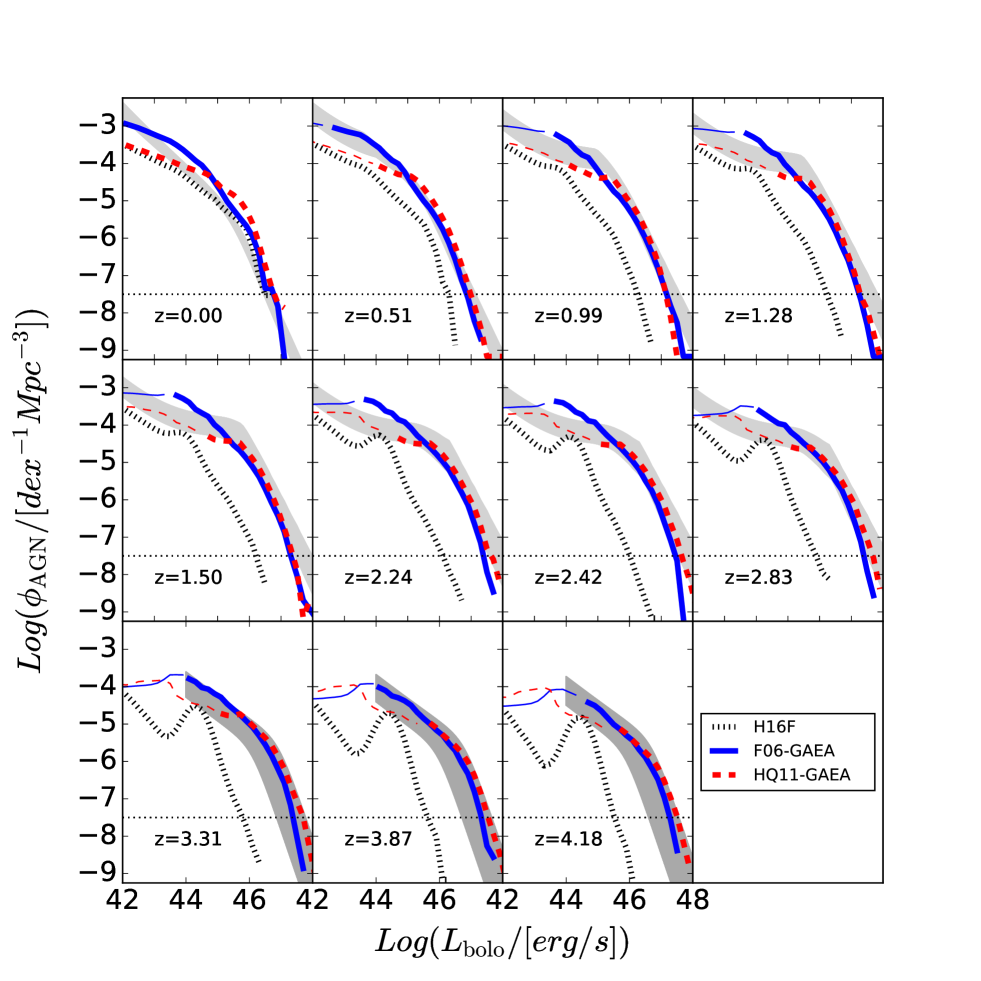
The calibration of the parameters we introduce in our new models has been performed requiring them to reproduce the evolution of the AGN-LF (Fig. 2). The inclusion of a QSO-mode feedback in gaea implies a new and additional channel for gas heating and gas ejection, and this perturbs the efficiency of stellar feedback in our model. Therefore, we perform a retuning of the stellar feedback parameters against the evolution of the GSMF. We check that this approach is sufficient for our new gaea runs to reproduce all galaxy properties we discuss in previous papers (i.e. mass-metallicity relations, quenched fractions, cold gas fractions; see Appendix A).
We will consider gaea predictions based on the merger trees extracted from the Millennium Simulation (Springel et al., 2005, MS), a numerical realization of Mpc-3 cosmological volume assuming the WMAP1 CDM concordance cosmology (i.e. , , , , , ). We do not expect the mismatch of these parameters with respect to the latest constraints (Planck Collaboration XVI, 2014) to affect our main conclusions in a significant way (see e.g. Wang et al., 2008). All stellar-based quantities are computed assuming a universal Chabrier IMF. In order to test, the effect of the merger trees resolution on our conclusions we also consider predictions based on the Millennium-II Simulation (MSII Boylan-Kolchin et al., 2009). The MSII span a smaller volume than the MS on a grid of similar size, resulting in a 125 times better particle mass resolution. We will discuss the comparison between MS and MSII in the main text whenever appropriate, and we collect some basic results in Appendix B.
2.1 BH seeding
In the following, we adopt the same BH seeding scheme used in Xie et al. (2017): every time a new DMH is resolved in the merger tree we seed it with a BH mass () scaled with the parent DMH mass333In the gaea framework we use as a proxy for DMH mass. ():
| (3) |
where the slope of the relation is derived from Volonteri et al. (2011) and Di Matteo et al. (2003). Applying Eq. 3 to the mass distribution, we get seed masses of the order of . We also test a “fixed” seeding scheme, by implanting the same BH seed in each DMH. We test fixed seeds in the range and we find that the results discussed in the following sections are mostly insensitive to the seeding scheme. A lower mass seeding () is still able to reproduce lower redshift constraints, but struggles in reproducing the luminous AGN at high-redshifts. On the other hand, a flat seeding at helps to reproduce the space densities at the bright-end of the LF, but complicates the recovery of the faint-end of the LFs.
It is worth stressing that our seeding approach is rather conservative. We do not consider the hypothesis that SMBHs can form with masses larger than via direct collapse of giant gas clouds in the early Universe, as has been recently suggested (see e.g. Valiante et al., 2016; Pacucci et al., 2017), or from the accretion of stellar mass BHs (Boco et al., 2020). Assuming that a small fraction of DMHs in our merger trees can host such initial SMBHs would help reconciling predictions from our models with high-z observations. However, the early phases of DMH assembly are poorly constrained at the MS resolution that corresponds to an DMH mass resolution of . Therefore we defer a more detailed study of the Early Universe and the impact of seeding prescriptions on high-z sources to future work.
2.2 -loss
The first phase of the AGN triggering process requires that a fraction of the cold gas available in the host galaxy loses enough angular momentum to reach the central regions and become available for accretion. In the following, we assume that the cold gas inflow towards the central SMBH is triggered by both galaxy mergers and disc instabilities. We model this phase by means of a gas reservoir that mimics the accretion disc around the central SMBH, without any attempt to model its detailed structure.
2.2.1 SFR-driven -loss
We consider two different approaches. The first one is an empirical model developed in the framework of the semi-analytic code MOdel for the Rise of GAlaxies aNd AGN (morgana - Monaco et al. 2007) and first described in Fontanot et al. (2006, F06 hereafter). In this model, a fraction of the host cold gas is supposed to lose a substantial amount of its angular momentum and accumulate in a gas reservoir of mass around the BH (see also Granato et al., 2004). This loss of angular momentum is driven by physical mechanisms like turbulence or radiation drag that are typically onset by SFR in the dense central regions () of the host galaxy (i.e. a few kpc around the galaxy centre). In detail, we assume that the growth rate of this reservoir is proportional to , via a free parameter :
| (4) |
In galaxy mergers we assume that equals the amount of SFR triggered by the merger itself and predicted by the collisional starburst model (Somerville et al., 2001, ):
| (5) |
Disc instabilities in gaea do not affect the cold gas component in model galaxies (i.e they do not trigger extra star formation), but simply move a fraction of stars from the disc to the bulge of the host galaxy to restore stability. However, disc instabilities are a relevant channel for bulge growth at intermediate host galaxy masses (i.e. De Lucia et al. 2011) and most models consider them as a viable AGN triggering channel (see e.g. next section). Therefore, we define a associated with discs instabilities and we assume it to be proportional to the corresponding growth rate of the bulge component :
| (6) |
The constant is fixed by requiring that the amount of gas inflowing in the reservoir during disc instabilities is similar to that obtained for the scheme described in the next section. We check that this condition is achieved for a , so this is the value that we adopt in this paper.
2.2.2 -loss following HQ11
As an alternative scenario, we consider the analytic approach proposed by Hopkins & Quataert (2011, HQ11 hereafter). Differently from the previous prescription, in HQ11 angular momentum losses are not modelled as a SFR-related mechanism, but as an effect of the overall perturbations induced in the cold gas disc by instability events.
Every time the gas disc becomes unstable (either by a disc instability or a merger), we assume that a fraction of its cold gas loses enough angular momentum and becomes available for accretion onto the SMBH. Following the analytic gravitational torque model proposed by HQ11, we model the -loss rate as:
| (7) |
where represents the reference galactocentric distance used to compute key quantities like:
| (8) |
| (9) |
| (10) |
In previous equations, , and represent the disc, cold gas and total mass inside . We compute the latter using the scale radii for the disc, gas and bulge components estimated by the model of Xie et al. (2017, see also ).
2.3 Accretion
The material accumulated into the reservoir/accretion disc is available for accretion onto the central SMBH. In this work, we do not attempt a detailed modelling of the accretion disc evolution, but we rely on two approximated prescriptions. We first test a prescription explicitly accounting for the relation between the gas mass in the reservoir and the mass of the central SMBH. We then test a more general prescription applying a universal light curve to each shining object: in this case we assume that the luminosity evolution traces the accretion history.
The accretion prescriptions we consider, coupled with the amount of cold gas available in the gas reservoir, lead to large accretion rates. Therefore, we limit the accretion in a given time interval to a rate:
| (11) |
where represents the Eddington luminosity and the speed of light. Please note that this definition correspond to ten times the mass accretion rate for a SMBH with a radiative efficiency of 10 percent, i.e. over an Eddington-Salpeter time scale (as assumed in F06 and HQ11). This higher limit is motivated by both observational and theoretical results (see e.g. Takeo et al., 2019; Jiang et al., 2019; Delvecchio et al., 2020). Theoretical models show that such high accretion rates can be indeed frequent, especially at high redshift (see e.g. Inayoshi et al., 2016).
2.3.1 Viscous accretion
As first choice, we consider an accretion rate determined by the viscous accretion timescale. We assume the rate defined in Granato et al. (2004):
| (12) |
where represents the velocity dispersion of the bulge.
2.3.2 Light-curve model
As a different scenario for gas accretion we consider the light curve model proposed by Hopkins et al. (2006, see also ) and based on results from high-resolution hydrodynamical simulations. Following each instability event, we assume that the AGN light curve is characterized by two phases: a first regime where the BH accretes exponentially at until it reaches a critical BH mass :
| (13) |
where represents the total mass accreted in the event, the initial mass of the SMBH and we fix as in Somerville et al. (2008). Once the SMBH reaches the critical mass, subsequent accretion is described as a power-law decline as a function of the time () elapsed from the peak accretion phase:
| (14) |
represents the Eddington accretion rate of the SMBH. In case of several triggering events close in time, the clock is reset after each individual event.
2.4 AGN-driven winds
Finally, we consider the effect of AGN activity on the host galaxy, and in particular on its cold gas phase. We assume that active AGN exert a feedback effect of the surrounding medium, actively heating it up and eventually expelling it in the hot gas in the form of a AGN-driven galactic wind. In this study we will consider different wind scenarios, either consistent with the results of analytic calculations in idealized SMBH-galaxy disc geometries or based on empirical arguments.
Moreover, following Monaco & Fontanot (2005), we allow AGN-driven winds to trigger further accretion onto the central SMBH. In this scenario, AGN-driven winds are powered by the combined effect of SNe explosions and radiation pressure of the AGN; we assume that a fraction of the ISM is compressed to the centre, and added to the BH reservoir. Mori et al. (2002) suggest a value of the order of for , assuming that 20 per cent of the gas is compressed to the centre, but only 1 per cent of this gas loses enough angular momentum to be eventually accreted onto the reservoir. In the following, we treat as a free parameter (see Table 1 for the calibrated values).
2.4.1 Empirical outflows
The last AGN phase we consider in our model is the outflow phase, i.e. AGN-driven winds. We model this phase by assuming that each accretion event in Eq. 12 and 14 leads to an outflow from the cold gas disc (AGN-driven wind), that is characterized by a rate:
| (15) |
2.4.2 M19 outflows
As an alternative approach, we also implement results of an analytic model for AGN-driven outflows proposed by Menci et al. (2019, M19 hereafter). Their two-dimensional approach computes the expansion of AGN-driven shocks in a galaxy disc with an exponential gas profile, the outflow expansion in different directions with respect to the plane of the disc, and the total mass outflow rate as a function of global properties of the host galaxy and of the luminosity of the central AGN. In this work, we take advantage of tabulated numerical solutions for the fraction () of cold gas ejected as a function of the bolometric luminosity , the total gas mass , and the virial velocity of the parent DMH :
| (16) |
2.5 Combining different prescriptions.
In this paper, we consider two different prescriptions for each phase connected to the AGN phenomenon, leading to several combinations of possible realizations. In the following sections, we will discuss two specific realizations that exemplify the influence of each individual choice on model predictions. The first realization (f06-gaea hereafter - blue lines in all figures) closely resembles the scheme implemented in the semi-analytic code morgana (Fontanot et al., 2006): it uses the SFR-dependent -loss (Sec. 2.2.1), the viscous timescale for gas accretion (Sec. 2.3.1), and the outflow rate from the model developed by M19 (Sec. 2.4.2). This model loosely retains the original description defined in F06 and uses two free parameters and . The values adopted for these two parameters are consistent with those used in F06, although the two models use different integration time intervals. is in good agreement with the estimated value in F06, while our best estimate for is lower but still consistent with F06.
The alternative realization (hq11-gaea hereafter - red lines in all figures) uses the prescriptions calibrated on high-resolution simulations by HQ11 (Sec. 2.2.2), the light curve model from Hopkins et al. (2006, 2.3.2) and the empirically calibrated outflows (2.4.1). This model includes three free parameters: and plus the scaling of the empirical wind model . The original HQ11 work tested several values (up to 100 pc) and proposed . In our model, we use 2 kpc, a value that is larger than those tested in HQ11, but still representative of the central region of model galaxies. As for , we use a value of 15, that is still consistent with HQ11. It is important to remember that the original HQ11 framework has been defined on high-resolution hydrodynamical simulations able to resolve the central regions of host galaxies on sub kpc scales. In gaea, we assume that the mass distributions of the relevant components follow smooth analytic profiles (i.e. an exponential profile for both the gaseous and stellar disc and a Jaffe profile for the bulge). Given the different approaches for the structural modelling in the hydro-simulations and in gaea, the agreement between the values used for and seems reasonable. Finally, is consistent with the range of values allowed by the measurements show in Fiore et al. (2017). A summary of the two runs with all the associated parameters can be found in Table 1.
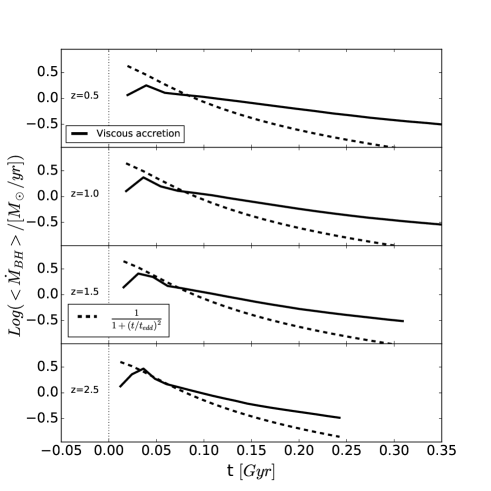
The two runs considered are representative of the range of results span by all possible combinations of the 3 couples of prescriptions described in previous sections (see Appendix C). In particular, test runs exploring different combinations show that the loss prescription, i.e. the total amount of cold gas available for accretion, plays the most important role for reproducing the evolution of the AGN population. The different accretion schemes we define in Sec. 2.3 provide similar evolution after calibration is performed on the model predictions. Fig. 1 shows as a solid line the mean accretion rates for SMBHs at different redshifts in f06-gaea. In the same figure, the dashed lines represent the time evolution corresponding to the functional form assumed in Eq. 14, normalized to the same total accretion (the dashed line shows only the power-law decline of the light curve). The two accretion curves differ significantly: the main difference lies in the viscous accretion predicting e-folding times larger than by a factor of . Nonetheless, the overall trend of a power law decrease after an initial peak is the same in the two approaches. These results imply that the number density of intermediate luminosity AGN critically depends on the total amount of low cold gas available, more than on the detailed description of accretion. Finally, the M19 model has been compared with the empirical results from Fiore et al. (2017), showing that its analytic results are in agreement with the observational constraints. The two outflow models provide rather different descriptions of the role of AGN activity in triggering galaxy wide winds. We use the measurements by Fiore et al. (2017) to define a purely empirical model, and constrast it with a parameter free prescription that implements the results of the analytic calculations presented in M19. The two models assume correlated quantities as primary dependencies to scale the mass loading factor of the wind, namely the AGN bolometric luminosity and SMBH accretion rates. The main difference between the two models lies in M19 taking into account also the gravitational potential of the host galaxy and its gas content, while the empirical prescription depends only on the central engine.
3 Results
In this section we collect a number of predictions on basic AGN properties. In all panels we show the predictions from the original recipe used in H16F with black lines, while blue ad red lines are used for f06-gaea and hq11-gaea. In most of the following plots, the standard KH00 accretion model falls short in reproducing the most luminous AGN (especially at ), in agreement with Marulli et al. (2008), while our new models provide an overall better description of the cosmic evolution of the space density of accreting SMBHs.
In Fig. 2, bolometric luminosities have been obtained by assuming a radiative efficiency of 15 per cent for radiatively efficient AGN, i.e. with Eddington ratios
| (17) |
At lower Eddington ratios, we use results by Churazov et al. (2005, see also ):
| (18) |
Finally, sources with Radio-mode accretion (Eq. 2) are assumed to be very inefficient accretion systems, with a radiative efficiency of 2 per cent, following results based on numerical simulations (see e.g., Sadowski & Gaspari 2017). Model predictions are compared with observational estimates for the AGN bolometric LFs. At , we start from the Ueda et al. (2014, see also for a different estimate of the LF) hard X-ray LFs, while at higher redshift we show measurements from Fiore et al. (2012). In both cases, we apply bolometric corrections from Marconi et al. (2004) to estimate the expected bolometric LFs and we account in the calibration for the uncertainties on the LF determination (represented by the grey area in Fig. 2 and 4). We do not apply any obscuration correction to model predictions and we compare the intrinsic AGN-LFs to the observational constraints. This is motivated by the choice of using the hard-X ray LF as primary constrain, and by the choice of considering the full uncertainty range of the data in the calibration procedure. Moreover, we check that the bolometric AGN-LFs from Hopkins et al. (2007), that is corrected for obscuration effects, lie in the grey shaded area. We use the comparison between MS and MSII predictions (Fig. 11) to estimate the luminosity range where our models show a good level of convergence (solid lines). For completeness, dashed lines show the predicted AGN-LF below this luminosity limit. The convergence limit depends on redshift, but also on the model considered, with f06-gaea typically reaching convergence at bolometric luminosities one order of magnitude fainter than in hq11-gaea. This result is likely connected to the modelling of the loss in the HQ11 framework. This approach heavily relies on a proper description of the mass distribution between the different galaxy components (i.e. disc and bulge), on their relative profiles and scale radii. Xie et al. (2017) provides a relevant improvement in the gaea framework, nonetheless, such a description still represents one of the strongest limitations of our SAM, in particular for low-mass objects and at lower resolutions.
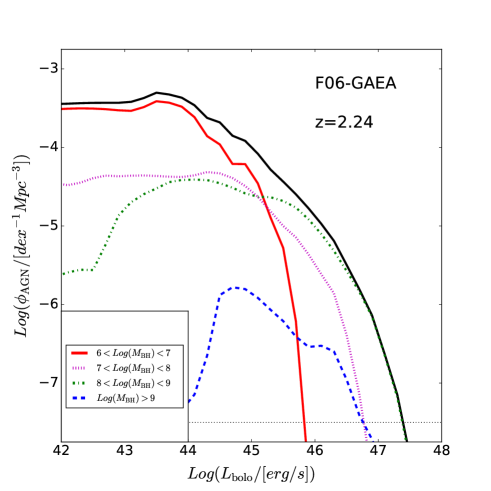
The luminosity function based on the H16F run shows a peculiar shape, in particular at high-z. At the faint end, the power law tail is dominated by sources in the Radio-mode phase (Eq. 2), while the almost-Gaussian peak at bright luminosities is populated by model galaxies in the merger-driven accretion phase (Eq. 1). In particular, the narrow width of the latter feature reflects the assumption of instantaneous accretion during mergers. We stress that the original H16F run has not been explicitly calibrated to reproduce the evolution of the AGN-LF in this paper. Previous work by Marulli et al. (2008) showed that the KH00 scheme is not able to reproduce the evolution of the AGN-LF above , in the framework of the De Lucia & Blaizot (2007). On the other hand, both f06-gaea and hq11-gaea provide consistent predictions for the AGN-LF up to . At the bright end of the LF, the two models provide similar predictions, in agreement with the observational constraints up to the space densities robustly sampled by the MS (the dotted lines in Fig. 2 mark the space density corresponding to 10 objects in the MS volume). At fainter magnitudes, the differences between the two models are more significant, with f06-gaea predicting a systematically larger number of sources below the knee of the LFs (although number densities are still roughly consistent with observational constraints). As we mention in previous section, we checked that the differences between the two runs are mostly due to the -loss prescription, with the accretion prescription playing a minor role. Indeed, the SFR-driven -loss predicts that more cold gas gets destabilized and goes into the reservoir with respect to the HQ11 scenario. The LFs predicted by both models are also characterized by several features. These features are mainly due to the relative contribution of AGN powered by central SMBHs of different , as highlighted in Fig. 3 (for clarity we show results for a representative redshift range, but similar results hold at all cosmic epochs). This figure shows the relative contribution to the LF of SMBHs of different mass, and helps breaking the degeneracy between and in determining the AGN luminosity.
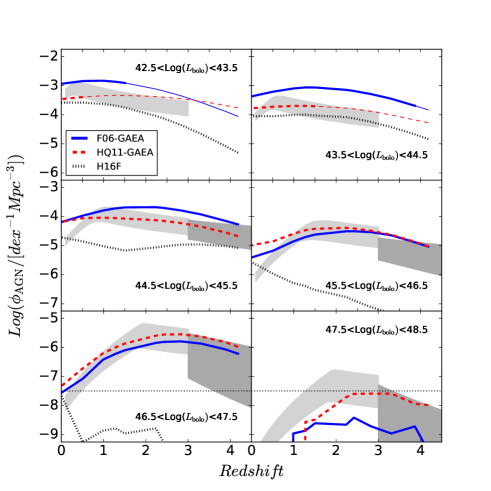
Another critical tests for our accretion models is the so-called AGN downsizing, i.e. the evidence that the space density evolution of AGN peaks at a decreasing redshift with increasing luminosity (Fig. 4, where we show only luminosity bins above the convergence limit). This is just an alternative way to show the evolution of the LF with respect to Fig. 2. Our models reproduce relatively well the observed trends between erg/s and erg/s. At higher luminosities, the number of objects is quite low; given the volume of the MS we cannot conclude if there is a problem for our accretion schemes or this regime is affected by sparse sampling effects (dotted lines in Fig. 4 represent the space density corresponding to 10 objects in the MS volume).
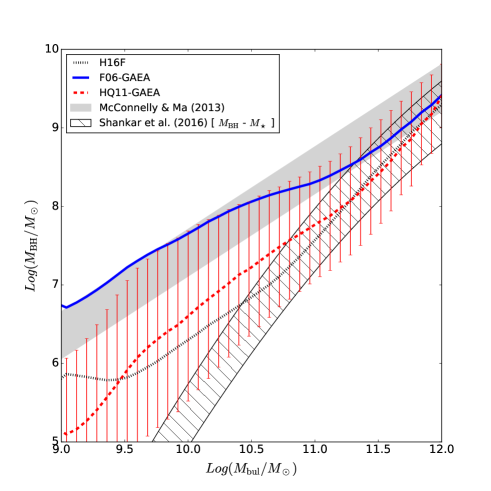
We then consider some standard predictions for the mass distribution of the SMBH population, i.e. its mass function (BHMF) and the BH-Bulge relation. We recall that we perform the calibration of the relevant parameters for our realizations on the AGN-LF and its redshift evolution, therefore additional quantities represent real predictions for our models. Other models in the literature use the local BH-Bulge relations and/or the BHMF as the main calibration set. We choose to focus on the AGN-LF for two main reasons. First of all, a calibration on the local relation does not guarantee to reproduce the evolution of the AGN-LFs, that represent a stronger constraint for the differential SMBH accretion history. Moreover, the observed slope and normalization of the BH-Bulge relations may be seriously affected by selection biases (Shankar et al., 2016). A different normalization of the BH-Bulge relation also impacts the BHMF, through a different estimate for the radiative efficiency.
In the left panel of Fig. 5 we show the BH-Bulge relations in our realizations: these predictions agree within 1- with the McConnell & Ma (2013) (or Kormendy & Ho 2013) relation (grey shaded area). The typical scatter in the model predictions is sensibly larger than in the observational estimates. Although the hq11-gaea run systematically underpredicts at fixed with respect to the McConnell & Ma (2013), these results would still be consistent with the observed data, if we consider selection biases as proposed in Shankar et al. (2016). The intrinsic relation between and the the total stellar mass of the host galaxy is shown for reference in the left panel of Fig. 5 as an hatched area. Shankar et al. (2019a) show that a model consistent with the AGN-LF and assuming naturally falls up to one order of magnitude below the observed relation for . This effect seems at play in hq11-gaea, while the f06-gaea predictions are aligned with the observed relation. f06-gaea overpredicts the space density of with respect to hq11-gaea and observed data, at all redshifts (Fig. 4). Although the predicted luminosity functions are still consistent with the observed AGN-LFs, this effect implies larger accretion on (and growth of) . Finally, the steepness of the BH-Bulge relation obtained from the KH00 prescription has been previously reported (see e.g. Arora et al. 2019).
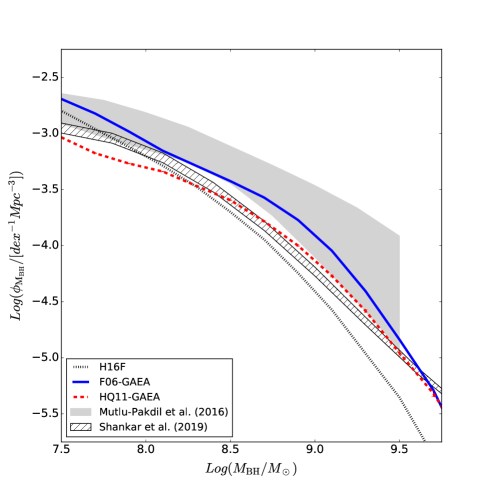
Both runs predict similar trends for the z0 BHMF (Fig. 5 - right panel). In detail,the hq11-gaea run predicts a lower space density of low-mass SMBH, with respect to f06-gaea and H16F, while both our new models predict a larger space density of massive SMBHs than in H16F. As a reference we compare these predictions with observational constraints derived either from a sample of local galaxies (Mutlu-Pakdil et al., 2016) or from the AGN-LF using the “accreted/relic BHMF” formalism and assuming a radiative efficiency of 15 percent (Shankar et al., 2019a). We note that the accreted BHMF has been computed via the continuity equation formalisms developed by Shankar et al. (2013). We have neglected mergers and assumed, for simplicity, a constant Gaussian Eddington ratio distribution peaked at -0.6 and with a width of 0.4 dex. The shape of the resulting BHMF is not very sensitive to the shape of the input Eddington ratio distribution, at least for (see discussions in Shankar et al. 2013). We find a reasonable agreement between the predictions of our models and the available constraints.
3.1 Effect of AGN-driven winds of the SFR of host galaxies
The overall mass assembly history of galaxies in our runs implementing a different BH accretion history is consistent with the results presented in H16F (See Appendix A). The main difference with respect to H16F lies in the predicted SFRs. We recall that this observable represents a significant tension between the reference gaea model and observational data (see Fig. 8 in H16F). In the standard gaea run, galaxies with at z0 have residual specific SFRs (sSFRSFR/) larger than those observed in the local Universe. Moreover, the distribution of galaxies at intermediate masses () does not show the observed bimodality. It is important to keep in mind that the SFR levels predicted for the more massive galaxies are low enough that most of these galaxies would still be classified as passive (De Lucia et al., 2019).
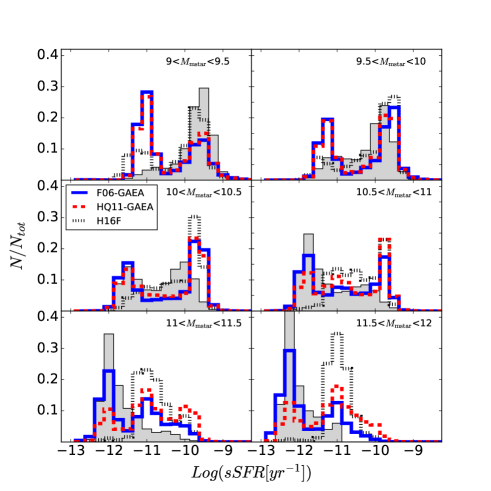
All gaea runs we consider implement Radio-mode feedback in the form of Eq. 2. We have verified that this SFR excess for massive galaxies cannot be solved by a different (or stronger) implementation of Radio-mode feedback (see also Hirschmann et al. 2016), as it is not related to late cooling flows in massive DMHs, nor to cold gas brought in by satellite galaxies. The main reason for this residual SFR is the large cold gas content in the main progenitors of these galaxies at , and the low assumed SFR efficiency, leading to low gas consumption rates. AGN-driven winds represent an additional mechanism to remove cold gas from galaxies, even from isolated ones. Therefore, they may represent a viable solution to this problem. In Fig.6, we compare the sSFR distribution for galaxies in different mass bins with data from SDSS galaxies (shaded distributions, in the redshift range, where we expect the sample to be volume complete down to ). We assign an observationally equivalent SFR upper limit to model galaxies with SFR using the relation:
| (19) |
This reproduces the locus of the upper limits of passive galaxies in the SDSS sample. We perturb this relation adding a lognormal scatter of 0.25 dex to the final SFR. When compared to the H16F predictions, both our new realizations provide an improvement for the mass bins. The improvement is more relevant for f06-gaea, while is relatively smaller for hq11-gaea: the number of (almost) completely quenched galaxies is increased, but the shape of the distribution still sensibly differs from observations. This relative improvement also comes at the price of a clear overprediction of the passive population in the mass bins, that breaks the agreement found in H16F, in this mass range. At intermediate masses, f06-gaea provides a marginal improvement in recovering the predicted bimodality of the sSFR distributions.
The differences between the new runs and H16F are due to the combination of different effects. The implementation of AGN-driven winds plays a relevant role, by removing cold gas from galactic discs. Nonetheless, it is worth stressing that the differences in the quenching efficiencies between f06-gaea and hq11-gaea depend mainly on the -loss prescription, i.e. on the total amount of cold gas available for accretion onto SMBHs. In particular, the fraction of quenched galaxies is always larger in f06-gaea than in hq11-gaea, irrespective of the outflow model implemented. A second competing effect in regulating the SFR levels in model galaxies is connected to the different stellar feedback parameters involved in the calibration of f06-gaea and hq11-gaea runs. Both models assume an parameter three times larger than H16F: this implies that the more efficient cold gas depletion in massive galaxies is due both to the AGN-driven winds and to the higher star formation efficiency. It is worth stressing that despite the different stellar feedback parameters (in particular the parameter is roughly three times smaller than H16F) the agreement of our models with the observed galaxy stellar mass functions and stellar/gas mass-metallicity relations is similar to that shown in H16F (see Fig. 10). These results clearly show that the implementation of a different AGN modelling does not heavily impact on the self-regulation of star formation and feedback in galaxies.
The sSFR distribution predicted by our models is affected by the modelling of AGN-driven winds. In particular, since the M19 prescription does not use free parameters, the red dashed histograms are a direct prediction for the hq11-gaea run. On the other hand, in the empirical prescription from Fiore et al. (2017) the efficiency of the mass-loading factor is treated as a free parameter that can be varied to try to improve the match with the sSFR distribution. The blue histograms in Fig. 6 show the difficulties that also for the f06-gaea run we face difficulties in reproducing the SFR levels observed over a wide range of galaxies stellar masses. It is possible to improve the agreement with the observed distributions at the high-mass end of the GSMF, by increasing the strength of cold gas removal in AGN-driven winds. This, however, comes at the price of increasing the fraction of quenched galaxies at the low-mass end of the GSMF, exacerbating the discrepancy with the data, over this galaxy mass range. Our results are not in tension with apparently opposite conclusions reached by, e.g., hydro-dynamical simulations (Brennan et al., 2018). Indeed, the tensions we see are mainly due to our attempt to reproduce at the same time the evolution of the GSMF, the AGN-LF, the mass-metallicity relations and the sSFR distribution.
Overall, we conclude that AGN-driven winds alone are not a viable solution to improve the agreement between our predicted sSFR distributions and observational measurements. Additional modifications of the stellar feedback prescription (taking into account also the coupling between stellar and AGN-driven winds - see e.g. Monaco & Fontanot 2005) have likely to be taken into account in order to reproduce the detailed distribution of SFR of galaxies of different mass, and will be the subject of future work.
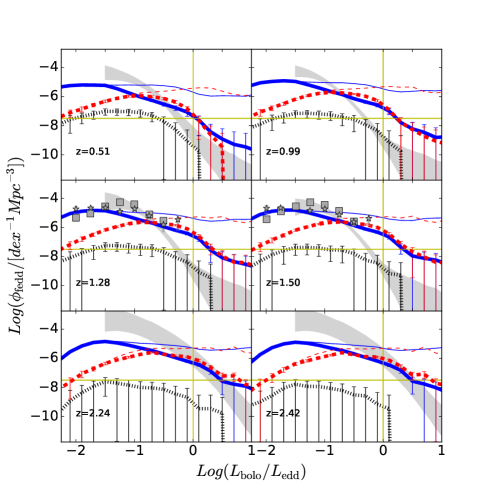
3.2 Eddington Ratios Distributions
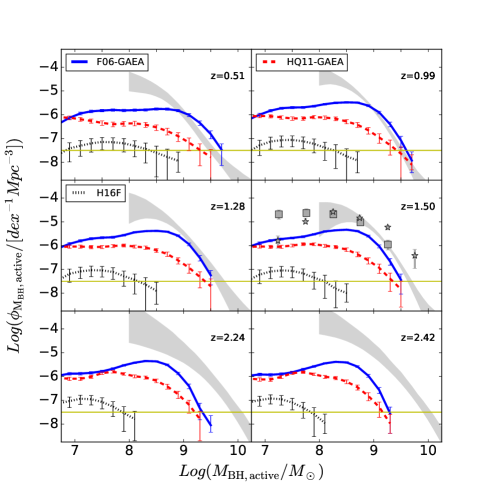
In order to understand if our runs can capture the complexity of BH accretion events at different cosmic epochs, we also consider the evolution of the mass function of active BHs (aBHMF) and the probability distribution functions for the Eddington ratios predicted by our runs. In Fig. 7, we compare these quantities with observational estimates from Kelly & Shen (2013) and Schulze et al. (2015). It is worth stressing that the BH mass estimate is a difficult measurement, typically done via analysis of the MgII and/or Hβ feature in QSO spectra. These measurements are reliable444As an example, the contamination from the FeII line (e.g. Tsuzuki et al., 2006) is an important source of uncertainty for MgII measurements (Bischetti et al., 2017; Vietri et al., 2018). only for a subsample of bright QSOs and for relatively massive SMBHs (). In the following, we use as reference the results from the sample of Kelly & Shen (2013, shaded area), that is defined using Type I QSOs brighter than . We also consider data from Schulze et al. (2015, symbols with errorbars). These are in general consistent with the Kelly & Shen (2013) sample, but cover a smaller redshift range. We apply to our model predictions the same luminosity cut as Kelly & Shen (2013) and we also apply a cut to account for the limitations due to SMBH mass estimates. In order to account for the Type I selection, we simply assume that these sources account for 25% of the total population at all redshifts and luminosities. Given the uncertainties in the observational determinations (that require an extrapolation from a small initial sample), the agreement of our predictions with the data (Fig. 7 - left panel) is encouraging. In particular, f06-gaea is consistent with the Kelly & Shen (2013) results within dex up to , while hq11-gaea is systematically below the observed aBHMF by more than 1 dex. The differences between f06-gaea and hq11-gaea can be ascribed to the different AGN space densities around the knee of the LFs, and to the different modelling of -loss and accretion. In particular, the larger space densities of active SMBHs in f06-gaea are due to the larger population of BHs entering the adopted luminosity cut, and to the larger gas reservoirs around the central SMBHs (the latter provide longer timescales for accretion). In detail, we check that the -loss prescription is more important than the accretion prescription in determining the aBHMF. There is a clear deficit of active SMBHs, in both models, at and for . This could be due to an intrinsic problem for our modelling and/or to the conservative seeding approach (sec. 2.1), that is not able to catch the early stages of SMBH assembly via direct collapse of massive gas cloud.
An important point to keep in mind for further discussion is that the predicted aBHMF extends well below , which represents the confidence region for the observational datasets. This effect has important consequences on the interpretation of the predicted probability distribution function of Eddington ratios. In the right panel of Fig. 7 we compare the estimates from Kelly & Shen (2013) with two different samples of model AGNs. Solid lines correspond to an AGN sample selected applying to our models both a cut in luminosity () and BH mass (): this sample shows a reasonable agreement with the observational constraints (especially considering that we are at space densities at the limit of MS resolution - the dotted line marks the space density corresponding to 10 objects in the MS). The situation changes dramatically if we include in the distribution sources powered by smaller BHs (i.e. if we only consider a luminosity cut). The resulting probability distribution functions are shown as dashed lines: they are flat over a wide range of Eddington ratios, clearly overpredicting the estimated space density at high Eddington ratios.
These conclusions are consistent with the analysis of the contribution to the AGN-LF of AGN powered by SMBHs of different mass (Fig. 3): while QSOs on the bright-end of the LF are powered by SMBHs more massive than , objects in the mass range account for roughly half of the sources below the knee of the LFs. It is currently quite challenging testing this prediction of our models via current facilities, but this mass range should be accessible with the next generation of space and ground instruments (like Athena and JWST).
Our results suggest that massive SMBHs are in a “self-regulated” regime, i.e. the systems are able to auto-regulate the amount of cold gas that is available for accretion. Lower mass BHs have not yet reached this regime, and live in environments where large amounts of gas is available for accretion. The flat distribution of Eddington ratios is a natural consequence of our simplified assumption of a flat limiting Eddington accretion rate (Eq. 11) coupled with a fixed luminosity cut.
It order to overcome this limit of our model, i.e. predicting a probability distribution function of Eddington ratios that reproduces the Kelly & Shen (2013) estimates using only a luminosity cut, relevant improvements in our schemes are needed. In particular, preliminary work shows that an evolution of the limiting Eddington rate as a function of is required in order to reduce the contribution of to the LF at intermediate bolometric luminosities. However, how this effect could be achieved in our framework in a physical way is beyond the aim of the present study. We plan to deepen this point by exploring alternative accreting schemes and feedback scenarios in a future work.
4 Discussion
The two BH accretion models we implemented in gaea provide predictions for the basic properties of AGN that are in better agreement with respect to the standard AGN model implemented in H16F. This improvement is due to a number of reasons. First of all, the new models include a delayed accretion onto SMBHs with respect to previous model. This delay is due in hq11-gaea to the modelling of the AGN light curve connected to each destabilising event, and in f06-gaea to the explicit modelling of the reservoir/torus around the central SMBH (the viscous accretion timescale from Eq. 12 is equivalent to a light curve). The removal of the assumption of instantaneous accretion in favour of a light curve approach has been shown in previous work to improve the modelling of the faint-end of the AGN-LF (Marulli et al., 2008; Lapi et al., 2006). Moreover, our new models provide a much better description of the evolution of bright sources in several respects. We implement an improved modelling for estimating the amount of gas losing enough angular momentum to infall to the very centre of the host galaxy. Another key aspect of the modelling lies in the fact that we accumulate this low material in a reservoir/accretion disc, from where it can be accreted onto the central SMBH on a non-instantaneous timescale. Finally, our approach does not link BH accretion to merger events only, thus extending the range of AGN triggering events.
There are some key differences between the two accretion schemes we consider in this paper. Both approaches model the required loss of angular momentum in the cold gas as a local process triggered by “external” events that happen on the scale of the host galaxy. In both models, cold gas fuels the SMBH as an effect of gravitational instabilities connected to large scale effects in the host disc (see e.g. Romeo & Mogotsi, 2018). In hq11-gaea, the amount of cold gas available for accretion depends on the properties of the host galaxy, while f06-gaea assumes that the relevant mechanism is related to the amount of SFR triggered in the central region of the galaxy. This implies that in the hq11-gaea model, a disc instability event is equivalent to a major merger, at fixed host galaxy properties, while in f06-gaea each triggering event is different from each other, depending on the amount of SFR associated with it. Finally, it is worth noticing that gaea does not model galaxy interactions (i.e. flybys, see e.g. Menci et al. 2008), so that we neglect this possible extra channel for AGN triggering, as well as direct smooth gas accretion from the halo gas.
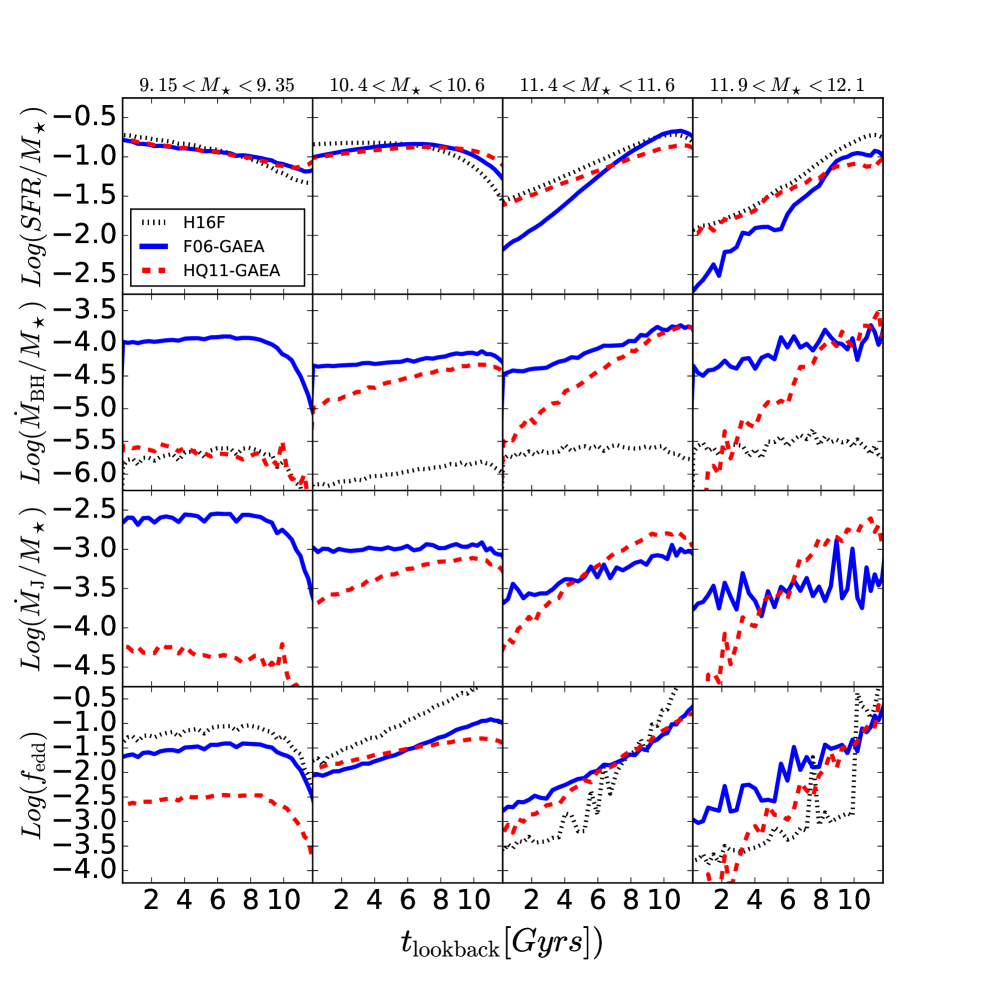
In order to better understand the effect of the considered BH accretion schemes in gaea, we show in Fig. 8 and 9 the evolution of selected physical galaxy properties. We consider galaxies in four representative mass bins () corresponding to the four columns. In the upper panels of Fig. 8 we show how the BH accretion schemes modify the evolution of the sSFR. In the largest mass bin, the f06-gaea model is effective preferentially at later times, while the hq11-gaea model impacts the sSFR already at early cosmic epochs. In the second row, we consider the specific BH accretion rate: this quantity is almost always larger in our improved schemes with respect to KH00, with f06-gaea always predicting larger values than hq11-gaea. These trends are mainly due to the larger amounts of cold gas typically infalling onto the reservoirs around the SMBHs predicted by Eq. 4 with respect to the Eq. 7, as shown in the third row. The increase of cold gas available for accretion is particularly evident at low redshift and for low-mass galaxies. Finally, in the lower panels we show the evolution of the mean Eddington ratios. Although there is a large population of SMBHs accreting at and above Eddington (see Sec. 3.2), the mean accretion takes place at sub-Eddington rates.
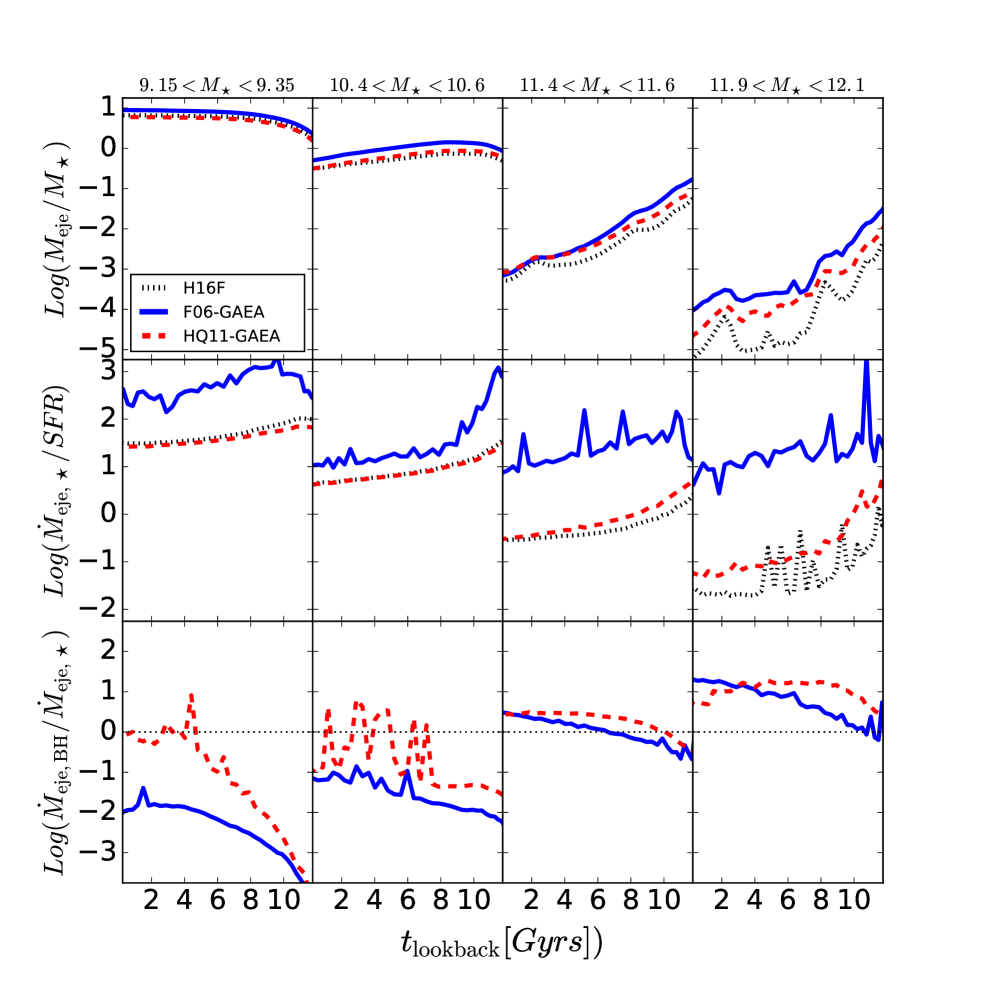
Finally, we focus on the outflow rates associated with AGN-driven winds, and we compare them to stellar-driven winds (Fig. 9). The upper panels show the mean total (i.e. AGN plus stellar driven winds) ejected mass, normalized to the stellar mass in our reference mass bins. As expected, this quantity increases in our new runs with respect to the standard gaea realization. This increase grows with the stellar mass of the galaxies (f06-gaea systematically predicts larger ejected fractions than hq11-gaea). A similar behaviour is also seen in the total mass loading factor (middle panels): in this case the enhancement predicted by the f06-gaea run is particularly evident, while the hq11-gaea run is closer to the standard run. The enhancement in f06-gaea is also due to the lower SFR predicted in this realization with respect to H16F and hq11-gaea. Finally, in the lower panels, we directly compare the ejection rates for the stellar-driven () and for the AGN-driven outflows (). Our results show that the relative importance of these two channels seems to correlate well with the final galaxy mass. This fact highlights the importance of the different timescales associated with the assembly of stellar mass and BH accretion in regulating their relative evolution. Indeed, in more massive galaxies AGN-driven winds systematically displace larger gas masses than stellar-driven winds at all cosmic epochs. Their contribution is comparable at . At lower stellar masses stellar-driven winds still represent the key process to regulate the baryonic cycle, with AGN-driven winds possibly relevant only at late times. This result is consistent with our findings of a good agreement in the overall galaxy properties between our new runs and the standard model: stellar-driven winds are still the main regulating process for the evolution of galaxies at the low-mass end of the GSMF.
The statistical properties of the AGN population and their evolution have been analysed for different large-scale cosmological hydro-dynamical simulations, including EAGLE (Rosas-Guevara et al., 2016), IllustrisTNG (Habouzit et al., 2019), HorizonAGN (Volonteri et al., 2016), Simba (Davé et al., 2019) and Magneticum (Hirschmann et al., 2014). Due to the limited resolution and to the lack of a complete theory describing the physical processes under consideration, SMBH growth and the corresponding feedback cannot be modelled from first principles. Therefore sub-grid or sub-resolution models, including free parameters, have to be implemented. In general, SMBHs of a given mass are typically seeded in halos/galaxies above a certain mass limit. These SMBH seeds are assumed to further grow via mergers with other SMBHs and via gas accretion, mostly following the Bondi-Hoyle approach. Feedback from SMBHs is modelled in a rather different way in different simulations.
Despite the large variety of prescriptions adopted for BH growth and feedback, and the uncertainties involved, simulations are to be fairly successful, with minor short-comings, in reproducing basic, statistical BH and AGN properties. The AGN feedback efficiency parameter is typically calibrated to have the normalisation of the - relation consistent with observations. Most simulations can also predict a fairly realistic evolution of AGN luminosity functions. Some tensions remain, such as a slight over-estimation of faint AGN at high redshifts in IllustrisTNG, or a slight underestimation of bright AGN at in EAGLE. These modern cosmological simulations have been tuned to match, simultaneously, the evolution of the galaxy stellar mass function. They are also able to roughly reproduce the quiescent fractions of galaxies at a given stellar mass (see Xie et al., 2020). The detailed colour distribution predicted for Illustris TNG has been discussed in Nelson et al. (2018), while for the other simulations discussed here, most comparison work has focused on the main sequence of star-forming galaxies (Sparre et al., 2015; Katsianis et al., 2017). It is worth stressing that hydro-simulations also report tensions in the balance between the quenched fraction of massive and low-mass galaxies when AGN feedback is taken into account, similar to our findings in Fig. 6. These results have motivated the implementation of phenomenological prescriptions, in order to better reproduce the observational constraints, such as mass-dependent feedback schemes, either in the form of mass-dependent AGN feedback schemes (Davé et al., 2019) or mass-dependent Eddington-limit for quasar-mode, (Weinberger et al., 2018).
A detailed comparison between results fromq these modern cosmological simulations and predictions from gaea is limited by the different basic assumptions and modelling techniques. Models for AGN evolution have been developed in the framework of the galform SAM (Fanidakis et al., 2012) and of the SantaCruz SAM (Hirschmann et al., 2012). Consistently with Hirschmann et al. (2012), we find that disc instabilities are an important ingredient in the evolution of the AGN population, but not the major contributors at all luminosities, as found in Fanidakis et al. (2012) model. In order to reproduce the high-z AGN-LF and its downsizing trend, Hirschmann et al. (2012) use larger SMBH seeds than gaea: this is connected to the assumption of a strict Eddington limit for cold gas accretion. As in Fanidakis et al. (2012), gaea allows super-Eddington accretion and thus requires a more moderate SMBH seeding to reproduce the high-z evolution of the LF. However, while the downsizing trend in the model by Fanidakis et al. (2012) can be reproduced only assuming relevant dust obscuration, this is not the case in gaea and in Hirschmann et al. (2012).
5 Conclusions
In this paper, we present an improved version of the gaea semi-analytic model featuring a state-of-the-art modelling of BH accretion and AGN-driven winds. We model the AGN phenomenon considering three different phases: (a) we first model the loss of angular momentum required for the cold gas to fall towards the central regions of the host galaxy and form a gas reservoir around its SMBH, (b) we then estimate the accretion rate from the reservoir onto the SMBH and (c) we study the effect of AGN-driven outflows on the properties of the host galaxy. For each of the three phases we consider two alternative prescriptions.
A first realization (f06-gaea) is based on an analytic approach similar to that adopted in the morgana semi-analytic model (Fontanot et al., 2006), and inspired to the work of Umemura (2001) and Granato et al. (2004). This modelling assumes that the cold gas loses angular momentum through a variety of processes that are linked to the SFR of the host galaxies (i.e. turbulence and/or radiation drag). The gas is accreted on the SMBH on a viscous timescale. The effect of the AGN-driven winds is modelled using empirical prescriptions based on observed AGN molecular and ionized outflows (Fiore et al., 2017). As an alternative model (hq11-gaea), we consider the -loss rate predicted by Hopkins & Quataert (2011) and based on results from high-resolution numerical simulations. These are aimed at studying the back-reaction of gaseous star-forming discs whenever they are subject to an instability (either due to the properties of the disc itself, or induced by an interaction with a nearby object). We couple these prescriptions with a light-curve model to estimate the accretion onto the SMBH and with an analytic estimate of the ejection rate by AGN proposed by Menci et al. (2019).
Among these two models, f06-gaea shows better convergence properties with respect to hq11-gaea against changes of the particle resolution of the underlying simulation (see App. B). Therefore, we can use the f06-gaea model to explore the properties of the AGN population down to fainter magnitudes and smaller . In particular, the HQ11-GAEA model provides robust predictions at only for luminosities of the order of or brighter (i.e. around the knee of the AGN-LF), while f06-gaea extends to up to . This behaviour is connected to the modelling of loss rates following Hopkins & Quataert (2011). This description relies on the structural properties of the inner regions of simulated galaxies, which become increasingly difficult to recover at increasing redshift. In order to explore the AGN properties for sources below the knee of the LF at , a different simulation is needed with a better resolution than MS and comparable cosmological volumes.
We stress that the inclusion of an AGN phase has only a marginal effect on the overall assembly of the galaxy population, as seen from the evolution of the GSMF. However, the effect of AGN-driven winds on the SFR of massive galaxies can be relevant, helping in displacing larger amounts of cold gas with respect to stellar feedback driven winds. Our results clearly support a scenario where the combined effect of AGN and stellar feedback is fundamental in order to reproduce the observed AGN and host galaxy properties at the same time. In particular, AGN-driven winds help in reproducing the (low) levels of SFR in massive galaxies, removing some of the cold gas still in place in these galaxies since . However, the removal of gas is strong in low-mass galaxies as well, worsening the agreement with observational constraints found in H16F for the passive fraction at . Overall these results suggest that AGN-driven winds alone cannot be the solution for all problems highlighted in H16F. A deeper revision of the stellar feedback modelling is required as well, possibly taking into account the coupling between stellar and AGN feedback (Monaco & Fontanot, 2005), or assuming a mass-dependent feedback (see e.g. Davé et al., 2019).
Another interesting aspect lies in the predicted Eddington rates. Our results show clearly that the more massive SMBHs (i.e. ) are already in a self-regulated regime, able to reproduce the observed distribution of Eddington ratios at various redshifts (that implies a decreasing number of sources at increasing Eddington ratio). Smaller SMBHs have not reached this stage yet, and show a rather different distribution of Eddington ratios, flattening at high and implying that all possible accretion rates are plausible. This is due to the availability of large gas reservoirs in the host galaxy, that smaller central objects are not able to displace efficiently as more massive systems. Consistently, our models predict a large contribution of AGN powered by small SMBHs (i.e. ) to the space density of AGN around the knee of the LF. Testing this prediction is beyond the capabilities of current instrumentation, but future facilities, like Athena, hold the promise to provide the required insight.
Finally, we show that the assumption that mechanisms other than galaxy mergers can trigger an AGN event as well as the inclusion of a delayed accretion model for the cold gas (either in the form of a gas reservoir or as a light curve) are important to reproduce the overall shape of the AGN LF. This implies that a detailed treatment of disc instabilities is critical for reproducing the AGN population. De Lucia et al. (2011) showed that disc instability are a fundamental process for bulge growth at intermediate host galaxy masses (i.e. ). The most relevant difference between our realizations lies in the treatment of disc instabilities: their impact is larger in the hq11-gaea realization because this model assumes that the amount of -loss in the cold gas depends on the local properties of the host galaxy, i.e. on the stellar and cold gas mass distributions, independently on magnitude of the mass transfer involved. In f06-gaea, instead, the impact of disc instabilities is proportional to the amount of stellar mass moved from the disc to the bulge (to get the disc back to stability). The actual implementation of disc instabilities in gaea, i.e. transferring from the disc to the bulge just the amount of stars required to restore disc stability, is rather conservative and possibly too simplistic, as it predicts very frequent small mass transfers. These correspond to small low-J gas flows in f06-gaea, but too many disc instability episodes in hq11-gaea. The relative importance of disc instabilities on the galaxy evolution is still a long standing issue in many theoretical models (see e.g. De Lucia et al., 2011): alternative approaches have been used in different galaxy evolution models but it is currently unclear which is the most realistic way to model the fate of an unstable disc (i.e. the corresponding mass and energy transfers).
BH accretion and AGN-driven outflows represent a key ingredient in modern models of galaxy formation and evolution. These models provide relevant insight for the physical interpretation of the observed frequency and properties of gaseous outflows, in and around AGN host galaxies, that have become available thanks to the advent of instruments, like the Atacama Large Millimeter Array (ALMA) and the Multi Unit Spectroscopic Explorer (MUSE) on the Very Large Telescope (VLT). These, together with next generation instruments like the Enhanced Resolution Imager and Spectrograph (ERIS) on VLT, allow detailed spectro-imaging of multiple gas components, down to pc scale in nearby galaxies, and kpc scale at redshift of , and revealed the ubiquitous nature of the outflows in AGN host galaxies (see e.g. Shimizu et al., 2019; Förster Schreiber et al., 2019; Feruglio et al., 2020).
Acknowledgements
FF thanks Angela Bongiorno, Anna Gallazzi, Emanuele Giallongo, Elisabeta Lusso, Andrea Merloni, Alex Saro and Stefano Zibetti for useful discussions and their help in a better understanding of the different facets of data analysis. FF, NM, FF and CF acknowledge support from PRIN MIUR project “Black Hole winds and the Baryon Life Cycle of Galaxies: the stone-guest at the galaxy evolution supper”, contract 2017-PH3WAT. MH acknowlegdes financial support from the Carlsberg Foundation via a “Semper Ardens” grant (CF15-0384).FS acknowledges partial support from a Leverhulme Trust Research Fellowship. We also acknowledge the computing centre of INAF-OATs, under the coordination of the CHIPP project (Taffoni et al., 2020), for the availability of computing resources and support.
Data Availability
An introduction to gaea, a list of our recent work, as well as datafile containing published model predictions, can be found at http://adlibitum.oats.inaf.it/delucia/GAEA/
References
- Arora et al. (2019) Arora N., Fossati M., Fontanot F., Hirschmann M., Wilman D. J., 2019, MNRAS, 489, 1606
- Barai et al. (2014) Barai P., Viel M., Murante G., Gaspari M., Borgani S., 2014, MNRAS, 437, 1456
- Bischetti et al. (2017) Bischetti M., et al., 2017, A&A, 598, A122
- Boco et al. (2020) Boco L., Lapi A., Danese L., 2020, ApJ, 891, 94
- Bower et al. (2006) Bower R. G., Benson A. J., Malbon R., Helly J. C., Frenk C. S., Baugh C. M., Cole S., Lacey C. G., 2006, MNRAS, 370, 645
- Boylan-Kolchin et al. (2009) Boylan-Kolchin M., Springel V., White S. D. M., Jenkins A., Lemson G., 2009, MNRAS, 398, 1150
- Brennan et al. (2018) Brennan R., Choi E., Somerville R. S., Hirschmann M., Naab T., Ostriker J. P., 2018, ApJ, 860, 14
- Buchner et al. (2015) Buchner J., et al., 2015, ApJ, 802, 89
- Choi et al. (2017) Choi E., Ostriker J. P., Naab T., Somerville R. S., Hirschmann M., Núñez A., Hu C.-Y., Oser L., 2017, ApJ, 844, 31
- Churazov et al. (2005) Churazov E., Sazonov S., Sunyaev R., Forman W., Jones C., Böhringer H., 2005, MNRAS, 363, L91
- Cresci et al. (2015) Cresci G., et al., 2015, ApJ, 799, 82
- Croton et al. (2006) Croton D. J., et al., 2006, MNRAS, 365, 11
- Davé et al. (2019) Davé R., Anglés-Alcázar D., Narayanan D., Li Q., Rafieferantsoa M. H., Appleby S., 2019, MNRAS, 486, 2827
- De Lucia & Blaizot (2007) De Lucia G., Blaizot J., 2007, MNRAS, 375, 2
- De Lucia et al. (2011) De Lucia G., Fontanot F., Wilman D., Monaco P., 2011, MNRAS, 414, 1439
- De Lucia et al. (2014) De Lucia G., Tornatore L., Frenk C. S., Helmi A., Navarro J. F., White S. D. M., 2014, MNRAS, 445, 970
- De Lucia et al. (2019) De Lucia G., Hirschmann M., Fontanot F., 2019, MNRAS, 482, 5041
- Decarli et al. (2010) Decarli R., Falomo R., Treves A., Kotilainen J. K., Labita M., Scarpa R., 2010, MNRAS, 402, 2441
- Delvecchio et al. (2020) Delvecchio I., et al., 2020, ApJ, 892, 17
- Di Matteo et al. (2003) Di Matteo T., Croft R. A. C., Springel V., Hernquist L., 2003, ApJ, 593, 56
- Di Matteo et al. (2005) Di Matteo T., Springel V., Hernquist L., 2005, Nature, 433, 604
- Fabian (1999) Fabian A. C., 1999, MNRAS, 308, L39
- Fanidakis et al. (2012) Fanidakis N., et al., 2012, MNRAS, 419, 2797
- Feruglio et al. (2010) Feruglio C., Maiolino R., Piconcelli E., Menci N., Aussel H., Lamastra A., Fiore F., 2010, A&A, 518, L155
- Feruglio et al. (2015) Feruglio C., et al., 2015, A&A, 583, A99
- Feruglio et al. (2020) Feruglio C., Fabbiano G., Bischetti M., Elvis M., Travascio A., Fiore F., 2020, ApJ, 890, 29
- Fiore et al. (2012) Fiore F., et al., 2012, A&A, 537, A16
- Fiore et al. (2017) Fiore F., et al., 2017, A&A, 601, A143
- Fontanot et al. (2006) Fontanot F., Monaco P., Cristiani S., Tozzi P., 2006, MNRAS, 373, 1173
- Fontanot et al. (2011) Fontanot F., Pasquali A., De Lucia G., van den Bosch F. C., Somerville R. S., Kang X., 2011, MNRAS, 413, 957
- Fontanot et al. (2015) Fontanot F., Monaco P., Shankar F., 2015, MNRAS, 453, 4112
- Fontanot et al. (2017a) Fontanot F., De Lucia G., Hirschmann M., Bruzual G., Charlot S., Zibetti S., 2017a, MNRAS, 464, 3812
- Fontanot et al. (2017b) Fontanot F., Hirschmann M., De Lucia G., 2017b, ApJ, 842, L14
- Fontanot et al. (2018) Fontanot F., De Lucia G., Xie L., Hirschmann M., Bruzual G., Charlot S., 2018, MNRAS, 475, 2467
- Förster Schreiber et al. (2019) Förster Schreiber N. M., et al., 2019, ApJ, 875, 21
- Graham & Scott (2015) Graham A. W., Scott N., 2015, ApJ, 798, 54
- Granato et al. (2004) Granato G. L., De Zotti G., Silva L., Bressan A., Danese L., 2004, ApJ, 600, 580
- Habouzit et al. (2019) Habouzit M., et al., 2019, MNRAS, 484, 4413
- Häring & Rix (2004) Häring N., Rix H., 2004, ApJ, 604, L89
- Hasinger et al. (2005) Hasinger G., Miyaji T., Schmidt M., 2005, A&A, 441, 417
- Henriques et al. (2013) Henriques B. M. B., White S. D. M., Thomas P. A., Angulo R. E., Guo Q., Lemson G., Springel V., 2013, MNRAS, 431, 3373
- Hirschmann et al. (2012) Hirschmann M., Somerville R. S., Naab T., Burkert A., 2012, MNRAS, 426, 237
- Hirschmann et al. (2014) Hirschmann M., Dolag K., Saro A., Bachmann L., Borgani S., Burkert A., 2014, MNRAS, 442, 2304
- Hirschmann et al. (2016) Hirschmann M., De Lucia G., Fontanot F., 2016, MNRAS, 461, 1760
- Hopkins & Quataert (2011) Hopkins P. F., Quataert E., 2011, MNRAS, 415, 1027
- Hopkins et al. (2006) Hopkins P. F., Hernquist L., Cox T. J., Di Matteo T., Robertson B., Springel V., 2006, ApJS, 163, 1
- Hopkins et al. (2007) Hopkins P. F., Richards G. T., Hernquist L., 2007, ApJ, 654, 731
- Inayoshi et al. (2016) Inayoshi K., Haiman Z., Ostriker J. P., 2016, MNRAS, 459, 3738
- Jiang et al. (2019) Jiang Y.-F., Stone J. M., Davis S. W., 2019, ApJ, 880, 67
- Kaiser & Binney (2003) Kaiser C. R., Binney J., 2003, MNRAS, 338, 837
- Katsianis et al. (2017) Katsianis A., et al., 2017, MNRAS, 472, 919
- Kauffmann & Haehnelt (2000) Kauffmann G., Haehnelt M., 2000, MNRAS, 311, 576
- Kelly & Shen (2013) Kelly B. C., Shen Y., 2013, ApJ, 764, 45
- Kormendy & Ho (2013) Kormendy J., Ho L. C., 2013, ARA&A, 51, 511
- La Franca et al. (2005) La Franca F., et al., 2005, ApJ, 635, 864
- Lamastra et al. (2010) Lamastra A., Menci N., Maiolino R., Fiore F., Merloni A., 2010, MNRAS, 405, 29
- Lapi et al. (2006) Lapi A., Shankar F., Mao J., Granato G. L., Silva L., De Zotti G., Danese L., 2006, ApJ, 650, 42
- Magorrian et al. (1998) Magorrian J., et al., 1998, AJ, 115, 2285
- Marconi et al. (2004) Marconi A., Risaliti G., Gilli R., Hunt L. K., Maiolino R., Salvati M., 2004, MNRAS, 351, 169
- Marsden et al. (2020) Marsden C., Shankar F., Ginolfi M., Zubovas K., 2020, Frontiers in Physics, 8, 61
- Marulli et al. (2008) Marulli F., Bonoli S., Branchini E., Moscardini L., Springel V., 2008, MNRAS, 385, 1846
- McConnell & Ma (2013) McConnell N. J., Ma C.-P., 2013, ApJ, 764, 184
- Menci et al. (2008) Menci N., Fiore F., Puccetti S., Cavaliere A., 2008, ApJ, 686, 219
- Menci et al. (2019) Menci N., Fiore F., Feruglio C., Lamastra A., Shankar F., Piconcelli E., Giallongo E., Grazian A., 2019, ApJ, 877, 74
- Monaco & Fontanot (2005) Monaco P., Fontanot F., 2005, MNRAS, 359, 283
- Monaco et al. (2007) Monaco P., Fontanot F., Taffoni G., 2007, MNRAS, 375, 1189
- Mori et al. (2002) Mori M., Ferrara A., Madau P., 2002, ApJ, 571, 40
- Mutlu-Pakdil et al. (2016) Mutlu-Pakdil B., Seigar M. S., Davis B. L., 2016, ApJ, 830, 117
- Nelson et al. (2018) Nelson D., et al., 2018, MNRAS, 475, 624
- Pacucci et al. (2017) Pacucci F., Natarajan P., Volonteri M., Cappelluti N., Urry C. M., 2017, ApJ, 850, L42
- Planck Collaboration XVI (2014) Planck Collaboration XVI 2014, A&A, 571, A16
- Romeo & Mogotsi (2018) Romeo A. B., Mogotsi K. M., 2018, MNRAS, 480, L23
- Rosas-Guevara et al. (2016) Rosas-Guevara Y., Bower R. G., Schaye J., McAlpine S., Dalla Vecchia C., Frenk C. S., Schaller M., Theuns T., 2016, MNRAS, 462, 190
- Sadowski & Gaspari (2017) Sadowski A., Gaspari M., 2017, MNRAS, 468, 1398
- Schulze et al. (2015) Schulze A., et al., 2015, MNRAS, 447, 2085
- Shankar et al. (2013) Shankar F., Weinberg D. H., Miralda-Escudé J., 2013, MNRAS, 428, 421
- Shankar et al. (2016) Shankar F., et al., 2016, MNRAS, 460, 3119
- Shankar et al. (2019a) Shankar F., et al., 2019a, Nature Astronomy, p. 503
- Shankar et al. (2019b) Shankar F., et al., 2019b, MNRAS, 485, 1278
- Shimizu et al. (2019) Shimizu T. T., et al., 2019, MNRAS, 490, 5860
- Sijacki et al. (2015) Sijacki D., Vogelsberger M., Genel S., Springel V., Torrey P., Snyder G. F., Nelson D., Hernquist L., 2015, MNRAS, 452, 575
- Silk & Rees (1998) Silk J., Rees M. J., 1998, A&A, 331, L1
- Somerville et al. (2001) Somerville R. S., Primack J. R., Faber S. M., 2001, MNRAS, 320, 504
- Somerville et al. (2008) Somerville R. S., Hopkins P. F., Cox T. J., Robertson B. E., Hernquist L., 2008, MNRAS, 391, 481
- Sparre et al. (2015) Sparre M., et al., 2015, MNRAS, 447, 3548
- Springel et al. (2005) Springel V., et al., 2005, Nature, 435, 629
- Taffoni et al. (2020) Taffoni G., Becciani U., Garilli B., Maggio G., Pasian F., Umana G., Smareglia R., Vitello F., 2020, arXiv e-prints, p. arXiv:2002.01283
- Takeo et al. (2019) Takeo E., Inayoshi K., Ohsuga K., Takahashi H. R., Mineshige S., 2019, MNRAS, 488, 2689
- Tsuzuki et al. (2006) Tsuzuki Y., Kawara K., Yoshii Y., Oyabu S., Tanabé T., Matsuoka Y., 2006, ApJ, 650, 57
- Ueda et al. (2014) Ueda Y., Akiyama M., Hasinger G., Miyaji T., Watson M. G., 2014, ApJ, 786, 104
- Umemura (2001) Umemura M., 2001, ApJ, 560, L29
- Valiante et al. (2016) Valiante R., Schneider R., Volonteri M., Omukai K., 2016, MNRAS, 457, 3356
- Vietri et al. (2018) Vietri G., et al., 2018, A&A, 617, A81
- Volonteri (2012) Volonteri M., 2012, Science, 337, 544
- Volonteri et al. (2011) Volonteri M., Natarajan P., Gültekin K., 2011, ApJ, 737, 50
- Volonteri et al. (2016) Volonteri M., Dubois Y., Pichon C., Devriendt J., 2016, MNRAS, 460, 2979
- Wang et al. (2008) Wang J., De Lucia G., Kitzbichler M. G., White S. D. M., 2008, MNRAS, 384, 1301
- Weinberger et al. (2018) Weinberger R., et al., 2018, MNRAS, 479, 4056
- Xie et al. (2017) Xie L., De Lucia G., Hirschmann M., Fontanot F., Zoldan A., 2017, MNRAS, 469, 968
- Xie et al. (2020) Xie L., De Lucia G., Hirschmann M., Fontanot F., 2020, arXiv e-prints, p. arXiv:2003.12757
- Zoldan et al. (2017) Zoldan A., De Lucia G., Xie L., Fontanot F., Hirschmann M., 2017, MNRAS, 465, 2236
- Zoldan et al. (2018) Zoldan A., De Lucia G., Xie L., Fontanot F., Hirschmann M., 2018, MNRAS, 481, 1376
- Zoldan et al. (2019) Zoldan A., De Lucia G., Xie L., Fontanot F., Hirschmann M., 2019, MNRAS, 487, 5649
- de Nicola et al. (2019) de Nicola S., Marconi A., Longo G., 2019, MNRAS, 490, 600
Appendix A Effect on global properties of galaxy populations
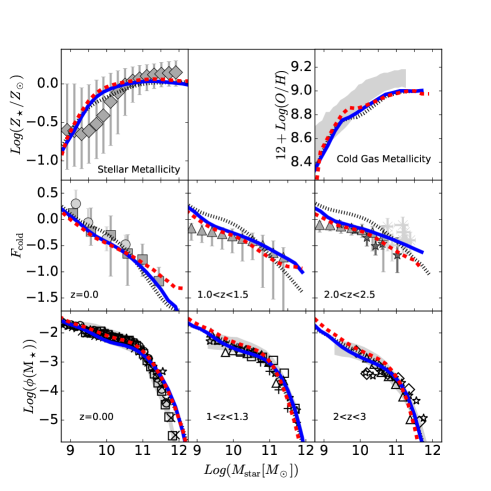
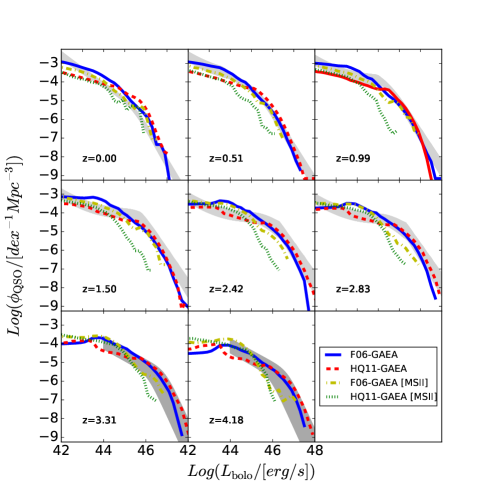
In this appendix we briefly discuss the effect of the different BH accretion schemes on the overall galaxy properties with respect to the standard H16 run. Fig 10 shows that the main predictions of the H16 model are robust against the inclusion of improved BH accretion prescription and the QSO mode feedback. The main difference we find with respect to H16 predictions lies in the evolution of the amount of cold gas available and sSFR distributions as AGN-driven winds are able to displace a larger amount of material with respect to stellar-driven winds alone.
Appendix B Resolution Effects
In Fig. 11 we show predictions from our model realizations run on the MSII with the same parameters calibrated on the Millennium Simulation. The MSII represents a numerical experiment with the same cosmological parameters as the MS, but its smaller volume ( instead of ) allows to resolve smaller structures on the same numerical grid (the MSII has a resolution 125 times better than the MS). Fig. 11 shows that neither of the models presented in this paper achieves a good level of convergence at the faint-end of the AGN-LF. We use these results to estimate for each model a redshift-dependent luminosity limit above which we consider model predictions robust. This limit corresponds to the transition from solid to dashed line in Fig. 2.
Appendix C Alternative combinations of prescriptions
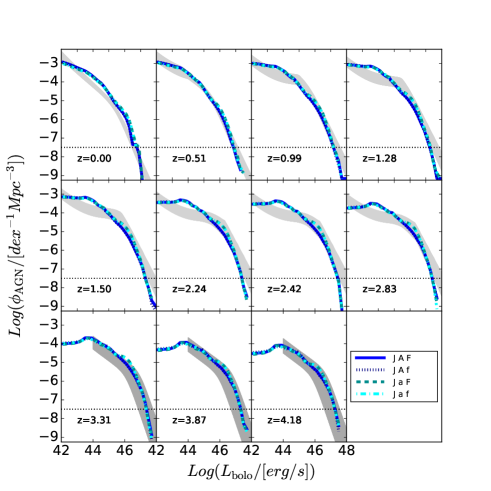
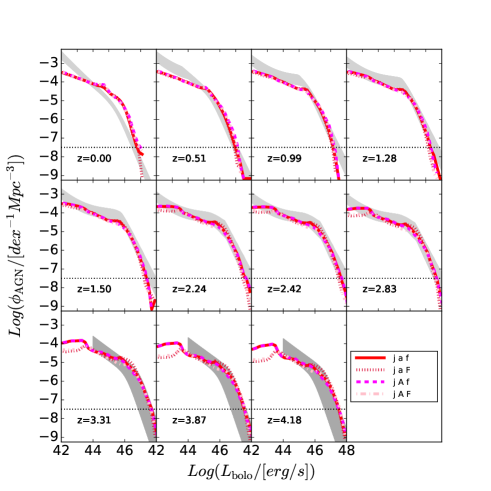
The different prescriptions we define in Sec. 2 can be combined in 8 different models. In the main paper we focus on just two of these prescriptions, and in this appendix we show that these are representative for all different choices. In the two panels of Fig. 12 we show all 8 models. We label them using capital and lower case letters, that refer to the first and second choice in the present manuscript, respectively. “J” or “j” refer to the -loss prescriptions (sec. 2.2.1 and 2.2.2); “A” and “a” to the accretion prescriptions (sec. 2.3.1 and 2.3.2); “F” and “f” to the outflow prescription (sec. 2.4.1 and 2.4.2). Within this convention f06-gaea and hq11-gaea correspond to the “J A F” and “j a f” combinations, respectively. Moreover, for all model variants we consider the same reference values of the parameters as in table 1, to highlight the effect of the different combinations. The two panels in Fig. 12 contain 4 models each, keeping constant the -loss prescription: it’s quite evident that this is the prescription that provides the largest impact on the model predictions for the AGN population.