Hot gas in galaxy halos
traced by coronal broad Lyman absorbers
Abstract
We explore the possibility to systematically study the extended, hot gaseous halos of low-redshift galaxies with Coronal Broad Ly Absorbers (CBLAs). These are weak, thermally broadenend H i absorption lines arising from the tiny fraction of neutral hydrogen that resides in the collisionally ionized, million-degree halo gas in these galaxies. Using a semi-analytic approach, we model the spatial density and temperature distribution of hot coronal gas to predict strength, spectral shape, and cross section of CBLAs as a function of galaxy-halo mass and line-of-sight impact parameter. For virial halo masses in the range log , the characteristic logarithmic CBLA H i column densities and Doppler parameters are log (H i and (H i km s-1, indicating that CBLAs represent weak, shallow spectral features that are difficult to detect. Yet, the expected number density of CBLAs per unit redshift in the above given mass range is (CBLA, implying that CBLAs have a substantial absorption cross-section. We compare the model predictions with a combined set of ultraviolet (UV) absorption-line spectra from HST/COS and HST/STIS that trace the halos of four low-redshift galaxies. We demonstrate that CBLAs already might have been detected in these spectra, but the complex multi-component structure and the limited signal-to-noise ratio (S/N) complicate the interpretation of these CBLA candidate systems. Our study suggests that CBLAs represent a very interesting absorber class that potentially will allow us to further explore the hot coronae of galaxies with UV spectral data.
Subject headings:
Galaxies: halo – galaxies: evolution – quasars: absorption lines1. Introduction
Spiral galaxies like the Milky Way are believed to be surrounded by large amounts of diffuse gas that is gravitationally bound to a galaxy’s potential well and extends to its virial radius (and beyond). The presence of this so-called circumgalactic medium (CGM) can be understood in the framework of CDM galaxy formation models (e.g., White & Frenk 1991), which predict that diffuse gas in cosmological filaments is accreted onto dark matter (DM) halos where it gains gravitational energy. The collapsed gas is shock-heated to approximately the halo virial temperature, but radiative cooling in the inner (most dense) regions will lead to the formation cold gas streams that sink into the center of the potential where the gas is transformed into stars (e.g., Maller & Bullock 2004; Fukugita & Peebles 2006). Therefore, the CGM around present-day spiral galaxies is believed to represent a substantial gas reservoir from which galaxies acquire baryons to fuel star formation.
This simple concept of galaxy formation through gas accretion is altered by the various types of feedback from active galactic nuclei (AGN), supernovae (SNe), or massive stellar winds, which deposit kinetic energy and chemically enriched material into the CGM (e.g., Strickland et al. 2004; Tüllmann et al. 2006). Also major and minor galaxy mergers can transport large amounts of cool and warm gas into the galaxies’ circumgalactic environment (e.g., Yun et al. 1994; Richter et al. 2018). As a result, the CGM is extremely multi-phase with cool and warm ( K) gas streams being embedded in hot, virialized gas halos at K, typically. Such hot gas halos often are referred to as “galactic coronae” (Spitzer 1956), in analogy to the Sun’s hot coronal gas envelope. Hydrodynamcial simulations of cosmological galaxy formation, that include the necessary physics and that have the necessary spatial resolution (e.g., van de Voort et al. 2018; Hani et al. 2019), support the above outlined complex picture of the CGM and its different phases.
Observing the low-redshift CGM in all its phases requires the involvement of ground-based and space-based telescopes in various wavelength ranges. Extended, cooler ( K), predominatly neutral gas structures in the CGM, that originate in merger events or in cooling accretion streams, may be observed using deep radio observations in the H i 21cm line. Recent 21cm surveys indicate, however, that the cross section of circumgalactic H i emission features in external galaxies is very small (Pisano et al. 2007) and most of the detected circumgalactic 21cm H i streams appear to be related to galaxy mergers (e.g., Haynes et al. 2011).
UV absorption spectroscopy of background AGN is a powerful method to study H i and metal-ion absorption of cold and warm gas in the CGM of foreground galaxies, as the UV range covers a large number of diagnostic transitions from low, intermediate and high ions of heavy elements and the Lyman series of neutral hydrogen. Over the last two decades, in particular, a large number of absorption-line studies using UV spectral data from the Space Telescope Imaging Spectrograph (STIS) and the Cosmic Origins Spectrograph, both intruments being installed on the Hubble Space Telescope (HST), have substantially improved our understanding of the nature of the diffuse circumgalactic gas component of galaxies (e.g., Borthakur et al. 2016; Burchett et al. 2019; Liang & Chen 2014; Muzahid et al. 2017; Prochaska et al. 2011, 2019; Richter et al. 2017, 2018; Prochaska et al. 2011; Tumlinson et al. 2013; Wakker & Savage 2009; Werk et al. 2013). These (and other) studies have unveiled a large complexity in the circulation processes of metal-enriched gas around galaxies, governed by infall, gas accretion, major and minor mergers, and outflows (see Tumlinson et al. 2017 for a recent review).
From all CGM gas phases, the shock-heated, hot ( K) phase is particularly difficult to be observed, owing to the very low density (log to , typically) of the gas and its high degree of ionization. X-ray continuum emission from the hot coronal plasma of external galaxies has been studied using different instruments (e.g., Bregman & Houck 1997; O’Sullivan et al. 2003; Strickland et al. 2004; Tüllmann et al. 2006; Li et al. 2008, 2016; Anderson & Bregman 2010, 2011; Anderson et al. 2016), indicating that the coronae of Milky-Way type galaxies contain of gas, typically, exceeding the baryonic mass contribution of the cooler CGM phases by almost two orders of magnitude (see also Richter 2017). For the Milky Way, also the X-ray lines of highly-ionized oxygen, O vii and O viii, represent important tracers of hot, circumgalactic gas, as they can be observed either in absorption against X-ray bright AGN or in emission (e.g., Paerels & Kahn 2003; McCammon et al. 2002; Nicastro et al. 2002; Wang et al. 2005; Williams et al. 2005; Fang et al. 2006; Miller & Bregman 2013, 2015; Hodges-Kluck, Miller & Bregman 2016; Li & Bregman 2017). These studies suggest that the hot CGM of the Milky Way has a total mass of within kpc and that the coronal gas co-rotates with the disk.
Despite the overall importance and substantial baryon budget of million-degree coronal gas around galaxies, observational data in the X-ray band are still very limited (as it takes substantial effort to get them). Unfortunately, there are no strong resonance lines from high metal ions available in the UV/optical regime that would directly trace million-degree gas in the CGM and IGM at . York & Cowie (1983) and Richter et al. (2014) discussed the possibility to use the optical intersystem lines of [Fe x] and [Fe xiv] to sample shock-heated, hot gas in the CGM and IGM. However, because of the very small oscillator strengths of these forbidden transitions, an extremely high S/N of a few thousand would be required to detect these lines in the spectra of background AGN, which is currently not feasible. As a consequence, our understanding of the physical nature and spatial distribution of the hot CGM, in particular in the outer halo near the virial radius, remains highly incomplete. In this study, we explore the possibility to use thermally broadened H i Ly absorption lines (CBLAs) as tracers for the hot CGM around galaxies.
The paper is organized as follows. In Sect. 2, we discuss the general motivation for using CBLAs as tracers of the hot gas distribution around low-redshift galaxies. In Sect. 3, we present in detail the setup of our semi-analytical model. The expected properties of CBLAs, as derived from our model, are discussed in Sect. 4. In Sect. 5, we provide four examples of CBLA candidates in archival UV data from the Cosmic Origins Spectrograph (COS) and the Space Telescope Imaging Spectrograph (STIS; both installed on the Hubble Space Telescope, HST) and compare their properties to the model predictions. We discuss and summarize our results in Sect. 6. Supplementary equations, figures, and tables are provided in the Appendix.

2. Coronal Broad Ly Absorbers
Following galaxy-formation theories (e.g., White & Frenk 1991), hot coronal gas around galaxies is expected to have temperatures close to the virial temperatures of the galaxy halos, typically a few K. At such high temperatures, the gas is almost fully ionized by collisions, with neutral hydrogen fractions . Photoionization from radiation originating in the UV background and in the host galaxies themselves is mostly relevant for cooler gas with K (see Richter et al. 2008).
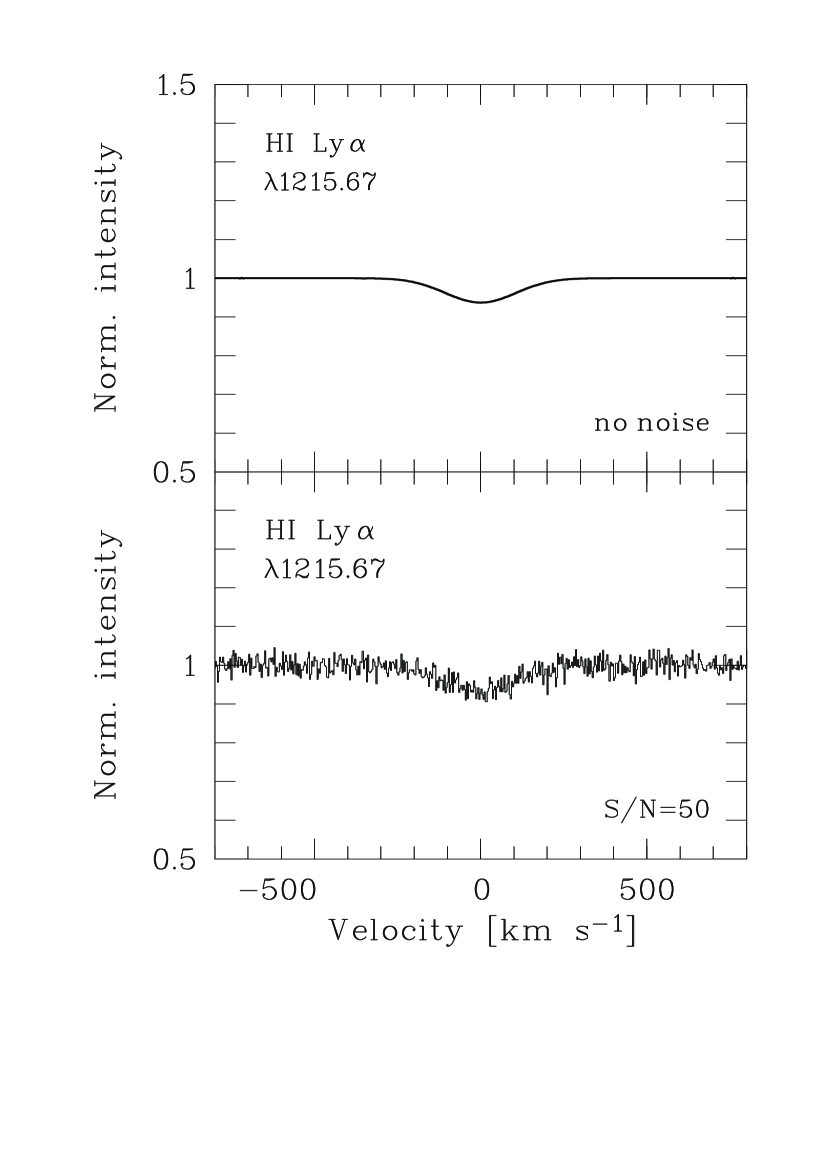
Although the neutral gas fraction in such gas is tiny, there exists a sufficient number of neutral hydrogen atoms along a sightline that passes through the hot halo of a Milky-Way type galaxy to create a detectable Ly absorption signal. The resulting so-called Broad Ly Absorber (BLA) is shallow and broad, owing to the substantial thermal line broadening caused by the high gas temperature. In the following, we denote BLAs that trace the hot coronal gas of galaxies as Coronal Broad Ly Absorbers (CBLAs). In anticipation of our modeling results, we show in Fig. 1, as an example, the spectral appearance of a CBLA that passes the hot halo of an galaxy at an impact parameter of kpc.
BLAs have been previously studied by us and other research groups to trace the missing baryons in the Warm-Hot Intergalactic Medium (WHIM; Richter et al. 2004, 2006; Prause et al. 2007; Danforth et al. 2016; Savage et al. 2011; Narayanan, Savage & Wakker 2012). Several dozen high S/N BLA candidate systems have been detected so far, implying that they arise in shock-heated gas in the most massive collapsing cosmological filaments. Hydrodynamic cosmological simulations indicate, however, that the interpretation of BLAs as tracers of the WHIM is afflicted with large systematic uncertainties, owing to the fact that large-scale gas flows and other non-thermal broadening mechanisms contribute to the observed large BLA line widths (Richter, Fang & Bryan 2006; Tepper-García et al. 2012). Also instrumental effects, such as unresolved multi-component structures, noise features, fixed-pattern artifacts as well as continuum undulations intrinsic to the AGN’s spectral energy distribution limit the diagnostic power of broad Ly features for the analysis of the WHIM.
BLAs that possibly are associated with warm/hot gas in the halos of individual galaxies (i.e., CBLA candidates) have been reported regularly in previous studies (e.g., Savage et al. 2014; Stocke et al. 2014; Johnson et al. 2017), but a systematic investigation on how such broad absorbers might be related to the hot coronal gas around their host galaxies has not been published so far. With this study, we are aiming at filling this gap.
The major advantages of analyzing circumgalactic CBLAs compared to intergalactic BLAs are that i) we know exactly where we should look for them, namely along sightlines that pass galaxies within their virial radii at radial velocities defined by these galaxies, ii) the hot gas is confined in a much smaller volume (i.e., within the virial radius of the galaxies), eliminating large-scale gas flows as line-broadening mechanism, and iii) the temperature (and thus the ionization fraction) of the collisionally ionized gas is expected to scale with galaxies’ virial mass, allowing us to predict the CBLA absorption properties for each individual galaxy/sightline pair. However, the CGM is multi-phase, and therefore the cooler (less ionized) gas phases will dominate the H i optical depth in most CGM absorbers. As a result, most CBLAs are expected to be embedded in (or hidden by) complex, multi-component H i Ly absorption systems. This aspect will be further discussed in Sect. 5, where we compare the model predictions with UV spectral data from HST/COS and HST/STIS.
3. Semi-analytic modeling of CBLAs
3.1. Model setup
In the following, we outline our strategy for modeling the expected spectral shape of CBLAs as a function of halo mass and sightline impact parameter. Throughout the paper we adopt a standard CDM cosmology with parameters , and km s-1 Mpc-1.
We assume that the hot halo gas is confined in a DM halo that is characterized by a Navarro-Frenk-White (NFW) density profile (Navarro, Frenk & White 1995; Klypin et al. 2001). After the initial collapse, the gas is shock-heated to the temperature of the virialized halo, but will cool in the inner regions (within a characteristic cooling radius, ) to become multi-phase.
We use the formalism developed by Maller & Bullock (2004; hereafter MB04), which provides analytic equations for the radial density and temperature profiles of the residual hydrostatic hot gas halo in a NFW potential assuming gas cooling and fragmentation under realistic conditions. With as radial variable, as virial halo mass, and as virial radius, the MB04 formalism therefore provides
| (1) |
for . The detailed equations for and and their derivations (from the MB04 paper) are summarized in the Appendix (equations (A1)-(A12)).
We have implemented the equations for and (equations (A11) and (A12)) in our numerial halopath code, a code developed to model the absorption properties of multi-phase halos of galaxies in different mass ranges (Richter 2012).
Theoretical studies and simulations imply that only massive halos (log ) are expected to develop collisionally ionized, coronal gas halos from gravitational collapse (e.g., Gutcke et al. 2017). However, observations suggest that also lower-mass galaxies are surrounded by warm/hot gas (e.g., Johnson et al. 2017), possibly generated and maintained by winds and outflows. Such dwarf galaxies also might give rise to CBLAs and could substantially contribute to the cosmological CBLA cross section at .
On the high-mass end, galaxies with masses log are rare and thus the cosmological cross section of their halos is small. In addition, the neutral gas fraction in the coronae of such massive galaxies are expected to be very small with extremely large thermal line widths for the resulting Ly absorption, so that no detectable CBLA signal is expected to emerge from such halos at realistic S/N ratios ( per resolution element).
Based on these considerations, we have created a set of model halos with virial halo masses in the for us relevant range log and in steps of dex. Each model halo is characterized by a radial grid of data points at 1 kpc resolution that reaches up to the virial radius.
The neutral hydrogen volume density, , in the coronal gas at radius is given by the relation
| (2) |
where denotes the neutral gas fraction. In a collisional ionization equilibrium (CIE), the neutral gas fraction in a plasma depends only on the gas temperature (i.e., it is density-independent). Following our initial work on BLAs (Richter et al. 2004), can be expressed with a polynomial in the form
| (3) |
Since and is pre-defined in each grid point from the MB04 coronal gas model, can be calculated in each point using Eq. (2) and (3).
To calculate the neutral hydrogen column density of a CBLA, (H i), along a halo sightline at impact parameter , we need to integrate along the path through the coronal gas distribution. With being the spatial coordinate along the line of sight (LOS), the integral formally can be written as
| (4) |
where we use a transformation of the integration variable in the form . In reality, we obtain (H i) in our halopath model halos by numerically integrating over all grid cells along the halo sightline. In Fig. 2 we sketch the geometric setup of our modeling approach and indicate the parameters involved.
The intrinsic width of an the resulting (H i) Ly absorption line (i.e., the CBLA) is characterized by its Doppler parameter/-value, which is composed of a thermal () and a non-thermal () component:
| (5) |
In our idealized model, we assume that in the case of CBLAs, thermal motions of the coronal gas particles dominate over other broadening mechanisms. Because and are added quadratically, we therefore ignore any contributions from non-thermal motions and assume
| (6) |
where is the mass of a hydrogen atom and is the mean coronal gas temperature along the sightline. Non-thermal motions of hot gas could be relevant for galactic outflows and merger events, which should be kept in mind when it comes to the interpretation of observed line-widths in CBLA candidate systems.
Note that in the MB04 model the coronal gas is not isothermal (because of cooling; see Appendix, Eq. A10). Each halo sightline passes the gas as at different radii, thus at different temperatures. We calculate by taking the density-weighted mean of the gas temperature in all grid points along the LOS.
In summary, the model provides (H i) and for a CBLA as a function of halo mass and impact parameter. It thus allows us to generate synthetic spectra of CBLAs for any given galaxy-halo sightline parametrized by . An example of such a synthetic spectrum is shown in Fig. 1, generated by the fitlyman software implemented in ESO/MIDAS (Fontana & Ballester 1996).
The model also allows us to systematically investigate the distribution of column densities and values for our set of MB04 model halos, as will be discussed in the following section. For comparison, we discuss in the Appendix the CBLA properties for an alternative, isothermal halo model.
It is important to keep in mind that this semi-analytic approach describes, by construction, an (over)idealized circumgalactic gas environment. Our model cannot take into account other important aspects of galaxy formation and evolution (e.g., intrinsic gas-density and -temperature variations, non-spherical halo geometries, minor and major mergers, feedback processes, cosmological environment, etc.) that potentially influence the strength and shape of broad Ly absorption arising in hot coronal gas in realistic galaxy environments. These aspects will be studied by us in a future paper, where we will use high-resolution CGM simulations to explore the spectral signatures of million-degree gas around galaxies.
4. Properties of CBLAs
4.1. Distribution of H i column densities and values
To investigate the statistical properties of the CBLAs, we have generated 2134 lines of sight passing through eleven MB04 model halos at in the mass range log (corresponding to galaxy luminosities in the range ) at impact parameters (in steps of 1 kpc). Note that the virial radius scales with as given in Eq. (A1).
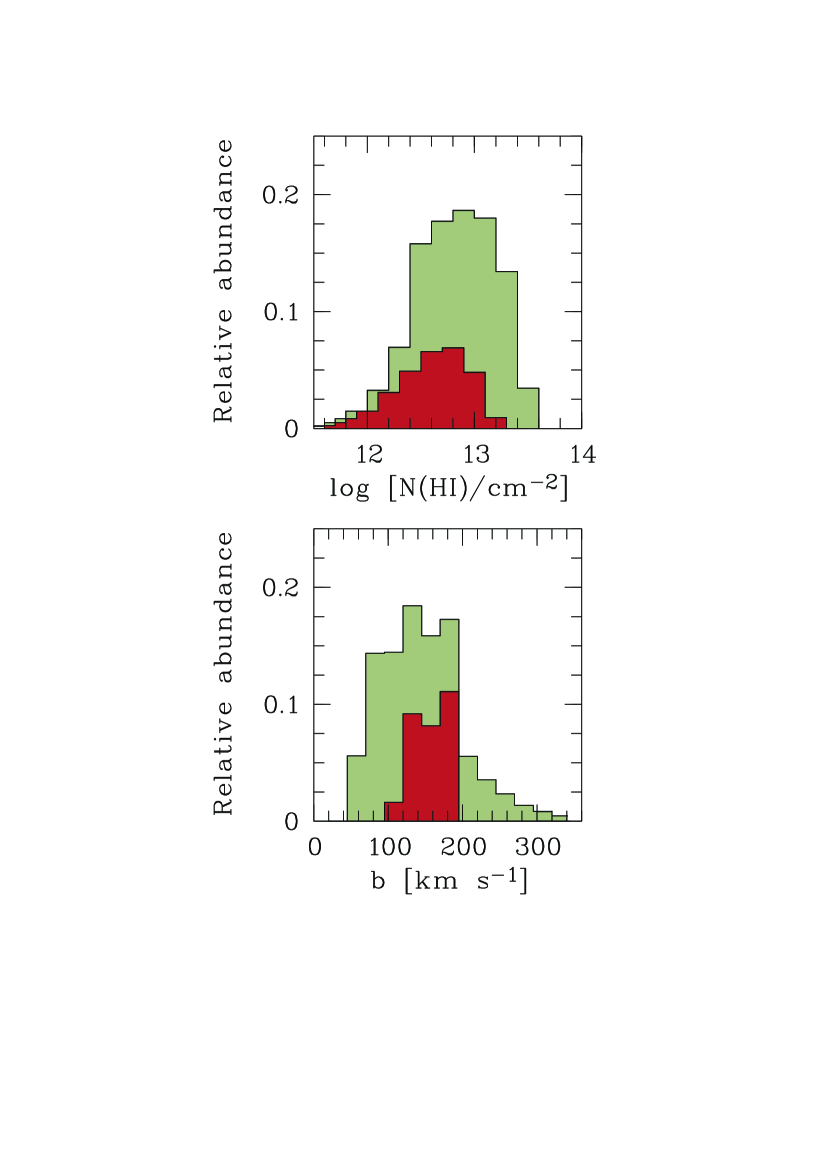
In the upper panel of Fig. 3, we show the distribution of logarithmic H i column densities for all these 2134 sightlines (green-shaded area) in bins of 0.2 dex. All H i column densities lie in the range log (H i, with 84 percent of the absorbers having log (H i. The distribution peaks at log (H i, a value that can be regarded as “characteristic” for CBLAs. The red-shaded area displays the H i distribution of a sub-sample of 645 CBLAs that trace the outer hot halos beyond the cooling radius (i.e., , Eq. A10). Here, the column densities are generally smaller compared to central sightlines due to the lower gas densities in the outer halos and the shorter absorption pathlengths at larger . This effect also explains the wing in the distribution at log (H i.
In the lower panel of Fig. 3, we show the distribution of H i values for the total sample of 2134 absorbers (green-shaded area) and the CBLA subsample with (red-shaded area). For the total sample, all values are between 50 and 350 km s-1, with 82 percent of the absorbers having km s-1. Here, the distribution peaks at a characteristic value of km s-1. The -value distribution for the sub-sample does not extend beyond km s-1. This is because the values km s-1 originate in absorbers in the inner halos at , where the CGM is assumed to be multiphase due to enhanced cooling. Following MB04, the residual hot gas in the inner halo will change its pressure adiabatically to adjust to a hydrostatic eqilibrium. This will lead to a temperature increase for the inner hot halo at , with increasing for decreasing with by a factor of a few compared to the initial hot halo temperature at , where the gas is assumed to be isothermal. As a consequence, CBLAs arising at small impact parameters trace hotter gas than those at larger impact parameters, leading to particularly broad lines with large values.
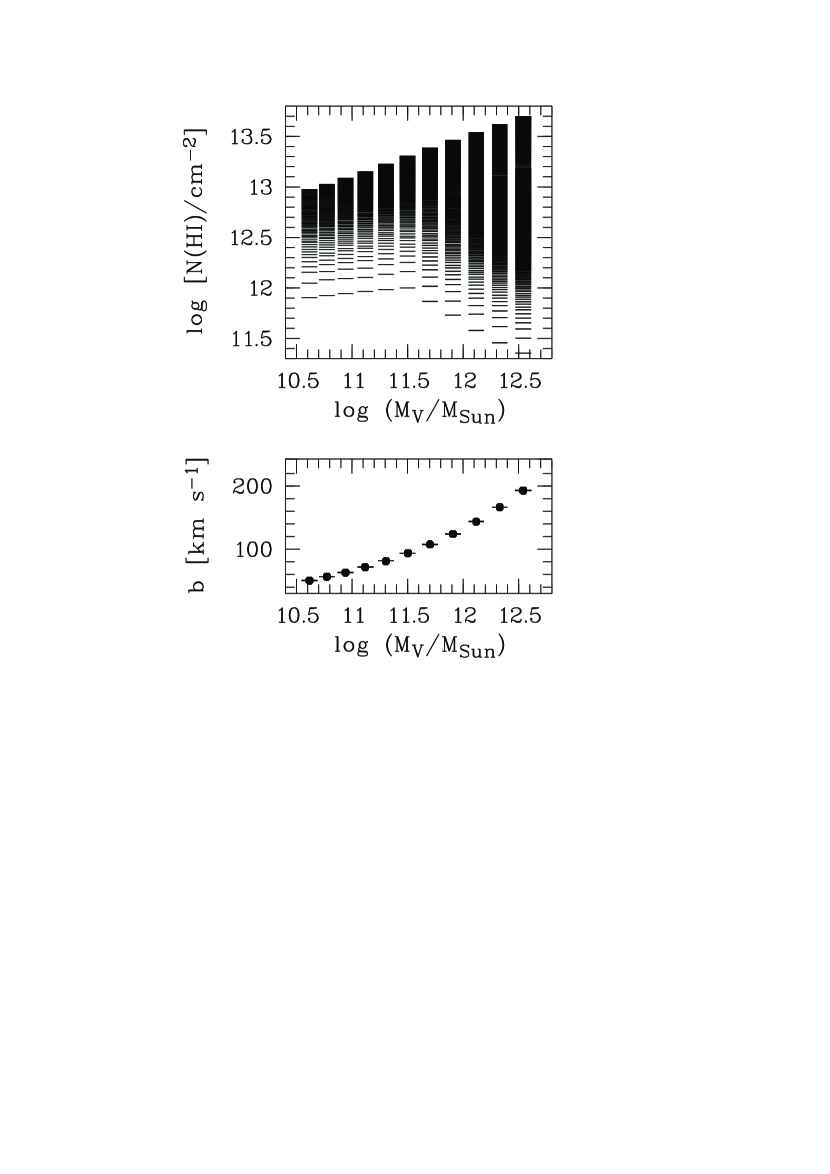
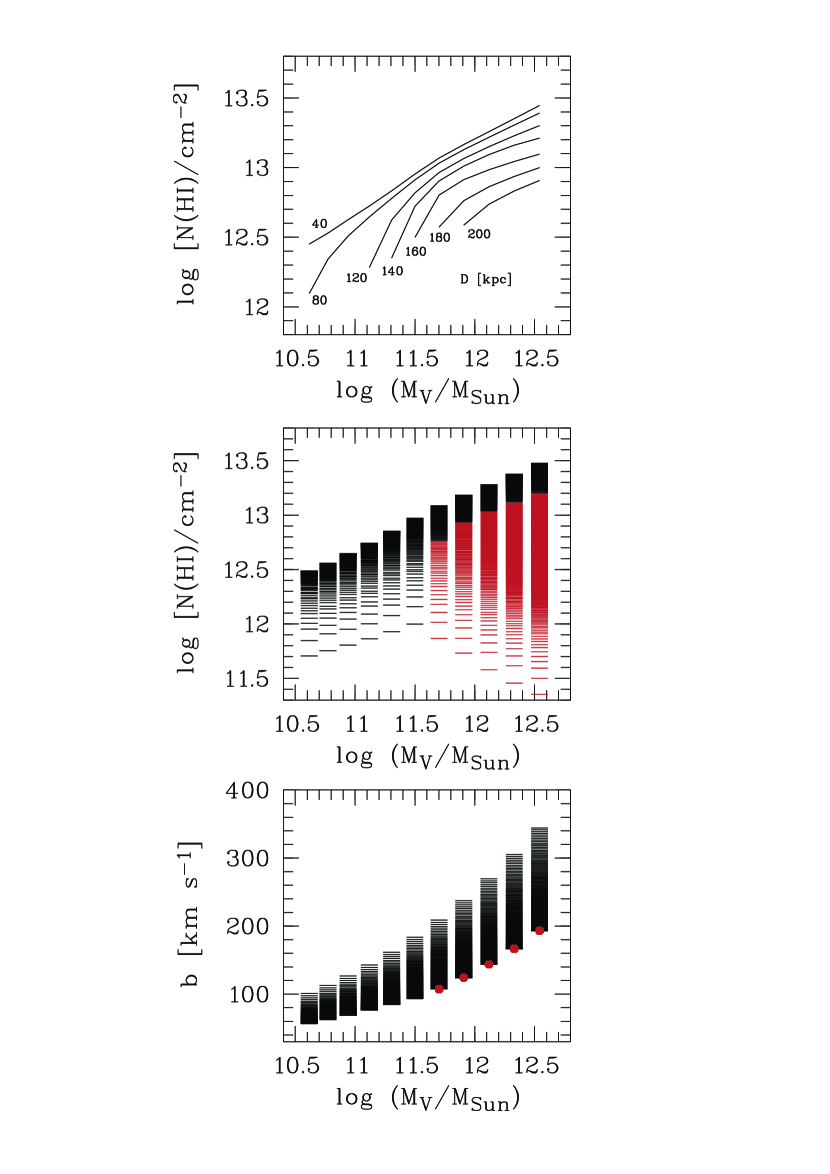
In Fig. 4, we show the distributions of H i column densities and values as function of halo mass, . In the upper panel, we display lines of constant impact paramter in the /(H i) parameter space. This figure shows that only the central ( kpc) sightlines of massive (log ) galaxies produce CBLAs with substantial H i column densites above log (H i. The middle and lower panel in Fig. 4 show for each model halo what range in H i column density and value is covered by CBLAs, when the impact parameter is varied from (in steps of 1 kpc, horizontal bars). The red bars indicate sightlines passing the outer halo beyond the cooling radius (i.e., ). Fig. 4 may be used to predict the strength of a CBLA for a given halo sightline with known impact parameter and galaxy luminosity (from which can be estimated). A table, that lists the expected values for log (H i) and (H i) for all values of and , can be made available on request.
| No. | log | log | log | ||||
|---|---|---|---|---|---|---|---|
| [kpc] | [kpc] | ||||||
| 1 | 10.62 | 0.10 | 86 | 86 | 9.85 | 8.27 | 0.03 |
| 2 | 10.77 | 0.16 | 97 | 97 | 10.00 | 8.61 | 0.04 |
| 3 | 10.94 | 0.25 | 111 | 111 | 10.17 | 8.97 | 0.06 |
| 4 | 11.12 | 0.40 | 127 | 127 | 10.35 | 9.33 | 0.09 |
| 5 | 11.31 | 0.63 | 147 | 147 | 10.54 | 9.72 | 0.15 |
| 6 | 11.50 | 1.00 | 170 | 170 | 10.73 | 10.11 | 0.24 |
| 7 | 11.70 | 1.58 | 199 | 164 | 10.93 | 10.48 | 0.35 |
| 8 | 11.91 | 2.51 | 233 | 159 | 11.14 | 10.81 | 0.46 |
| 9 | 12.11 | 3.98 | 274 | 153 | 11.35 | 11.11 | 0.58 |
| 10 | 12.33 | 6.31 | 322 | 147 | 11.56 | 11.40 | 0.69 |
| 11 | 12.54 | 10.00 | 379 | 142 | 11.77 | 11.67 | 0.79 |
Note. — a Virial halo mass, in solar units; b galaxy luminosity; c virial radius; d cooling radius (see Appendix, Eq. A10); e total baryon mass, in solar units; f coronal baryon mass, in solar units; g coronal baryonic mass fraction.
4.2. On the detectability of CBLAs
Figs. 3 and 4 indicate that CBLAs span a broad range in (H i) and . Detecting broad, shallow absorption features in UV data with limited S/N is challenging, however. The detection significance depends on both the depth and the width of the absorption as well as on the local S/N. In our previous study (Richter et al. 2006), we have defined an empirical criterion for the detectability of a BLA in the form:
| (7) |
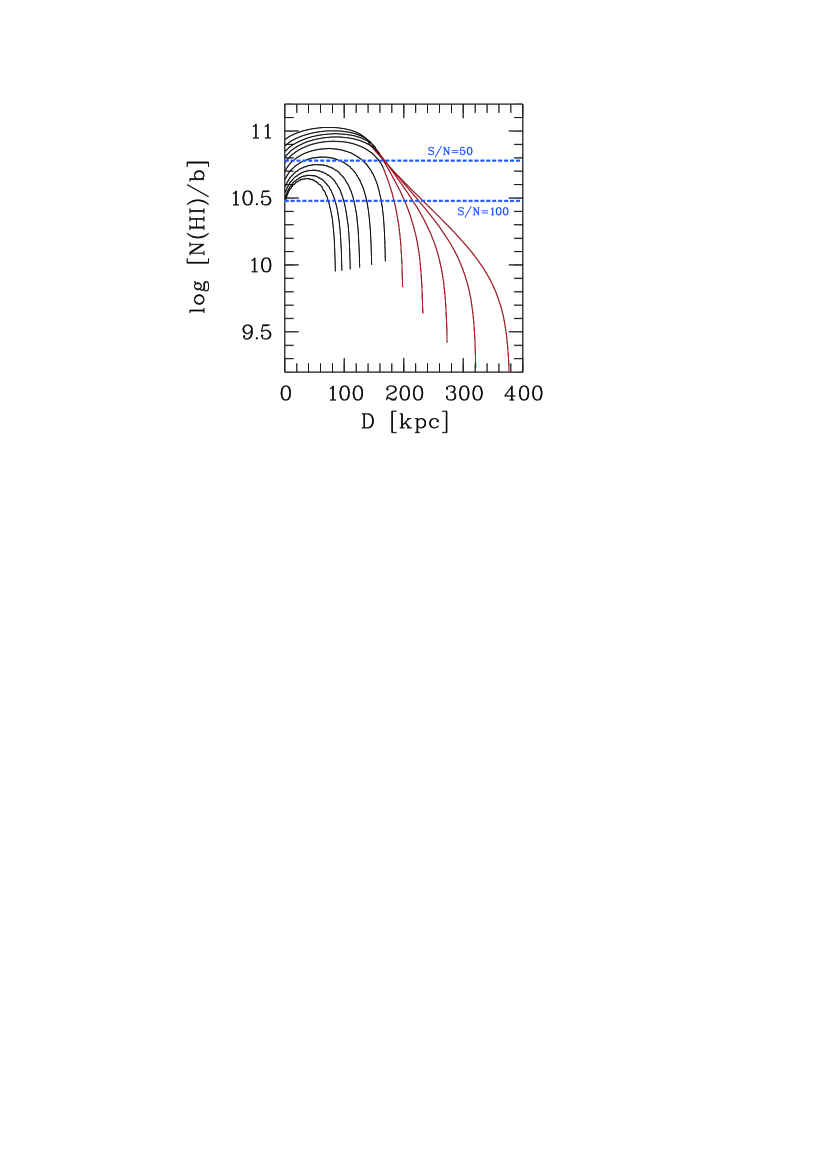
Here, (S/N)res is the local S/N per resolution element. For a “typical” CBLA having log (H i and (H i km s-1 (log ), this implies that a S/N of per resolution element is required to securely detect such an absorber. This value corresponds to a central absorption depth of in the CBLA line (see Appendix, Eq. A16). Combining the statistics for and , we find that 80 percent of the CBLAs have log . Since for each halo, (H i) (and thus ) decreases with increasing impact parameter due to the decreasing path length through the halo, CBLAs that trace the isothermal, hot halo component at are particularly difficult to detect. In Fig. 5 we show, how log varies with for the eleven model halos and out to which impact parameter CBLAs can be detected at (S/N) and (blue horizontal lines).
Because the strongest CBLAs sample the inner regions of galaxy halos, they are expected to blend with narrow (and predominantly stronger) H i features stemming from the warm/cool ( K) CGM that traces infalling and outflowing gaseous material. Therefore, many CBLAs may be hidden in multi-component H i Ly profiles and may not be readily visibile (and may not be a meaningful criterion for their detection). In such cases, careful profile-fitting of H i and associated metal-ions that trace the K gas phases is required to search for evidence of broad, shallow H i components that might be related to hot, coronal gas components in multi-phase CGM absorbers. Examples for such multi-phase CGM absorbers possibly containing a CBLA will be presented in Sect. 5.
4.3. Hot gas mass traced by CBLAs
The total hot gas mass traced by CBLAs can be determined by integrating for each model halo the individual coronal mass shells in our halopath code from inside out (from to ), where we assume an average mass per particle of , accounting for the presence of helium and heavy elements in the gas.
In Table 1, we summarize for the different galaxy mass bins the resulting logarithmic coronal gas masses (7th column), the baryon fraction in the corona (8th column), as well as other model parameters (such as virial radius, expected galaxy luminosity, and cooling radius).
The baryon fraction in the coronal gas increases with increasing mass up to a value of percent. Therefore, these models underline that the hot CGM represents a major (eventually dominant) baryon reservoir in massive galaxies that should be constrained by observations to test galaxy-formation models.
4.4. Cosmological cross section of CBLAs
If we consider all galaxies in the mass range log () at , what would be the absorption cross section of CBLAs produced by their hot halos?
The absorption cross section of intervening absorbers usually is characterized by the number density of absorbers per unit redshift, . The expected number density of CGM absorbers depends on both the space density of galaxies, , and the projected geometrical cross section, , of the CGM phase traced (see Richter et al. 2016, hereafter R16). In case of CBLAs, which trace the hot halo gas out to the virial radius at hundred percent covering fraction, the geometrical cross section is simply , so that the number density of absorbers per unit redshift can be expressed as
| (8) |
Here, is the Hubble parameter, defined as (assuming a matter-dominated flat Universe with a cosmological constant).
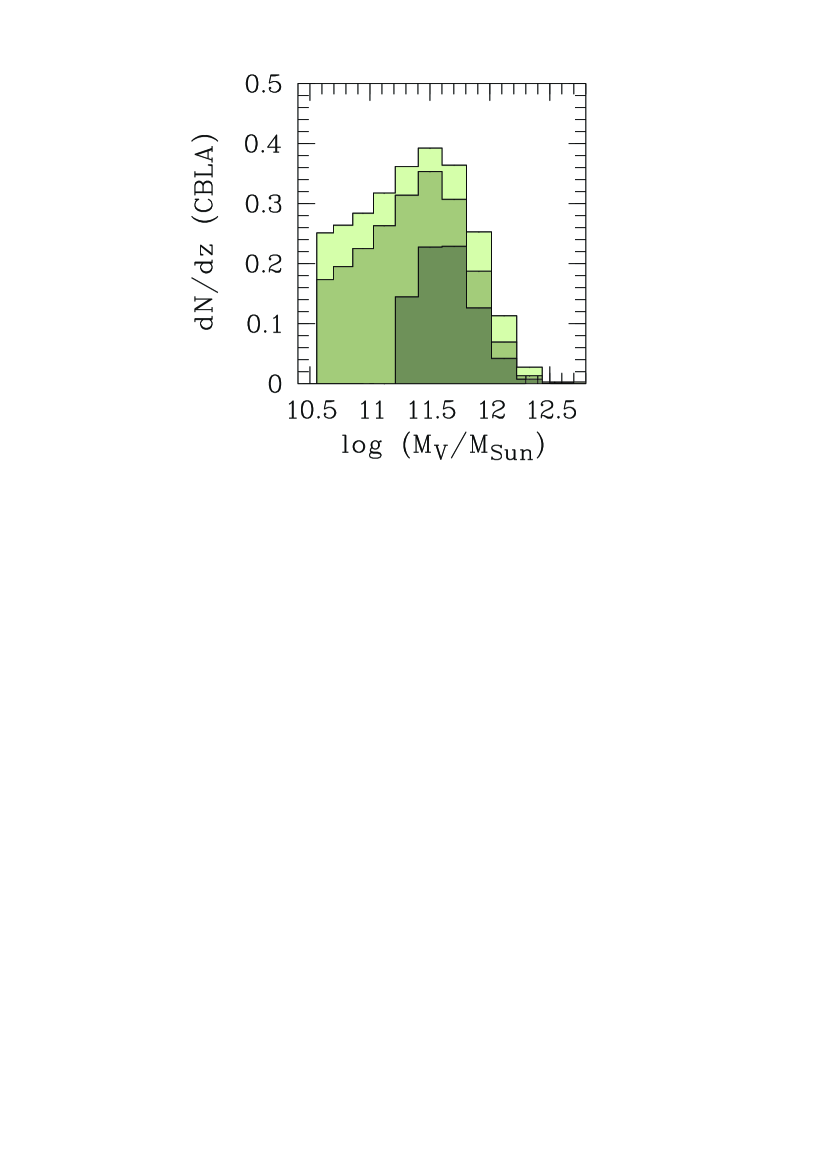
Eq. (8) has to be considered for each galaxy mass bin, , separately, because the galaxy space density, , and the virial radius, , both are functions of . In the Appendix, we show how can be obtained from the local galaxy luminosity function (B2) and how and are related (B3). In Fig. 6, the expected (CBLA) is show as a function of for the eleven mass bins in our galaxy model sample. The light green area indicates the distribution of (CBLA) for an infinte S/N, the intermediate green area shows the distribution for a S/N per resolution element of 100, the dark green area assumes a S/N of 50. If we integrate over these distributions, we obtain total number densities per units redshift of (CBLA), (CBLA), and (CBLA) for the halos in the adopted mass range log .
5. Confronting theory with observations
5.1. CBLA search strategy
Our predictions about the strength, spectral shape, and frequency of CBLAs at as potential tracers of shock-heated, hot halo gas can be tested with existing UV absorption-line data. For this, we are particularly interested in QSO sightlines that are known to pass the halos of nearby massive galaxies within their virial radii and for which good S/N UV spectral data are available.
We have searched for CBLA candidate systems in HST archival QSO data that we have used in previous studies (Richter et al. 2009, 2016, 2017; Herenz et al. 2013) along galaxy halo sightlines that have been observed with both COS and STIS. This allows us to assess the significance of CBLA candidates in two independent observational data sets from different HST instruments. We used the galaxy data collected for our 2016 CGM survey (R16) together with recent literature data (Stocke et al. 2013; Keeney et al. 2018) and have compiled a list of galaxy/sightline pairs with impact parameters for galaxies with known luminosities and with existing COS (STIS) spectra that have a S/N () per resolution element.
For the identification of a CBLA candidate system, we require simultaneous (but independent) evidence for a broad, shallow absorption feature in both the COS and STIS data within km s-1 of the redshift of the intervening galaxy. The COS data used here (G130M grating) have a spectral resolution of km s-1 FWHM, while the resolution of the STIS data (E230M grating) is km s-1 FWHM.
As we will demonstrate below, the presence of broad, shallow Ly absorption embedded in a multi-component CGM absorber is not always immediately evident from a by-eye inspection. For most cases, it requires a careful modeling of the cooler H i absorption components (tracing the K CGM) to identify broad absorption components in the model residuals. Even then, however, the fit/model solutions for complex multi-component CGM absorbers are never unique, as the modeling bases on a variety of assumptions. Most critical for the identification of shallow, broad features is the choice of the local QSO continuum, which may have local undulations that are difficult to be accounted for. In addition, an apparently broad absorption component may be composed of several, narrow components that are unresolved in the COS/STIS spectral data, in particular, if the S/N is only moderate or low (see also Richter et al. 2006, their Fig. 1). A standard procedure in the modeling of multi-component absorption-line systems is to assign high metal ions (e.g., O vi, C iv) to broad H i components and thereby tie the velocity-component structure for these species, assuming that they are co-spatial. However, given the inhomogeneous distribution of the multiple gas phases in the CGM and a potentially non-uniform metallicity distribution in the gas, this assumption my not be justified in general.
Notwithstanding these restrictions, we have started to re-model the spectral shape of multi-component Ly CGM absorbers detected with STIS and COS data, all of them being well-known multi-phase CGM absorption systems analyzed in previous studies. For the component modeling we used Voigt profiles convolved with the appropriate STIS/COS line-spread functions. The modeling provides radial velocities (or redshifts), H i column densities, and values for each absorption component (see Richter et al. 2013 for a detailed description of the modeling code).
In this paper, we present four typical CBLA candidate systems from this search and discuss them in detail. The modeling results for these four systems are summarized in Table 2. The full survey of CBLAs will be presented in a forthcoming paper.
5.2. The CBLA candidate at towards RX J 1230.8+0115
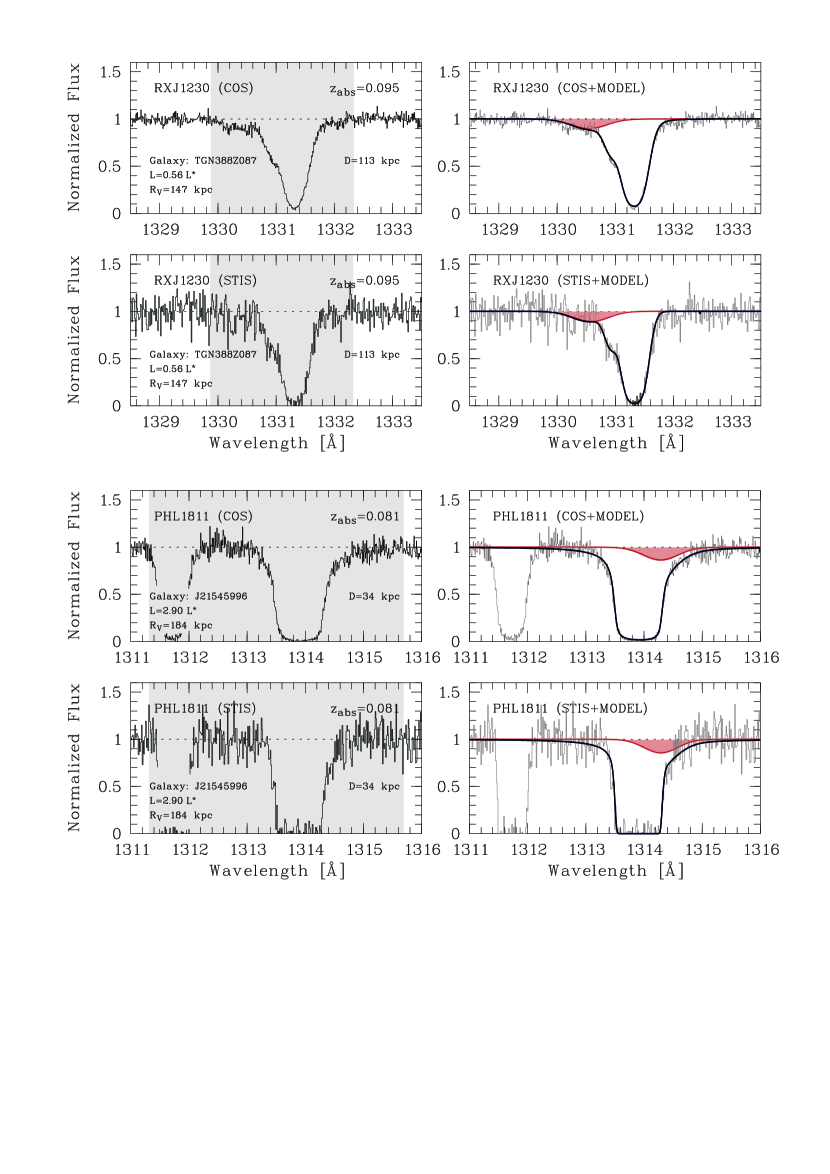
The sightline towards the Seyfert 1 galaxy RX J 1230.8+0115 () passes the galaxy 2dFGRS-TGN388Z087 () at an impact parameter of kpc (Keeney et al. 2018). The COS data (S/N of per resolution element near 1330 Å) and the STIS data (S/N of per resolution element near 1330 Å) show a multi-component H i Ly absorber centered at ; Fig. 7, upper four panels). The visual inspection of the COS and the STIS data (upper two left panels in Fig. 7) indicates that the dominating strong Ly absorption component at Å is accompanied by at least two weak satellite components, from which the very broad component near Å (our CBLA candidate) is readily visible in the COS data (while it is hidden in the noise in the STIS data).
From a simultaneous fit/model of the COS and STIS data (Fig. 7, upper right panels, black solid line) for the entire multi-component absorber at we obtain for the CBLA component log (H i and km s-1. The preferred model for the CBLA candidate is indicated with the red-shaded area. Alternatively, it is also possible to fit this apparently broad component with a series of three narrow components. Such a fit would better reproduce the individual spikes in the COS/STIS noise patterns, but is, in view of the S/N, statistically not justified and thus arbitrary. We conclude that the observed broad feature represents a convincing CBLA candidate. Also Danforth et al. (2016) have identified this feature as a BLA. From a fit of the COS data they obtain log (H i and , thus in agreement with our results from the combined COS and STIS data.
For comparison: our CBLA models predicts log (H i and km s-1 for and kpc. While the value from the model agrees well with our fit, the H i column density measured in the spectral data is susbtantially higher ( dex) compared to what is predicted by the model. This discrepancy could be, for instance, related to an excess of hot gas in the extended halo of 2dFGRS-TGN388Z087 (compared to the model), a contribution of H i absorption from cooler gas phases, and/or non-equilibrium ionization conditions. A general comparison between the measurements and the model predictions will be provided in Sect. 5.6.
5.3. The CBLA candidate at towards PHL 1811
Another CBLA candidate is identified at along the line of sight towards the Seyfert 1 galaxy PHL 1811 (), which passes the galaxy 2MASS J21545996-0922249 at an impact parameter of kpc (Jenkins et al. 2003, 2005). This is a prominent CGM absorption system containing a strong Ly absorption component centered at Å that traces cooler gas in the halo of 2MASS J21545996-0922249 (Fig. 7, lower four panels). The main Ly component is accompanied by metal absorption in various low and intermediate ions (e.g., C ii, C iv, Si iii, Si iv; see Jenkins et al. 2005, their Fig. 1, for velocity profiles of the STIS data and R16, their Fig. A.1, for velocity profiles of the COS data). A weaker satellite component is seen bluewards of the main absorption component, but only in the lines of C iv and Si iv (R16).
It is the red wing of the Ly profile, however, that exhibits extended, shallow absorption that cannot be readily modelled with the component structure defined by the metal lines. Fitting the STIS data (S/N is per resolution element near 1315 Å) alone, Jenkins et al. (2005) attribute the wing to a continuum undulation (their Fig. 2) on top the Ly absorption. The much better COS data (S/N of per resolution element near 1315 Å; see R16, their Fig. 1), indicates, however, that the shallow red wing more likely is attributed to an additional, broad absorption component: a CBLA candidate system at Å. From the simultaneous modeling of the COS and STIS data we find log (H i and km s-1 as preferred solution for this CBLA candidate. This model is indicated with the red-shaded area in the lower right panels of Fig. 7. Studying the COS data alone, Danforth et al. (2016) also attributes the extended red wing in the Ly absorption to a BLA and derives log (H i and km s-1. The STIS data analyzed here, however, favours a lower logarithmic column density than the 13.95 derived by Danforth et al.
| QSO name | galaxy name | log (H i | (H i | ||||
|---|---|---|---|---|---|---|---|
| [km s-1] | [km s-1] | [km s-1] | |||||
| RX J 1230.8+0115 | 2dFGRS-TGN388Z087 | 0.56 | 28480 | 28293 | 0.77 | ||
| PHL 1811 | 2MASS J21545996-0922249 | 2.90 | 24283 | 24294 | 0.15 | ||
| 3C 273 | SDSS J122950.57+020153.7 | 0.02 | 1499 | 1684 | 0.75 | ||
| PG 1116+215 | SDSS J111906.68+211828.7 | 2.90 | 41671 | 41591 | 0.55 |
The prediction from our CBLA model is log (H i, km s-1 for and kpc, thus substantially broader at a comparable column density. While it is possible to force a very broad CBLA with km s-1 and log (H i in our component model with an acceptable match between model and observations, it is not the preferred solution of our modeling analysis. Possibly, the observed broad H i feature stems from a somewhat cooler region in the MASS J21545996-0922249 halo with sub-virial temperatures (see also Sect. 5.6).
An alternative interpretation is that this CBLA candidate belongs to the somewhat fainter (and less massive) companion galaxy 2MASS J21545870-0923061, which has an impact parameter of kpc to the PHL 1811 sightline at a redshift that is nearly identical to the closer 2MASS J21545996-0922249 galaxy.
5.4. The CBLA candidate at towards 3C 273
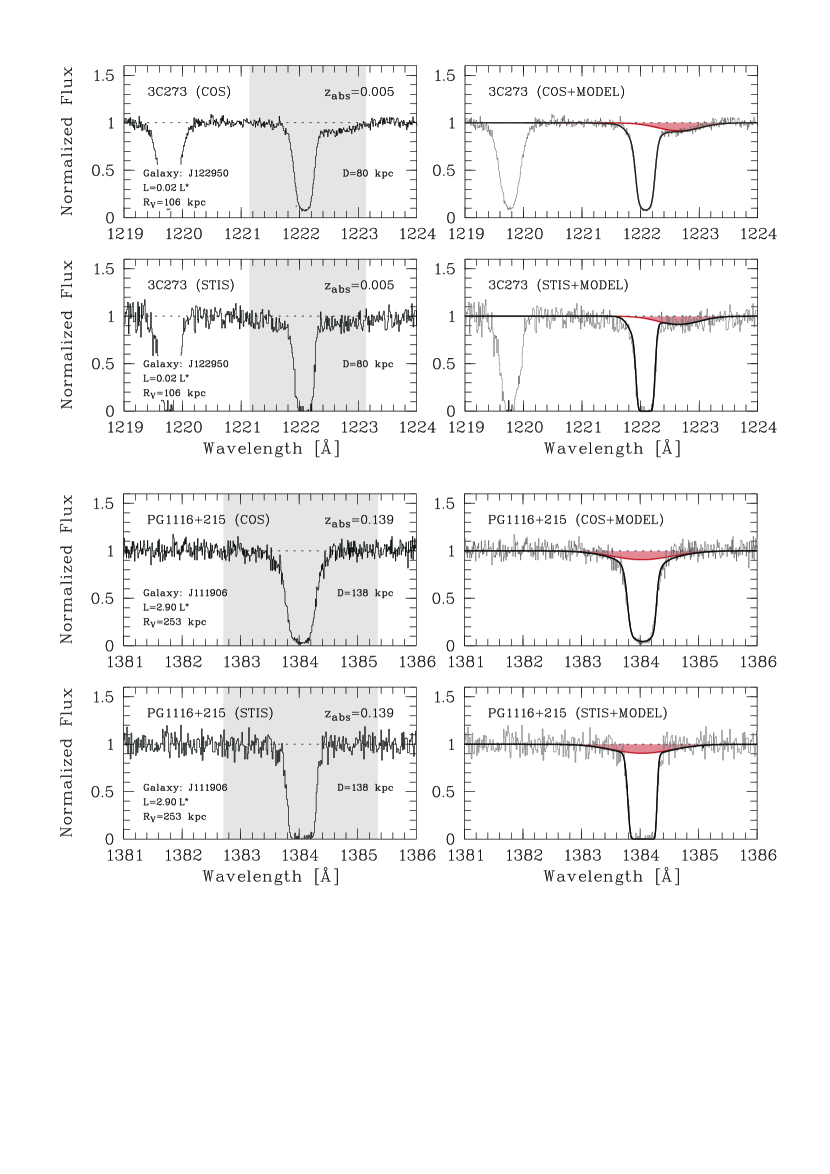
Towards the optically brightest QSO on the sky, 3C 273 (), a very nearby CBLA candidate is detected at , probably related to hot gas in the outer halo of the galaxy SDSS J122950.57+020153.7 at kpc (Stocke et al. 2013) or its intergalactic environment. At this redshift, the 3C 273 sightline passes the outskirts of the Virgo cluster in a region of substantial galaxy overdensity, but lies beyond the X-ray emission contours.
Because of the brightness of 3C 273, both the COS and STIS data are of excellent quality (S/N is per resolution element in the COS data and in the STIS data near 1225 Å). The main H i absorption component at Å is accompanied by a very broad, shallow absorption feature centered near Å (see Fig. 8, upper left two panels). This feature, although quite prominent, has been interpreted as continuum undulation in previous studies, but not as potential Ly absorption feature. In the detailed analysis of the STIS spectral data of 3C 273 (Tripp et al. 2002; Williger et al. 2010), the very broad, shallow red wing of the strong Ly absorption at , that is visible in the raw STIS data (Tripp et al. 2002; their Fig. 1), is fitted as part of the continuum. In the superb COS data, this shallow feature is even more prominent (Fig. 8) and distinct from a continuum undulation. Also other COS pipeline extractions for 3C 273 show this broad, shallow feature redwards of the main H i absorption component, but strength and shape vary for these different data sets. This feature is not considered in previous COS absorption-line studies (e.g., Danforth et al. 2016).
We model this CBLA candidate based on the combined STIS/COS data set of 3C 273 with the parameters log (H i and km s-1 (red-shaded area in Fig. 8, upper right panels). In our theoretical CBLA model grid we only consider galaxies with masses log and luminosities , so that we do not have any CBLA model prediction for this faint dwarf galaxy.
The fact that such a low-luminosity galaxy ( kpc) shows such a prominent CBLA possibly points towards an extra-coronal origin of the absorbing hot gas (assuming that the absorption feature is real). In view of the location of SDSS J122950.57+020153.7 within the Virgo environment, the CBLA may trace hot gaseous material that has been accumulated by the galaxy from the intracluster medium during the passage through the outer Virgo cluster. This example underlines the potential importance of the interface regions between galaxy halos and their specific intergalactic environment, which may be studied best using constrained hydrodynamic cosmological simulations of nearby galaxy filaments (e.g., Nuza et al. 2015).
5.5. The CBLA candidate at towards PG 1116+215
The sightline towards the Seyfert 1 galaxy PG 1116+215 () passes the galaxy SDSS J111906.68+211828.7 () at an impact parameter of kpc (Stocke et al. 2013).
A prominent, strong Ly absorber is seen at the same redshift as the galaxy together with various low, intermediate, and high metal ions (e.g., Savage et al. 2014; their Fig. 10). This system obviously traces a complex, multi-component and multi-phase CGM absorber in the halo of SDSS J111906.68+211828.7. This is an example that is representative for the difficulty of identifying broad absorption components in multi-phase absorbers. Previous studies of the COS data of this system has lead to some controversial results. Bluewards of the main Ly absorption component at Å there is a flux depression in the COS data (S/N is per resolution element at 1385 Å) that extends to Å. This feature is clearly present in different pipeline extractions of the same COS data, although different noise characteristics are evident (e.g., compare Savage et al. 2014, their Fig. 10, with Stocke et al. 2014, their Fig. 13). This flux depression is not considered in the multi-component fit presented in Savage et al. (2014), but is fitted as a BLA with km s-1 down to Å in Stocke et al. (2014), potentially being aligned with the strong (and broad) O vi absorption.
Interestingly, also the STIS data, that has a S/N of per resolution element at 1385 Å, provides independent evidence for an extended wing bluewards of the main Ly component (see Fig. 8). Combining the COS and STIS data sets and considering the full extent of the flux depression down to Å, we derive for this well-hidden CBLA candidate log (H i and km s-1 (red-shaded area in the lower right panel of Fig. 8). This solution also provides a better fit of the red wing of the Ly absorption, where a kink is seen in the COS data near Å. While we cannot claim that this fit is the definite solution for the decomposition of this particularly complex CGM absorber, the combination of the STIS and COS data clearly suggests that there is convincing evidence for a CBLA in this system that could be related to the coronal gas of SDSS J111906.68+211828.7.
The CBLA-model prediction is log (H i and km s-1 for and kpc, thus supporting the above given interpretation of the COS/STIS data.
5.6. Interpretation of observed trends
In all four examples presented above, the inclusion of a broad, shallow absorption component in the absorber models is required to account for the observed flux depressions in the wings of the strong Ly absorption and to provide an optimum fit to the COS and STIS spectral data. Also other authors have identified and discussed broad Ly absorption as potential tracers for warm/hot circumgalactic gas in their analyses (e.g., Narayanan, Savage, Wakker 2010, 2012; Savage et al. 2011; Savage et al. 2014; Stocke et al. 2014; Johnson et al. 2017), but a systematic investigation of these features with regard to the expected spectral signatures of shock-heated coronal gas has not been provided so far. Our study suggests that some of these previously identified broad features may be indeed related to hot coronal gas around galaxies and our CBLA models provide the theoretical basis for such a systematic study.
Within the errors from the CBLA modeling and the spectral analysis, the CBLA column densities and values derived from the COS/STIS data for the above-presented four CBLA candidate systems roughly agree with the CBLA model predictions. However, in view of the many additional systematic uncertainties involved (data-reduction issues, continuum undulations, lack of spectral resolution, limited S/N, etc.), a much larger sample of CBLA candidate systems is required to assess the relation between hot coronal gas and broad H i Ly absorption in a statistically relevant manner.
One preliminary trend that we see in our four CBLA candidate systems is that the fitted H i column densities are systematically higher ( dex) than what is predictied by our CBLA models. This discrepancy, if real, may be related to H i-absorbing gas that resides in other (cooler) CGM phases or in warm-hot gas residing in the IGM beyond the virial radii. These and other aspects will be further investigated by us in our follow-up CBLA survey and in future high-resolution CGM/IGM simulations, from which we will extract synthetic CBLA spectra.
6. Summary and conclusions
In this study, we have demonstrated that hot coronal gas in the extended halos of (predominantly) massive galaxies are expected to give rise to a weak but detectable Ly absorption signal in the spectra of background AGN. The resulting absorber population, the CBLAs, may be used study the hot phase of the CGM in individual galaxies and/or to explore mass and extent of hot gas around galaxies in a statistical manner.
Our semi-analytic model predicts that CBLAs at span a characteristic H i column-density/Doppler-parameter range of log (H i and km s-1. As we have demonstrated, such broad, shallow absorption features at low redshift are detectable only in high-S/N UV spectral data, but even there they may be hidden within the overall (often complex) Ly absorption pattern that is usually dominated by cooler CGM gas components. A careful modeling of the Ly absorption profiles is required to identify CBLA candidate systems in CGM absorbers.
We have provided four examples for such a CBLA modeling by combining archival HST/COS and HST/STIS data. The inclusion of a CBLA component in the spectral models is required to provide a satisfying fit to the COS/STIS data, such as it is also seen in CGM systems studied by other authors (Narayanan, Savage, Wakker 2010, 2012; Savage et al. 2011, 2014; Stocke et al. 2014; Johnson et al. 2017). Although blending effects and the limited S/N complicate the interpretation of the observed features in our four example spectra, the modeled line profiles qualitatively match the expected CBLA characteristics. There appears to be a mild ( dex) excess in H i column density seen in the COS/STIS data when compared to the CBLA model predictions. This could be related to H i-absorbing gas residing in other CGM phases or in the IGM outside the galaxies’ virial radii. A larger CBLA candidate sample will be required to further investigate these aspects in more detail.
One important conclusion from our study is that profile-fitting of CGM absorbers generally should take into account the possible presence of a CBLA absorption component. With this study, we provide a parametrization of the expected column densities and values of CBLAs as a function of halo mass and impact parameter. This might be useful to model the expected shape of CBLAs in absorption systems in future CGM studies.
Given the fact that the expected number density per unit redshift of CBLAs at is relatively large (), a survey of CBLAs in galaxy-halo sightlines at sampled with HST/COS is the next logical step to further explore the nature of these systems. Such a CBLA survey will be presented by us in a future paper together with a careful assessment of systematic uncertainties in the HST/COS data (fixed-pattern noise, instrumental artifacts, continuum undulations, etc.).
Another important future project will be the systematic exploration of broad H i featueres arising in the K phase in synthetic spectra from numerical hydrodynamic CGM simulations of galaxies with different masses and evolutionary states. As mentioned earlier, our idealized, analytic halo model assumes a specific temperature/density profile that does not account for feedback processes or other crucial aspects of galaxy formation/evolution. The relevance of these aspects for the occurance and shape of broad H i Ly features in galaxy halos can only can be studied based on state-of-the-art numerical simulations that cover the cosmological framework, the necessary gas physics, and the required high spatial resolution. Note that previous CGM simulations have already indicated the presence of broad H i lines that represent the analogs of CBLAs (e.g., Liang, Kravtsov & Agertz 2018; their Fig. 3).
High-resolution CGM simulations will further provide crucial information on potential temperature fluctuations in the inner and outer corona and the role of (non-thermal) bulk motions in the coronal gas (e.g., from outflows and mergers) for the H i line-broadening. They also will be essential to characterize the transition zone between the CGM of individual galaxies and the IGM in the superordinate cosmologial environment (filaments, galaxy groups) that contains shock-heated hot gas as well (see, e.g., Stocke et al. 2014; Nuza et al. 2015; Bouma, Richter & Fechner 2019).
REFERENCES
Anderson, M.E., & Bregman, J.N. 2010, ApJ, 714, 320
Anderson, M.E., & Bregman, J.N. 2011, ApJ, 737, 22
Anderson M.E., Churazov E., Bregman J.N., 2016, MNRAS, 455, 227
Borthakur, S., Heckman, T., Tumlinson, J., et al. 2016, ApJ, 833, 259
Bouma, S.J.D., Richter, P., Fechner, C. 2019, A&A, 627, A20
Bregman, J.N., & Houck, J.C. 1997, ApJ, 485, 159
Bullock, J.S., Kolatt, T.S., Sigad, Y., Somerville, R.S., Kravtsov, A.V.,
Klypin, A.A., Primack, J.R., Dekel, A. 2001, MNRAS, 321, 559
Burchett, J.N., Tripp, T.M., Prochaska, J.X., et al. 2019, ApJL, 877, 20
Danforth, C.W., Tilton, E.M., Shull, J.M., et al. 2016, ApJ, 817, 111
Fang, T., McKee, C.F., Canizares, C.R., & Wolfire, M. 2006, ApJ, 644, 174
Fontana, A., & Ballester, P. 1995, ESO Messenger, 80, 37
Fukugita, M. & Peebles, P.J.E. 2006, ApJ, 639, 590
Gutcke, T.A., Stinson, G.S., Macció, A.V., Wang, L., & Dutton, A.A. 2017, MNRAS, 464, 2796
Hani, M.H., Ellison, S.L., Sparre, M., Grand, R.J.J., Pakmor, R., Gomez, F.A.,
& Springel, V. 2019, MNRAS, 488, 135
Haynes, M.P., Giovanelli, R., Martin, A.M., et al. 2011, AJ, 142, 170
Hodges-Kluck, E.J., Miller, M.J., & Bregman, J.N. 2016, ApJ, 822, 21
Jenkins, E.B., Bowen, D.V., Tripp, T.M., et al. 2003, AJ, 125, 2824
Jenkins, E.B., Bowen, D.V., Tripp, T.M., & Sembach, K.R. 2005, ApJ, 623, 767
Johnson, S.D., Chen, W.-W., Mulchaey, J.S., Schaye, J. & Straka, L.A. 2017, ApJ 850, L10
Keeney, B.A., Stocke, J.T., Pratt, C.T., et al. 2018, ApJS, 237, 11
Klypin A., Kravtsov A.V., Bullock J.S., & Primack J.R., 2001, ApJ, 554, 903
Li, J.-T., Li, Z., Wang, Q.D., Irwin, J.A., & Rossa, J. 2008, MNRAS, 390, 59
Li J.-T., Bregman J.N., Wang Q.D., Crain R.A., & Anderson M.E. 2016, ApJ, 830, 134
Li J.-T. & Bregman J.N. 2017, ApJ, 849, L105
Lehner, N., Savage, B. D., Richer, P., et al. 2007, ApJ, 658, 680
Liang, C.J., & Chen, H.-W. 2014, MNRAS, 445, 2061
Liang, C.J., Kravtsov, A.V., & Agertz, O. 2018, MNRAS, 479, 1822
Maller, A.H., & Bullock, J.S. 2004, MNRAS, 355, 694 (MB04)
McCammon, D., Almy, R., Apodaca, E., et al. 2002, ApJ, 576, 188
Miller, M.J. & Bregman, J.N. 2013, ApJ, 770, 118
Miller, M.J. & Bregman, J.N. 2015, ApJ, 800, 14
Morton, D.C. 2003, ApJS, 149, 205
Montero-Dorta, A.D., & Prada, F. 2009, 399, 1106
Moster, B.P., Somerville, R.S., Maulbetsch, C., van den Bosch, F.C.,
Maccio, A.V., Naab, T., & Oser, L. 2010, ApJ, 710, 903
Muzahid, S., Fonseca, G., Roberts, A., Rosenwasser, B., Richter, P.,
Narayanan, A., Churchill, C., Charlton, J. 2018, MNRAS, 476, 4965
Navarro J.F., Frenk C.S., & White S.D.M. 1995, MNRAS, 275, 56
Narayanan, A., Savage, B.D., & Wakker, B.P. 2012, ApJ, 752, 65
Nicastro, F., Zezas, A., Drake, J., et al. 2002, ApJ, 573, 157
Nuza, S.E., Parisi, F., & Scannapieco, C., et al. 2014, MNRAS, 441, 2593
O’Sullivan, E., Ponman, T.J., & Collins, R.S. 2003, MNRAS, 340, 1375
Paerels, F.B.S. & Kahn, S.M. 2003, ARA&A, 41, 291
Pisano, D.J., Barnes, D.G., Gibson, B.K., Staveley-Smith, L., Freeman, K.C.,
& Kilborn, V.A. 2007, ApJ, 662, 959
Prause, N., Reimers, D., Fechner, C., & Janknecht, E., 2007, A&A, 470, 67
Prochaska, J.X., Weiner, B., Chen, H.-W., Mulchaey, J., & Cooksey, K. 2011, ApJ, 740, 91
Prochaska, J.X., Burchett, J.N., Tripp, T.M., et al. 2019, ApJ, 243, 21
Rasmussen, J., Sommer-Larsen, J., Pedersen, K., Toft, S.,
Benson, A., Bower, R.G., & Grove, L.F. 2009, ApJ, 697, 79
Richter, P., Savage, B.D., Tripp, T.M., & Sembach, K.R. 2004, ApJS, 153, 165
Richter, P., Savage, B.D., Sembach, K.R., & Tripp, T.M. 2006, A&A, 445, 827
Richter, P., Fang, T., & Bryan, G. L. 2006, A&A, 451, 767
Richter, P., Paerels, F.B.S., Kaastra, J.S. 2008, SSRv, 134, 25
Richter, P., Charlton, J.C., Fangano, A.P.M., Ben Bekhti, N., & Masiero, J.R. 2009, ApJ, 695, 1631
Richter, P. 2012, ApJ, 750, 165
Richter, P., Fox, A.J., Wakker, B.P., Lehner, N., Howk, J.C., Bland-Hawthorn, J.,
Ben Bekhti, N., & Fechner, C. 2013, ApJ, 772, 111
Richter, P., Fox, A.J., Ben Bekhti, N., Murphy, M.T., Bomans, D., & Frank, S. 2014, AN, 335, 92
Richter, P., Wakker, B.P., Fechner, C., et al. 2016, A&A, 590, A68
Richter, P.; Nuza, S.E.; Fox, A.J. et al. 2017, A&A, 607, A48
Richter, P. 2017, in: Gas Accretion onto Galaxies, Astrophysics and Space Science Library,
eds. A. J. Fox & R. Davé (Springer), 15
Richter, P.; Winkel, B.; Wakker, B.P. et al. 2018, ApJ, 868, 112
Savage, B.D., Narayanan, A., Lehner, N. & Wakker, B.P. 2012, ApJ, 731, 14
Savage, B.D., Kim, T.-S., Wakker, B.P., Keeney, B., Shull, J.M., Stocke, J.T.,
& Green, J.C. 2014, ApJS, 212, 8
Sembach, K. R., Tripp, T. M., Savage, B. D., & Richter, P. 2004, ApJS, 155, 351
Schechter, P. 1976, ApJ, 203, 297
Spitzer, L. 1956, ApJ, 124, 20
Stocke, J.T., Keeney, B. A., Danforth, C. W., et al. 2013, ApJ, 763, 148
Stocke, J.T., Keeney, B.A., Danforth, C.W., et al. 2014, ApJ, 791, 128
Strickland, D.K., Heckman, T.M., Colbert, E.J.M., Hoopes, C.G., & Weaver, K.A. 2004, ApJS, 151, 193
Tepper-García, T., Richter, P., Schaye, J., et al. 2012, MNRAS, 425, 1640
Tripp et al. 2009
Tüllmann, R., Pietsch, W., Rossa, J., Breitschwerdt, D., & Dettmar, R.-J. 2006, A&A, 448, 43
Tumlinson, J., Thom, C., Werk, J.K., et al. 2013, ApJ, 777, 59
Tumlinson, J., Peeples, M.S., Werk, J.K. 2017, ARA&A, 55, 389
van de Voort, F., Springel, V., Mandelker, N., van den Bosch, F.C., & Pakmor, R. 2019, MNRAS, 482, L85
Wang, Q.D., Yao, Y., Tripp, T.M., et al. 2005, ApJ, 635, 386
Wakker, B.P., & Savage, B.D. 2009, ApJS, 182, 378
Werk, J.K., Prochaska, J.X., Thom, C., et al. 2013, ApJS, 204, 17
White, S.D.M. & Frenk, C.S. 1991, ApJ, 379, 52
Williams, R.J., Mathur, S., Nicastro, F., et al. 2005, ApJ, 631, 856
York, D.C. & Cowie, L.L. 1983, ApJ, 264, 49
Yun, M.S., Ho, P.T.P., & Lo, K.Y. 1994, Nature, 372, 530
In this Appendix, we present the most relevant equations for the semi-analytic
CBLA modeling presented in Sect. 3.
Appendix A The coronal gas distribution in individual galaxy halos
To characterize the spatial extent, radial density distribution, and radial temperature distribution of the hot coronal gas in a DM halo of given virial mass, , we use the formalism outlined in the seminal paper presented by Maller & Bullock in 2004 (MB04).
A.1. DM halo properties
Following the approach presented in MB04, we calculate the virial radius, , for a galaxy with viral mass, , via the relation
| (A1) |
where is the cosmological matter-density parameter and is the virial overdensity, here set to .
Cosmological -body simulations have demonstrated that the matter density in a DM halo follows a radial profile function in the form
| (A2) |
This is the Navarro-Frenk-White (NFW) profile (Navarro, Frenk & White 1995; Klypin et al. 2001) with the parameters as characteristic density and as scale radius. Scale radius and virial radius in a NFW DM halo are connected via the so-called concentration parameter, , where can be approximated via the relation (Bullock et al. 2001). For the maximum circular velocity in a NFW profile we can write
| (A3) |
where .
A.2. Initial gas density profile and coronal gas temperature
We now consider the distribution of hot (virialized) gas confined in a NFW DM potential well. We assume that the baryonic mass fraction in the seed halo (initially purely in the form of gas) is tied to the cosmological baryon fraction, , so that . Following MB04, we can write for the radial mass-density profile of the hot gas
| (A4) |
The core density, , depends on the total baryonic gas mass and the concentration parameter in the way
| (A5) |
where the function has the form
| (A6) |
The initial temperature of the hot, coronal (isothermal) gas, , depends on the sound speed, , and can be written as
| (A7) |
Here, is the mean mass per particle in the fully ionized plasma (assuming a helium mass fraction of 30 percent), is the proton mass, is the polytropic index (assumed to be unity for an ideal isothermal gas), and is the Boltzmann constant.
A.3. Gas cooling and the multi-phase nature of the CGM
In the inner region of the halo, where the gas density is the highest, the hot gas is able to cool within a Hubble time. With as the mean mass per electron, and as cooling function, the density threshold above which the coronal gas is able to cool in the time scale is given by
| (A8) |
The time scale that is relevant here is the halo-formation time scale, assumed to be Gyr (see discussion in MB04). The cooling function, , which depends mainly on the temperature, , and the overall metallicity of the gas, can be approximated by a simple power law:
| (A9) |
where the cooling parameter scales with with the gas metallicity, (in solar units), as given in MB04 (their Table A.1). We here generally assume .
The density threshold for cooling gas in a DM halo corresponds to a characteristic radius, often referred to as the cooling radius, (Frenk & White 1991). According to MB04, this radius can approximated by the relation
| (A10) |
At , the hot coronal gas will cool and fragment, leading to star formation in the inner-most region of the galaxy and a multi-phase, inner CGM, whereas for the gas is assumed to remain hot and isothermal at . Also at , a certain fraction of the CGM will be hot, however, as the gas is multi-phase. MB04 derive expressions for the density and temperature profiles of this residual hot gas component at under the assumption, that the gas reaches hydrostatic equilibrium and responds adiabatically to pressure changes:
| (A11) |
and
| (A12) |
With equations (A4), (A7) for and (A11), (A12) for we are now able to calculate for each galaxy halo with virial mass the radial gas density and temperature distributions, and , of the hot coronal gas. Finally, we convert the mass density into an hydrogen particle density using the relation .
A.4. Ly absorption properties
For a weak, unsaturated absorption line, there is a simple, linear relation between the observed equivalent width and the absorbing gas column density:
| (A13) |
Here, denotes the laboratory wavelength of the transition and its oscillator strength. With Å and for the H i Ly line (Morton 2003) we get:
| (A14) |
We now calculate the central absorption depth, , of the CBLAs as a function of (H i) and value. For a Gaussian-shaped absorption line, there is a simple relation between the equivalent width (i.e., the area under the Gaussian profile), the full-width-at-half-maximum () of the Gaussian, and the central absorption depth:
| (A15) |
Taking into account that for a Gaussian-shaped line and plugging in the correct numbers for H i Ly to convert between wavelength and velocity space, we obtain
| (A16) |
Appendix B The cosmological cross section of coronal gas in the local Universe
We now discuss the equations that we need to determine the cosmological cross section of coronal gas halos and their CBLA signatures at low redshift. For this, we make use of the local galaxy luminosity function and standard cosmological equations.
B.1. Space density of galaxy halos
The space density of galaxies per unit luminosity is given by the Schechter luminosty function (Schechter 1976), which has the form
| (B1) |
Here, is a characteristic luminosity, is the slope at the faint end of the luminosity function, and is the normalization density. The space density of galaxies with luminosities is given by the integral
| (B2) |
where stands for the upper incomplete Gamma function with the arguments and .
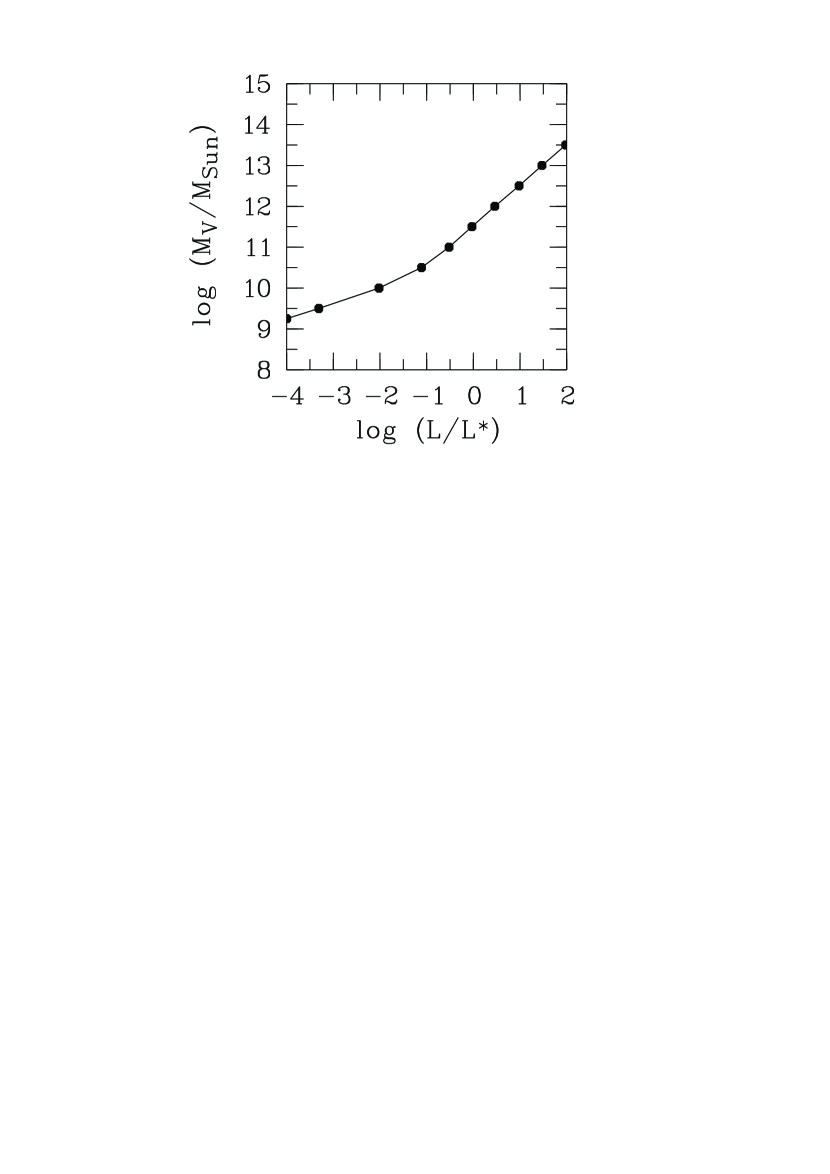
By solving equation (B2) numerically via the Gamma function, we obtain the space density of galaxies per luminosity bin, , in units [Mpc-3]. The parameters , , and are obtained from observations of the local galaxy luminosity function (Montero-Dorta & Prada 2009). To convert this into a space density as a function of galaxy’s virial halo mass, we use the mass-luminosity relation presented in Stocke et al. (2014), which is based on halo-matching models of Moster et al. (2010). The relation between mass and luminosity (Fig. A1) can be approximated by the polynomial
| (B3) |
where . The combination of equations (B2) and (B3) allows us to derive the space density of galaxies and their halos in a given (virial) mass bin, , which is used to calculate the cross section of coronal gas for the local galaxy population (Sect. 4.4).
Appendix C Isothermal model
In Fig. C.1, we show the dependence of CBLA H i column densities and values on the virial halo mass for an isothermal halo model, where we set for each halo mass. Compared to the MB04 model (Fig. 4), the isothermal model gives sytematically higher H i column densities owing to the higher neutral gas fractions (Eq. 3) in the now somewhat cooler inner halo regions.
In contrast to the MB04 model (Fig. 4), the Doppler parameter (CBLA) in the isothermal model is constant for each halo mass and directly related to the virial halo temperature via Eq. (6). The resulting absorption lines thus would be substantally narrower and easier to detect (Sect. 4.2).
Fig. 4 and Fig. C.1 can be compared to H i column density and value distributions from CBLAs seen in synthethic UV spectra generated from high-resolution CGM simulations (e.g., Liang, Kravtsov & Agertz 2018).