Ab initio molecular dynamics simulations of negative thermal expansion in ScF3: The effect of the supercell size
Abstract
Scandium fluoride (ScF3) belongs to a class of negative thermal expansion (NTE) materials. It shows a strong lattice contraction up to about 1000 K switching to expansion at higher temperatures. Here the NTE effect in ScF3 is studied in the temperature range from 300 K to 1600 K using ab initio molecular dynamics (AIMD) simulations in the isothermal-isobaric (NpT) ensemble. The temperature dependence of the lattice constant, inter-atomic Sc–F–Sc bond angle distributions and the Sc–F and Sc–Sc radial distribution functions is obtained as a function of supercell size from to where is the lattice parameter of ScF3. A comparison with the experimental Sc K-edge EXAFS data at 600 K is used to validate the accuracy of the AIMD simulations. Our results suggest that the AIMD calculations are able to reproduce qualitatively the NTE effect in ScF3, however a supercell size larger than should be used to account accurately for dynamic disorder. The origin of the NTE in ScF3 is explained by the interplay between expansion and rotation of ScF6 octahedra.
keywords:
ScF3 , Negative thermal expansion , Ab initio molecular dynamics , EXAFS , CP2Kurl]http://www.cfi.lu.lv/
1 Introduction
Materials with negative thermal expansion (NTE), contracting upon heating, are not only of great interest from a fundamental physics point of view, but have also a high industrial importance [1, 2, 3]. Composites containing NTE components can possess zero thermal expansion, making them suitable for high-precision devices, like space telescope mirrors, teeth fillings, substrates in microelectronics, fuel cells, thermoelectric converters and for many other applications [4].
During the last decade, fluorides of various metals, including ScF3, have attracted attention as a new class of materials with NTE [5]. ScF3 is a peculiar compound, which has simple ReO3-type cubic structure and surprisingly strong NTE effect appearing as a decrease of the lattice constant over a wide range of temperatures from 10 K to 1100 K, while the positive expansion of the lattice occurs at higher temperatures [6]. This makes ScF3 an excellent study subject for a deeper understanding of the NTE phenomenon. Note that the NTE of pure ScF3 can be affected by reducing crystallites size [7, 8] or by substituting the scandium atoms with yttrium [9], titanium [10], iron [11, 12, 13], gallium [11] or aluminium [12, 14] atoms.
The NTE effect is often explained based on the vibrational mechanism in terms of the so-called rigid unit modes (RUMs) model [3, 15, 16], which involves coupled vibrations of the ScF6 octahedra. When two neighbouring rigid ScF6 octahedra librate in opposite directions, the distance between the scandium atoms located at their centres decreases leading to the lattice contraction.
The rigidity of ScF6 octahedra and coupling of their relative motion are determined by the strength of the Sc–F chemical bonding. Therefore, the accurate description of the NTE effect should account for the interaction between the lattice, phonons and electrons. This challenging problem can be addressed using the method of molecular dynamics (MD), which provides a natural way to include thermal disorder in simulations [17]. Moreover, the use of ab initio molecular dynamics (AIMD), being computationally much more demanding than classical MD [18], allows one to account explicitly for chemical bonding and its anisotropy, which are most likely important for the interpretation of the NTE effect.
Until now the AIMD method was used to study the NTE of ScF3 in [19, 20]. Both works employed ab initio Born-Oppenheimer molecular dynamics implemented in the VASP code [21] based on a plane wave basis set.
In [19] the AIMD simulations were performed to study anharmonic effects in the temperature range between 7 K and 750 K for a ( is the lattice parameter) supercell containing 108 atoms. Based on the analysis of the MD trajectories, it was concluded that the motion of fluorine atoms is largely uncorrelated and strongly anisotropic in the direction orthogonal to the Sc–F–Sc bonds. No attempt was made by Li et al. [19] to reproduce the NTE behaviour of ScF3.
The NTE effect was studied using AIMD simulations by Lazar et al. [20] employing the isothermal-isobaric (NpT) ensemble with a small supercell containing only 32 atoms. The simulations were performed in the temperature range between 200 K and 1400 K. The experimental behaviour of the lattice constant was reproduced after its normalization relative to the value calculated at 200 K. These simulations also predicted that the ScF6 octahedra remain non-distorted at all temperatures. The NTE behaviour of ScF3 was explained by an interplay between the linear thermal expansion of the Sc–F bonds and a decrease of the average Sc–F–Sc bond angles due to octahedra tilting motion [20].
Though the AIMD method is a powerful tool to describe the NTE in ScF3, its accuracy is limited by several issues.
It was demonstrated recently [22], that the AIMD simulations based on the Newton’s equations of motion underestimate the magnitude of the NTE in the entire temperature range due to a neglect of the zero point (quantum) atomic motion. The problem is particularly evident at low temperatures below 500 K [22].
Another issue, which is the topic of the present study, is related to the size of the supercell used in the simulations. To describe the librational motion of ScF6 octahedra, one needs at least eight octahedra placed in a simulation box consisting of 222 multiples of the primitive cubic cell of ScF3 [20]. However, one can expect that such small supercell will strongly influence the lattice dynamics, in particular, long wavelength phonons, and, as a result, the correlation effects in the atomic motion will be overestimated. Since AIMD simulations are computationally expensive, the choice of the supercell size is critical.
Note that the results of AIMD simulations can be validated by direct comparison with the results provided by experimental methods sensitive to both average structure and disorder such as the pair distribution function (PDF) analysis [23] or the extended X-ray absorption fine structure (EXAFS) spectroscopy [24]. EXAFS, being also sensitive to high-order correlation functions, provides a unique possibility to probe the local structure and lattice dynamics of materials. It was successfully used by us previously to validate MD simulations for different materials such as SrTiO3 [25], ReO3 [26], ZnO [27], UO2 [28] and Cu3N [29].
In this study, we employ AIMD simulations to reproduce the NTE effect in ScF3 and investigated the influence of the supercell size on the local structure and dynamics. In particular, we will demonstrate that the use of the smallest supercell () fails to describe thermal disorder accurately leading to a broadening of the inter-octahedral Sc–F–Sc bond angle distribution and of the peaks in the radial distribution function starting from the third coordination shell of scandium. At the same time, the details of the lattice dynamics due to the NTE effect are well reproduced for larger supercells, starting from . The explanation of the NTE effect in ScF3 is discussed based on the AIMD results.
2 Ab initio molecular dynamics
Understanding of the NTE effect in ScF3 requires detailed and accurate knowledge of its temperature-dependent structure and lattice dynamics. This information is obtained in the present study using the AIMD simulations.
Our simulations were based on Kohn–Sham density functional theory (DFT) [30] and were performed in the isothermal–isobaric (NpT) ensemble at seven different temperatures (300 K, 400 K, 600 K, 800 K, 1000 K, 1300 K and 1600 K) using the CP2K code [31]. The CP2K code employs a localized basis set of Gaussian-type orbital functions for the description of the Kohn-Sham matrix within the framework of the Gaussian Plane Waves method [31, 32]. A cutoff of 600 Rydberg is used for the auxiliary basis set of plane waves to expand the electronic density. Sc and F atoms are described by scalar-relativistic norm-conserving Goedecker-Teter-Hutter pseudopotentials [33, 34, 35] are employed for including 11 () and 7 () valence electrons, respectively. Calculation were performed at the Gamma point only using MOLOPT basis sets [36] optimized for these pseudopotentials. By performing DFT calculations at = 0 K we found that the PBEsol functional gives the value of the lattice constant ( = 4.027 Å) closer to the experimental one ( = 4.026 Å [6]) than the PBE functional [37] ( = 4.065 Å), which can be important for proper description of the NTE effect. Therefore, the PBEsol exchange-correlation functional [38] was used in all AIMD calculations.
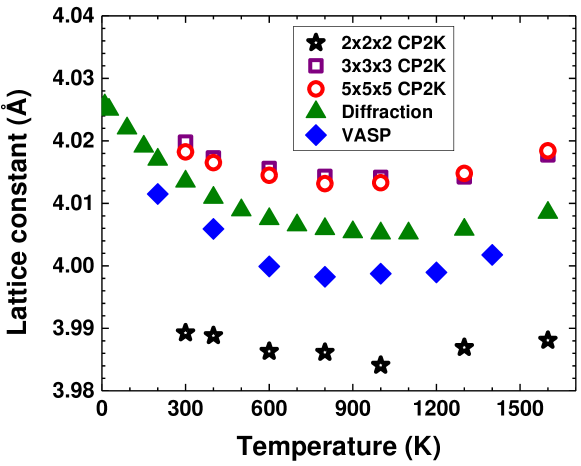
ScF3 model system of increasing size ranging from to primitive unit cells containing 32–500 atoms (8–125 unit cells with 4 atoms per unit cell) were employed in the AIMD simulations. After thermalisation MD run of about 15 ps, an AIMD production run of 50 ps was performed for the to supercells and 100 ps for the supercell. The required temperature was maintained during the sampling run using the CSVR (Canonical Sampling through Velocity Rescaling) thermostat of Bussi et al. [39]. The MD time step of 0.5 fs was used in all simulations. The values of the lattice parameter are reported in Fig. 1: they were calculated by averaging over all atomic configurations obtained during the production run.
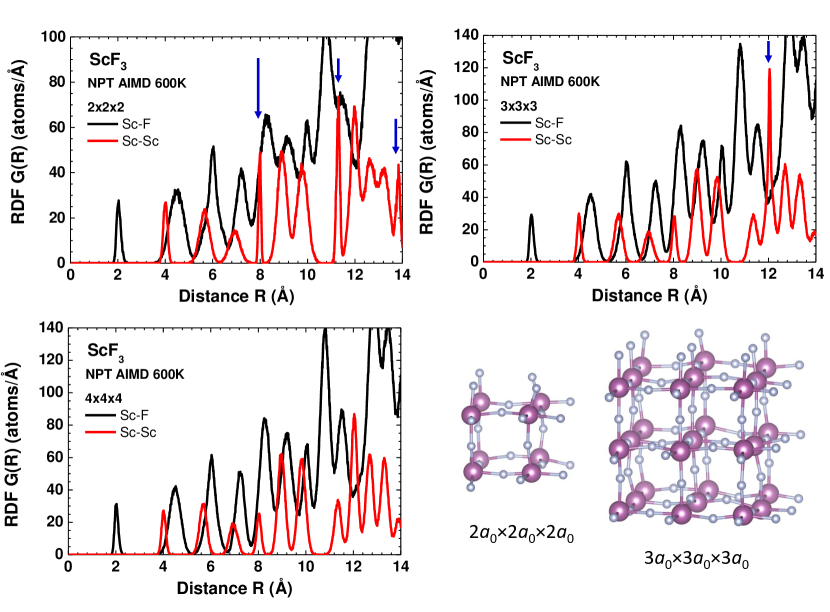
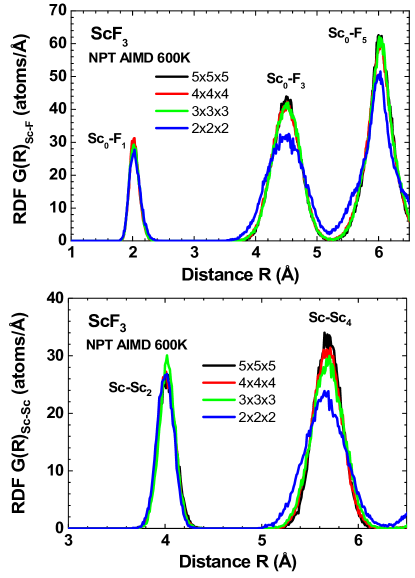
The obtained from MD simulations sets of atomic coordinates were used to calculate the radial distribution functions (RDFs) () for the Sc–F and Sc–Sc atomic pairs and are reported in Fig. 2. The RDF () is defined as a number of atoms (Sc or F) located within a distance of and ( = 0.01 Å) away from the scandium atom.
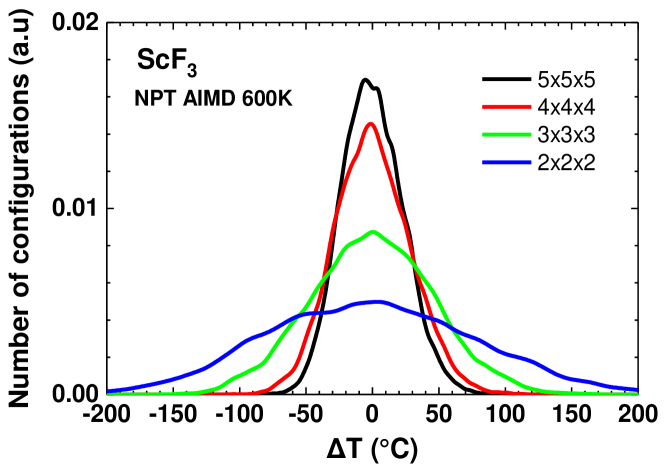
Fig. 3 shows instantaneous distribution of temperatures during the production run for supercells of different sizes at = 600 K. The temperature fluctuation is in the range of about 100 K from the target one for two largest ( and ) supercells. The temperature fluctuation range becomes broader for the supercell exceeding 100 K and is twice larger for the supercell. The growing broading of the temperature distribution for shrinking supercells is caused by the decreasing number of degrees of freedom (DOF) for smaller model systems containing less atoms. A massive thermostatting by employing a thermostat for each DOF was only applied during the thermalisation period whereas just one global thermostat was coupled to the actual model system during the sampling period in order to minimise any bias from the interaction with the thermostat. Fig. 3 shows that a narrow temperature distribution can be obtained even with a mild thermostatting if a sufficiently large model system is chosen which will eventually ensure physically more meaningful results compared to a small model system requiring massive thermostatting.
3 Validation of AIMD simulations
Temperature-dependent AIMD simulations provide information on the average structure, reported in Fig. 1 in terms of the ScF3 lattice parameter, and on the dynamical (time-dependent) structure, which can be described by distribution functions. The latter can be experimentally probed by X-ray or neutron total scattering experiments [8, 40] or by EXAFS spectroscopy [41].
The results of AIMD simulations were validated in the present study using the experimental Sc K-edge EXAFS data from [41, 42], obtained at = 600 K to minimize the influence of zero point quantum effects [22]. Sets of atomic configurations obtained in AIMD NpT simulations were used to calculate configuration-averaged EXAFS spectra ( is the photoelectron wavenumber) following the approach described previously [25, 27].
The Sc K-edge EXAFS spectrum for each configuration was calculated using the real-space multiple-scattering FEFF9.64 code [43, 44]. First, the scattering potential and partial phase shifts of Sc and F atoms were obtained within the muffin-tin (MT) approximation (15% overlap of the nearest MT-spheres, (Sc)=1.31 Å and (F)=1.01 Å) for the cluster of 8.0 Å radius, constructed using the crystallographic ScF3 structure [6] and centered at the absorbing Sc atom. The cluster potential was fixed during all simulations, thus we neglected its small variations due to thermal vibrations. The multiple-scattering contributions were accounted up to the 6th order to guarantee the convergence of the total EXAFS in the -space range of interest. The photoelectron inelastic losses were accounted within the one-plasmon approximation using the complex exchange-correlation Hedin-Lundqvist potential [45]. The value of the amplitude reduction factor was set to 1.0 [24, 44].
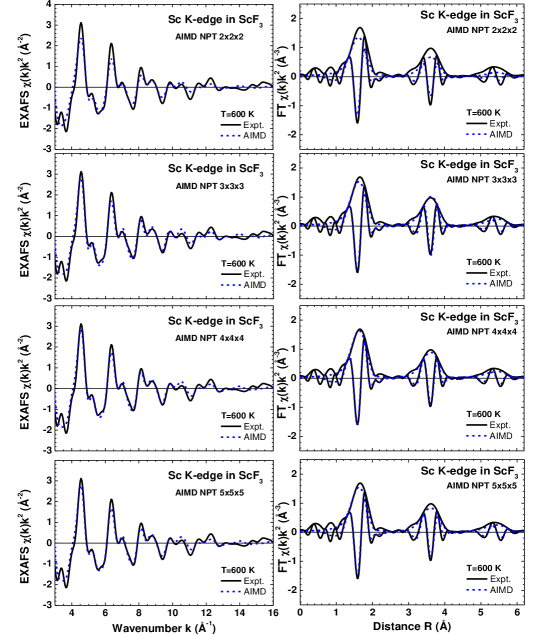
The configuration-averaged Sc -edge EXAFS spectra of ScF3 and their Fourier transforms (FTs) at = 600 K are shown in Fig. 4 for several supercell sizes. The Fourier transforms were calculated using the 10% Gaussian window function and were not corrected for the backscattering phase shift of atoms, therefore the positions of all peaks are displaced to smaller distances relative to their crystallographic values. The significantly worse agreement between the experimental and calculated spectra for the supercell is obvious.
4 Discussion
The temperature dependence of the lattice constant of ScF3, determined from NpT AIMD simulations, are compared with the experimental data obtained by diffraction measurements in Fig. 1. The AIMD simulations performed in this study for , and supercells and by Lazar et al. for a supercell reproduce qualitatively the negative thermal expansion effect in scandium fluoride up to 1000 K as well as positive expansion at higher temperatures. The quantitative values of the calculated lattice constant are close to the experimental diffraction values [6] with a deviation being less than 0.03 Å. Comparing our results for different supercell sizes, one can conclude that a reduction of the absolute lattice constant occurs in small supercell. This effect is caused by the overestimated amplitude of the librational motion of ScF6 octahedra and is clearly observed in the Sc–F–Sc bond angle distribution function (BADF) discussed below.
Further we will discuss the results obtained at = 600 K as a representative case.
Radial distribution functions (RDFs) for the Sc–F and Sc–Sc atom pairs at = 600 K calculated in the range of = 0–14 Å for the supercell sizes from to are shown in Fig. 2. As one can see, for the smallest supercell sizes, sharp peaks in the Sc–Sc RDF (indicated by arrows in Fig. 2) are observed due to periodic boundary conditions (PBC) employed in the simulations. For the supercell with a size of = 8.054 Å, the three peaks are due to PBC along 1 0 0, 1 1 0 and 1 1 1 crystallographic directions. For the supercell with a size of = 12.081 Å, only one sharp peak due to the PBC along 1 0 0 is observed in the -range till 14 Å. Similar effects should appear also in the Sc–F RDFs, however, they are much less visible due to an overlap between closely located shells.
An enlarged view of the RDFs in the range of the first five coordination shells of scandium is shown in Fig. 5. The reduction of the supercell size clearly leads to an increase of the peak widths and to a distortion of the peak shape for the smallest supercell. At the same time, the asymmetric shape of the first (Sc–F1) and second (Sc–Sc2) shell peaks is close for all supercells, explaining the success of the supercell model in a description of the NTE lattice behaviour in [20].
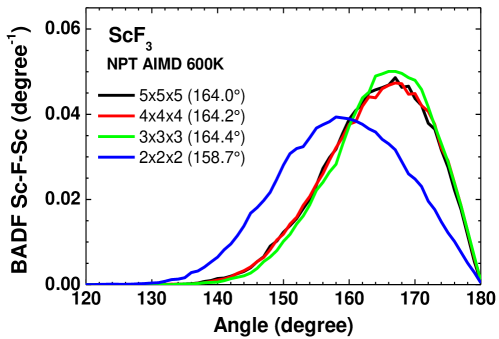
The atomic coordinates obtained in the AIMD simulations were used to calculate the inter-octahedral Sc–F–Sc BADF and the average value of the Sc–F–Sc angle, which are reported in Fig. 6. Note that in cubic ScF3 the crystallographic angle between the average positions of atoms in the Sc–F–Sc chains is equal to 180∘. However, the value of the average Sc–F–Sc angle will be always smaller when calculated from mean distances due to vibrations of fluorine atoms perpendicular to the direction of the Sc–F–Sc chains [46, 47]. As one can see, the Sc–F–Sc BADF for the supercell deviates significantly from the others being broader and giving the average value of the Sc–F–Sc angle by about smaller. This means that the simulations using the smallest supercell should fail in describing dynamical behaviour of ScF3 and, in fact, result in the underestimated absolute values of the lattice parameter (Fig. 1).
The effect of dynamic disorder can be illustrated using the comparison of the experimental and calculated Sc K-edge EXAFS spectra and their Fourier transforms (FTs) shown in Fig. 4 for the four supercell sizes at = 600 K. Thermal disorder is responsible for the EXAFS amplitude damping at high- values [24] and, consequently, leads to a reduction of the peaks amplitude in the FTs. The first peak at 1.6 Å in FT corresponds purely to the first shell contribution due to 6 fluorine atoms (F1). The second peak at 3.5 Å has complex origin due to the interference between the second (Sc2) and third (F3) coordination shells plus the so-called multiple-scattering contributions generated within the Sc–F–Sc atomic chains, which are sensitive to the Sc–F1–Sc2 bond angle variation. The last peak at 5.4 Å is mainly due to the fourth (Sc4) and fifth (F5) coordination shells. As one can see, the AIMD simulations reproduce well the experimental EXAFS data for all supercell sizes except the smallest one, for which the amplitude of all three peaks in FT is systematically smaller than in the experiment. This result correlates well with the behaviour of RDFs in Fig. 5. It is interesting to note that in spite of the Sc–Sc2 RDF is close for all supercells, the sensitivity of the FT peak at 3.5 Å to the Sc–F1–Sc2 bond angle gives origin of its reduced amplitude for the supercell.
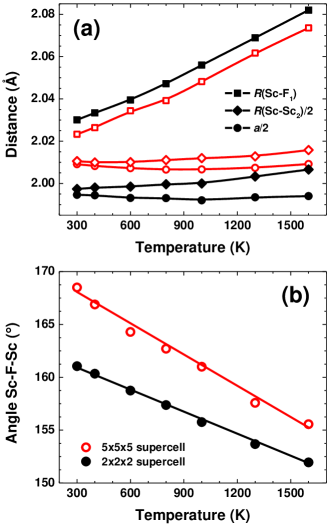
The NTE mechanism in ScF3 can be understood from our AIMD simulations by considering the temperature variation of the lattice parameter and interatomic distances (Sc–F1) and (Sc–Sc2) (Fig. 7(a)) and related variation of the average Sc–F–Sc bonding angle (Fig. 7(b)). For ease of comparison, the values of and (Sc–Sc2) are divided by two. Note that thermal vibrations of scandium atoms in the direction orthogonal to the crystallographic axes are responsible for the difference between the values of and (Sc–Sc2) [47].
An increase of temperature affects strongly the Sc–F1 bond, which elongates almost linearly by about 0.05 Å in the temperature range of 300–1600 K. This trend is close in both supercell models and is in good agreement with the analysis of the experimental EXAFS data published in [40, 47] and the results of previous AIMD simulations from [20]. Such behaviour indicates that the ScF6 octahedra do not behave as rigid units and expand significantly upon heating. The behaviour of the Sc–F1 bonds contrasts strongly with that of the Sc–Sc2 interatomic distances suggesting much larger amplitude of thermal vibrations for fluorine atoms in the direction orthogonal to the Sc–F–Sc linkage. This fact is well evidenced by temperature variation of the average Sc–F–Sc bonding angle in Fig. 7(b), which decreases upon heating meaning stronger rotations of ScF6 octahedra.
One should note that the (Sc–Sc2) next-nearest-neighbour distance behaves in a slightly different way for small and large supercells. It always expands (by about 0.02 Å) for the supercell in the temperature range of 300–1600 K, whereas it has a shallow minimum at 400 K and expands by only 0.01 Å up to 1600 K for the supercell. Also the difference between (Sc–F1) and (Sc–Sc2)/2 distances is larger for smaller supercell, indicating stronger rotations of ScF6 octahedra as is also evidenced in the Sc–F–Sc BADFs in Fig. 6.
Thus, while the NTE effect in ScF3 is reproduced using all supercell models and can be explained by the interplay between expansion and rotation of ScF6 octahedra, the small supercell overestimates the contraction of the lattice and vibrational amplitudes of atoms. This fact is responsible for the worse agreement between the experimental and simulated Sc K-edge EXAFS spectra in Fig. 4 for the smallest supercell.
5 Conclusions
The ab initio molecular dynamics (AIMD) simulations performed within the isothermal–isobaric (NpT) ensemble as presented in this study are able to reproduce the negative thermal expansion of ScF3 up to K and the positive expansion at higher temperatures in agreement with previous diffraction data [6]. The origin of the NTE in ScF3 is explained by the interplay between expansion and rotation of ScF6 octahedra.
At the same time, the simulations based on the smallest supercell () fail to describe thermal disorder accurately, leading to an overestimated broadening of the inter-octahedral Sc–F–Sc bond angle distribution and of the outer coordination shells (starting from the third) in the radial distribution functions of scandium.
The results obtained by the AIMD simulations were validated using the MD-EXAFS approach based on the ab initio multiple-scattering theory. A comparison between the calculated and experimental Sc K-edge EXAFS spectra at = 600 K suggests that a supercell larger than should be employed to obtain good agreement, and the best results are achieved for a supercell of at least . Thus, we demonstrated that the results of the AIMD simulations are sensitive to the size of the supercell, and the experimental EXAFS spectra can be used to distinguish between different theoretical models.
Acknowledgements
The calculations were performed on the Paul Scherrer Institute cluster Merlin4, HPC resources of the Swiss National Supercomputing Centre (CSCS) in Lugano as well as at the Latvian SuperCluster (LASC). The authors gratefully acknowledge staff of the Swiss National Supercomputing Centre (CSCS) during the project ID s628 realization.
The authors sincerely thank S. Ali, A. Kalinko, and F. Rocca for providing experimental EXAFS data, as well as M. Isupova, V. Kashcheyevs, and A. I. Popov for stimulating discussions. Financial support provided by project No. 1.1.1.2/VIAA/l/16/147 (1.1.1.2/16/I/001) under the activity “Post-doctoral research aid” realized at the Institute of Solid State Physics, University of Latvia is greatly acknowledged by D.B. A.K and J.P. would like to thank the support of the Latvian Council of Science project No. lzp-2018/2-0353. Authors have no conflict of interest to declare.
Data availability
The raw/processed data required to reproduce these findings cannot be shared at this time as the data also forms part of an ongoing study.
CRediT authorship contribution statement
D. Bocharov: Conceptualization, Data curation, Formal analysis, Funding acquisition, Investigation, Methodology, Project administration, Resources, Validation, Visualization, Writing - original draft, Writing - review & editing. M. Krack: Conceptualization, Data curation, Formal analysis, Investigation, Methodology, Resources, Software, Supervision, Writing - review & editing. Yu. Rafalskij: Data curation, Formal analysis, Investigation, Software, Validation, Visualization. A. Kuzmin: Conceptualization, Data curation, Formal analysis, Investigation, Methodology, Resources, Software, Supervision, Validation, Visualization, Writing - review & editing. J. Purans: Conceptualization, Funding acquisition, Investigation, Methodology, Project administration, Writing - review & editing.
References
- Evans et al. [1997] J. S. O. Evans, T. A. Mary, A. W. Sleight, Negative thermal expansion materials, Physica B 241-243 (1997) 311–316.
- Takenaka [2012] K. Takenaka, Negative thermal expansion materials: technological key for control of thermal expansion, Sci. Technol. Adv. Mater. 13 (2012) 013001.
- Dove and Fang [2016] M. T. Dove, H. Fang, Negative thermal expansion and associated anomalous physical properties: review of the lattice dynamics theoretical foundation, Rep. Prog. Phys. 79 (2016) 066503.
- Ventura and Perfetti [2014] G. Ventura, M. Perfetti, Thermal Properties of Solids at Room and Cryogenic Temperatures, Springer, 2014.
- Wang et al. [2015] L. Wang, C. Wang, Y. Sun, K. Shi, S. Deng, H. Lu, P. Hu, X. Zhang, Metal fluorides, a new family of negative thermal expansion materials, J. Materiomics 1 (2015) 106–112.
- Greve et al. [2010] B. K. Greve, K. L. Martin, P. L. Lee, P. J. Chupas, K. W. Chapman, A. P. Wilkinson, Pronounced negative thermal expansion from a simple structure: cubic ScF3, J. Am. Chem. Soc. 132 (2010) 15496–15498.
- Yang et al. [2016] C. Yang, P. Tong, J. C. Lin, X. G. Guo, K. Zhang, M. Wang, Y. Wu, S. Lin, P. C. Huang, W. Xu, W. H. Song, Y. P. Sun, Size effects on negative thermal expansion in cubic ScF3, Appl. Phys. Lett. 109 (2016) 023110.
- Hu et al. [2018] L. Hu, F. Qin, A. Sanson, L.-F. Huang, Z. Pan, Q. Li, Q. Sun, L. Wang, F. Guo, U. Aydemir, Y. Ren, C. Sun, J. Deng, G. Aquilanti, J. M. Rondinelli, J. Chen, X. Xing, Localized symmetry breaking for tuning thermal expansion in ScF3 nanoscale frameworks, J. Am. Chem. Soc. 140 (2018) 4477–4480.
- Morelock et al. [2013] C. R. Morelock, B. K. Greve, L. C. Gallington, K. W. Chapman, A. P. Wilkinson, Negative thermal expansion and compressibility of Sc1-xYxF3 (=0.25), J. Appl. Phys. 114 (2013) 213501.
- Morelock et al. [2014] C. R. Morelock, L. C. Gallington, A. P. Wilkinson, Evolution of negative thermal expansion and phase transitions in Sc1-xTixF3, Chem. Mater. 26 (2014) 1936–1940.
- Hu et al. [2014] L. Hu, J. Chen, L. Fan, Y. Ren, Y. Rong, Z. Pan, J. Deng, R. Yu, X. Xing, Zero thermal expansion and ferromagnetism in cubic Sc1-xMxF3 (M = Ga, Fe) over a wide temperature range, J. Am. Chem. Soc. 136 (2014) 13566–13569.
- Han et al. [2016] F. Han, J. Chen, L. Hu, Y. Ren, Y. Rong, Z. Pan, J. Deng, X. Xing, The distortion-adjusted change of thermal expansion behavior of cubic magnetic semiconductor (Sc1-xMx)F3 (M = Al, Fe), J. Am. Cer. Soc. 99 (2016) 2886–2888.
- Chen et al. [2017] J. Chen, Q. Gao, A. Sanson, X. Jiang, Q. Huang, A. Carnera, C. G. Rodriguez, L. Olivi, L. Wang, L. Hu, K. Lin, Y. Ren, Z. Lin, C. Wang, L. Gu, J. Deng, J. P. Attfield, X. Xing, Tunable thermal expansion in framework materials through redox intercalation, Nature Commun. 8 (2017) 14441.
- Morelock et al. [2015] C. R. Morelock, L. C. Gallington, A. P. Wilkinson, Solid solubility, phase transitions, thermal expansion, and compressibility in Sc1-xAlxF3, J. Solid State Chem. 222 (2015) 96–102.
- Pryde et al. [1997] A. K. A. Pryde, K. D. Hammonds, M. T. Dove, V. Heine, J. D. Gale, M. C. Warren, Rigid unit modes and the negative thermal expansion in ZrW2O8, Phase Transit. 61 (1997) 141–153.
- Tao and Sleight [2003] J. Tao, A. Sleight, The role of rigid unit modes in negative thermal expansion, J. Solid State Chem. 173 (2003) 442–448.
- Mladenović and Vukmirović [2018] M. Mladenović, N. Vukmirović, Effects of thermal disorder on the electronic structure of halide perovskites: insights from MD simulations, Phys. Chem. Chem. Phys. 20 (2018) 25693–25700.
- Bocharov et al. [2019] D. Bocharov, Y. Rafalskij, M. Krack, M. Putnina, A. Kuzmin, Negative thermal expansion of ScF3: first principles vs empirical molecular dynamics, IOP Conf. Ser.: Mater. Sci. Eng. 503 (2019) 012001.
- Li et al. [2011] C. W. Li, X. Tang, J. A. Muñoz, J. B. Keith, S. J. Tracy, D. L. Abernathy, B. Fultz, Structural relationship between negative thermal expansion and quartic anharmonicity of cubic ScF3, Phys. Rev. Lett. 107 (2011) 195504.
- Lazar et al. [2015] P. Lazar, T. Bučko, J. Hafner, Negative thermal expansion of ScF3: insights from density-functional molecular dynamics in the isothermal-isobaric ensemble, Phys. Rev. B 92 (2015) 224302.
- Kresse and Furthmüller [2007] G. Kresse, J. Furthmüller, VASP the guide, Institut für Materialphysik, Universität Wien, Wien, Austria, 2007.
- Oba et al. [2019] Y. Oba, T. Tadano, R. Akashi, S. Tsuneyuki, First-principles study of phonon anharmonicity and negative thermal expansion in ScF3, Phys. Rev. Materials 3 (2019) 033601.
- Keen and Goodwin [2015] D. A. Keen, A. L. Goodwin, The crystallography of correlated disorder, Nature 521 (2015) 303–309.
- Kuzmin and Chaboy [2014] A. Kuzmin, J. Chaboy, EXAFS and XANES analysis of oxides at the nanoscale, IUCrJ 1 (2014) 571–589.
- Kuzmin and Evarestov [2009] A. Kuzmin, R. A. Evarestov, Quantum mechanics-molecular dynamics approach to the interpretation of x-ray absorption spectra, J. Phys.: Condens. Matter 21 (2009) 055401.
- Kalinko et al. [2009] A. Kalinko, R. A. Evarestov, A. Kuzmin, J. Purans, Interpretation of EXAFS in ReO3 using molecular dynamics simulations, J. Phys.: Conf. Ser. 190 (2009) 012080.
- Kuzmin et al. [2016] A. Kuzmin, A. Anspoks, A. Kalinko, J. Timoshenko, The use of x-ray absorption spectra for validation of classical force-field models, Z. Phys. Chem. 230 (2016) 537–549.
- Bocharov et al. [2016] D. Bocharov, M. Chollet, M. Krack, J. Bertsch, D. Grolimund, M. Martin, A. Kuzmin, J. Purans, E. Kotomin, Interpretation of the U L3-edge EXAFS in uranium dioxide using molecular dynamics and density functional theory simulations, J. Phys.: Conf. Ser. 712 (2016) 012091.
- Bocharov et al. [2019] D. Bocharov, A. Anspoks, J. Timoshenko, A. Kalinko, M. Krack, A. Kuzmin, Interpretation of the Cu K-edge EXAFS spectra of Cu3N using ab initio molecular dynamics, Rad. Phys. Chem. (2019).
- Kohn and Sham [1965] W. Kohn, L. J. Sham, Self-consistent equations including exchange and correlation effects, Phys. Rev. 140 (1965) A1133–A1138.
- VandeVondele et al. [2005] J. VandeVondele, M. Krack, F. Mohamed, M. Parrinello, T. Chassaing, J. Hutter, Quickstep: Fast and accurate density functional calculations using a mixed Gaussian and plane waves approach, Comp. Phys. Commun. 167 (2005) 103–128.
- Lippert et al. [1997] G. Lippert, J. Hutter, M. Parrinello, A hybrid Gaussian and plane wave density functional scheme, Mol. Phys. 92 (1997) 477.
- Goedecker et al. [1996] S. Goedecker, M. Teter, J. Hutter, Separable dual-space gaussian pseudopotentials, Phys. Rev. B 54 (1996) 1703.
- Hartwigsen et al. [1998] C. Hartwigsen, S. Goedecker, J. Hutter, Relativistic separable dual-space Gaussian pseudopotentials from H to Rn, Phys. Rev. B 58 (1998) 3641.
- Krack [2005] M. Krack, Pseudopotentials for H to Kr optimized for gradient-corrected exchange-correlation functionals, Theor. Chem. Acc. 114 (2005) 145.
- VandeVondele and Hutter [2007] J. VandeVondele, J. Hutter, Gaussian basis sets for accurate calculations on molecular systems in gas and condensed phases, J. Chem. Phys. 127 (2007) 114105.
- Perdew et al. [1996] J. Perdew, K. Burke, M. Ernzerhof, Generalized gradient approximation made simple, Phys. Rev. Lett. 77 (1996) 3865–3868.
- Perdew et al. [2008] J. Perdew, A. Ruzsinszky, G. Csonka, O. Vydrov, G. Scuseria, L. Constantin, X. Zhou, K. Burke, Restoring the density-gradient expansion for exchange in solids and surfaces, Phys. Rev. Lett. 100 (2008) 136406.
- Bussi et al. [2007] G. Bussi, D. Donadio, M. Parrinello, Canonical sampling through velocity rescaling, J. Chem. Phys. 126 (2007) 014101.
- Hu et al. [2016] L. Hu, J. Chen, A. Sanson, H. Wu, C. G. Rodriguez, L. Olivi, Y. Ren, L. Fan, J. Deng, X. Xing, New insights into the negative thermal expansion: direct experimental evidence for the ”guitar-string” effect in cubic ScF3, J. Am. Chem. Soc. 138 (2016) 8320–8323.
- Bocharov et al. [2016] D. Bocharov, M. Krack, A. Kalinko, J. Purans, F. Rocca, S. E. Ali, A. Kuzmin, Ab initio molecular dynamics simulations of the Sc K-edge EXAFS of scandium trifluoride, J. Phys.: Conf. Ser. 712 (2016) 012009.
- Purans et al. [2016] J. Purans, S. Piskunov, D. Bocharov, A. Kalinko, A. Kuzmin, F. Rocca, Local structure of perovskites ReO3 and ScF3 with negative thermal expansion: interpretation beyond the quasiharmonic approximation, J. Phys.: Conf. Ser. 712 (2016) 012013.
- Rehr et al. [2010] J. J. Rehr, J. J. Kas, F. D. Vila, M. P. Prange, K. Jorissen, Parameter-free calculations of x-ray spectra with FEFF9, Phys. Chem. Chem. Phys. 12 (2010).
- Rehr and Albers [2000] J. J. Rehr, R. C. Albers, Theoretical approaches to x-ray absorption fine structure, Rev. Mod. Phys. 72 (2000) 621–654.
- Hedin and Lundqvist [1971] L. Hedin, S. Lundqvist, Explicit local exchange-correlation potentials, J. Phys. C: Solid State Phys. 4 (1971) 2064–2083.
- Hui et al. [2005] Q. Hui, M. G. Tucker, M. T. Dove, S. A. Wells, D. A. Keen, Total scattering and reverse Monte Carlo study of the 105 K displacive phase transition in strontium titanate, J. Phys.: Condens. Matter 17 (2005) S111–S124.
- Piskunov et al. [2016] S. Piskunov, P. A. Žguns, D. Bocharov, A. Kuzmin, J. Purans, A. Kalinko, R. A. Evarestov, S. E. Ali, F. Rocca, Interpretation of unexpected behavior of infrared absorption spectra of ScF3 beyond the quasiharmonic approximation, Phys. Rev. B 93 (2016) 214101.