Local Structure of Mott Insulating Iron Oxychalcogenides La2O2Fe2OM2 (M= S, Se)
Abstract
We describe the local structural properties of the iron oxychalcogenides, La2O2Fe2O (M = S, Se), by using pair distribution function (PDF) analysis applied to total scattering data. Our results of neutron powder diffraction show that M = S and Se possess similar nuclear structure at low and room temperatures. The local crystal structures were studied by investigating deviations in atomic positions and the extent of the formation of orthorhombicity. Analysis of the total scattering data suggests that buckling of the Fe2O plane occurs below 100 K. The buckling may occur concomitantly with a change in octahedral height. Furthermore, within a typical range of 1-2 nm, we observed short-range orthorhombic-like structure suggestive of nematic fluctuations in both of these materials.
I Introduction
Iron-based superconductors (FeSCs) has attracted a large amount of attention due to the high transition temperature at which they become superconducting. Although the precise pairing mechanism in these materials remains unknown, it is thought that electron-electron interactions play an important role. Such unconventional superconductivity is in contrast to the conventional electron-phonon coupling Si et al. (2016); Paglione and Greene (2010) present in BCS superconductors. In order to examine the strong-Coulombic postulate for Fe pnictides and chalcogenides, studies were conducted Zhao et al. (2019); Yildirim (2009); Si and Abrahams (2008); Mansart et al. (2010); Lee et al. (2019); Wong and Lortz (2019) to find iron-based Mott insulators that could be driven into the superconducting phase Abrahams and Si (2011); Shrivastava and Kumar (2019). The iron oxychalcogenides La2O2Fe2O ( = S, Se) emerged as a candidate material because they are Mott insulators with structural similarities to the iron pnictides. Several attempts to induce SC in La2O2Fe2O(S, Se)2 have been made; however, to date, there are no published reports of SC in these systems Landsgesell et al. (2014). Nevertheless, studying non-superconducting Mott insulators such as La2O2Fe2O can enhance our understanding of the Mott insulating region of the iron-chalcogenide electronic phase diagram Si et al. (2016).
Studying the Mott insulating phase in iron oxychalcogenides might enhance our understanding of the strongly correlated scenarios that lead to high temperature superconductivity Zhu et al. (2010). Superconductivity in the cuprate superconductors is based on an electron or hole doping of a strongly correlated, Mott insulating phase Lee et al. (2006). Hole-doped cuprates are prone to a variety of different type of electronic ordering like charge ordering and nematic ordering Fischer et al. (2014). The electronic nematicity breaks rotational symmetry while preserving the translational symmetry; this phase has been observed in the iron-based superconductors.
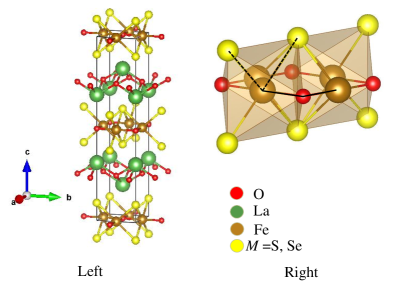
The iron oxychalcogenides La2O2Fe2O were first reported as antiferromagnetic (AFM) by Mayer et. al. Mayer et al. (1992). This layered mixed anion material consists of a body-centered tetragonal crystal structure (4/) with fluorite-like [La2O2]2+ layers and [Fe2O]2+ sheets separated by 2- anions Freelon et al. (2019). In this structure, [Fe2O]2+ consists of an anti-CuO2 arrangement with an Fe2+ cation coordinated by four M2- (above and below the plane) and two in-plane oxygen atoms, forming a tilted Fe-centered FeO2Se4 octahedron Mayer et al. (1992); McCabe et al. (2014a); Oogarah et al. (2018); Free and Evans (2010); Zhu et al. (2010); Craco et al. (2018). Fig. 1 shows the crystal structure of La2O2Fe2O and its octahedra. While an antiferromagnetic ordering was observed at Néel temperatures of 107.2 K and 90.1 K for La2O2Fe2OS2 and La2O2Fe2OSe2, respectively Freelon et al. (2019), structural studies using X-ray Free and Evans (2010) and neutron Freelon et al. (2019) powder diffraction studies did not observe a structural phase transition in La2O2Fe2O(S, Se)2. Inelastic neutron scattering (INS) experiments have indicated the AFM order to be consistent with a 2 - magnetic structure in which two spin stripe phases are oriented 90∘ with respect to each other. Freelon et al. (2019); Stock and McCabe (2016); Günther et al. (2014); McCabe et al. (2014a)
Therefore, the structural and magnetic behavior do not have a similar correspondence that is observed in some iron-pnictides and iron-chalcogenides in which the magnetic and structural phase transitions are in very close proximity. The absence of a structural phase transition in the La2O2Fe2O(S, Se)2 Mott insulators motivates us to study the local structure to determine whether their short-range lattice symmetries undergo changes at the magnetic transitions. In particular, we are interested in understanding whether local deviations from the average tetragonal structure occur and we seek to characterize lattice correlations with physical properties.
To date, several studies of FeSCs Dai et al. (2012); Fernandes et al. (2014); Chu et al. (2012); Li et al. (2017); Fernandes and Millis (2013); Fradkin et al. (2010) have revealed the presence of a long-range, non-superconducting state called the nematic phase Fernandes et al. (2014) that precedes the superconducting phase transition. The long-range nematic phase, which has been observed in both iron pnictides and iron chalcogenides, develops at a structural phase transition temperature higher than a magnetic transition temperature Chubukov et al. (2015). The long-range nematic ordering is manifested by spontaneous rotational symmetry breaking while the translational symmetry is preserved Frandsen et al. (2018, 2017). In iron pnictide superconductors symmetry is broken between x and y directions in the Fe-plane Fernandes et al. (2014). This reduces the rotational point group symmetry from tetragonal to orthorhombic while preserving the translational symmetry. Frandsen et al. (2018); Fradkin et al. (2010). A hallmark feature of the nematic phase in the FeSCs is the presence of large anisotropies of electronic properties, such as the resistivity, along the x and y directions. These anisotropies are larger than would be expected from the magnitude of the structural distortion alone, indicating that the nematic instability exists in the electronic system, while the structural symmetry breaking is simply a consequence of the underlying electronic symmetry breaking. Similar electronic nematicity has also been observed in other electron fluids such as those observed in the cuprates or quantum Hall systems Okamoto et al. (2010); Fradkin et al. (2010). This electronic nematicity is related to, but distinct from, other types of nematicity, such as the original use of the term to describe the directional alignment of molecules in liquid crystals Okamoto et al. (2010), or a purely structural nematic order that is unrelated to any instabilities of an electron fluid.
In the case of FeSCs, the nematic state is suppressed upon doping, and superconductivity eventually emerges out of the nematic phase Kushnirenko et al. (2018); Koch et al. (2019). Sometimes, nematic ordering persists into the superconducting state, as in LiFeAs Yim et al. (2018). The origin of the electronic nematic ordering is not yet fully understood. In the pnictides, it appears to be related to the magnetism, but this may not be the case in iron-chalcogenides such as FeSe, which does not show long-range magnetic ordering Chubukov et al. (2015).
Recently, the pair distribution function (PDF) technique Egami and Billinge (2003); Farrow et al. (2007a) has been used to study the local atomic arrangement and structural fluctuations frequently associated with nematic fluctuations in iron-based superconductors for both normal and superconducting phases. PDF methods can be used to measure local scale deviations from the global crystal symmetry of a material Frandsen et al. (2019); Fernandes et al. (2014). In FeSe1-xTex systems, PDF investigated the reduction of local crystal symmetry which enhances the local moment formation leading to magnetic instability Louca et al. (2010). X-ray and neutron PDF on FeSe and (Sr, Na)Fe2As2 revealed the presence of short-range orthorhombic distortions at temperatures well above the static nematic and orthorhombic ordering temperature Koch et al. (2019); Frandsen et al. (2019, 2017, 2018). These short-range orthorhombic fluctuations of the structure were interpreted as consequences of fluctuations of the underlying electronic nematic phase. The observation of structural nematic fluctuations in iron-based superconductors, by using neutron and x-ray PDF analysis, provided evidence that nematic degrees of freedom exist near the superconducting phase Frandsen et al. (2018). PDF analysis has also been used by Horigane et. al Horigane et al. (2014a) to probe the local structure of La2O2Fe2OS2 and found a large anisotropic thermal displacement parameter for the O(2) atom along the -axis (). That study concluded that the crystal structure is strongly coupled to the magnetism in this system.
In this work, we report the use of the neutron pair distribution function (PDF) technique to study the local structure of La2O2Fe2O(S, Se)2. The experimental methods are discussed in Section II, the results of this study are presented in Section III, section IV includes the discussion and the conclusions are presented in section V. Our results indicate the presence of short-range orthorhombic distortions suggestive of short-range nematicity in both materials La2O2Fe2O(S, Se)2, despite the persistence of tetragonal symmetry in the average structure at all temperatures. We discuss the behavior of these fluctuations as a function of temperature. It appears that the change in the chalcogen, from S to Se, does not affect this behavior.
II Experimental methods
II.0.1 Synthesis
La2O2Fe2O(S, Se)2 samples were prepared by a solid-state reaction method Mayer et al. (1992) from stoichiometric amounts of high purity La2O3, S, Se, and Fe powders. The appropriate mixture of these powders was grounded thoroughly, pelletized then heated in an evacuated quartz tube at 1030∘ C for 72 hours. This process was repeated three times. After being pulverized into fine powders, lab-based x-ray powder diffraction showed the materials to be of the high-quality and single phase Mayer et al. (1992); Freelon et al. (2019); Zhu et al. (2010).
II.0.2 Neutron Powder Diffraction
Time-of-flight (TOF) neutron powder diffraction measurements were performed at the POWGEN diffractometer of the Spallation Neutron Source (SNS) at Oak Ridge National Laboratory (ORNL). Five grams of La2O2Fe2OS2 and 4.5 g of La2O2Fe2OSe2 powders were placed in vanadium cans. Room temperature (300 K) measurement were performed, on each sample, for approximately one hour. The center wavelength and -spacing range of neutrons in this experiment were 1.5 Å and 0.49664-13.50203 Å respectively. Rietveld refinements were conducted using GSAS-II software Toby and Von Dreele (2013).
II.0.3 Pair Distribution Function
Neutron total scattering data were collected using the Nano-scale Ordered Materials Diffractometer (NOMAD) beamline at the SNS in ORNL. La2O2Fe2O(S, Se)2 powders were loaded and sealed in the vanadium cans inside a glove-box and were placed in an orange cryostat. A total of sixteen measurements were performed on each sample at various temperatures ranging from 2 K to 300 K. A higher number of data points were taken, in small steps, around the Néel temperature. Data were collected for approximately two hours at each temperature. In order to obtain structural information relevant to the samples, an empty vanadium sample can was measured for two hours for background subtraction.
The reduced pair distribution function (PDF) is obtained experimentally by Fourier transforming the total scattering data as follows:
| (1) |
Where is the normalized structure factor, and is the scattering vector, defined as in which and are the neutron wavelength and scattering angle, respectively. PDF data were refined and analyzed using PDFGUI Farrow et al. (2007a) program and DIFFPY-CMI Juhás et al. (2018) suite. For the PDF analysis, values for and were 0.1 Å and 31.4 Å respectively. The calculated reduced pair distribution function is obtained from the structural model using equation (2) Proffen and Billinge (1999).
| (2) |
where , and are the average scattering power of constituent atoms of the sample. The summation is over all atoms and in the model, where the distance separating any given pair of atoms is .
III Results
III.1 Average and Local Structure
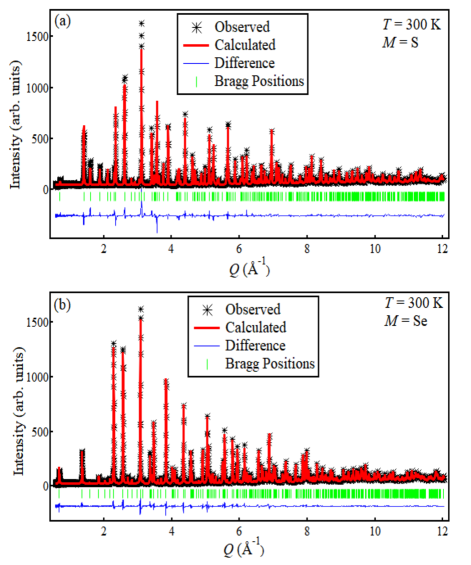
We confirmed the crystal structure of our samples through the neutron powder diffraction. The Rietveld refinement of neutron powder diffraction data was performed using GSAS II software Toby and Von Dreele (2013). Fig. 2(a) and (b) show the Rietveld refinement of neutron powder diffraction data measured at 300 K using neutrons of central wavelength 1.5 Å. Both = S, Se materials show similar nuclear structures having space group (space group No. 139) which is consistent with the previous studies Mayer et al. (1992); Freelon et al. (2019). Our findings show that the lattice parameters of La2O2Fe2OSe2 ( = 4.0887(5) Å, = 18.6081(3) Å) is larger than that of the La2O2Fe2OS2 ( = 4.0439(9) Å, = 17.8945(6) Å), as expected for the larger Se atoms. Rietveld refinement parameters of both = S, Se are tabulated in Table 1 including lattice parameters ( and ) as well as the anisotropic thermal displacement parameters for all atoms. It was observed that for O(2) site is much larger than all the other sites. For completeness Table 2 presents the atomic positions of constituents La2O2Fe2O ( = S, Se) with their respective Wyckoff symbols and occupancies. The quality of the presented fits was characterized by the listed Rietveld parameters: -whole pattern , crystallographic factor and goodness of fit tabulated in Table 1.
| La2O2Fe2OSe2 | La2O2Fe2OS2 | ||
| (Å) | 4.0887(5) | 4.0439(9) | |
| (Å) | 18.6081(3) | 17.8945(6) | |
| La - (Å2) | 0.0028(8) | 0.00123(9) | |
| Fe - (Å2) | 0.0065(4) | 0.00729(5) | |
| O(1) - (Å2) | 0.0038(4) | 0.00013(4) | |
| O(2) - (Å2) | 0.0037(7) | 0.00510(6) | |
| (Å2) | 0.0066(3) | 0.00319(8) | |
| La - (Å2) | 0.00722(5) | 0.01718(6) | |
| Fe - (Å2) | 0.01077(5) | 0.02258(8) | |
| O(1) - (Å2) | 0.00998(8) | 0.02049(9) | |
| O(2) - (Å2) | 0.02226(9) | 0.04643(5) | |
| (Å2) | 0.00522(5) | 0.02124(9) | |
| Volume (Å3) | 311.08(8) | 292.64(1) | |
| Space Group | |||
| (%) | 6.74 | 6.79 | |
| (%) | 2.71 | 6.57 | |
| Goodness of fit | 4.73 | 6.57 |
| La2O2Fe2OSe2 | La2O2Fe2OS2 | |||||||||||
|---|---|---|---|---|---|---|---|---|---|---|---|---|
| Atom | Site | Occupancy | x | y | z | Atom | Site | Occupancy | x | y | z | |
| La | 4e | 0.97(5) | 0.5000 | 0.5000 | 0.1845(6) | La | 4e | 0.94(7) | 0.5000 | 0.5000 | 0.1806(7) | |
| Fe | 4c | 0.94(5) | 0.5000 | 0.0000 | 0.0000 | Fe | 4c | 0.92(7) | 0.5000 | 0.0000 | 0.0000 | |
| Se | 4e | 0.95(6) | 0.0000 | 0.0000 | 0.0963(6) | S | 4c | 0.92(8) | 0.0000 | 0.0000 | 0.0945(13) | |
| O1 | 4d | 0.98(6) | 0.5000 | 0.0000 | 0.2500 | O1 | 4d | 0.94(9) | 0.5000 | 0.0000 | 0.2500 | |
| O2 | 2b | 0.97(7) | 0.5000 | 0.5000 | 0.0000 | O2 | 2b | 0.96(6) | 0.5000 | 0.5000 | 0.0000 |
| La2O2Fe2OSe2 | La2O2Fe2OS2 | |||||
|---|---|---|---|---|---|---|
| Pseudo-Orthorhombic | Tetragonal | Pseudo-Orthorhombic | Tetragonal | |||
| 24.20 | 43.77 | 41.45 | 74.13 | |||
| 0.03 | 0.05 | 0.05 | 0.09 | |||
| 0.11 | 0.16 | 0.14 | 0.20 |
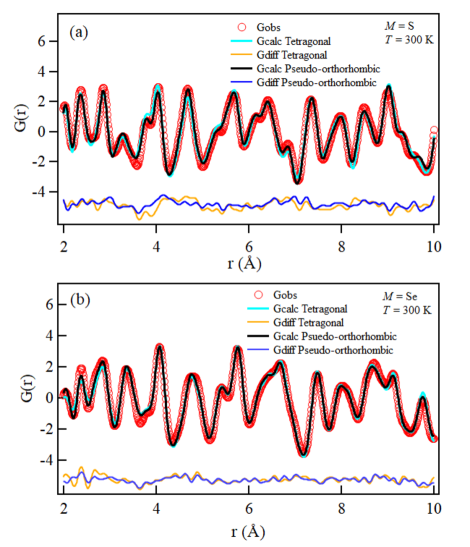
Having obtained a confirmation of the global lattice symmetry for our samples, we then investigated the local symmetry Koch et al. (2019); Frandsen et al. (2018); White et al. (2010); Paściak et al. (2019); Slawinski et al. (2019); Jeong and Kim (2019). The local structure data of La2O2Fe2O ( = S, Se) was analyzed by using the PDF refinement program PDFGUI Farrow et al. (2007a) to determine the lattice parameters, scale factor, atomic positions, and the thermal parameters. In order to allow for local orthorhombic symmetry breaking, we parameterized the lattice constants as and , where and . The orthorhombicity parameter, was refined with a pseudo-orthorhombic model while in tetragonal model is 0 as lattice parameter and were equal. All refinements were performed on the Nyquist grid. Instrumental parameters and , which are the parameters that correct the PDF envelope function Masadeh et al. (2007); Toby and Egami (1992) for the instrument resolution Proffen and Billinge (1999); Farrow et al. (2007a), were fixed by using an independent measurement of a standard Si sample. A direct comparison of quality of fit parameters of pseudo-orthorhombic symmetry and tetragonal symmetry PDF fits of room temperature data of La2O2Fe2O ( = S, Se) is shown in Table 3 and Fig. 3. It is clear that pseudo-orthorhombic model provides a significant improvement to the fit over the tetragonal model. This suggests that the local structure undergoes short-range orthorhombic distortions, while the average structure captured by Rietveld refinement against the Bragg peaks is purely tetragonal.
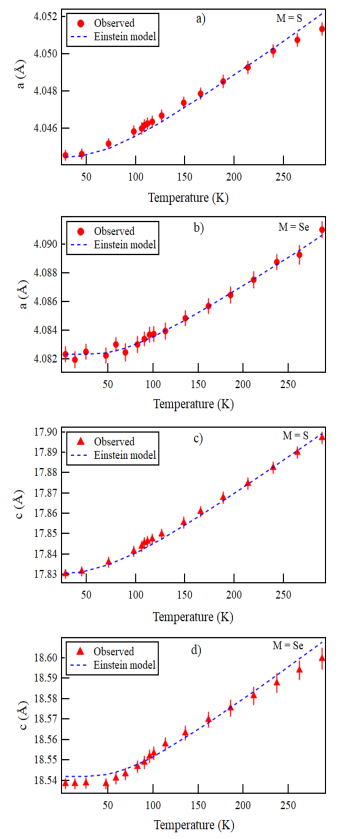
The lattice constants were obtained as a function of temperature using PDF analysis. Fig. 4 shows the temperature dependence of the lattice parameters and for both La2O2Fe2O(S, Se)2 samples in the range of 1.8 to 49.99 Å, where the Einstein model was superimposed to such obtained () and () dependencies. Following previous work Free and Evans (2010), the Einstein fitting model was calculated using equations (3) and (4) under the assumption that the thermal expansion is proportional to the internal energy of a quantum mechanical oscillator Kröncke et al. (2008). Fig. 4 also shows that the lattice parameter increases with increasing temperature and fits well with the Einstein model of thermal expansion Kröncke et al. (2008). However, the lattice parameter shows a kink near 90 K in the case of = Se (see discussion).
| (3) |
| (4) |
Here, is the lattice constant, and are lattice constants at low temperature (2k for = Se and 30 k for = S system) obtained from PDF fits, is the high temperature thermal expansion coefficient, and is the characteristic Einstein temperature. In our plots, we have used = 211 K as reported by Free et al. Free and Evans (2010).
III.2 Temperature Dependence of Thermal Displacement Parameters
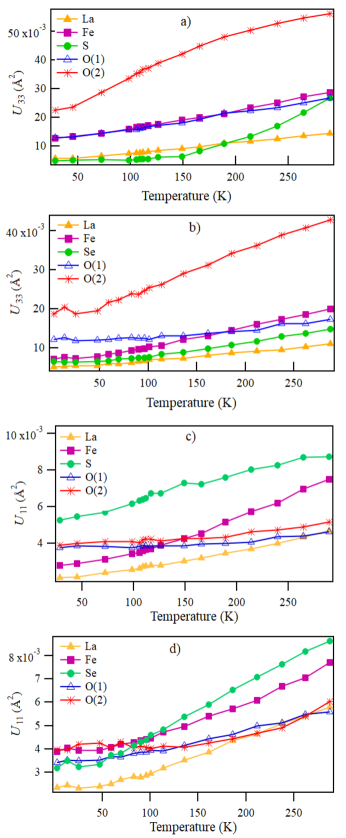
Fig. 5 shows the temperature dependence of the anisotropic thermal displacement parameters and for both = S, Se from PDF fits. We note the relatively high values of parameter for the = S, Se sites and the parameter for the O(2) site. The large parameter for the O(2) site agrees well with the neutron powder diffraction results (See Table 1). The large an anisotropic thermal displacement parameter corresponds to O(2) displacement above and below the Fe2O plane. This particular displacement can be accompanied by a distortion of Fe-O-Fe angle (See Fig. 1 where this angle is highlighted by a solid black line in the octahedra). Another possible movement along the -axis is that of sulfur/selenium atoms with respect to the Fe atoms in the octahedra. This motion would affect the -Fe- angle in the octahedra (See Fig. 1 where this angle is highlighted by dashed black lines in the octahedra).
Fig. 6 provides views of the atomic displacements under discussion. Panel a) shows a view along the -axis while panel b) provides an isometric perspective view by presenting slight rotations about the and crystal axes. In panel b) black solid lines show the Fe atom movement and black dashed line shows the movement of O(2) atom. When the O(2) atoms in the Fe2O plane move up or down the angle Fe-O-Fe changes causing buckling of the Fe2O plane. O(2) atoms are displacing out of the plane by 0.015 (2) Å. Allowing the -coordinates of the two O(2) atoms to displace opposite to each other results in the parameter for the O(2) site dropping down to a value that is in line with other atomic sites. This result suggests that local buckling of the Fe2O plane may occur through small displacements of the O(2) atom above and below the plane.

III.3 Local Orthorhombicity
The use of pre-written macros allows PDFGUI to fit data sets through a series of boxcar refinements that differ one from another by corresponding fitting ranges Farrow et al. (2007b). Since we have collected PDF data sets over a wide range of temperatures, we used PDFGUI - series and - series macros to study details of the local to average structure crossover in our materials. These macros allow the setup of boxcar fits, in which the same model is fitted over different real space intervals (- ranges) for different temperatures of the PDF data Abeykoon et al. (2009).
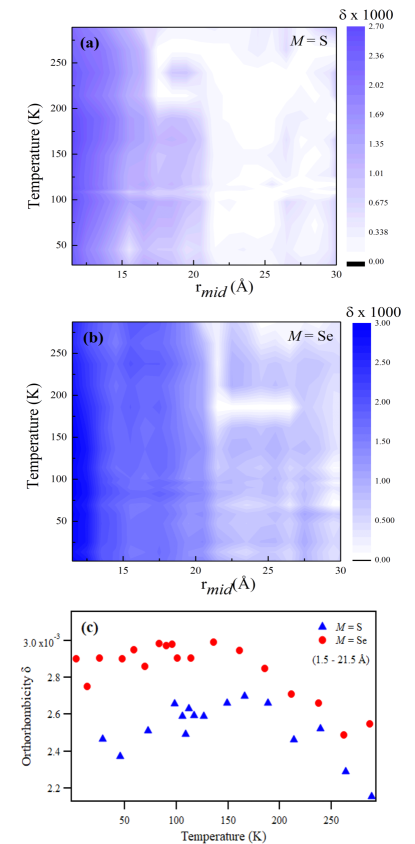
We have performed extensive - and - series PDF fits to determine the atomic structure as a function of temperature and length scale Frandsen et al. (2018). The evolution of the orthorhombicity of the local structure (short-range) to the average structure (long range) is presented in the color maps of Fig. 7.
We did the - series refinement by performing the PDF fits on low temperature data at first, then we run the sequential PDF fits for all of our data collected at various temperatures.
For each temperature data, we have performed the - series refinement in a sliding 20 Å data window from [1.5 - 21.5 Å] to [29.5 - 49.5 Å] in 1 Å steps, resulting in 29 fits per temperature. Orthorhombicity () was extracted from all of these fits for all temperatures to produce the color maps. Color maps were made using the ORIGIN software OriginPro 2013 . In these color maps, the midpoint of the fitting range rmid is shown on the x-axis, the temperature is shown on the y-axis, and orthorhombicity is shown on the color bar as indicated by the brightness of the colors from light blue to dark blue. The dark blue color denotes high orthorhombicity, light blue represent zero orthorhombicity , tetragonality. The maps indicate that at short ranges, over all temperatures, the presence of orthorhombicity is observed, but it diminishes over longer length scales. Fig. 7(c) shows the temperature dependence of short-range orthorhombicity for La2O2Fe2O(S, Se)2. It was observed that orthorhombicity is independent of temperature below 150 K and at higher temperatures, orthorhombicity decreases slightly with temperature.
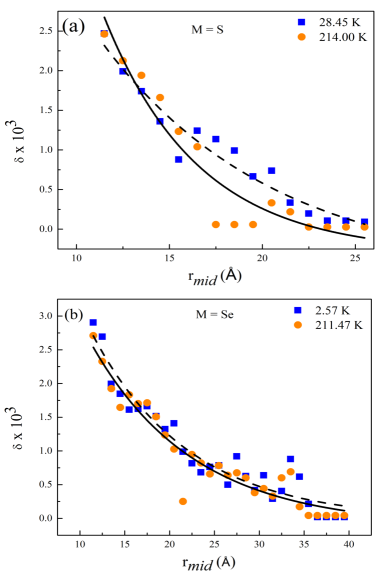
Fig. 8 presents the local orthorhombicity as a function of the midpoint of the fitting ranges for two representative temperatures. Data were fitted with exponential decay functions,
| (5) |
where decay length is defined as .
Fig. 8(a) shows the orthorhombicity of = S at 28.45 K and 214.0 K. At both temperatures, the orthorhombicity is largest at short fitting ranges and it asymptotically approaches zero at larger fitting ranges. A black solid (dashed) line shows the exponential fitting function for 28.45 K (214.0 K) with decay lengths of 6.4(2)Å (3.5(9)Å), respectively. Fig.8(b) displays the orthorhombicity at different fitting ranges for = Se at temperature 2.57 K and 211.47 K. Black solid (dashed) line shows the exponential fitting function for 2.57 K (211.47 K) with decay length of 7.5(3)Å (7.9(6)Å), respectively. Figs. 8(a) and (b) provide evidence of the greater orthorhombicity at shorter ranges.
IV Discussion
Neutron powder diffraction experiments confirmed the average crystal structure of La2O2Fe2O(S, Se)2 as tetragonal systems with space group (4/) (see Fig. 2) in agreement with the previous studies on these materials Mayer et al. (1992); McCabe et al. (2014a); Oogarah et al. (2018); Free and Evans (2010); Zhu et al. (2010); Freelon et al. (2019). Unlike many iron pnictides which undergo a structural phase transition from tetragonal to orthorhombic symmetries near , La2O2Fe2O(S, Se)2 lattice symmetries are not observed to change with temperature. However, both La2O2Fe2O(S, Se)2 undergo a magnetic transitions from paramagnetic (PM) phases to antiferromagnetic (AFM) phases at respective Néel temperatures . Neutron powder diffraction (Fig. 5 and Table 1) showed that the thermal displacement parameter for the O(2) atom along the -axis was larger than all the other thermal displacement parameters. This was the finding for both materials = S and Se.
In order to probe the local structure, we employed the neutron PDF technique to investigate the local changes in the atomic positions and -axes of La2O2Fe2O(S, Se)2. The PDF analysis revealed similar thermal displacement behavior on short length scales. In addition, the temperature dependence of the -lattice parameter showed a kink near the Néel temperature for = Se (see Fig. 4). However, no discontinuity was observed in the case of = S. Such a finding is consistent with previous reports of -lattice discontinuities in oxyselenides McCabe et al. (2014b); Oogarah et al. (2017); Free and Evans (2010) and the less prominent occurrence of this behavior in the oxysulfides Oogarah et al. (2018). The discontinuities were attributed to magnetostrictive effects in the oxyselenides. In the case of oxysulfides, a relatively reduced amount of -lattice discontinuity was argued to be due to shorter -lattices Oogarah et al. (2018). According to Horigane et al. Horigane et al. (2014a) deviations in the -lattice parameter from the average crystallographic structure are due to the fact that the thermal displacement parameter for O(2) along the -axis grows rapidly with the increase in temperature. A similar O(2) trend, in SrFeO2 Horigane et al. (2014b), was reported to be related to Fe2O planar buckling.
For La2O2Fe2O(S, Se)2, buckling of the Fe2O plane may occur when there is distortion in either the Fe or O(2) sites. In the case of = Se, a high value for O(2) (see Fig. 5) suggests that the largest distortions should occur for that site. A distortion in the Fe site can lead to two Fe-Se correlations since each Fe atom is surrounded by four Se atoms of the octahedra (see Fig. 6b). Overall, these findings for = Se suggest that there is a distortion either in the Fe or O(2) sites, and both implicated as possible reasons for Fe2O buckling.
Our analysis of the local structure of La2O2Fe2O(S, Se)2reveals the presence of short-range orthorhombic distortions on a length scale of 1 - 2 nm over a temperature range from 2 - 300 K. These distortions are very similar to those found in FeSe Koch et al. (2019); Frandsen et al. (2019) and (Sr, Na)Fe2As2 Frandsen et al. (2018, 2017), which have been attributed to short-range, structural nematic fluctuations that persist up to temperatures well above the magnetic and/or structural transition temperatures. Given the structural and magnetic similarities between these iron oxychalcogenides and the superconducting iron pnictides and chalcogenides, we suggest that the local orthorhombicity observed here is likewise related to fluctuating, short-range electronic nematic distortions. The short-range orthorhombicity observed upto high temperature ( 300 K) in these systems may reflect a similar large nematic energy scale as was observed in FeSCs such as FeSe Yi et al. (2019) and (Sr, Na)Fe2As2 Frandsen et al. (2019).
The occurrence of such distortions across a variety of pnictide superconductors and the incoherent electronic systems presented here raise the question of how are these short-range orthorhombic distortions related to the superconducting mechanism. Inquiry into the role of nematicity has become the key focal point of the field of iron-based high- superconductivity. Studies of short-range orthorhombic fluctuations, such as those reported here, may provide information about the origin of electronic nematicity and its relation to superconductivity mechanism Kuo et al. (2016); Böhmer and Meingast (2016); Rosenthal et al. (2014); Frandsen et al. (2019); Koch et al. (2019); Wang et al. (2017); Dai (2015); Stewart (2011).
The presence of local orthorhombicity that appears to be ubiquitous may be suggestive of nematic degrees of freedom being ubiquitously active in layered iron-based systems. It also suggests that active nematic degrees of freedom are not sufficient to guarantee superconductivity, although they may well be necessary. It may be the case that nematic fluctuations and another phase must conspire to produce high-temperature superconductivity in iron-based systems. The energy-integrated nature of the PDF measurements means we are probing fluctuations on a time scale of 10-13 s or slower. However, we were unable to extract any other temporal information using the PDF data alone Frandsen et al. (2017). Complementary probes such as NMR or Mössbauer spectroscopy could help clarify the situation Freelon et al. (2021).
V Conclusions
The local structure of Mott insulating iron oxychalcogenides was studied using neutron powder diffraction and pair distribution techniques. Neutron powder diffraction showed a similar nuclear structure of = Se and S with the only difference in the atomic radii of two chalcogens. Pair distribution function analysis indicated the presence of the local distortion between tetragonal and orthorhombic symmetry. These findings suggest the presence of orthorhombic fluctuations suggestive of short-range nematicity with a typical length scale of 1 - 2 nm in both of these materials.
VI Acknowledgments
The authors would like to thank the University of Louisville for funding support. Alfailakawi would like to thank Kuwait University for supporting this work through a graduate scholarship. Work at University of Houston was supported by the State of Texas through TcSUH. The research in ZJU is supported by the Ministry of Science and Technology of China under Grants No. 2016YFA0300402 and No. 2015CB921004 and the National Natural Science Foundation of China (NSFC) (No. 11974095, 11374261), and the Fundamental Research Funds for the Central Universities. This work used resources of the Spallation Neutron Source, a DOE office of Science User Facility operated by the Oak Ridge National Laboratory.
References
- Si et al. (2016) Q. Si, R. Yu, and E. Abrahams, Nature Reviews Materials 1, 16017 (2016).
- Paglione and Greene (2010) J. Paglione and R. L. Greene, Nature Physics 6, 645 (2010).
- Zhao et al. (2019) L. Zhao, D. Wang, Q. Huang, H. Wu, R. Sun, X. Fan, Y. Song, S. Jin, and X. Chen, Physical Review B 99, 094503 (2019).
- Yildirim (2009) T. Yildirim, Phys. Rev. Lett. 102, 037003 (2009).
- Si and Abrahams (2008) Q. Si and E. Abrahams, Phys. Rev. Lett. 101, 076401 (2008).
- Mansart et al. (2010) B. Mansart, D. Boschetto, A. Savoia, F. Rullier-Albenque, F. Bouquet, E. Papalazarou, A. Forget, D. Colson, A. Rousse, and M. Marsi, Phys. Rev. B 82, 024513 (2010).
- Lee et al. (2019) S. Lee, S. Roh, Y.-S. Seo, M. Lee, E. Jung, J. M. Ok, M.-C. Jung, B. Kang, K.-W. Lee, J. S. Kim, et al., Journal of Physics: Condensed Matter 31, 445602 (2019).
- Wong and Lortz (2019) C. H. Wong and R. Lortz, arXiv preprint arXiv:1902.06463 (2019).
- Abrahams and Si (2011) E. Abrahams and Q. Si, Journal of physics: Condensed matter 23, 223201 (2011).
- Shrivastava and Kumar (2019) S. K. Shrivastava and G. Kumar, International Journal of Emerging Technologies and Innovative Research 6, 417 (2019).
- Landsgesell et al. (2014) S. Landsgesell, K. Prokeš, T. Hansen, and M. Frontzek, Acta Materialia 66, 232 (2014).
- Zhu et al. (2010) J.-X. Zhu, R. Yu, H. Wang, L. L. Zhao, M. D. Jones, J. Dai, E. Abrahams, E. Morosan, M. Fang, and Q. Si, Phys. Rev. Lett. 104, 216405 (2010).
- Lee et al. (2006) P. A. Lee, N. Nagaosa, and X.-G. Wen, Rev. Mod. Phys. 78, 17 (2006).
- Fischer et al. (2014) M. H. Fischer, S. Wu, M. Lawler, A. Paramekanti, and E.-A. Kim, New Journal of Physics 16, 093057 (2014).
- Mayer et al. (1992) J. M. Mayer, L. F. Schneemeyer, T. Siegrist, J. V. Waszczak, and B. Van Dover, Angewandte Chemie International Edition in English 31, 1645 (1992).
- Freelon et al. (2019) B. Freelon, Z. Yamani, I. Swainson, R. Flacau, B. Karki, Y. H. Liu, L. Craco, M. S. Laad, M. Wang, J. Chen, R. J. Birgeneau, and M. Fang, Phys. Rev. B 99, 024109 (2019).
- McCabe et al. (2014a) E. E. McCabe, C. Stock, E. E. Rodriguez, A. S. Wills, J. W. Taylor, and J. S. O. Evans, Phys. Rev. B 89, 100402(R) (2014a).
- Oogarah et al. (2018) R. K. Oogarah, E. Suard, and E. E. McCabe, Journal of Magnetism and Magnetic Materials 446, 101 (2018).
- Free and Evans (2010) D. G. Free and J. S. O. Evans, Phys. Rev. B 81, 214433 (2010).
- Craco et al. (2018) L. Craco, B. Freelon, A. M. Alafailakawi, B. Karki, and S. Leoni, Phys. Rev. B 98, 045130 (2018).
- Stock and McCabe (2016) C. Stock and E. E. McCabe, Journal of Physics: Condensed Matter 28, 453001 (2016).
- Günther et al. (2014) M. Günther, S. Kamusella, R. Sarkar, T. Goltz, H. Luetkens, G. Pascua, S.-H. Do, K.-Y. Choi, H. D. Zhou, C. G. F. Blum, S. Wurmehl, B. Büchner, and H.-H. Klauss, Phys. Rev. B 90, 184408 (2014).
- Dai et al. (2012) P. Dai, J. Hu, and E. Dagotto, Nature Physics 8, 709 (2012).
- Fernandes et al. (2014) R. M. Fernandes, A. V. Chubukov, and J. Schmalian, Nature Physics 10, 97 (2014).
- Chu et al. (2012) J.-H. Chu, H.-H. Kuo, J. G. Analytis, and I. R. Fisher, Science 337, 710 (2012).
- Li et al. (2017) J. Li, P. J. Pereira, J. Yuan, Y.-Y. Lv, M.-P. Jiang, D. Lu, Z.-Q. Lin, Y.-J. Liu, J.-F. Wang, L. Li, et al., Nature communications 8, 1880 (2017).
- Fernandes and Millis (2013) R. M. Fernandes and A. J. Millis, Physical review letters 111, 127001 (2013).
- Fradkin et al. (2010) E. Fradkin, S. A. Kivelson, M. J. Lawler, J. P. Eisenstein, and A. P. Mackenzie, Annu. Rev. Condens. Matter Phys. 1, 153 (2010).
- Chubukov et al. (2015) A. V. Chubukov, R. M. Fernandes, and J. Schmalian, Physical Review B 91, 201105(R) (2015).
- Frandsen et al. (2018) B. A. Frandsen, K. M. Taddei, D. E. Bugaris, R. Stadel, M. Yi, A. Acharya, R. Osborn, S. Rosenkranz, O. Chmaissem, and R. J. Birgeneau, Phys. Rev. B 98, 180505(R) (2018).
- Frandsen et al. (2017) B. A. Frandsen, K. M. Taddei, M. Yi, A. Frano, Z. Guguchia, R. Yu, Q. Si, D. E. Bugaris, R. Stadel, R. Osborn, S. Rosenkranz, O. Chmaissem, and R. J. Birgeneau, Phys. Rev. Lett. 119, 187001 (2017).
- Okamoto et al. (2010) S. Okamoto, D. Sénéchal, M. Civelli, and A.-M. S. Tremblay, Phys. Rev. B 82, 180511(R) (2010).
- Kushnirenko et al. (2018) Y. Kushnirenko, D. Evtushinsky, T. Kim, I. Morozov, L. Harnagea, S. Wurmehl, S. Aswartham, A. Chubukov, and S. Borisenko, arXiv preprint arXiv:1810.04446 (2018).
- Koch et al. (2019) R. J. Koch, T. Konstantinova, M. Abeykoon, A. Wang, C. Petrovic, Y. Zhu, E. S. Bozin, and S. J. L. Billinge, Phys. Rev. B 100, 020501(R) (2019).
- Yim et al. (2018) C. M. Yim, C. Trainer, R. Aluru, S. Chi, W. N. Hardy, R. Liang, D. Bonn, and P. Wahl, Nature Communications 9, 2602 (2018).
- Egami and Billinge (2003) T. Egami and S. J. L. Billinge, Underneath the Bragg Peaks: Structural Analysis of Complex Materials (Pergamon Press Elsevier, Oxford, England, 2003).
- Farrow et al. (2007a) C. L. Farrow, P. Juhas, J. W. Liu, D. Bryndin, E. S. Božin, J. Bloch, T. Proffen, and S. J. L. Billinge, Journal of Physics: Condensed Matter 19, 335219 (2007a).
- Frandsen et al. (2019) B. A. Frandsen, Q. Wang, S. Wu, J. Zhao, and R. J. Birgeneau, Phys. Rev. B 100, 020504(R) (2019).
- Louca et al. (2010) D. Louca, K. Horigane, A. Llobet, R. Arita, S. Ji, N. Katayama, S. Konbu, K. Nakamura, T.-Y. Koo, P. Tong, and K. Yamada, Phys. Rev. B 81, 134524 (2010).
- Horigane et al. (2014a) K. Horigane, K. Kawashima, S. Ji, M. Yoshikawa, D. Louca, and J. Akimitsu, in Proceedings of the International Conference on Strongly Correlated Electron Systems (SCES2013) (2014) p. 015039.
- Toby and Von Dreele (2013) B. H. Toby and R. B. Von Dreele, Journal of Applied Crystallography 46, 544 (2013).
- Juhás et al. (2018) P. Juhás, J. N. Louwen, L. van Eijck, E. T. C. Vogt, and S. J. L. Billinge, Journal of Applied Crystallography 51, 1492 (2018).
- Proffen and Billinge (1999) T. Proffen and S. J. L. Billinge, Journal of Applied Crystallography 32, 572 (1999).
- White et al. (2010) C. E. White, J. L. Provis, T. Proffen, and J. S. Van Deventer, Journal of the American Ceramic Society 93, 3486 (2010).
- Paściak et al. (2019) M. Paściak, P. Ondrejkovic, J. Kulda, P. Vaněk, J. Drahokoupil, G. Steciuk, L. Palatinus, T. R. Welberry, H. E. Fischer, J. Hlinka, and E. Buixaderas, Physical Review B 99, 104102 (2019).
- Slawinski et al. (2019) W. A. Slawinski, H. Y. Playford, S. Hull, S. T. Norberg, S. G. Eriksson, T. Gustafsson, K. Edstrom, and W. R. Brant, Chemistry of Materials 31, 5024 (2019).
- Jeong and Kim (2019) I.-K. Jeong and B.-G. Kim, Journal of Applied Physics 126, 014101 (2019).
- Masadeh et al. (2007) A. S. Masadeh, E. S. Božin, C. L. Farrow, G. Paglia, P. Juhas, S. J. L. Billinge, A. Karkamkar, and M. G. Kanatzidis, Physical Review B 76, 115413 (2007).
- Toby and Egami (1992) B. Toby and T. Egami, Acta Crystallographica Section A: Foundations of Crystallography 48, 336 (1992).
- Kröncke et al. (2008) H. Kröncke, S. Figge, D. Hommel, and B. M. Epelbaum, Acta Phys. Pol. A 114, 1193 (2008).
- Farrow et al. (2007b) C. Farrow, P. Juhas, J. Liu, D. Bryndin, E. Božin, J. Bloch, T. Proffen, and S. Billinge, Journal of Physics: Condensed Matter 19, 335219 (2007b).
- Abeykoon et al. (2009) A. M. Abeykoon, W. Donner, M. Brunelli, M. Castro-Colin, A. J. Jacobson, and S. C. Moss, Journal of the American Chemical Society 131, 13230 (2009).
- (53) OriginPro 2013, OriginLab Corporation, Northampton, MA, USA.
- McCabe et al. (2014b) E. E. McCabe, A. S. Wills, L. Chapon, P. Manuel, and J. S. O. Evans, Phys. Rev. B 90, 165111 (2014b).
- Oogarah et al. (2017) R. K. Oogarah, C. P. J. Stockdale, C. Stock, J. S. O. Evans, A. S. Wills, J. W. Taylor, and E. E. McCabe, Phys. Rev. B 95, 174441 (2017).
- Horigane et al. (2014b) K. Horigane, A. Llobet, and D. Louca, Phys. Rev. Lett. 112, 097001 (2014b).
- Yi et al. (2019) M. Yi, H. Pfau, Y. Zhang, Y. He, H. Wu, T. Chen, Z. R. Ye, M. Hashimoto, R. Yu, Q. Si, D.-H. Lee, P. Dai, Z.-X. Shen, D. H. Lu, and R. J. Birgeneau, Phys. Rev. X 9, 041049 (2019).
- Kuo et al. (2016) H.-H. Kuo, J.-H. Chu, J. C. Palmstrom, S. A. Kivelson, and I. R. Fisher, Science 352, 958 (2016).
- Böhmer and Meingast (2016) A. E. Böhmer and C. Meingast, Comptes Rendus Physique 17, 90 (2016).
- Rosenthal et al. (2014) E. P. Rosenthal, E. F. Andrade, C. J. Arguello, R. M. Fernandes, L. Y. Xing, X. C. Wang, C. Q. Jin, A. J. Millis, and A. N. Pasupathy, Nature Physics 10, 225 (2014).
- Wang et al. (2017) J. Wang, G.-Z. Liu, D. V. Efremov, and J. van den Brink, Phys. Rev. B 95, 024511 (2017).
- Dai (2015) P. Dai, Rev. Mod. Phys. 87, 855 (2015).
- Stewart (2011) G. R. Stewart, Rev. Mod. Phys. 83, 1589 (2011).
- Freelon et al. (2021) B. Freelon, R. Sarkar, S. Kamusella, F. Brückner, V. Grinenko, S. Acharya, M. Laad, L. Craco, Z. Yamani, R. Flacau, I. Swainson, B. Frandsen, R. Birgeneau, Y. Liu, B. Karki, A. Alfailakawi, J. C. Neuefeind, M. Everett, H. Wang, B. Xu, M. Fang, and H.-H. Klauss, npj Quantum Materials 6, 4 (2021).