Three-dimensional core-collapse supernova simulations of massive and rotating progenitors
Abstract
We present three-dimensional simulations of the core-collapse of massive rotating and non-rotating progenitors performed with the general relativistic neutrino hydrodynamics code CoCoNuT-FMT and analyse their explosion properties and gravitational-wave signals. The progenitor models include Wolf-Rayet stars with initial helium star masses of and , and an red supergiant. The model is a rapid rotator, whereas the two other progenitors are non-rotating. Both Wolf-Rayet models produce healthy neutrino-driven explosions, whereas the red supergiant model fails to explode. By the end of the simulations, the explosion energies have already reached and for the and model, respectively. The explosions produce neutron stars of relatively high mass, but with modest kicks. Due to the alignment of the bipolar explosion geometry with the rotation axis, there is a relatively small misalignment of between the spin and the kick in the model. In terms of gravitational-wave signals, the massive and rapidly rotating progenitor stands out by large gravitational-wave amplitudes that would make it detectable out to almost 2 Mpc by the Einstein Telescope. For this model, we find that rotation significantly changes the dependence of the characteristic gravitational-wave frequency of the f-mode on the proto-neutron star parameters compared to the non-rotating case. The other two progenitors have considerably smaller detection distances, despite significant low-frequency emission in the most sensitive frequency band of current gravitational-wave detectors due to the standing accretion shock instability in the model.
keywords:
gravitational waves – hydrodynamics – transients: supernovae1 Introduction
Multi-dimensional simulations of core-collapse supernovae (CCSNe) have advanced rapidly in recent years (See Müller 2016; Janka et al. 2016 for recent reviews), with many simulations focusing on three-dimensional (3D), non-rotating, neutrino-driven explosions. The neutrino-driven explosion mechanism involves some re-absorption of the emitted neutrinos behind the stalled shock, which revive the shock wave and power the explosion (Janka, 2012; Burrows, 2013). Successful neutrino-driven shock revival has now been observed in multiple 3D simulations employing different codes and a range of progenitor parameters (e.g. Melson et al., 2015; Lentz et al., 2015; Takiwaki et al., 2014; Ott et al., 2018; Müller et al., 2017; Müller et al., 2019; Burrows et al., 2020; Powell & Müller, 2019; Burrows et al., 2019; Walk et al., 2019).
The frequency range of the gravitational waves emitted in neutrino-driven explosions makes CCSNe a promising source for current ground based gravitational-wave detectors, such as Advanced LIGO (aLIGO; The LIGO Scientific Collaboration et al., 2015) and Advanced Virgo (AdVirgo; Acernese & et al., 2015), and planned future detectors like the Einstein Telescope (ET; Punturo et al., 2010). Recent 3D simulations of neutrino-driven CCSNe have shown that the dominant feature of the gravitational-wave emission is due to the quadrupolar surface g-mode of the proto-neutron star (PNS), which is excited by the hydrodynamical instabilities inside and outside the PNS (Murphy et al., 2009; Müller et al., 2013; Cerdá-Durán et al., 2013; Andresen et al., 2017; Kuroda et al., 2016). At lower frequencies (below Hz), there may be further features associated with the standing accretion shock instability (SASI) (Blondin et al., 2003; Blondin & Mezzacappa, 2006; Foglizzo et al., 2007).
The majority of successful 3D neutrino-driven CCSN simulations are explosions of non-rotating progenitor models with zero-age main sequence (ZAMS) masses in the range of to . To fully cover the CCSN parameter space, further 3D simulations of higher mass stars are required. Whether and when such massive stars directly form black holes, or explode and leave massive neutron stars, or a black hole due to fallback, is an open question. Simulating CCSNe with larger progenitor masses will also enable us to further study the relationship between compactness and explodability found in previous studies (O’Connor & Ott, 2011). Intriguingly and in contrast to O’Connor & Ott (2011), a number of 3D neutrino-driven simulations (Chan et al., 2018; Ott et al., 2018; Kuroda et al., 2018; Burrows et al., 2020; Burrows et al., 2019; Walk et al., 2019) observed shock expansion in some progenitors with rather massive and compact cores. From the point of view of gravitational-wave astronomy, high-mass progenitors are particularly interesting because they are expected to explode more energetically (Müller et al., 2016a), which will result in stronger gravitational-wave emission (Müller, 2017; Powell & Müller, 2019; Radice et al., 2019). Progenitor models with large compactness parameters are also expected to more closely reproduce the observed levels of (Suwa et al., 2019).
Further to this, as most studies of neutrino-driven explosions have used non-rotating models, the effects of rotation on the explosion dynamics, remnant properties, and multi-messenger observables are not well understood. Most stars are thought to be slowly rather than rapidly rotating (Deheuvels et al., 2014; Beck et al., 2012). However, the rotation rate of a progenitor star at core-collapse may have a significant impact on the characteristics and mechanism of the explosion, the multi-messenger observable emission, and the nature of the compact remnant. The first 3D simulations of neutrino-driven explosions in rotating progenitors suggest that rotation can play a supportive role for shock revival even without invoking magnetic fields (Takiwaki et al., 2016; Janka et al., 2016; Summa et al., 2018). In particular, a violent corotation instability can develop for sufficiently high rotation rates (Takiwaki et al., 2016). In the presence of strong magnetic fields or fast field amplifications, powerful magnetorotational explosions might develop, and the subsequent evolution may lead to the launching of relativistic jets either from a millisecond magnetar (Usov, 1992) or from an accretion disk in the collapsar scenario (MacFadyen & Woosley, 1999b). While first 3D simulations of such magnetorotational explosions have become possible (Winteler et al., 2012; Mösta et al., 2014), many uncertainties remain about the initial field strength and topology, the initial rotation profiles, field amplification and non-ideal effects (Guilet et al., 2015), and the stability of MHD-driven jets (Mösta et al., 2014).
The gravitational-wave signal from the bounce and early post-bounce phase in rapidly rotating progenitors has already been studied extensively in 2D and 3D and is well understood (Ott et al., 2007; Cerdá-Durán et al., 2007; Dimmelmeier et al., 2008; Scheidegger et al., 2010; Abdikamalov et al., 2014; Richers et al., 2017; Takiwaki & Kotake, 2018; Pajkos et al., 2019). 3D studies of the gravitational-wave signal from the later post-bounce phase have recently become available (Kuroda et al., 2014; Takiwaki & Kotake, 2018; Shibagaki et al., 2019; Andresen et al., 2019). However, some of these studies do not include general relativity, or are stopped before 300 ms when the amplitudes of the gravitational-wave signals are still growing. These studies have shown that rotation is expected to significantly increase the amplitude of the gravitational-wave emission.
In this paper, we seek to produce long-duration, 3D simulations of very massive progenitors including rotation, general relativity, and multi-group neutrino transport to better understand the progenitor regime from which we expect the strongest gravitational-wave signals, thus complementing our previous study in Powell & Müller (2019). We perform two CCSN simulations of Wolf-Rayet stars in 3D with the neutrino hydrodynamics code CoCoNuT-FMT. The first is a rapidly rotating star with an initial helium star mass of . We show that this model produces a powerful neutrino-driven explosion due to rotational support without the aid of magnetic fields. Our second model is a Wolf-Rayet star with an initial helium star mass of .
The high mass and (in one case) rapid rotation of the models allow us to estimate the maximum distance at which ground-based gravitational-wave detectors will be sensitive to neutrino-driven CCSNe. Further to this, we include a smaller ZAMS star that differs from our previous model in Powell & Müller (2019) by not including perturbations from the convective oxygen shell. As a result, this model develops strong SASI after collapse, which produces gravitational waves in the optimum sensitivity range for aLIGO and AdVirgo. We use this model to determine if the SASI increases detectability of gravitational-wave signals in comparison to our other convection-dominated models.
The outline of our paper is as follows: In Section 2, we describe the setup of our simulation and outline the details of our neutrino hydrodynamics code. In Section 3, we describe in more detail our progenitor models. In Section 4, we describe the explosion dynamics including the effects of rotation, and we discuss the properties of the PNS in Section 5. We show the gravitational-wave emission in Section 6, and estimate the detectability of our models. A conclusion and discussion are given in Section 7.
2 Simulation Methodology and Setup
We carry out 3D simulations using the neutrino hydrodynamics code CoCoNuT-FMT. For the equations of hydrodynamics, we use a general relativistic finite-volume based solver in spherical polar coordinates (Müller et al., 2010; Dimmelmeier et al., 2002). It employs the xCFC approximation for the space-time metric (Cordero-Carrión et al., 2009). We use the fast multigroup neutrino transport method described in Müller & Janka (2015), including the updates listed in Powell & Müller (2019).
We use a spatial resolution of 550x128x256 and 21 energy groups. We use the Lattimer and Swesty equation of state, with a bulk incompressibility of K=220 MeV, at high densities (Lattimer & Swesty, 1991). At low density, we use an equation of state accounting for photons, electrons, positrons, and an ideal gas of nuclei together with a flashing treatment for nuclear reactions (Rampp & Janka, 2002).
3 Progenitor Models
| Model | |||||||
|---|---|---|---|---|---|---|---|
| m39 | 39 | 0.542 | 2.04 | 1.77 | 11.0 | 127.4 | 30.5 |
| y20 | 20 | 0 | 1.75 | 1.55 | 5.9 | 52.2 | 70.9 |
| s18np | 5.3 | 0 | 1.86 | 1.64 | 0 | 0 | 0 |
3.1 Model m39 – Rapidly Rotating Wolf-Rayet Star
Our first model, m39, is a rapidly rotating Wolf-Rayet star. It has an initial helium star mass of , with left at the time of collapse (Aguilera-Dena et al., 2018). The model was evolved with the Modules for Experiments in Stellar Astrophysics (MESA) stellar evolution code (Paxton et al., 2011). It rotates rapidly with an initial surface rotation velocity of and has a metallicity of . During the collapse phase, we evolve this model in 2D until bounce, and then map to 3D, adding random perturbations in density to break axial symmetry. We end the simulation of this model at 0.98 s after core bounce.
3.2 Model y20 – Non-Rotating Wolf-Rayet Star
Yoon (2017) produced stellar evolution models for Wolf-Rayet stars with an initial helium mass range of using the binary evolution code BEC (Wellstein et al., 2001). For our second model, y20, we use the , non-rotating, solar metallicity helium star from this study. It was evolved with the mass-loss prescription of Nugis & Lamers (2000), which results in a final helium core mass of after wind loss. We end the simulation of this model at 1.2 s after core bounce.
3.3 Model s18np – Massive Red Supergiant Progenitor
Our third model, s18np, is a non-rotating, solar metallicity star with a ZAMS mass of (Müller et al., 2016b). It was evolved up to the onset of collapse with the stellar evolution code KEPLER (Weaver et al., 2017). This model has been simulated previously in Müller et al. (2017), however the gravitational-wave emission was not calculated as the PNS convection zone was simulated in spherical symmetry. Different from the model that we simulated in Powell & Müller (2019), this model does not include strong pre-shock density perturbations from convective oxygen burning. As a result, the shock is not revived, and strong SASI activity develops and is maintained for hundreds of milliseconds. Since the SASI produces gravitational waves in the optimum sensitivity range for ground based gravitational-wave detectors, this model allows us to explore the effects of the SASI on the detectability of the gravitational-wave signal. We end the simulation at 0.56 s after core bounce after the amplitude of the gravitational-wave emission has decreased significantly.
4 Explosion Dynamics
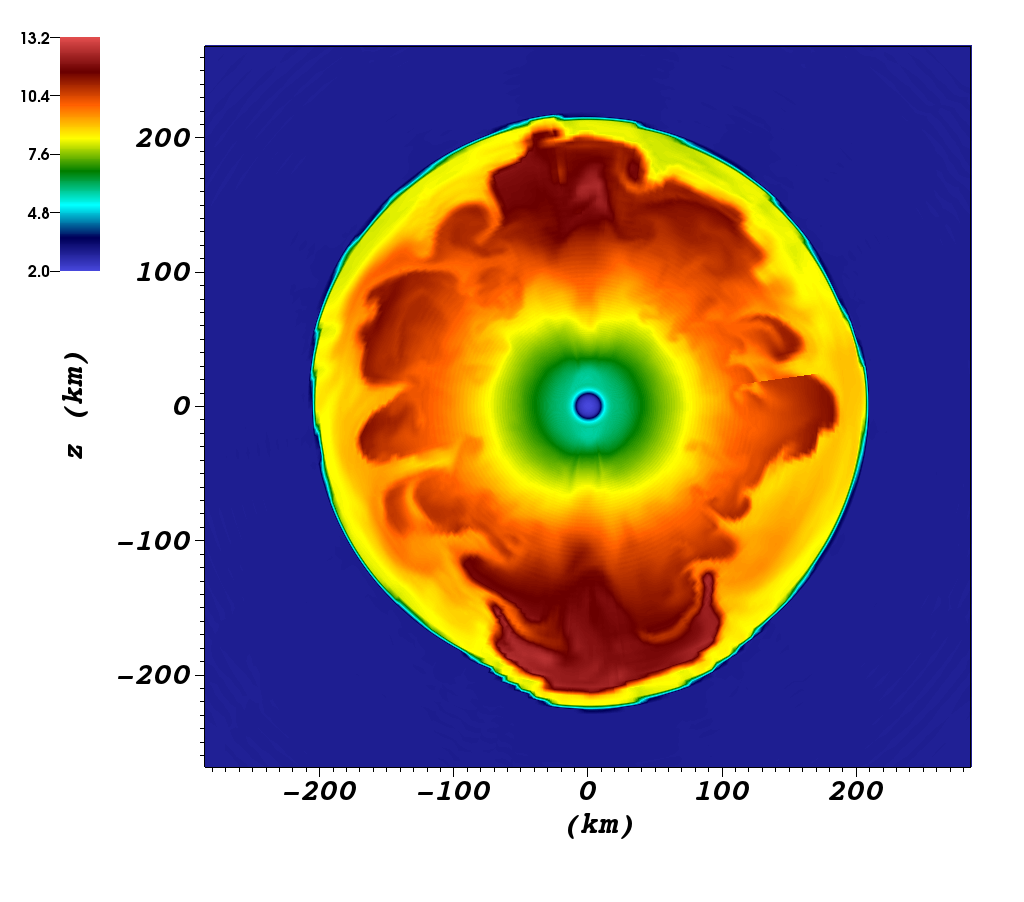
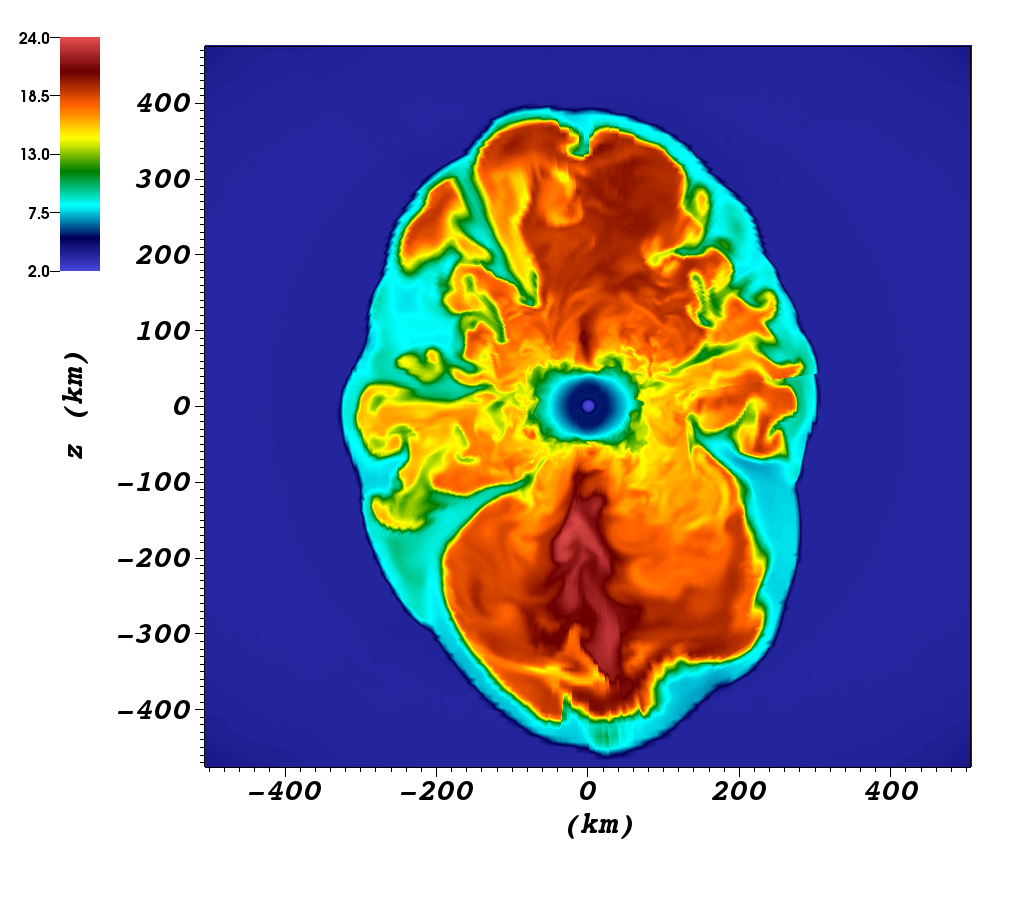
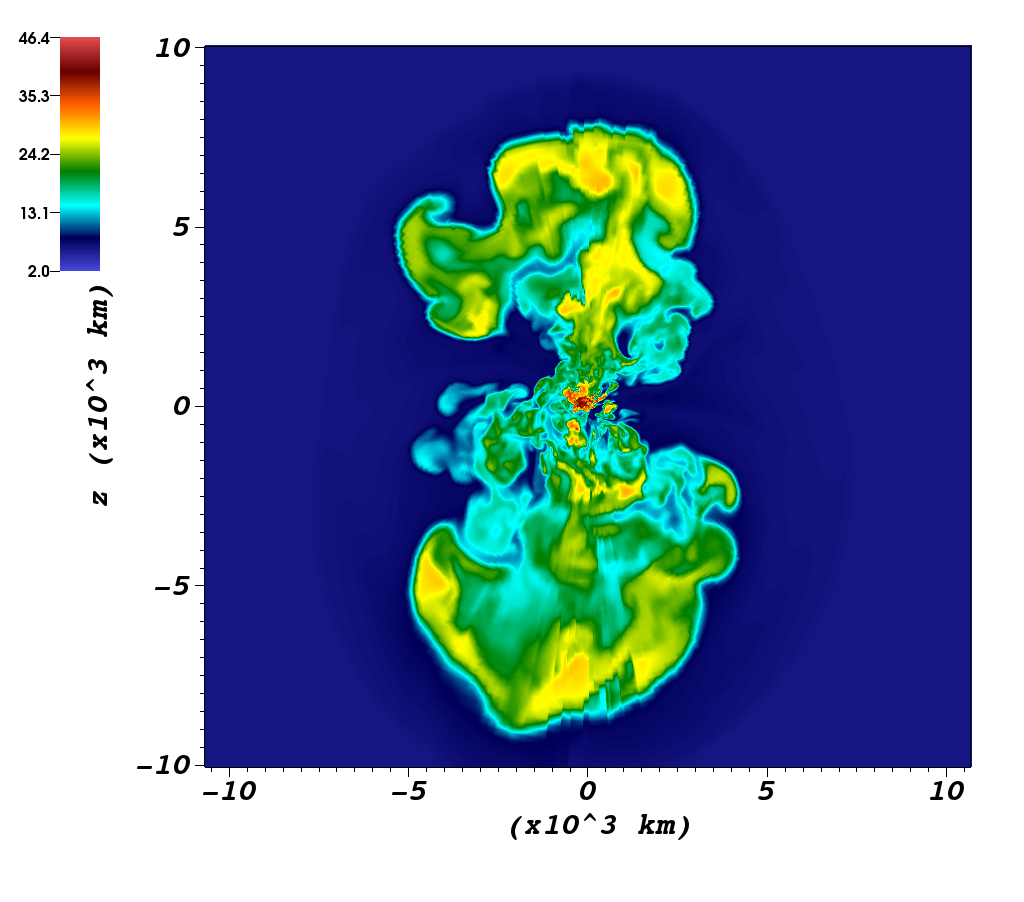
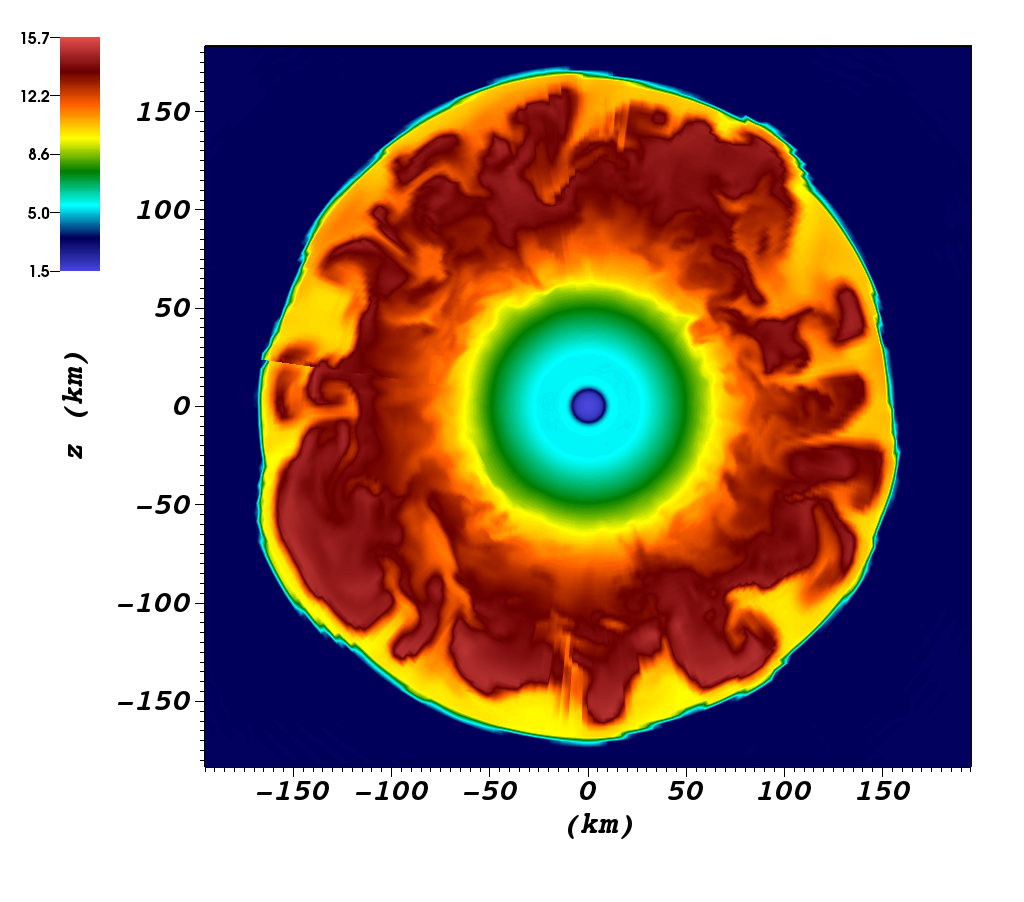
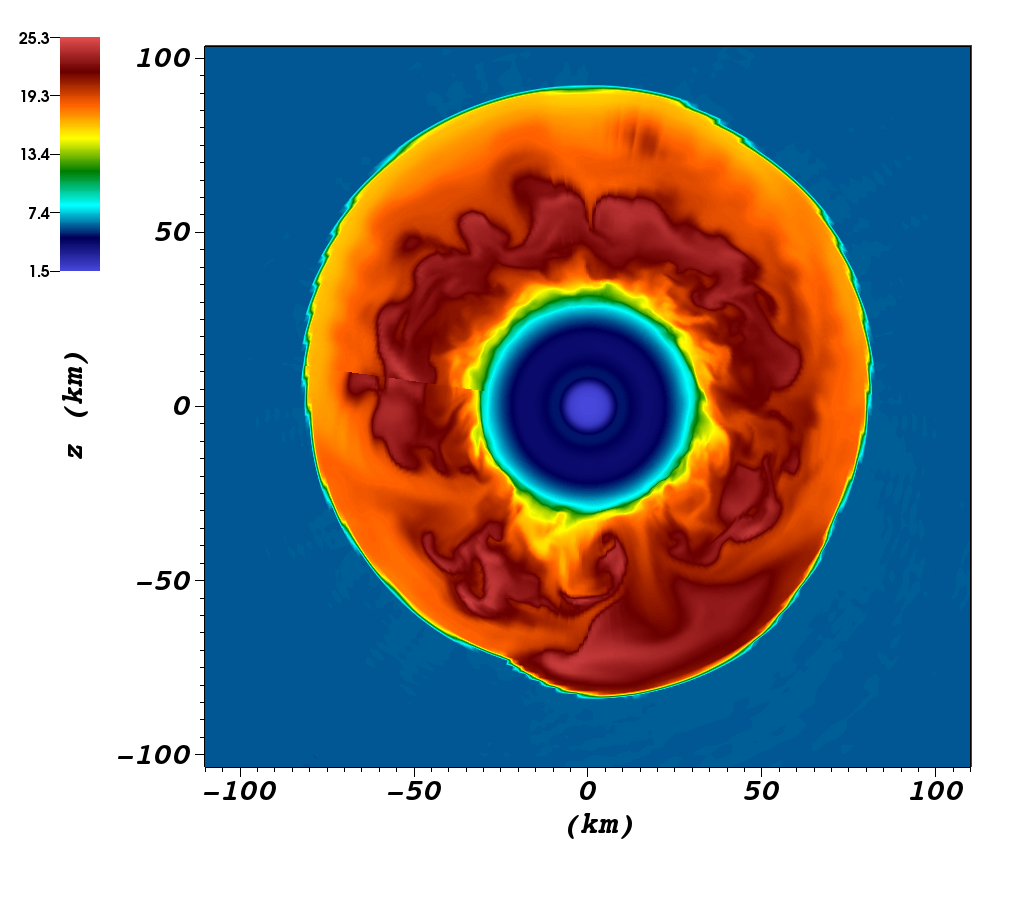
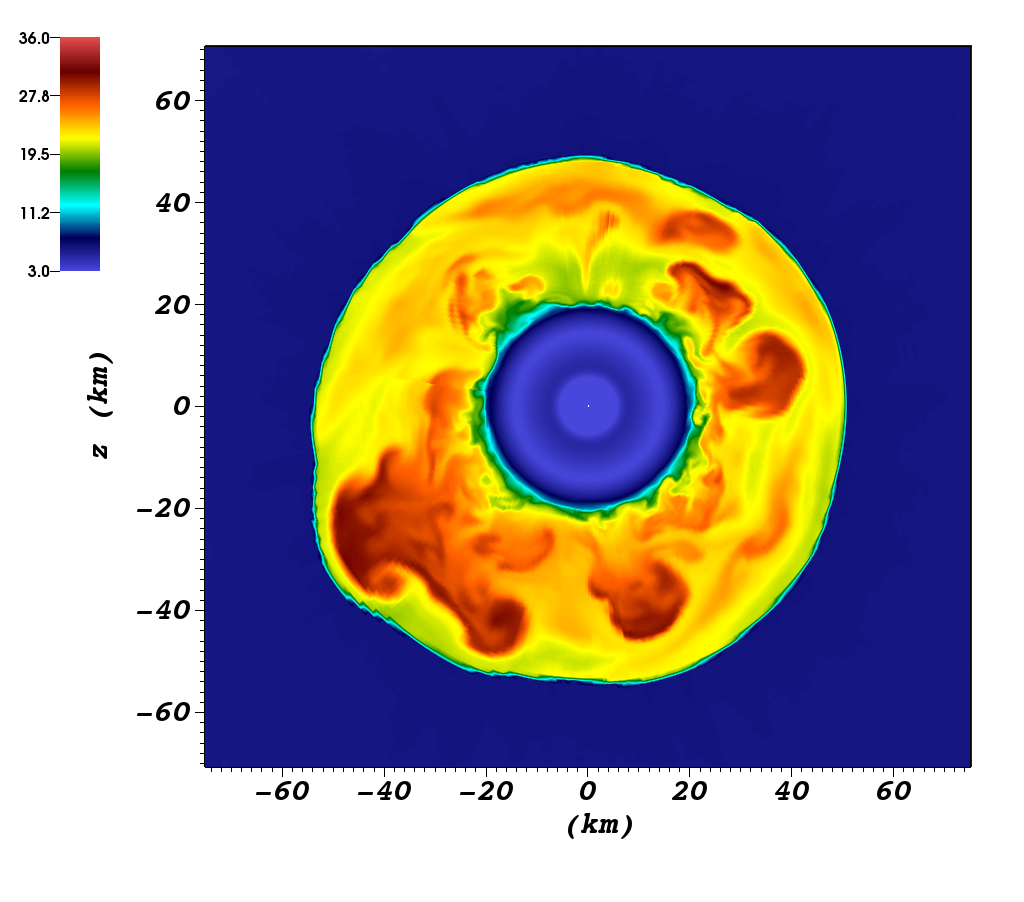
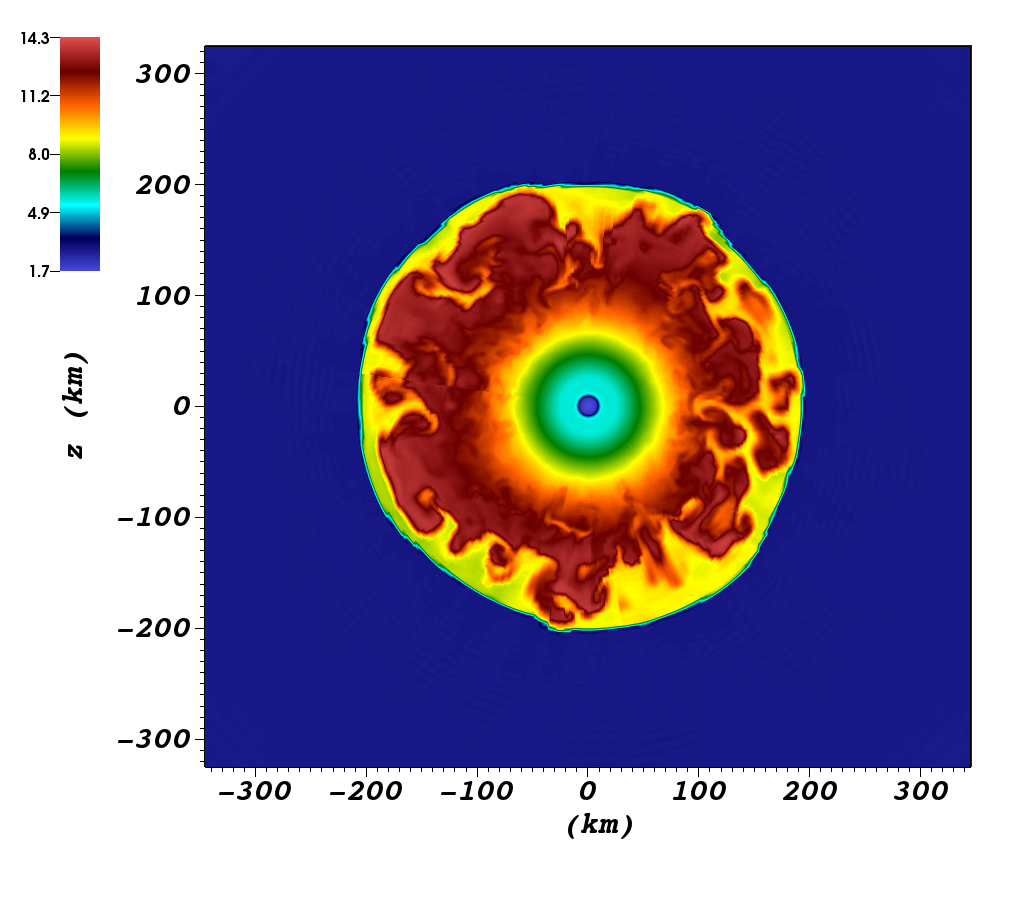
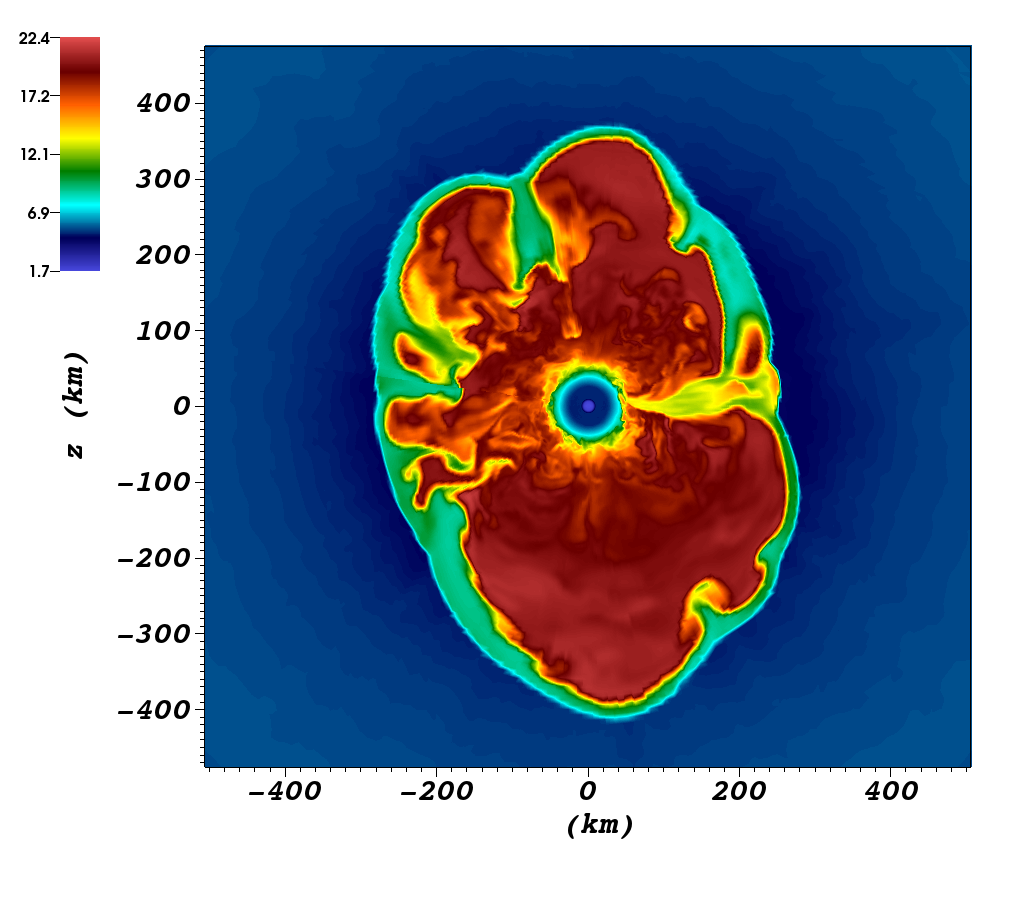
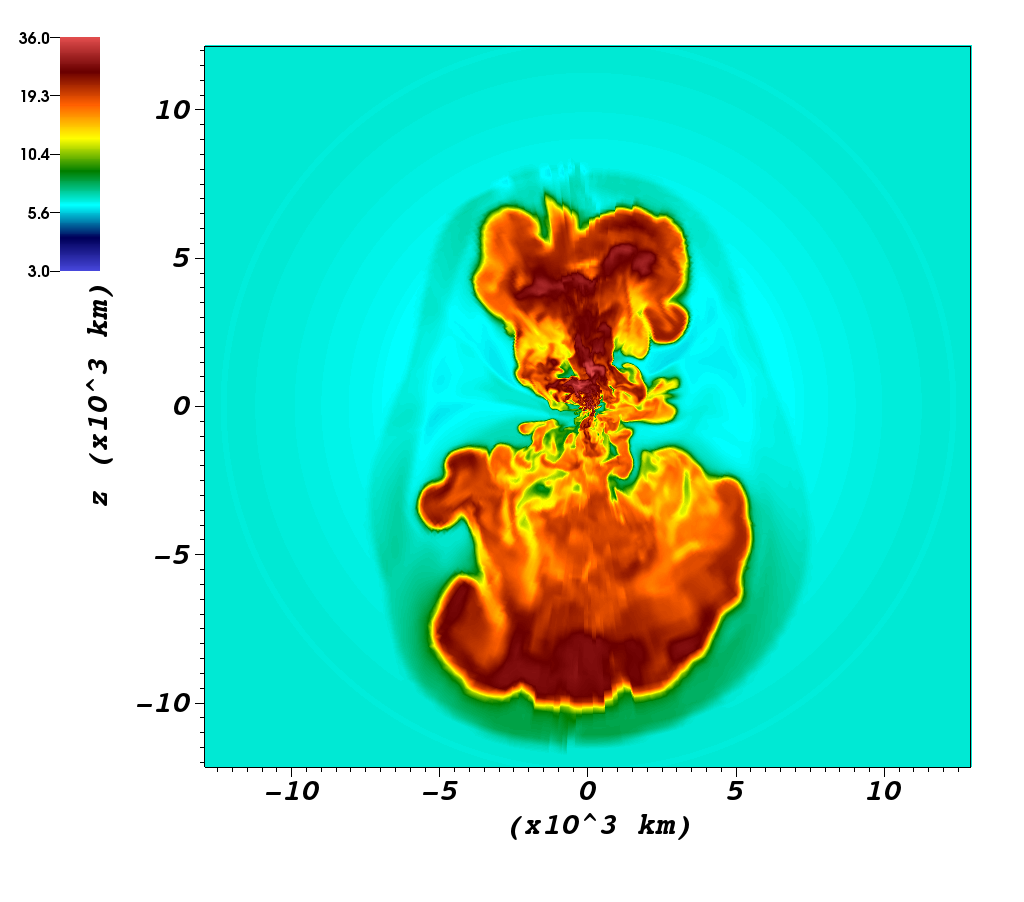


The evolution of the three models is illustrated by meridional 2D slices at selected times (Figure 1), and by plots of the average shock radius and the explosion energies in Figure 2. Models m39 and y20 both undergo neutrino-driven shock revival about after core bounce. Both models are characterised by a bipolar explosion geometry. Model s18np has not undergone shock revival by the end of the simulation ( s after bounce), and shows long-standing activity of the SASI spiral mode. The large accretion shock radii at early post-bounce times and the precipitous explosions of the two massive Wolf-Rayet progenitors warrants some critical discussion about the potential role of our transport approximation and other physical uncertainties that may affect the simulations. The fate of models m39 and y20 is reminiscent of other massive models in other recent works. (Ott et al., 2018; Burrows et al., 2020; Burrows et al., 2019), in which the accretion shock radius expands continuously in the post-bounce phase and reaches large radii of and above early on. This suggests that such early shock revival as seen for m39 and y20 is plausible. A possible explanation for the unusually large early shock radii comes from the time dependence of the mass accretion rate (Figure 3), and points to structural differences in the progenitor core between the MESA progenitor models y20 and m39 on the one hand, and the Kepler model s18np on the other hand. In model s18np, the decline of the mass accretion rate slows down more recognisably from about onward with a visible kink in the curve, whereas the decline of slows less appreciably in y20 and m39. It is during this phase that model s18np diverges decisively from the other two.
However, the shock radius in models y20 and m39 is already larger immediately after bounce. This may be connected to to a deficiency of the deleptonisation scheme of Liebendörfer (2005) that we use during the collapse phase, which tends to overestimate the mass of the homologous inner core for higher progenitor core entropies (Dimmelmeier et al., 2008), and thus produces an overly energetic bounce. Furthermore, our models may overestimate the PNS and accretion shock radius somewhat because we neglect electron neutrino pair annihilation as a source for heavy flavour neutrinos (Buras et al., 2003) and hence underestimate the cooling of the neutron star mantle. On the other hand, models m39 and y20 do not include convective seed perturbations in the progenitor or magnetic fields, both of which could be beneficial for early shock revival. Clearly, more work is needed to reliably determine the fate of progenitors with such massive helium cores. However, the present models can tentatively teach us about the expected explosion and compact remnant properties and the gravitational-wave signals from these massive progenitors provided that they explode reasonably early.
The models did not reach their final explosion energies before the end of the simulation, however model m39 has already reached over erg, and model y20 has reached erg, which are much larger values than those found in most other modern 3D simulations of neutrino-driven explosions. This is encouraging and demonstrates that neutrino-driven explosions need not be underenergetic, and can reach typical explosion energies of normal hydrogen-rich and stripped-envelope supernovae (Kasen & Woosley, 2009; Pejcha & Prieto, 2015; Taddia et al., 2018). With a growth rate of , the final explosion energy of model m39 may well be considerably higher than the canonical value of .
Combined with similar findings by other groups, who also observed shock revival in progenitors with massive cores in 3D simulations (Ott et al., 2018; Kuroda et al., 2018), this raises broader questions about the nature of hypernova explosions. Considering efficiency limitations of the neutrino-driven mechanism (Janka, 2012; Sukhbold et al., 2016; Müller et al., 2016a), it is unlikely that neutrino heating alone is sufficient to achieve hypernova energies, which are of order erg (Iwamoto et al., 1998; Soderberg et al., 2006). However, while the favoured explanation for hypernova explosions in the magnetorotational paradigm (Winteler et al., 2012; Mösta et al., 2014; Obergaulinger & Aloy, 2020) relies on magnetic fields from the outset, it may still be possible that neutrino heating plays a dominant role during the early phase of hypernova explosions by triggering shock revival and already delivering part of the explosion energy (which is along the lines of a hybrid regime between neutrino-driven and MHD-driven explosions suggested by Burrows et al. 2007). Magnetic field effects could take over later to deliver the bulk of the explosion energy and launch relativistic jets either from a millisecond magnetar (Usov, 1992) or from a collapsar disk (MacFadyen & Woosley, 1999a). In future, models like m39 need to be continued for a longer duration to determine to what extent a neutrino-driven “precursor” explosion can already contribute to hypernova energies.


For the sake of completeness, we also show the neutrino luminosities and mean energies in Figure 4. In the first 200 ms, model m39, which has by far the biggest core among the three models, reaches very high neutrino luminosities. After the onset of the explosion in models m39 and y20, model s18np has much larger neutrino luminosities and neutrino energies than the other models. The switch in the hierarchy of the models (with model s18np overtaking model m39 in terms of luminosity and mean energies) is a natural consequence of the different mass accretion rates. All the models show the characteristic drop in the mass accretion rate that is associated with the infall of the Si/O layer. For models y20 and m39, this drop triggers shock revival, and they continue to accrete some mass only at a low level until the end of the simulation. The mass accretion rate for model s18np remains high towards the end of the simulation.
5 Remnant Properties


The baryonic PNS masses for all models are shown in Figure 3 and Table 1, (although the PNS mass for the non-exploding model s18np is of less interest for comparing with the observed neutron star population). The exploding models m39 and y20 have almost asymptoted to their final mass values of and respectively, provided that there is no late time fallback. Their masses are within the range expected from observations (Özel & Freire, 2016; Farrow et al., 2019).
In Figure 5, we show the neutron star kicks and the angle between the spin and kick direction. For evaluating the kick and spin, we followed the procedure of Wongwathanarat et al. (2013); Müller et al. (2019).
The kick velocities for both model m39 and y20 have not reached their final values before the end of the simulation times. The kick velocities at the end of the simulations are within the observed distributions of neutron star kicks (Hobbs et al., 2005; Faucher-Giguère & Kaspi, 2006; Ng & Romani, 2007). In fact, the kick velocities are rather on the low side of the observed mean value of (Hobbs et al., 2005; Faucher-Giguère & Kaspi, 2006; Ng & Romani, 2007). Model m39 has only reached a kick velocity of by the end of the simulation, and the kick for y20 is even smaller. These rather lower kick velocities are the result of the bipolar explosion geometry of both models (Figure 1). The low kick velocities have implications for the proposed correlation between explosion energy and kick velocity (Bray & Eldridge, 2016; Janka, 2017a; Vigna-Gómez et al., 2018). Our results constitute further evidence that this correlation is not a tight one. More likely, the explosion energy only determines the maximum attainable kick velocity, below which one expects a distribution of kicks depending on the degree of unipolarity or bipolarity (Müller et al., 2019).
The evolution of the spin-kick angle in model m39 is noteworthy. Observations have suggested that the birth spins and kicks of neutron stars tend to be aligned (Johnston et al., 2005; Ng & Romani, 2007; Noutsos et al., 2013). However, even though hydrodynamic mechanisms for spin-kick alignment have been proposed (Janka, 2017b), no trend towards spin-kick alignment has been observed so far in 3D CCSN simulations of non-rotating progenitors (Wongwathanarat et al., 2013; Müller et al., 2019). For our non-rotating explosion model y20, we also find a large angle between the spin and kick. For the rapidly rotating model m39, however, the spin-kick angle stays at about . In this case, spin-kick alignment comes about because the bipolar outflows are aligned with the initial rotation axis, which is not changed appreciably by asymmetric accretion onto the PNS. This suggests that progenitor rotation could play a role in explaining spin-kick alignment (provided that the observational evidence remains robust). However, even for model m39, the spin-kick alignment is not perfect, and is not clear whether the polar alignment of the outflows is a robust feature for rotating progenitors. In fact, some previous 3D supernova simulations of rotating progenitors rather find that the explosion develops preferably in the equatorial plane (Takiwaki & Kotake, 2018; Summa et al., 2018). Clearly, more simulations are required to determine the implications of rotation for the explosion morphology and spin-kick alignment.
6 Gravitational Wave Emission


The gravitational-wave emission for our models, as measured by an observer at the pole and the equator, is shown in Figure 6. The high mass and rotation of model m39 results in high gravitational-wave amplitudes of up to 40 cm at the pole and over 100 cm at the equator. Model y20 reaches amplitudes of cm at the pole, and cm at the equator. Model s18np has a much lower amplitude of cm at the equator, due to the lack of shock revival in this model, however its prompt convection signal in the direction of the equator reaches amplitudes as high as model y20.


All of our models show gravitational-wave emission associated with prompt convection. Prompt convection occurs shortly after bounce time due to an unstable negative entropy gradient created by the weakening of the prompt shock and large neutrino losses during the neutronisation burst (Bruenn & Mezzacappa, 1994). Models y20 and m39 both have strong prompt convection signals shortly after bounce that are visible only in observer angles towards the poles. Model s18np shows a signal due to prompt convection at all angles. The emission due to prompt convection occurs only for the first few ms at frequencies below 200 Hz. In model m39, there is also power at higher frequencies as expected from a rotational core bounce (Dimmelmeier et al., 2007). The frequency of this signal is set by the fundamental mode of the PNS (Fuller et al., 2015), but the power of this components is spread across a wider range in frequency. This could suggest that either higher-frequency p-modes are excited during bounce, or may simply be a signal analysis artefact related to the short duration of the bounce signal and/or to edge effects. After shock revival, we find a large tail from asymmetric shock propagation (Murphy et al., 2009; Müller et al., 2013) that occurs in the emission of model y20, and a smaller tail is observed in model m39.
The time-frequency structure of all three models show the characteristic emission that is typically associated with f-mode oscillations of the PNS (e.g. Murphy et al., 2009; Müller et al., 2013; Morozova et al., 2018). Previous studies have shown that the gravitational-wave frequency of the f-mode is given by,
| (1) |
where is the baryonic mass of the PNS, is the radius of the PNS, is the neutron mass, and is the electron antineutrino mean energy (Müller et al., 2013). We find that this approximation of the f-mode frequency matches well with our models y20 and s18np during the high amplitude periods of the gravitational-wave emission. In model s18np, the f-mode rises in frequency more rapidly than in our other models, but its amplitude peaks at a lower frequency of Hz because the f-mode only experiences strong forcing early on before the shock retracts and the mass and turbulent kinetic energy in the gain region shrink. Model y20 also has a lower frequency mode that is clearly visible in the spectrogram after about , and decreases slowly in frequency up to the end of the simulation. The frequency trajectory for this mode is compatible with a g-mode or hybrid mode (Torres-Forné et al., 2018; Morozova et al., 2018).
The higher f-mode frequency trajectory in model s18np compared to model y20 is easily understood as a consequence of the steeper rise of the PNS mass in this non-exploding model. The f-mode frequencies in our rotating model m39 are puzzling at first glance. Due to the high PNS mass and only modestly high neutrino mean energies (lower than for model s18np), one would except a very high f-mode frequency. However, a quantitative analysis shows that Equation (1) no longer provides a good approximation of the frequency of the gravitational-wave emission for this model. The amplitude of the f-mode emission for model m39 is highest at a frequency of Hz, but Equation (1) predicts higher frequency gravitational-wave emission of Hz for this model.
The reduction of the actual f-mode frequency in relation to the PNS properties in our rotating model can be explained by the angular momentum distribution in the progenitor (and hence in the PNS).
In Figure 7, we show the spherically averaged specific angular momentum and the angular velocity of model m39 at 100 ms, 400 ms and 800 ms after bounce. The progenitor exhibits a significant drop of and from the Fe and Si core to the O shell by a factor of several. This translates into a steep negative gradient in and in the PNS surface region after the infall of the Si/O shell interface. This steep gradient remains stable and even steepens despite the fact that the PNS surface region loses angular momentum into the ejecta region due to shear instabilities. 111In addition, angular momentum conservation is imperfect in the core region inside a radius of that we simulate in spherical symmetry, the core region spins down significantly as can be seen from Fig. 7. This may also indirectly lead to a deceleration of the rotation in the PNS surface region, i.e. our model may actually underestimate the angular momentum gradient at the PNS surface.
Such a negative angular momentum gradient counteracts the stabilisation of the PNS surface region by the positive entropy gradient. The oscillation frequency of a displaced bubble is modified according to the Solberg-Høiland criterion,
| (2) |
where is the Brunt-Väisälä frequency, and is the distance from the rotation axis. The actual reduction of the f-mode frequency that dominates the gravitational-wave emission can only be inferred from a full eigenmode analysis, but since we clearly find that the Rayleigh discriminant reaches values comparable to , rotational destabilisation will reduce the mode eigenfrequency considerably, which explains the unexpectedly low frequencies in the spectrogram of model m39.
This has important implications for the interpretation of gravitational-wave spectrograms. It has been suggested that universal relations for the mode frequencies akin to Equation (1) can be used to constrain PNS parameters (Torres-Forné et al., 2019) using the spectrogram for non-rotating progenitors. Since Equation (1) no longer holds for rapidly rotating progenitors, it will be considerably more difficult to constrain the PNS mass, radius, and surface temperature using measured mode frequencies in this case.
Model s18np shows lower frequency gravitational-wave emission due to SASI. The gravitational-wave frequency of the SASI roughly follows the SASI frequency, which is well described by
| (3) |
where is the shock radius and is the radius of the PNS (Müller & Janka, 2014). The frequency is in the most sensitive range for ground based gravitational-wave detectors. The SASI features are present in the gravitational-wave signal for a longer duration than in some other recent 3D models (Kuroda et al., 2016; Andresen et al., 2017, 2019), due to our longer simulation time and the lack of shock revival in this model. As a consequence, the frequency of the SASI signal reaches up to .
6.1 Detection prospects


In Figure 8, we show the amplitude spectral density (ASD) of our models as measured at the pole and equator at a distance of 100 kpc, and the ASD noise curves for current and future ground-based gravitational-wave detectors. We include design sensitivity curves for aLIGO and AdVirgo, the Japanese underground detector KAGRA (Abbott et al., 2018), and two different proposed designs for ET referred to as ET-B (Hild et al., 2008) and ET-D (Hild et al., 2011). Model s18np has gravitational-wave emission across the entire frequency bands of the detectors. Model y20 peaks at higher frequencies where KAGRA and Virgo are less sensitive. Model m39 has stronger high frequency emission at the pole, and a stronger lower frequency signal at the equator due to the high amplitude signal from the rotational bounce and prompt convection.
We calculate the maximum distance out to which the gravitational-wave emission from our models can be detected in current and future gravitational-wave detectors. We assume the threshold for detection is given by an optimal matched filter signal to noise ratio (SNR) of 8, where the optimal SNR is given by
| (4) |
where is the frequency spacing, is the power spectral density of the detector noise at frequency , and is the gravitational-wave signal in the frequency domain at frequency (Cutler & Flanagan, 1994).
The results for our models, using the gravitational-wave emission at both the equator and pole observer directions, are shown in Table 2. All models have higher maximum detectable distances in the aLIGO detector than in AdVirgo and KAGRA due to the better high frequency sensitivity of the aLIGO detector. In current detectors, model s18np and y20 are detectable only in our Galaxy. Model m39 reaches a few hundred kpc, beyond the Large Magellanic Cloud at 50 kpc, and M31 at 77 kpc. The detection distances for m39 are comparable to those of the magnetorotational models222Some of these gravitational wave forms came from non-magnetised models with rapid rotation that would presumably result in magnetorotational explosions if efficient magnetic field amplification processes operate during the post-bounce phase. in Gossan et al. (2016). Interestingly, the large detection distances for m39 are only modestly direction-dependent and do not rest very much on the rotational bounce signal. The detection distance varies by less than a factor of two between the polar and equatorial direction. For an observer in the equatorial plane, much of the SNR comes from the low-frequency emission due to prompt convection, while the long-duration high-frequency emission is the most important contribution in the polar direction. In the future gravitational-wave detector ET, model m39 is detectable out to almost 2 Mpc (i.e., through the Local Group), and models y20 and s18np can be detected up to a few hundred kpc. ET-B has better lower frequency sensitivity than ET-D, which leads to large increase in detectable distance for SASI-dominated signals like model s18np.
| m39 pole | m39 eqt | s18np pole | s18np eqt | y20 pole | y20 eqt | |
| LIGO | 190 kpc | 119 kpc | 14 kpc | 22 kpc | 32 kpc | 32 kpc |
| Virgo | 90 kpc | 89 kpc | 12 kpc | 20 kpc | 18 kpc | 20 kpc |
| KAGRA | 60 kpc | 77 kpc | 11 kpc | 18 kpc | 13 kpc | 18 kpc |
| ET-B | 1.9 Mpc | 1.55 Mpc | 190 kpc | 320 kpc | 330 kpc | 370 kpc |
| ET-D | 1.9 Mpc | 1.21 Mpc | 155 kpc | 240 kpc | 330 kpc | 340 kpc |
It is interesting to put these numbers into perspective by comparing them to the estimated detection distances for some other recent 3D supernova models, even though these distances have sometimes been determined in a somewhat different way. Maximum detection distances with aLIGO and with 3G instruments have been reported for most non-rotating 3D models (Andresen et al., 2017; Srivastava et al., 2019; Powell & Müller, 2019). Our non-rotating models are detectable to similar distances. For a model with strong SASI activity, Kuroda et al. (2016) found higher amplitudes that could allow detection out to with aLIGO. Our SASI-dominated model s18np does not reach such high amplitudes, and it remains to be investigated further under which conditions the SASI could give rise to significantly stronger gravitational-wave emission.
Several studies have already examined the detection prospects for gravitational-wave emission from rotational bounce and non-axisymmetric instabilities in rapidly rotating progenitors (Abdikamalov et al., 2014; Gossan et al., 2016; Takiwaki & Kotake, 2018; Shibagaki et al., 2019). Unsurprisingly, the maximum detection distance for our rapidly-rotating model m39 is similar to these cases. It is interesting, however, that such a strong signal can be obtained for observers in the polar direction (who would not see any bounce signal) and without the help of non-axisymmetric instabilities. This complicates the interpretation of distant gravitational-wave events. A high signal strength alone may not be a telltale sign for the physics of the explosion, though it would suggest that rapid rotation is involved. In particular, the spectrogram of model m39, which undergoes a strong, but otherwise ordinary convectively-aided explosion, is qualitative similar to the case of the low- instability (Shibagaki et al., 2019); suggesting that there may be room for confusion between these scenarios in the event of a gravitational-wave detection.
7 Conclusions
To survey the expected gravitational waveforms for supernova explosions, modern simulations of 3D neutrino-driven explosions have yet to explore a broader range of the CCSN progenitor parameter space. In order to better cover the most promising regime for gravitational-wave detections, we particularly need more simulations of massive and rotating progenitors, and longer simulations beyond the phase of peak gravitational-wave emission. The systematics of explosion and remnant properties also need to be explored more thoroughly, in particular at the high-mass end of the progenitor distribution.
In this paper, we therefore performed simulations of three different high-mass progenitors, for a long enough duration that we can produce robust predictions of the gravitational-wave emission, the explosion energies, and the remnant properties. These progenitors include a rotating Wolf-Rayet star, a non-rotating Wolf-Rayet star, and an red supergiant.
Both of the Wolf-Rayet models develop neutrino-driven explosions a few hundred milliseconds after core bounce, whereas the model fails to explode without the help of strong convective seed perturbations in agreement with an earlier simulation of the same model (Müller et al., 2017). These results further strengthen the case for a regime of relatively early shock revival in high-mass progenitors with massive cores and oxygen shells (Ott et al., 2018; Burrows et al., 2020).
The explosion energies for the two Wolf-Rayet stars are still rising by the end of the simulation. The energetics of the model is on track for a normal explosion with an energy of and at a post-bounce time of , which may yet increase to after a few more seconds. By contrast, the rotating model has already reached , which is still increasing at a rate of . This demonstrates that the neutrino-driven mechanism can produce powerful explosions and not only account for underenergetic events. Since the net accretion rate onto the PNS is already small in this model, the cycle of accretion and mass ejection could presumably continue for several seconds without black hole formation. Although longer simulations are needed for verification, we speculate that several could be reached. This suggests that neutrino heating might even play an important subsidiary role in the early stages of hypernova explosions by reviving the shock and delivering a significant part of the hypernova explosion energy.
Different from other rotating 3D explosion models (Takiwaki et al., 2016; Janka et al., 2016; Summa et al., 2018), in the model the explosion occurs without help from the spiral mode of the SASI or the low- instability, and is characterised by a bipolar outflow geometry that is roughly aligned with the rotation axis. As a result, the PNS spin and kick remain aligned within . This suggests that rapid progenitor rotation should be explored further as a possible explanation for spin-kick alignment, which cannot be accounted for in non-rotating 3D models in a natural manner (Wongwathanarat et al., 2013; Müller et al., 2019).
We also examine the gravitational-wave emission of our models. The non-rotating models show the expected emission features, with a spectrogram dominated by high-frequency f/g-modes, as well as a strong low-frequency SASI mode in the case of the progenitor. At first glance, the model comports with this familiar picture as well, but reveals a new, interesting effect of rapid rotation upon closer inspection. The f-mode frequency is more than a factor of two lower than expected for the PNS parameters. The reduced mode frequency can be explained by a negative angular momentum gradient in the PNS surface region, which counteracts the stabilising entropy gradient that normally sets the f-mode frequency. The angular momentum gradient can be traced back to differential rotation between the Si and O shell in the progenitor, which is probably a generic phenomenon since angular momentum transport across shell boundaries is generally less efficient than within shells. Attempts to constrain PNS properties based on the mode frequencies (Torres-Forné et al., 2019) will need to address the potential impact of rotation in future.
We estimate the distance to which the gravitational-wave emission of our models could be detected by current ground-based gravitational-wave detectors at design sensitivity, and by the future Einstein Telescope. Due to rapid rotation and its high explosion energy, the amplitude of the model is large enough for it to be detected to a distance of almost 2 Mpc in the Einstein Telescope. Interestingly, the detection distance does not depend very much on the observer direction, since f/g-mode excitation contributes to the SNR to a similar degree as the rotational bounce signal.
Our new models add further confidence that the neutrino-driven scenario can explain a broader range of explosion properties and produce rather powerful gravitational-wave signals in some cases. Further simulations with complementary simulation methodologies, as well as more extensive parameter studies are needed to corroborate these optimistic findings.
Acknowledgements
We thank D. Aguilera-Dena, N. Langer, and S.-C. Yoon for providing Wolf-Rayet star models. JP is supported by the Australian Research Council (ARC) Centre of Excellence for Gravitational Wave Discovery (OzGrav), through project number CE170100004. BM is supported by ARC Future Fellowship FT160100035. Some of this work was performed on the Raijin supercomputer with the assistance of resources and services from the National Computational Infrastructure (NCI), which is supported by the Australian Government. Some of this work was performed on the OzSTAR national facility at Swinburne University of Technology. OzSTAR is funded by Swinburne University of Technology and the National Collaborative Research Infrastructure Strategy (NCRIS).
References
- Abbott et al. (2018) Abbott B. P., et al., 2018, Living Reviews in Relativity, 21, 3
- Abdikamalov et al. (2014) Abdikamalov E., Gossan S., DeMaio A. M., Ott C. D., 2014, Phys. Rev. D, 90, 044001
- Acernese & et al. (2015) Acernese F., et al. 2015, Classical and Quantum Gravity, 32, 024001
- Aguilera-Dena et al. (2018) Aguilera-Dena D. R., Langer N., Moriya T. J., Schootemeijer A., 2018, ApJ, 858, 115
- Andresen et al. (2017) Andresen H., Müller B., Müller E., Janka H.-T., 2017, MNRAS, 468, 2032
- Andresen et al. (2019) Andresen H., Müller E., Janka H. T., Summa A., Gill K., Zanolin M., 2019, MNRAS, 486, 2238
- Beck et al. (2012) Beck P. G., et al., 2012, Nature, 481, 55
- Blondin & Mezzacappa (2006) Blondin J. M., Mezzacappa A., 2006, ApJ, 642, 401
- Blondin et al. (2003) Blondin J. M., Mezzacappa A., DeMarino C., 2003, The Astrophysical Journal, 584, 971
- Bray & Eldridge (2016) Bray J. C., Eldridge J. J., 2016, Monthly Notices of the Royal Astronomical Society, 461, 3747
- Bruenn & Mezzacappa (1994) Bruenn S. W., Mezzacappa A., 1994, ApJ, 433, L45
- Buras et al. (2003) Buras R., Janka H.-T., Keil M. T., Raffelt G. G., Rampp M., 2003, ApJ, 587, 320
- Burrows (2013) Burrows A., 2013, Reviews of Modern Physics, 85, 245
- Burrows et al. (2007) Burrows A., Dessart L., Livne E., Ott C. D., Murphy J., 2007, ApJ, 664, 416
- Burrows et al. (2019) Burrows A., Radice D., Vartanyan D., 2019, MNRAS, 485, 3153
- Burrows et al. (2020) Burrows A., Radice D., Vartanyan D., Nagakura H., Skinner M. A., Dolence J., 2020, MNRAS, 491, 2715
- Cerdá-Durán et al. (2007) Cerdá-Durán P., Font J. A., Dimmelmeier H., 2007, A&A, 474, 169
- Cerdá-Durán et al. (2013) Cerdá-Durán P., DeBrye N., Aloy M. A., Font J. A., Obergaulinger M., 2013, ApJ, 779, L18
- Chan et al. (2018) Chan C., Müller B., Heger A., Pakmor R., Springel V., 2018, ApJ, 852, L19
- Cordero-Carrión et al. (2009) Cordero-Carrión I., Cerdá-Durán P., Dimmelmeier H., Jaramillo J. L., Novak J., Gourgoulhon E., 2009, Phys. Rev. D, 79, 024017
- Cutler & Flanagan (1994) Cutler C., Flanagan É. E., 1994, Phys. Rev. D, 49, 2658
- Deheuvels et al. (2014) Deheuvels S., et al., 2014, A&A, 564, A27
- Dimmelmeier et al. (2002) Dimmelmeier H., Font J. A., Müller E., 2002, A&A, 393, 523
- Dimmelmeier et al. (2007) Dimmelmeier H., Ott C. D., Janka H. T., Marek A., Müller E., 2007, Phys. Rev. Lett., 98, 251101
- Dimmelmeier et al. (2008) Dimmelmeier H., Ott C. D., Marek A., Janka H.-T., 2008, Phys. Rev. D, 78, 064056
- Farrow et al. (2019) Farrow N., Zhu X.-J., Thrane E., 2019, ApJ, 876, 18
- Faucher-Giguère & Kaspi (2006) Faucher-Giguère C.-A., Kaspi V. M., 2006, ApJ, 643, 332
- Foglizzo et al. (2007) Foglizzo T., Galletti P., Scheck L., Janka H.-T., 2007, ApJ, 654, 1006
- Fuller et al. (2015) Fuller J., Klion H., Abdikamalov E., Ott C. D., 2015, MNRAS, 450, 414
- Gossan et al. (2016) Gossan S. E., Sutton P., Stuver A., Zanolin M., Gill K., Ott C. D., 2016, Phys. Rev. D, 93, 042002
- Guilet et al. (2015) Guilet J., Müller E., Janka H.-T., 2015, MNRAS, 447, 3992
- Hild et al. (2008) Hild S., Chelkowski S., Freise A., 2008, preprint, (arXiv:0810.0604)
- Hild et al. (2011) Hild S., et al., 2011, Classical and Quantum Gravity, 28, 094013
- Hobbs et al. (2005) Hobbs G., Lorimer D. R., Lyne A. G., Kramer M., 2005, MNRAS, 360, 974
- Iwamoto et al. (1998) Iwamoto K., et al., 1998, Nature, 395, 672
- Janka (2012) Janka H.-T., 2012, Annual Review of Nuclear and Particle Science, 62, 407
- Janka (2017a) Janka H.-T., 2017a, ApJ, 837, 84
- Janka (2017b) Janka H.-T., 2017b, ApJ, 837, 84
- Janka et al. (2016) Janka H.-T., Melson T., Summa A., 2016, Annual Review of Nuclear and Particle Science, 66, 341
- Johnston et al. (2005) Johnston S., Hobbs G., Vigeland S., Kramer M., Weisberg J. M., Lyne A. G., 2005, MNRAS, 364, 1397
- Kasen & Woosley (2009) Kasen D., Woosley S. E., 2009, ApJ, 703, 2205
- Kuroda et al. (2014) Kuroda T., Takiwaki T., Kotake K., 2014, Phys. Rev. D, 89, 044011
- Kuroda et al. (2016) Kuroda T., Kotake K., Takiwaki T., 2016, ApJ, 829, L14
- Kuroda et al. (2018) Kuroda T., Kotake K., Takiwaki T., Thielemann F.-K., 2018, MNRAS, 477, L80
- Lattimer & Swesty (1991) Lattimer J. M., Swesty F. D., 1991, Nucl. Phys., A535, 331
- Lentz et al. (2015) Lentz E. J., et al., 2015, ApJ, 807, L31
- Liebendörfer (2005) Liebendörfer M., 2005, ApJ, 633, 1042
- MacFadyen & Woosley (1999a) MacFadyen A. I., Woosley S. E., 1999a, ApJ, 524, 262
- MacFadyen & Woosley (1999b) MacFadyen A. I., Woosley S. E., 1999b, ApJ, 524, 262
- Melson et al. (2015) Melson T., Janka H.-T., Bollig R., Hanke F., Marek A., Müller B., 2015, ApJ, 808, L42
- Morozova et al. (2018) Morozova V., Radice D., Burrows A., Vartanyan D., 2018, ApJ, 861, 10
- Mösta et al. (2014) Mösta P., et al., 2014, ApJ, 785, L29
- Müller (2016) Müller B., 2016, Publ. Astron. Soc. Australia, 33, e048
- Müller (2017) Müller B., 2017, preprint, (arXiv:1703.04633)
- Müller & Janka (2014) Müller B., Janka H.-T., 2014, ApJ, 788, 82
- Müller & Janka (2015) Müller B., Janka H.-T., 2015, MNRAS, 448, 2141
- Müller et al. (2010) Müller B., Janka H.-T., Dimmelmeier H., 2010, ApJS, 189, 104
- Müller et al. (2013) Müller B., Janka H.-T., Marek A., 2013, ApJ, 766, 43
- Müller et al. (2016a) Müller B., Heger A., Liptai D., Cameron J. B., 2016a, MNRAS, 460, 742
- Müller et al. (2016b) Müller B., Viallet M., Heger A., Janka H.-T., 2016b, ApJ, 833, 124
- Müller et al. (2017) Müller B., Melson T., Heger A., Janka H.-T., 2017, MNRAS, 472, 491
- Müller et al. (2019) Müller B., et al., 2019, MNRAS, 484, 3307
- Murphy et al. (2009) Murphy J. W., Ott C. D., Burrows A., 2009, ApJ, 707, 1173
- Ng & Romani (2007) Ng C.-Y., Romani R. W., 2007, ApJ, 660, 1357
- Noutsos et al. (2013) Noutsos A., Schnitzeler D. H. F. M., Keane E. F., Kramer M., Johnston S., 2013, MNRAS, 430, 2281
- Nugis & Lamers (2000) Nugis T., Lamers H. J. G. L. M., 2000, A&A, 360, 227
- O’Connor & Ott (2011) O’Connor E., Ott C. D., 2011, ApJ, 730, 70
- Obergaulinger & Aloy (2020) Obergaulinger M., Aloy M. Á., 2020, MNRAS, 492, 4613
- Ott et al. (2007) Ott C. D., Dimmelmeier H., Marek A., Janka H.-T., Hawke I., Zink B., Schnetter E., 2007, Phys. Rev. Lett., 98, 261101:1
- Ott et al. (2018) Ott C. D., Roberts L. F., da Silva Schneider A., Fedrow J. M., Haas R., Schnetter E., 2018, ApJ, 855, L3
- Özel & Freire (2016) Özel F., Freire P., 2016, ARA&A, 54, 401
- Pajkos et al. (2019) Pajkos M. A., Couch S. M., Pan K.-C., O’Connor E. P., 2019, ApJ, 878, 13
- Paxton et al. (2011) Paxton B., Bildsten L., Dotter A., Herwig F., Lesaffre P., Timmes F., 2011, ApJS, 192, 3
- Pejcha & Prieto (2015) Pejcha O., Prieto J. L., 2015, ApJ, 799, 215
- Powell & Müller (2019) Powell J., Müller B., 2019, MNRAS, 487, 1178
- Punturo et al. (2010) Punturo M., et al., 2010, Classical and Quantum Gravity, 27, 194002
- Radice et al. (2019) Radice D., Morozova V., Burrows A., Vartanyan D., Nagakura H., 2019, ApJ, 876, L9
- Rampp & Janka (2002) Rampp M., Janka H.-T., 2002, A&A, 396, 361
- Richers et al. (2017) Richers S., Ott C. D., Abdikamalov E., O’Connor E., Sullivan C., 2017, Phys. Rev. D, 95, 063019
- Scheidegger et al. (2010) Scheidegger S., Käppeli R., Whitehouse S. C., Fischer T., Liebendörfer M., 2010, A&A, 514, A51
- Shibagaki et al. (2019) Shibagaki S., Kuroda T., Kotake K., Takiwaki T., 2019, arXiv e-prints, p. arXiv:1909.09730
- Soderberg et al. (2006) Soderberg A. M., et al., 2006, Nature, 442, 1014
- Srivastava et al. (2019) Srivastava V., Ballmer S., Brown D. A., Afle C., Burrows A., Radice D., Vartanyan D., 2019, Phys. Rev. D, 100, 043026
- Sukhbold et al. (2016) Sukhbold T., Ertl T., Woosley S. E., Brown J. M., Janka H. T., 2016, ApJ, 821, 38
- Summa et al. (2018) Summa A., Janka H.-T., Melson T., Marek A., 2018, ApJ, 852, 28
- Suwa et al. (2019) Suwa Y., Tominaga N., Maeda K., 2019, MNRAS, 483, 3607
- Taddia et al. (2018) Taddia F., et al., 2018, A&A, 609, A136
- Takiwaki & Kotake (2018) Takiwaki T., Kotake K., 2018, MNRAS, 475, L91
- Takiwaki et al. (2014) Takiwaki T., Kotake K., Suwa Y., 2014, ApJ, 786, 83
- Takiwaki et al. (2016) Takiwaki T., Kotake K., Suwa Y., 2016, MNRAS, 461, L112
- The LIGO Scientific Collaboration et al. (2015) The LIGO Scientific Collaboration Aasi J., Abbott B. P., Abbott R., et al. 2015, Classical and Quantum Gravity, 32, 074001
- Torres-Forné et al. (2018) Torres-Forné A., Cerdá-Durán P., Passamonti A., Font J. A., 2018, MNRAS, 474, 5272
- Torres-Forné et al. (2019) Torres-Forné A., Cerdá-Durán P., Obergaulinger M., Müller B., Font J. A., 2019, Phys. Rev. Lett., 123, 051102
- Usov (1992) Usov V. V., 1992, Nature, 357, 472
- Vigna-Gómez et al. (2018) Vigna-Gómez A., et al., 2018, Monthly Notices of the Royal Astronomical Society, 481, 4009
- Walk et al. (2019) Walk L., Tamborra I., Janka H.-T., Summa A., 2019, Phys. Rev. D, 100, 063018
- Weaver et al. (2017) Weaver T. A., Zimmerman G. B., Woosley S. E., 2017, KEPLER: General purpose 1D multizone hydrodynamics code (ascl:1702.007)
- Wellstein et al. (2001) Wellstein S., Langer N., Braun H., 2001, A&A, 369, 939
- Winteler et al. (2012) Winteler C., Käppeli R., Perego A., Arcones A., Vasset N., Nishimura N., Liebendörfer M., Thielemann F. K., 2012, ApJ, 750, L22
- Wongwathanarat et al. (2013) Wongwathanarat A., Janka H. T., Müller E., 2013, A&A, 552, A126
- Yoon (2017) Yoon S.-C., 2017, MNRAS, 470, 3970