Vanadium-based neutron beam monitor
Abstract
A prototype quasi-parasitic thermal neutron beam monitor based on isotropic neutron scattering from a thin natural vanadium foil and standard 3He proportional counters is conceptualized, designed, simulated, calibrated, and commissioned.
The European Spallation Source designed to deliver the highest integrated neutron flux originating from a pulsed source is currently under construction in Lund, Sweden.
The effort to investigate a vanadium-based neutron beam monitor was triggered by a list of requirements for Beam Monitors permanently placed in the ESS neutron beams in order to provide reliable monitoring at complex beamlines: low attenuation, linear response over a wide range of neutron fluxes, near to constant efficiency for neutron wavelengths in a range of 0.6-10 Å, calibration stability and the possibility to place the system in vacuum are all desirable characteristics.
The scattering-based prototype, employing a natural vanadium foil and standard \ce^3He proportional counters, was investigated at the V17 and V20 neutron beamlines of the Helmholtz-Zentrum in Berlin, Germany, in several different geometrical configurations of the \ce^3He proportional counters around the foil. Response linearity is successfully demonstrated for foil thicknesses ranging from 0.04 mm to 3.15 mm. Attenuation lower than 1% for thermal neutrons is demonstrated for the 0.04 mm and 0.125 mm foils. The geometries used for the experiment were simulated allowing for absolute flux calibration and establishing the possible range of efficiencies for various designs of the prototype. The operational flux limits for the beam monitor prototype were established as a dependency of the background radiation and prototype geometry. The herein demonstrated prototype monitors can be employed for neutron fluxes ranging from n/s/cm2.
I Introduction
The European Spallation Source (ESS) ERIC [1, 2, 3] is established to design, construct and commission a multi-disciplinary research facility based around a neutron source with unique properties, enabling in turn scientific discoveries in one of the initial 15 instrument stations [4]. The neutron beams of the ESS, produced from an accelerated proton beam collisions in a Tungsten target, will be delivered in 2.86 ms long pulses at the frequency of 14 Hz. The neutron flux at its peak will be approximately 30 times higher than the flux from any reactor source and 5 times higher than the flux from any other currently operational spallation source [1].
More than 150 choppers and numerous guides and other beamline components will adapt the dynamic range and the resolution of the main pulse and guide the neutrons with the desired energies and phase space to each individual instrument station. Due to the high integrated flux, bispectral (thermal and cold neutrons) extraction from the neutron moderators [5, 6] and the unique long pulse time structure of the main 2.86 ms pulse from the spallation source, the instruments will be able to use beams with rates and a range of neutron wavelengths that were not available until now and this in turn introduces new possibilities for the experimental research in material sciences [7, 8, 9, 10].
The range of wavelengths transported to the instruments sample position runs from 0.6 Å to ca. 20 Å. The lower limit is given by the constraints of neutron transport through curved waveguides, the upper limit by the difficulty in transporting ultracold neutrons. In order to ensure the correct alignment of the beam along the main beam-guides, the proper phase-settings of the choppers and therefore the correct energy range of the neutrons delivered to the instruments, a number of Beam Monitors [11] have to be placed along the beam-lines. The multitude of beamline components for instruments at ESS, much higher than for existing neutron sources, implies a greater need for monitoring. Beam Monitors are going to be placed near the monolith, near choppers, near the sample position and in some cases for specific instruments there will be a transmission monitor placed measuring the transmission of the beam through the sample. Figure 1 shows the current number of Beam Monitors at various locations for each instrument. Beam monitors that are placed permanently in the neutron beam before the sample position (e.g. after choppers and between guide sections) are required to have low attenuation characteristics. In these locations parasitic and quasi-parasitic methods of beam monitoring that do not disturb the neutron beam are preferred, however such methods do not exist yet to the desired performance.

In this work, a neutron-scattering based prototype Beam Monitor employing a natural vanadium (\ce^natV) foil and standard \ce^3He detectors in a configuration symmetric around the foil is introduced as a candidate of such a quasi-parasitic Beam Monitor. A vanadium based neutron beam prototype is considered for the locations along the beam-guides and in the near proximity of choppers due to its envisioned low attenuation and high-flux monitoring performance.
II Vanadium Beam Monitor principle
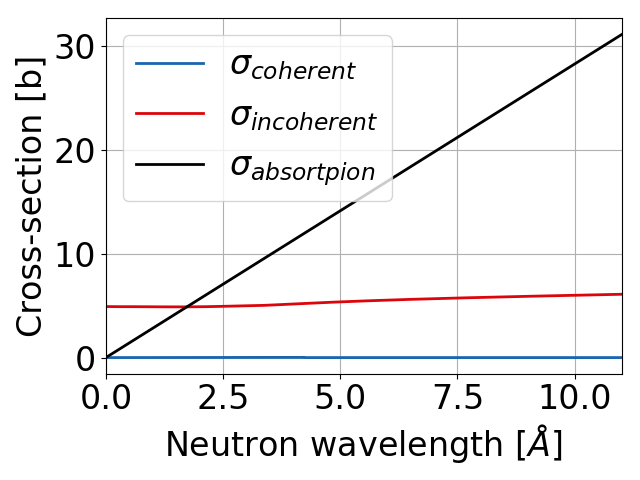
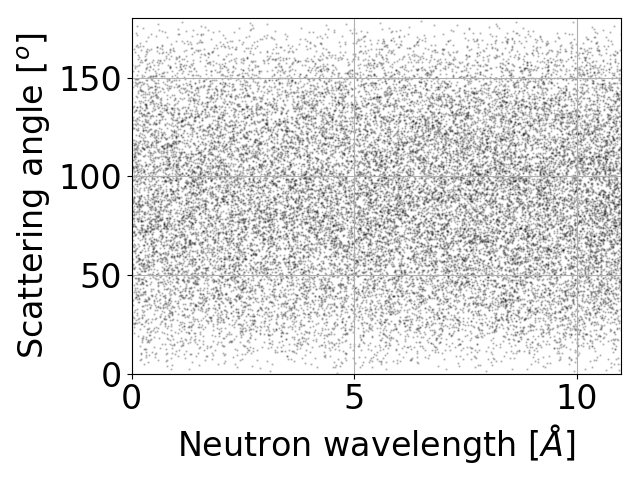
To achieve low attenuation of a neutron beam requires to place as little material in the neutron beam as possible. Therefore a neutron-scattering concept is considered where the neutrons scatter from a thin foil and are subsequently detected by commercially available detectors. Further, a foil material with neutron-interaction properties resulting in an easily identifiable signal is highly desirable. Other properties of interest for the base material for a quasi-parasitic Beam Monitor include radiation hardness, that the material isotropically scatters neutrons, good mechanical properties, chemical inertness and optionally vacuum tolerance. Note that few materials scatter thermal neutrons isotropically. In fact besides hydrogen, it is only vanadium that scatters isotropically [12, 13, 14, 15, 16]. Fig. 2 shows the dependency of the coherent and incoherent scattering as a function of wavelength and the scattering angle as a function of the neutron wavelength range of interest. The coherent scattering is negligible (), while the incoherent scattering is very close to being constant with respect to wavelength, so the number of scattered neutrons is almost independent of wavelength (%). Note that the neutron absorption in vanadium has a linear dependency, so the attenuation changes linearly with the wavelength.
It is possible to also imagine using a non-isotropically scattering material as the base for such a monitor. An example of this might be monitoring the scattering off already existing Al beam window. However, the existence of coherent scattering off this window means that a more detailed and careful calibration and commissioning would be needed. Care would need to be taken in the design to ensure the proportionality of the scattering to flux from the monitor output. Therefore V is chosen here as the material for the monitor.
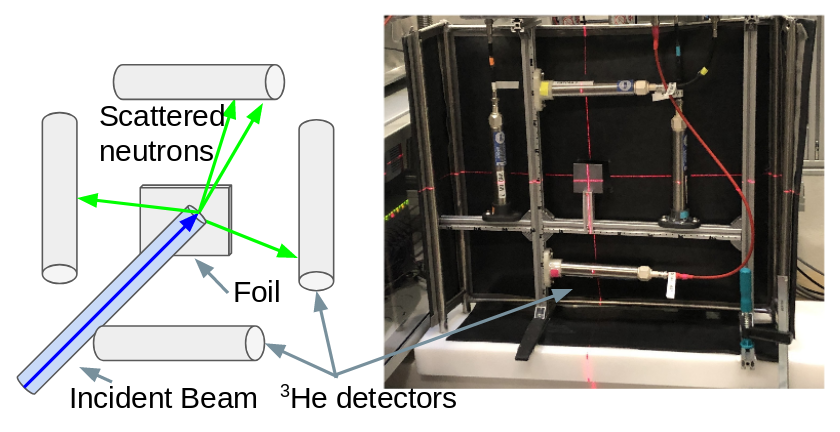
The sketch of a basic design of such a Beam Monitor is presented in Fig. 3. This design has been inspired by a similar device at the ISIS Neutron and Muon Source at the STFC Rutherford Appleton Laboratory near Oxford, UK [19, 20, 21] on the LET spectrometer. In the figure, the thin foil is placed in a beam and only a low amount of incident neutrons are scattered or captured by the foil. Around the foil, there are symmetrically placed detectors. These are commercially available neutron detectors which record the neutrons scattered from the foil. Additionally, the foil is producing -rays as a product of neutron absorption: these were studied in detail earlier [22]. The detectors can be placed symmetrically: in that way a sudden increase of counts in one of the detectors might determine the asymmetry of the beam. For all the measurements carried out with this prototype Beam Monitor, the 3He proportional counters from Reuter-Stokes [23] were used. The 3He proportional counters were 10 cm long tubes, 2.5 cm in diameter. The 3He pressure was 8 bar and they were all operated at +1150 V. The distances of the 3He proportional counters were varied and 5 different foils with thicknesses depicted in the first column of table 1 were used. Boron shielding (3 mm of MirroBor [24]) was placed around the \ce^3He proportional counters in all directions except that facing directly the foil to reduce background.
The concept was initially calibrated at the Source Testing Facility (STF)[25, 22] in Lund using isotropic Beryllium-based sources [26]. The induced -ray background was characterized, the measurements were simulated and the viability of the Beam Monitor based on the neutron-scattering was confirmed[22]. Thus the proof-of-concept tests were performed at the beamline V17 and the test beamline of the ESS V20 at the Helmholtz-Zentum Berlin (HZB), Germany [27, 28, 29, 30]. The setup of V17 and V20 is detailed below.
III Experimental setup at V17 and V20
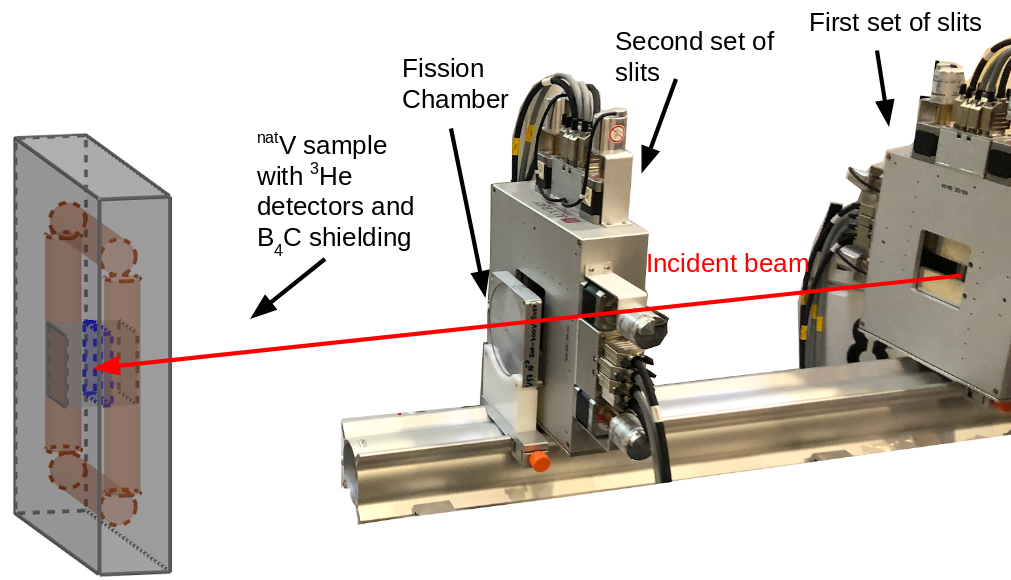
Firstly, V17 is an instrument designed to test neutron detectors for different applications. The monochromator (4 mm thick pyrolytic graphite with an area 8 x 1 cm2[27]) produces a beam of 3.35 Å wavelength. The flux at this beamline was measured to be n/cm2 in 2003 [31]. Measurements done by other groups in 2019 showed a flux of n/cm2 [32]. Figure 4 shows the experimental setup for neutron scattering on \ce^natV at V17. For the commissioning of the Vanadium Beam Monitor prototype, a reference LND 3053 fission chamber [33] was placed upstream of the \ce^natV foil. The monochromatic neutron beam was collimated using two sets of slits. The first set of slits was fixed at 3 3 cm2 and the opening between the second set of slits was varied in steps of 2 mm in the x and y direction. This enabled to study the response of the \ce^3He detectors which comprised the prototype Beam Monitor as a function of neutron beam intensity on the \ce^natV sample.
Secondly, the flexible design of V20 (Fig. 5) offers convenient control of both the flux and wavelength range of the neutron beam. V20 was designed to mimic the ESS pulse structure using two counter-rotating double-disk-chopper systems [29]. For the standard operation of V20, the ESS Source Choppers are calibrated to provide 2.86 ms pulse-length with a repetition rate of 14 Hz. This emulates the ESS accelerated-proton beam which is directed onto the ESS tungsten target. Another double-disk-chopper serves as Wavelength-Band chopper in order to prevent frame overlap in time-of-flight, and it can also be used to select more narrow wavelength bands altogether. After the ESS Source Choppers additional Wavelength-Band (WB) choppers have been used. Note that Fig. 5c shows also a system of Wavelength Frame Multiplication (WFM) choppers that can be parked in open position if not desired.
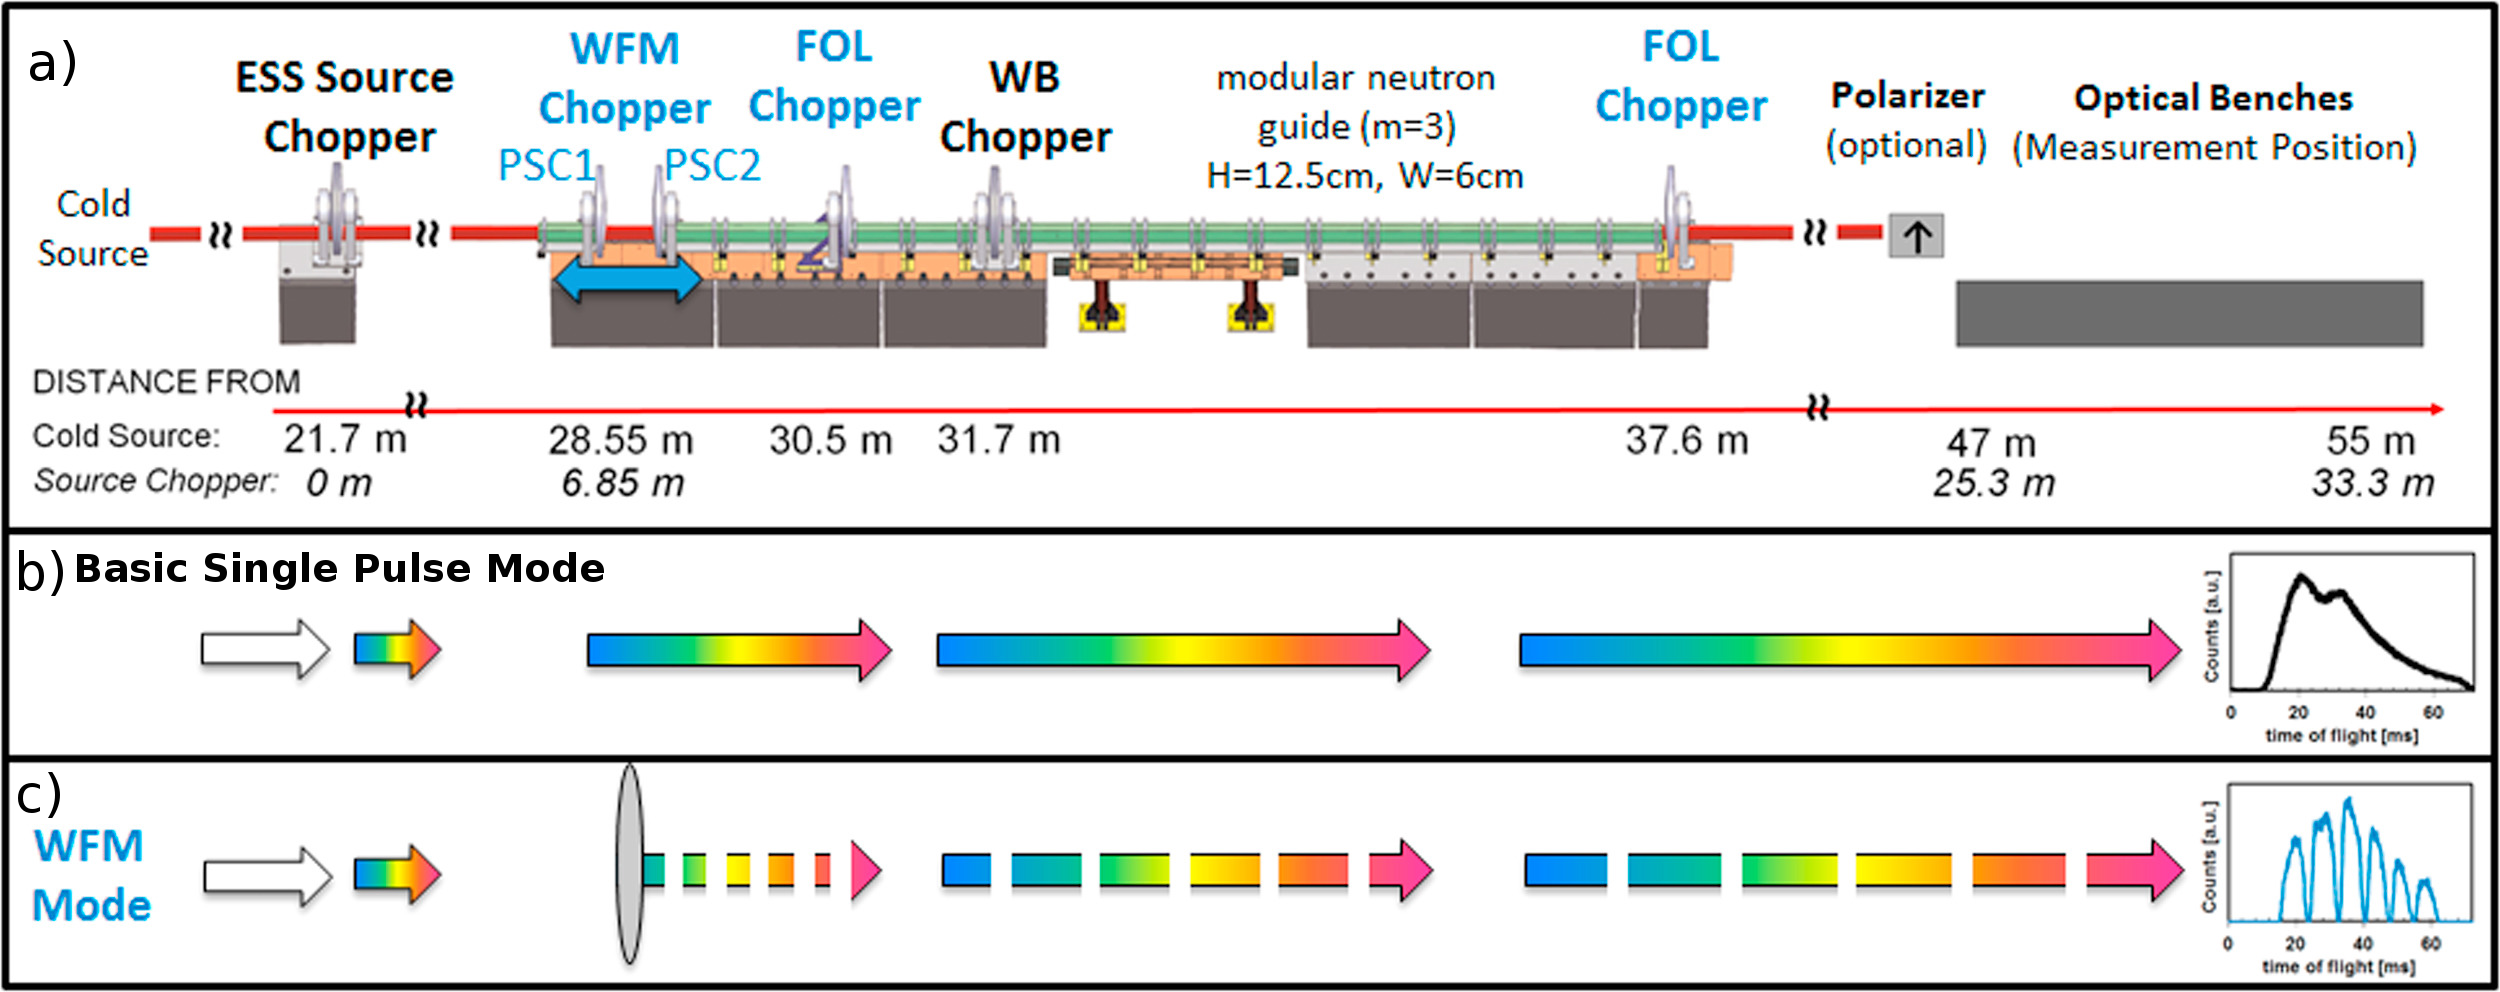
In this work, we only utilized the two double-disk-choppers (i.e. the Source Choppers and WB choppers) set to co-rotation and the WFM choppers remained parked in open position. More specifically, the angular opening window of the Source Choppers (from now on referred to as choppers 1 and 2) was varied to produce neutron pulses of different length, hence resulting in different integrated intensities, whereas the angular opening of the WB Choppers (from now on referred as choppers 3 and 4) was fixed throughout the experiment in order to restrict the wavelength band. In this way, we obtained neutron beams with a narrow wavelength around 3.0 Å (this was done in order to compare the monitor efficiency to the one measured at 3.35 Å at V17). By incrementally changing the effective opening of chopper 1 and 2, we were able to study the response of the \ce^3He detectors in the prototype Beam Monitor as a function of neutron beam intensity on the \ce^natV sample, while maintaining the same illumination area. Fig. 6 shows the change of the width of the wavelength band as a function of the chopper opening phase angle. As the phase of chopper 1 was kept constant the phase of chopper 2 was incrementally increased resulting in Source Chopper opening angles of 5 to 22.5 o. With increasing Source Chopper opening angle the FWHM of the wavelength band increases and the centre of the wavelength band shifts as shown in Fig. 6. The centre-shift towards smaller wavelengths is a consequence of the WB choppers 3 and 4 kept at constant phase while only delaying the closing of chopper 2, therefore allowing neutrons with higher velocities to traverse the WB choppers.
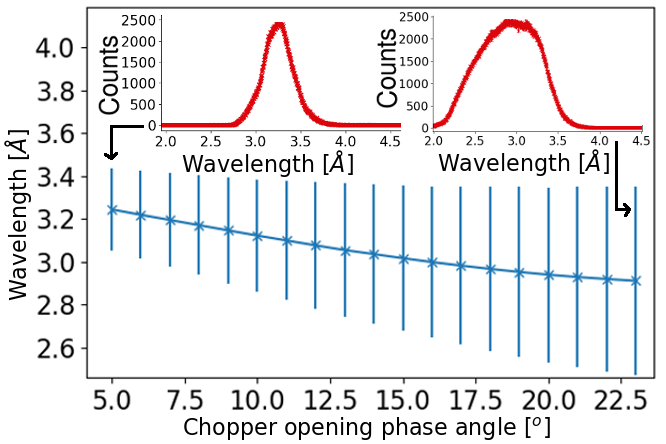
Fig. 7 illustrates the experimental setup for neutron scattering on \ce^natV at V20. Instead of a fission chamber as used on V17, this time an reference Eurisys Mesures \ce^3He beam monitor [34] was placed downstream of the \ce^natV foil. The neutron beam was collimated using two sets of slits, each with openings of cm2.
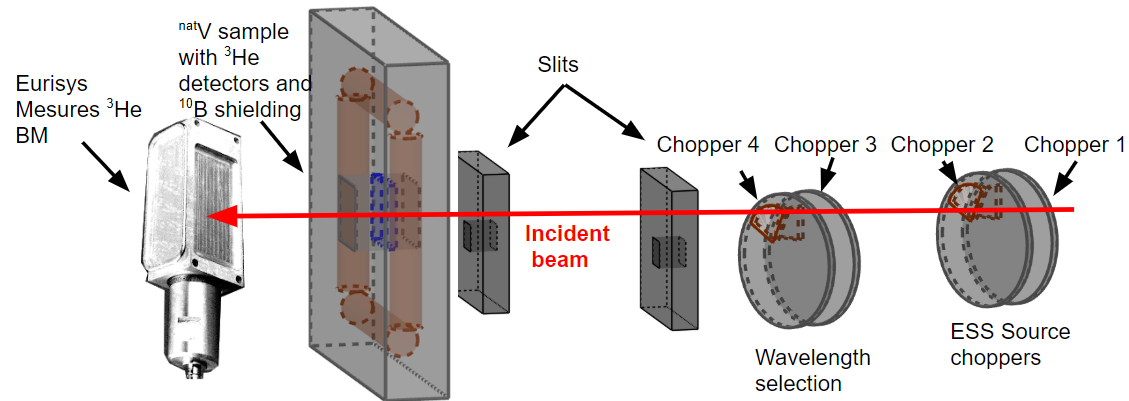
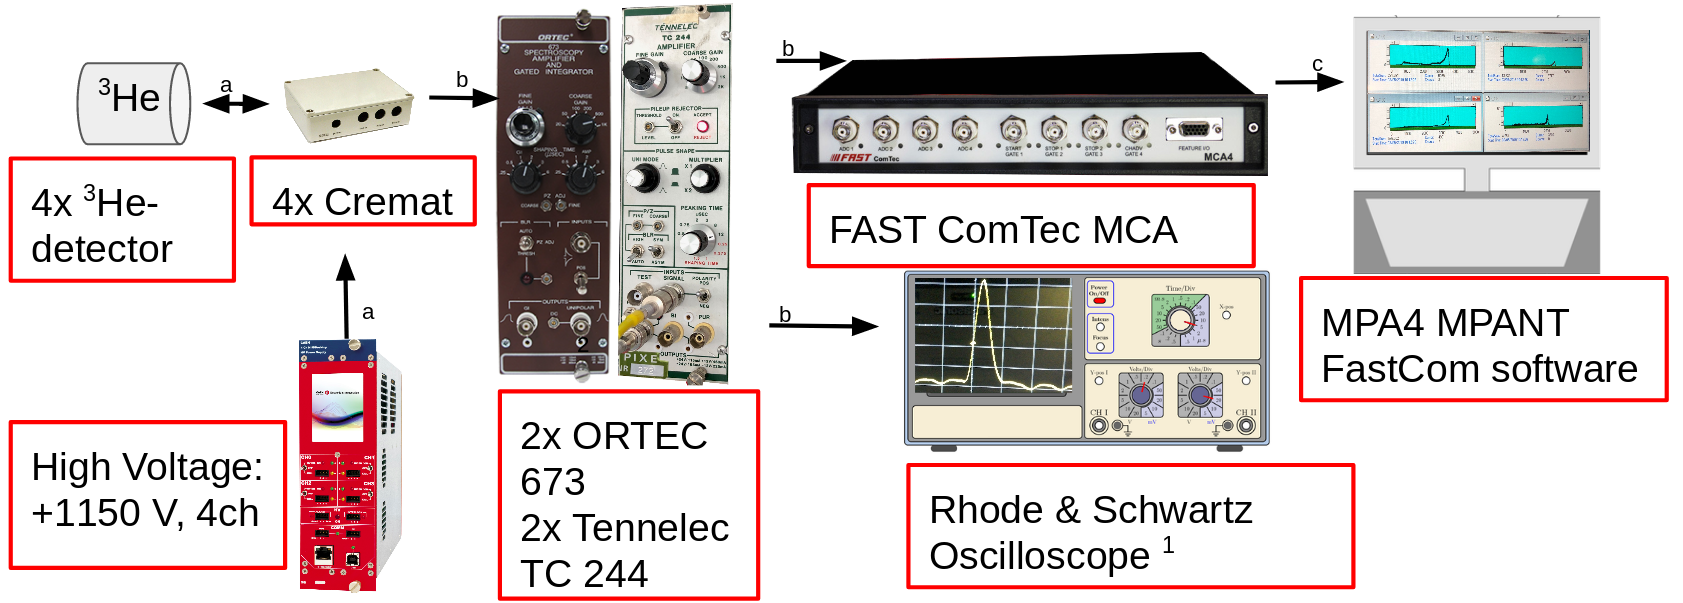
Figure 8 shows the Data-acquisition system (DAQ) employed for the \ce^3He detectors. The electronic chain was common for both beamlines. Operated at +1150 V, each detector produced a positive current pulse that was passed to a Cremat preamplifier [35]. From the preamplifier, two of the signals were passed to NIM ORTEC 673 amplifiers/shapers [36] while the other two were passed to Tennelec amplifiers/shapers [37]. A Rhode & Schwartz [38] oscilloscope was used to visually monitor the pulses periodically. The amplified and shaped pulses were passed to a FAST ComTec MCA4 MCA [39]. The MCA integrated the current pulses to yield the charge corresponding to each event and binned these charges resulting in histograms that were stored for subsequent offline analysis.
IV Flux limits
In order to absolutely calibrate the beam: let be the initial intensity of the beam of interest, the number of scattered neutrons from the V-foil in and is the intensity detected in the detector. in general depends on the thickness of the foil , the scattering cross section for the neutron scattering in vanadium b (this cross section is mostly independent on the neutron wavelength as seen in Fig. 2) and the atomic density atomscm3. The equation is then expressed as:
| (1) |
Furthermore the relationship between and is a function of solid angle, calculated as the projection of the detector active area on a sphere with the radius where is the distance of the detector from the vanadium foil. The number of counts on the \ce^3He counter has to be corrected by the efficiency of the detection:
| (2) |
From the two equations combined can be expressed as a function of :
| (3) |
From here then
| (4) |
The coefficient is the efficiency of the Vanadium Beam Monitor prototype and is the absolute calibration constant, required to calculate the original beam intensity . Next to a simple analytical approach, the coefficients are also calculated by matching the simulations to the measurements. The simulations are performed by using Geant4 [40, 41, 42], ESS framework [43] and NCrystal [17, 18] using the physics list QGSP_BIC_HP; that way the solid angle is treated more precisely, the crystal structure of vanadium and multiple scattering events are taken into consideration. Also for V17 the changing dimensions of the beam are simulated which would be problematic analytically.
| d [mm] | [%] | (r) | [%] | (r) |
|---|---|---|---|---|
| 3.15 | 6.9 | 0.144 | 11 | 0.09 |
| 1.00 | 21.8 | 0.045 | 25.3 | 0.039 |
| 0.20 | 109.0 | 0.009 | 109.1 | 0.009 |
| 0.125 | 174.4 | 0.006 | 196.3 | 0.005 |
| 0.04 | 545.1 | 0.002 | 494.0 | 0.002 |
Table 1 shows the predictions for the efficiency and calibration constants for different thicknesses as a function of the distance . The simulation model predicts slightly different numbers then the analytical one: this is due to multiple scattering in the vanadium foil when having thicker pieces of vanadium.
In order to estimate limits of the flux with respect to the thickness of the foil , the distance of the center of the counter from the center of the foil and Background rate, the following equations are used.
The highest linearly detectable instantaneous intensity is restrained by the counting limits of the \ce^3He proportional counter (from the supplier: 75000 n/s) and the maximum distance of the \ce^3He proportional counters from the center of the foil. The lowest detectable instantaneous intensity is restricted by convolution of the background rate on the \ce^3He proportional counter and the distance .
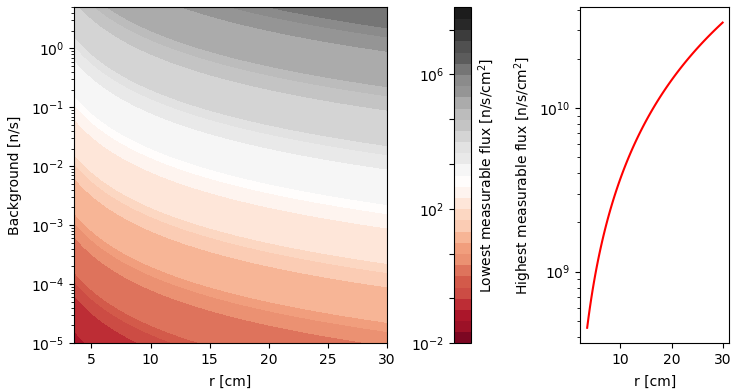
Fig. 9 shows the flux limits in the range of (0,30) cm. The highest linearly detectable flux is independent of the background, while if the lowest detectable flux changes from vacuum to 1 n/s, in order for the signal to be clearly distinguishable from the background, the required flux can shift by several orders of magnitude. In theory there are no restrictions on how far the counters can be placed: GHz range may be achieved for m. However this also rises the lowest detectable flux significantly as a function of the background: the higher the background, the higher are the lowest measurable fluxes and at very large values of there may be very significant systematic influences on the measured flux. So far, it was discussed how the background and the distance of the \ce^3He counter affect the count rate capability of the Vanadium Beam Monitor prototype. However there are also other factors: increasing or decreasing the pressure of the counter or changing the detector type can be potentially another tool how to change the flux limits. Another possibility is to make the vanadium foil smaller than the dimensions of the beam.
V Results
V.1 V17
Fig. 10 shows the photo of the geometry of the Vanadium Beam Monitor prototype together with the no-vanadium background corrected count rates recorded by each of the \ce^3He proportional counter for the foils with thicknesses of 3.15 mm, 1 mm, 0.2 mm, 0.125 mm and 0.04 mm. Table 2 displays the placement of each of the \ce^3He proportional counters with respect to the centre of the foil. The response is linear with a very good agreement to the fits with DOF(degrees-of-freedom) with several exceptions. The linear inconsistencies for 3.15 mm thick foil when measuring with \ce^3He proportional counter 1 and 2 are likely to be explained by the foil being placed asymmetrically, so that the left bottom corner of the foil was not illuminated. This serves as proof of concept for monitoring the asymmetry of the beam. The instability of the 0.04 mm foil for He-counter 1 is due to the low statistics compared to background. \ce^3He proportional counters 2 and 3 were placed near to symmetry to study systematic effects. Shifting the alignment of the counters by 1 mm at 5 cm distance resulted in response different by several hundreds n/s 0.01 % of the beam. The further the \ce^3He proportional counters are placed, the lower is the rate recorded, the dependence is quadratic. The distance of the 3He-counter is a tool of changing the efficiency of the Beam Monitor and therefore changing the highest and lowest flux limits. The efficiency adjustment is a convolution between the thickness of the vanadium foil , the distance of the \ce^3He proportional counter .
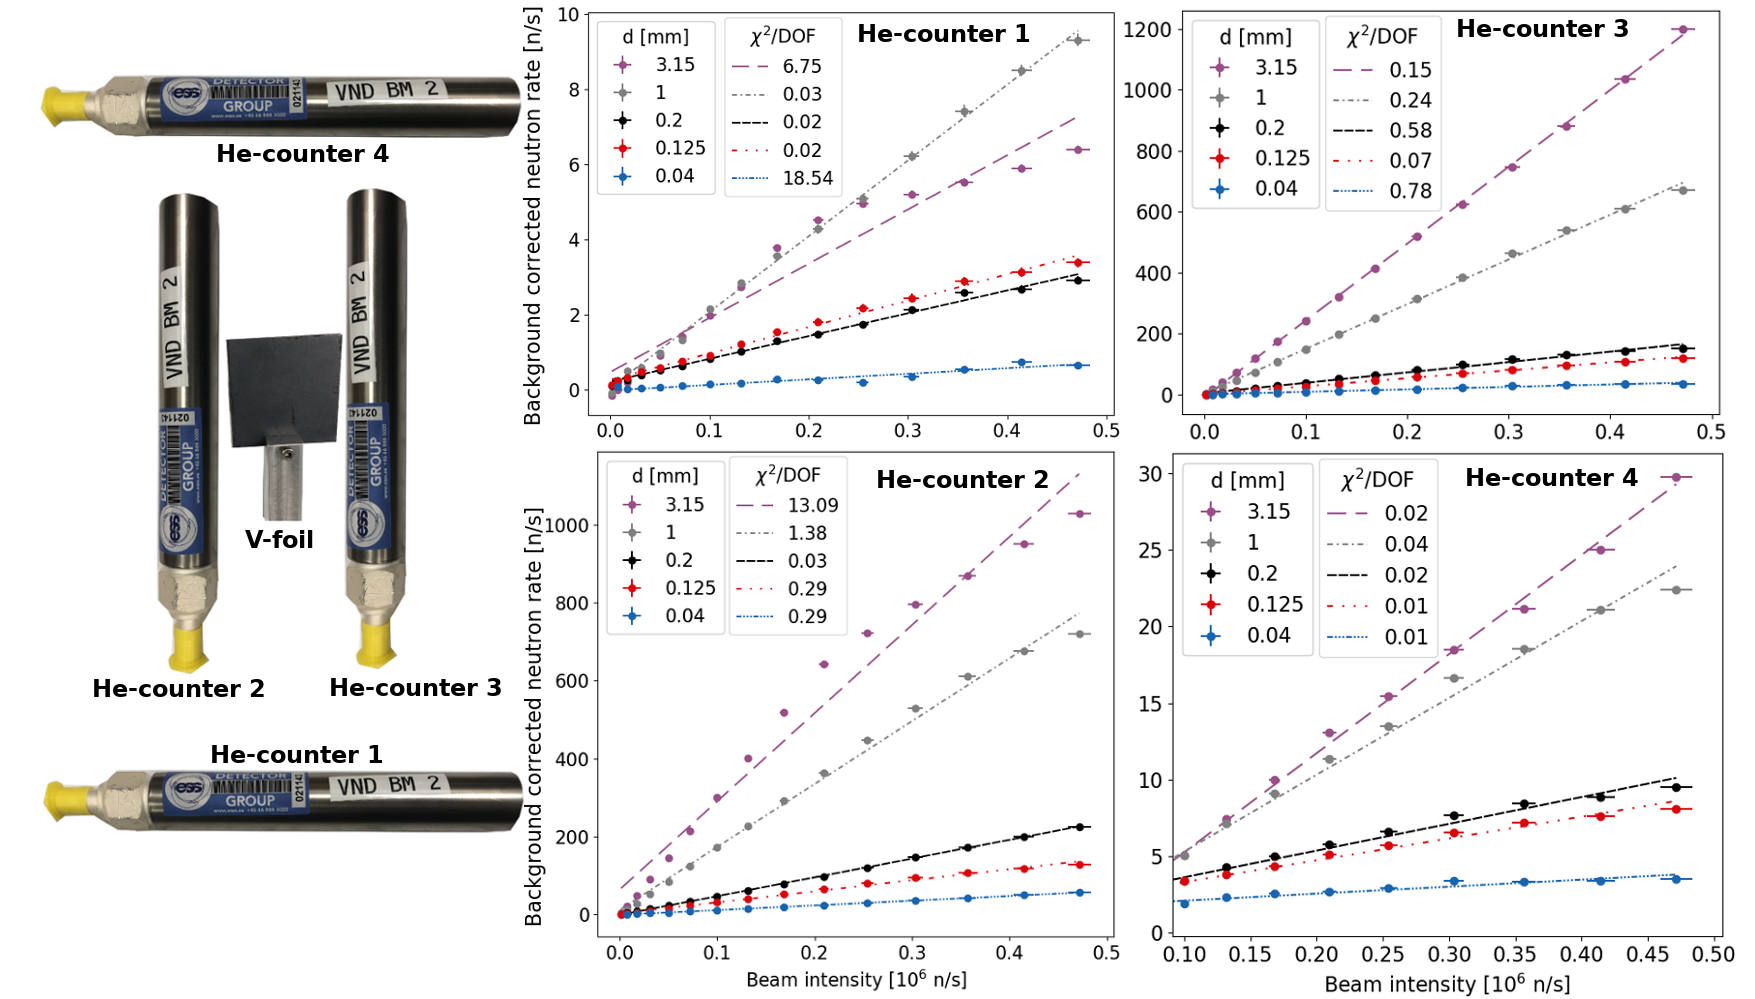
| Counter no. | Beamline | r [cm] |
|---|---|---|
| 1 | V20 | 5.2 |
| 1 | V17 | 13 |
| 2 | V17 | 5.1 |
| 3 | V17 | 4.9 |
| 4 | V17 | 11 |
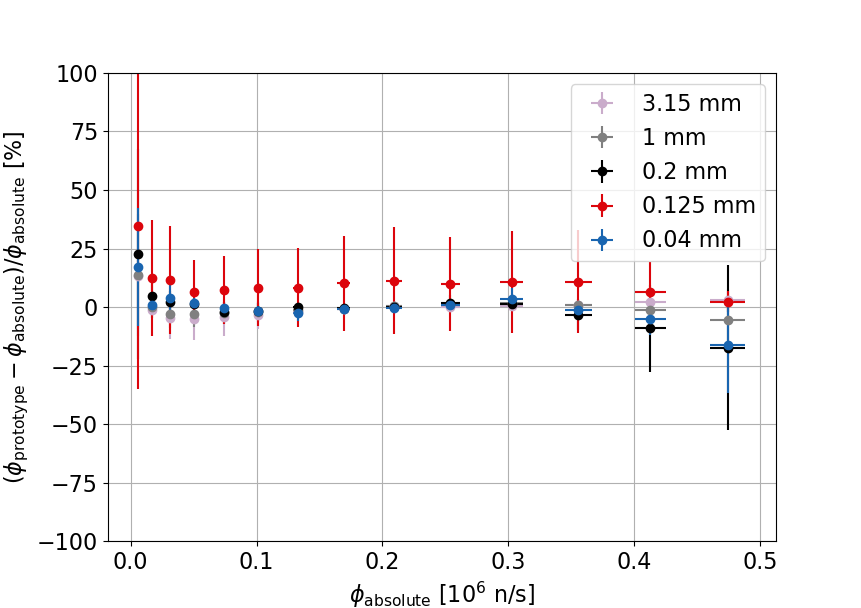
In order to absolutely calibrate the detector, the experiment had been simulated, see Sec. IV. Fig. 11 shows the ratio of the difference between the absolute counts (calculated from the raw measured counts and the factor determined from the simulations) on the prototype Beam Monitor and the efficiency corrected counts on the LND fission chamber . The uncertainties in the x direction were estimated by assuming 3% of variation in the \ceUO2 coating on the fission chamber. The main component of the uncertainty in the y-direction is asymmetry of the \ce^3He proportional counters, and the middle of the beam (and the centre of the foil). The uncertainty was assumed to be 3 mm. The first value is a low flux related uncertainty, the rest are around 20%, likely due to the inhomogeneity of the beam. The Beam Monitor shows stable response within the error bars. This demonstrates that for a static system, where the flux is constant, but the illumination area changes, the absolute flux calibration is possible and reliable. It can be seen that for a future implementation with effort understanding the measurement systematics, these uncertainties can be greatly reduced. The downward trend towards the highest values is likely due to the nonlinear beam at high slit opening.
V.2 V20
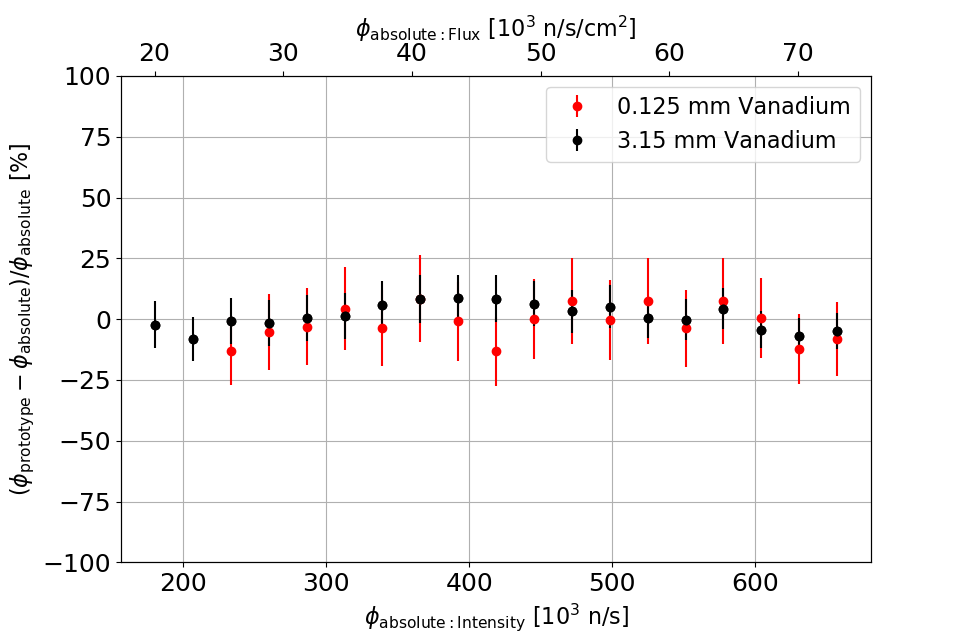
Fig. 12 shows the ratio of the difference between the absolute counts (calculated from the raw measured counts and the factor determined from the simulations) on the prototype Beam Monitor and the efficiency corrected counts on the Eurisys Mesures \ce^3He Beam Monitor. The bottom x-axis shows the neutron beam intensity integrated across the beam, the top x-axis shows the flux. In order to calibrate the x-axis, the chopper opening angles were linearly plotted as a function of the flux recorded on a reference Eurisys Mesures \ce^3He Beam Monitor. The opening angles were then converted to intensity and the flux was calculated by dividing by 9 cm2 of the illumination area. The absolute calibration is even more stable than in the case of V17, this is expected since a narrower region of fluxes is analyzed and since unlike in the previous case, the illumination area remains the same. The uncertainties are this time around 15%. The uncertainties are smaller than in case of V17: by maintaining the same illumination area, the setup is less sensitive to the area effects.
The attenuation in each of the \ce^natV foil was measured. This was done by expressing ratio of where is the intensity of the attenuated beam recorded by the Eurisys Mesures \ce^3He Beam Monitor for every thickness of the V-foil present in the beam and is the intensity recorded by the Eurisys Mesures \ce^3He Beam Monitor when no vanadium was present in the beam. The results are summarized in Table 3.
| \ce^natV foil thickness 0.01 [mm] | Attenuation at 3.1 Å [%] | |
| Measured | Expected | |
| 3.15 | 19.09 | 25 |
| 1.00 | 6.91 | 9 |
| 0.20 | 1.43 | 1.8 |
| 0.125 | 1.11 | 1.1 |
| 0.04 | 0.47 | 0.4 |
The suitable foils to use are therefore the 0.125 mm and 0.04 mm foils, because of their exceptionally low attenuation. As demonstrated in Fig. 13, the 0.04 mm foil attenuation remains below 1 % even for 10 Å neutrons, while typical attenuation of a standard Beam Monitor is in the best case 2% per mm of window [11].
V.3 Wavelength dependency
Fig. 13 depicts two of the foils: 0.125 mm and 0.04 mm. The attenuation is simulated for both of them (red axis, red curves, dashed for 0.125 mm and solid for 0.04 mm). The efficiency was also simulated (black axis, black curves, dashed for 0.125 mm and solid for 0.04 mm). The simulation curves are for the case in which the foil is placed 5 cm from the detector: this was the case for experimental setup of one of the \ce^3He proportional counters at V17. The experimental point for the V20 efficiency was corrected for the distance (the counter was placed originally placed 6 cm from the centre of the foil). The efficiency is independent of wavelength for higher wavelengths, for lower wavelengths it is determined by the efficiency of the \ce^3He proportional counter, which had been taken into consideration in this plot.
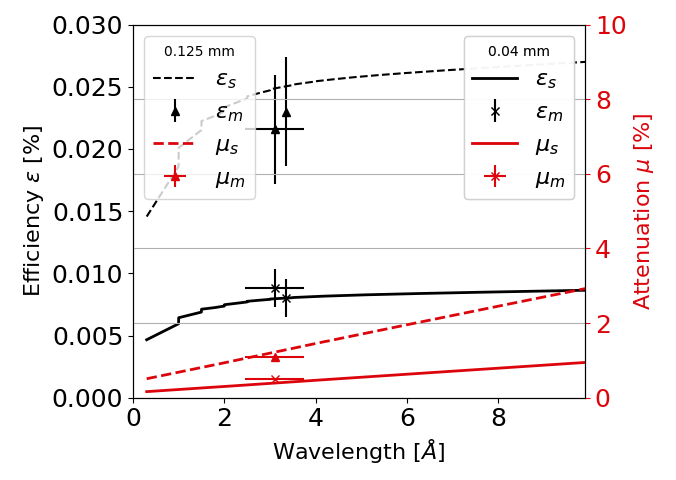
Since the coherent scattering does not change with the wavelength, the number of scattered neutrons does not change with the wavelength, making this prototype Beam Monitor suitable to be placed along the beamguides and in the close proximity of the choppers where the wavelengths will be mixed. Attenuation however is a function of the total cross section; the absorption cross section is wavelength dependent. However the instruments with the 10 Å selection can choose the 0.04 mm thin foil, in this case event the attenuation for 10 Å is still below 1 %.
Using the inverse efficiency ( coefficients from the simulations) enabled to absolutely calibrate the counts recorded at V17. Fig. 11 shows the absolute calibration of the the prototype Beam Monitor at V17 for all the different foil thicknesses. The x-axis are the counts recorded by an 3053 LND fission chamber [33]. These were corrected by the efficiency given by the supplier (at 1.8 Å) and multiplied by the ratio between the cross section at 3.35 Å and 1.8 Å. This results in an average flux of n/cm2/s. This is approximately half of the recently measured value by Luis Margato [32] n/cm2/s, however this can be explained by differences in methods: Margato’s group measured only a little portion of the beam, the inhomogeneity of the beam could cause a flux fluctuation. Furthermore the absolutely corrected flux of the prototype Beam Monitor matches the corrected numbers recorded by the fission chambers, indicating the flux is indeed of this order.
V.4 Background induced by the beam
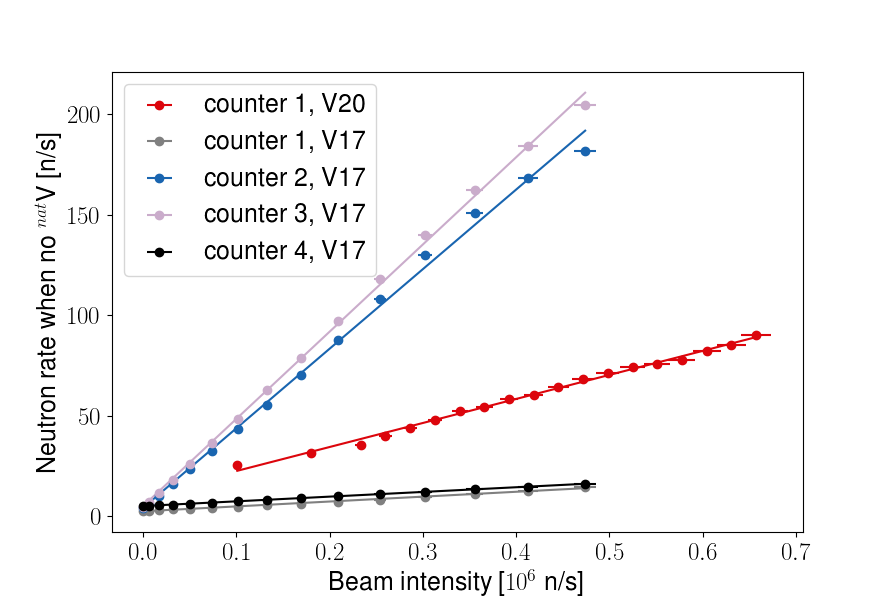
The focus was to measure the effects of the beam when no vanadium was present in the setup, but the beam was on. In a perfect setup with excellent shielding, where there is no beam dispersion and no other materials in the beam, the response should be the same as the background with the beam off. Fig. 14 shows the real response when no vanadium present, but the beam on. The recorded counts in 4 \ce^3He counters at V17 (see Table 2) and 1 at V20 have linear resemblance. For all the subsequent analysis, this rate was subtracted to investigate purely the effects of vanadium. It is important for any implementation of such monitors to minimise these effects, as it may not be really linear with respect to the flux in the guide, and so it acts as a systematic uncertainty on flux measurements, and will limit the lower limit of the measurement range of such monitors.
VI Conclusions
A prototype quasi-parasitic thermal neutron Beam Monitor employing a \ce^natV foil and standard \ce^3He proportional counters around the foil had been conceptualized, designed, simulated, calibrated, and commissioned. The cross section for the neutron scattering has been demonstrated as being mainly independent of wavelength, both by simulations and by measurements. The prototype has been commissioned with beams of neutrons at the V17 and V20 beamlines of the Helmholtz-Zentrum in Berlin, Germany and thus has been proved to function excellently as a quasi-parasitic Beam Monitor.
This conclusion is based upon the minimal measured beam attenuation with demonstrated linearity over neutron-beam intensities ranging from – n/s. Higher fluxes could be reached by thinner foil, larger distance and lower pressure in the \ce^3He proportional counters. As variations in the neutron-beam intensity were obtained by both varying the beam-spot size with slits, as well as altering the time structure of the beam with choppers, confidence in the response performance of the Beam Monitor to widely varying beam conditions is high. Absolute calibration has been demonstrated in both V17 and V20 and the background has been characterized. Based upon desired attenuation being lower than 1% at 3 Å, the maximum \ce^natV foil thickness cannot exceed 0.125 mm, where the attenuation is 1.3% at 3 Å. These values correspond to the startup commissioning of the ESS instruments.
As the prototype demonstrated both low neutron-beam attenuation and response linearity over a reasonable dynamic range, it appears that the concept is sound and worth further detailed design for the ultimate purpose of deployment at ESS.
Acknowledgements.
We acknowledge the support of Helmholtz-Zentrum Berlin for supporting the beam time at the V20 Testbeamline of the ESS and V17 Detector Test Station and the support of Source Testing Facility for supporting the initial characterization tests at Lund University. Furthermore we would like to acknowledge the support from BrightnESS, EU-H2020 grant number: 676548 for personnel and provision of hardware and software. Last, we would like to acknowledge Luis Margato for valuable discussion about the flux at V17.References
- [1] S. Peggs et al. European Spallation Source Technical Design Report ESS-2013-001. European Spallation Source, 04 2013.
- [2] R. Garoby et al. The European Spallation Source design. Physica Scripta, 93(1):014001, dec 2017.
- [3] ESS website. https://europeanspallationsource.se/, 2020. Accessed: 2020-1-20.
- [4] K. Andersen et al. The instrument suite of the european spallation source. Nuclear Instruments and Methods in Physics Research Section A: Accelerators, Spectrometers, Detectors and Associated Equipment, pp. 163402, 2020.
- [5] M. R. F. Mezei. Neutron-optical componet array for the specific spectral shaping of neutron beams or pulses, 2006. patent: US20050157831A1 ESS-0502620.
- [6] K. H. Andersen et al. Optimization of moderators and beam extraction at the ESS. Journal of Applied Crystallography, 51(2):264–281, Apr 2018.
- [7] F. Fernandez-Alonso and D. L. Price. Neutron Scattering–Applications in Biology, Chemistry, and Materials Science. Elsevier, 2017.
- [8] P. Staron et al. Neutrons and synchrotron radiation in engineering materials science: From fundamentals to applications: Second edition. Elsevier, 01 2017.
- [9] N. Kardjilov et al. Advances in neutron imaging. Materials Today, 21(6):652 – 672, 2018.
- [10] B. Winkler. Applications of neutron radiography and neutron tomography. Reviews in Mineralogy and Geochemistry, 63(1):459–471, 2006.
- [11] F. Issa et al. Characterization of thermal neutron beam monitors. Phys. Rev. Accel. Beams, 20:092801, Sep 2017.
- [12] D. Day et al. The use of vanadium scattering to intercalibrate an array of thermal neutron detectors. Nuclear Instruments and Methods, 70(2):164 – 168, 1969.
- [13] D. Page. The phonon frequency distribution of vanadium. Proceedings of the Physical Society, 91(1):76–85, 1967.
- [14] A. T. Stewart and B. N. Brockhouse. Vibration spectra of vanadium and a mn-co alloy by neutron spectrometry. Rev. Mod. Phys., 30:250–255, Jan 1958.
- [15] C. M. Eisenhauer et al. Measurement of lattice vibrations in vanadium by neutron scattering. Phys. Rev., 109:1046–1051, Feb 1958.
- [16] A. Goel et al. Lattice dynamics of vanadium and niobium by a modified sharma-joshi model. Physica B+C, 96(2):229 – 236, 1979.
- [17] X.-X. Cai and T. Kittelmann. Ncrystal: A library for thermal neutron transport. Computer Physics Communications, 246:106851, 2020.
- [18] NCrystal github. https://github.com/mctools/ncrystal/wiki, 2020. Accessed: 2020-2-20.
- [19] ISIS. ISIS neutron and muon source. https://www.isis.stfc.ac.uk, 2019. Accessed: 2019-04-03.
- [20] R. Bewley et al. LET, a cold neutron multi-disk chopper spectrometer at isis. Nuclear Instruments & Methods in Physics Research Section A-accelerators Spectrometers Detectors and Associated Equipment - NUCL INSTRUM METH PHYS RES A, 637:128–134, 05 2011.
- [21] D. R. Bewley. Private commentation, 2018. ISIS Neutron and Muon Source, LET instrument scientist.
- [22] V. Maulerova. Vanadium-based neutron-beam monitor. 2019 JINST TH 004, 2019. Lund University, Master Thesis.
- [23] Reuter stokes. https://www.industrial.ai/measurement-sensing/radiation-measurement/homeland-security-detectors/helium-3-gas-filled-proportional-detectors, 2019. Accessed: 2019-04-03.
- [24] Mirrotron. https://mirrotron.com/en/products/radiation-shielding, 2019.
- [25] F. Messi et al. The neutron tagging facility at lund university, 2017. (submitted to IAEA Technical Report on Modern Neutron Detection (2017)).
- [26] J. Scherzinger et al. A comparison of untagged gamma-ray and tagged-neutron yields from 241ambe and 238pube sources. Applied Radiation and Isotopes, 127:98 – 102, 2017.
- [27] V17 webpage, detector test station, V17, helmholtz-zentrum berlin. https://www.helmholtz-berlin.de, 2019. Accessed: 2019-09-05.
- [28] R. Woracek et al. The test beamline of the european spallation source – instrumentation development and wavelength frame multiplication. Nuclear Instruments and Methods in Physics Research Section A: Accelerators, Spectrometers, Detectors and Associated Equipment, 839:102 – 116, 2016.
- [29] M. Strobl et al. The wavelength frame multiplication chopper system for the ess test beamline at the ber ii reactor—a concept study of a fundamental ess instrument principle. Nuclear Instruments and Methods in Physics Research Section A: Accelerators, Spectrometers, Detectors and Associated Equipment, 705:74 – 84, 2013.
- [30] V. Maulerova et al. First neutron data recorded at the v20 test instrument utilizing prototype chopper systems and beam monitors planned for ESS. EPL (Europhysics Letters), 128(5):52001, jan 2020.
- [31] D. T. Wilpert. Private commentation, 2018. HZB Helmholtz-Zentrum Berlin.
- [32] L. Margato. Private commentation, 2018. LIP coimbra, Portugal.
- [33] LND. Fission chamber. https://www.lndinc.com/products/neutron-detectors/3053/, 2019. Accessed: 2019-03-21.
- [34] E. Mesures. Neutron beam monitor mnh10/4.2f, 2019. Accessed: 2019-03-21.
- [35] Cremat Inc, Electronics for pulse detection, CR-11x CSP modules, CSP housing. http://www.cremat.com/, 2019. Accessed: 2019-03-25.
- [36] Ortec, ametec, 673 spectroscopy amplifier and gated integrator. https://www.ortec-online.com/products/electronics/amplifiers/673, 2019. Accessed: 2019-03-25.
- [37] Tennelec. Instruction manual tc 244 amplifier. web.ift.uib.no/~kjetil/wiki/Tennelec_TC244.pdf, 2013. Accessed: 2019-04-13.
- [38] Rohde & schwartz. https://www.rohde-schwarz.com/se/home_48230.html, 2019. Accessed: 2019-03-21.
- [39] Mca4 4 input multichannel analyzer 2 input multichannel scaler manual. https://www.fastcomtec.com/ftp/manuals/mca4doc.pdf, 2019. Accessed: 2019-04-13.
- [40] S. Agostinelli et al. Geant4—a simulation toolkit. Nuclear Instruments and Methods in Physics Research Section A: Accelerators, Spectrometers, Detectors and Associated Equipment, 506(3):250 – 303, 2003.
- [41] J. Allison et al. Geant4 developments and applications. IEEE Transactions on Nuclear Science, 53(1):270–278, Feb 2006.
- [42] J. Allison et al. Recent developments in geant4. Nuclear Instruments and Methods in Physics Research Section A: Accelerators, Spectrometers, Detectors and Associated Equipment, 835:186 – 225, 2016.
- [43] T. Kittelmann et al. Geant4 based simulations for novel neutron detector development. Journal of Physics: Conference Series, 513(2):022017, 2014.