Probing UV-Sensitive Pathways for CN & HCN Formation in Protoplanetary Disks with the Hubble Space Telescope
Abstract
The UV radiation field is a critical regulator of gas-phase chemistry in surface layers of disks around young stars. In an effort to understand the relationship between photocatalyzing UV radiation fields and gas emission observed at infrared and sub-mm wavelengths, we present an analysis of new and archival HST, Spitzer, ALMA, IRAM, and SMA data for five targets in the Lupus cloud complex and 14 systems in Taurus-Auriga. The HST spectra were used to measure Ly and FUV continuum fluxes reaching the disk surface, which are responsible for dissociating relevant molecular species (e.g. HCN, N2). Semi-forbidden C II] 2325 and UV-fluorescent H2 emission were also measured to constrain inner disk populations of C+ and vibrationally excited H2. We find a significant positive correlation between 14 m HCN emission and fluxes from the FUV continuum and C II] 2325, consistent with model predictions requiring N2 photodissociation and carbon ionization to trigger the main CN/HCN formation pathways. We also report significant negative correlations between sub-mm CN emission and both C II] and FUV continuum fluxes, implying that CN is also more readily dissociated in disks with stronger FUV irradiation. No clear relationships are detected between either CN or HCN and Ly or UV-H2 emission. This is attributed to the spatial stratification of the various molecular species, which span several vertical layers and radii across the inner and outer disk. We expect that future observations with JWST will build on this work by enabling more sensitive IR surveys than were possible with Spitzer.
Subject headings:
stars: pre-main sequence, protoplanetary disks, molecules1. Introduction
Multi-wavelength observations of gas- and dust-rich disks around young stars have allowed us to develop rudimentary maps of the composition and structure of planet-forming material. Infrared surveys with Spitzer (Öberg et al., 2008; Pontoppidan et al., 2010; Bottinelli et al., 2010; Salyk et al., 2011b; Pascucci et al., 2013) and Herschel (Dent et al., 2013) provided important constraints on warm molecular gas in surface layers of the inner disks , contributing column densities and temperatures of critical molecular gas species (e.g. H2O, CO2). Sub-mm observations of star-forming regions with ALMA have revealed the structure of cold gas in the outer disks with unprecedented sensitivity and angular resolution (Ansdell et al., 2016, 2017; Barenfeld et al., 2016; Pascucci et al., 2016; Miotello et al., 2017; Tazzari et al., 2017; Long et al., 2018, 2019; van Terwisga et al., 2019; Cazzoletti et al., 2019; Williams et al., 2019), showing statistically significant trends in mass and radial extent as a function of cluster age and initial conditions of the parent cloud (e.g. angular momentum, temperature; Cazzoletti et al. 2019). Both observational and theoretical work demonstrate that the chemical evolution of molecular gas is strongly dependent on the ultraviolet radiation field reaching the surface of the disk (Aikawa et al., 2002; Chapillon et al., 2012; Walsh et al., 2012, 2015; Cazzoletti et al., 2018; Cleeves et al., 2018; Agúndez et al., 2018; Bergner et al., 2019; Miotello et al., 2019). However, the effects of disk geometry and varying UV flux are degenerate in physical-chemical models of the gas distributions (see e.g. Cazzoletti et al. 2018), making it difficult to trace the precise locations of critical species within the disk in the absence of high angular resolution datasets.
Observational constraints on the UV flux reaching the disk surface are available from HST surveys of young stars with circumstellar disks (see e.g. Yang et al. 2012; France et al. 2012, 2014). The wavelength range available with the Cosmic Origins Spectrograph (HST-COS) includes Ly emission and a portion of the FUV continuum , providing estimates of key photochemical ingredients in the molecular gas disk (Bergin et al., 2003; Li et al., 2013). In addition to these direct tracers of the UV radiation field, emission lines from electronic transitions of H2 are also detected in HST-COS and HST-STIS spectra (Herczeg et al., 2002; France et al., 2012). These features originate in surface layers close to the star (Hoadley et al., 2015), providing an independent way to estimate the UV flux reaching the innermost regions of the disk (Herczeg et al., 2004; Schindhelm et al., 2012b).
In this work, we present new and archival HST-COS and HST-STIS observations of a sample of five young systems in the 3 Myr Lupus complex. We interpret our measurements of the UV radiation field and molecular gas features in the context of sub-mm CN observations and infrared HCN emission from Spitzer, including disks in Taurus-Auriga for comparison. We focus on these two molecules because of the strong dependence of their physical distributions on the UV radation field (Agúndez et al., 2008, 2018; Cazzoletti et al., 2018; Bergner et al., 2019; Greenwood et al., 2019). Our dataset therefore allows us to observationally examine the theoretical relationships between molecular gas emission and UV radiation fields, in turn constraining physical-chemical models that map abundances of volatile elements (C, N, and H). This information may be particularly useful in disk regions where gas-phase oxygen is depleted and emission from more abundant species (e.g. CO) is fainter than expected (Miotello et al., 2017; Schwarz et al., 2018). The radial distributions of these molecules can then inform us about the composition of material available for in situ protoplanetary accretion, setting important initial conditions for atmospheric chemistry (see e.g. Madhusudhan et al. 2011). To this end, we discuss the relationships between spectral tracers of the UV radiation field and integrated fluxes from CN and HCN, with particular consideration given to the impact of disk geometry and optical depth of the molecular gas.
2. Targets & Observations
2.1. A Sample of Young Disks in the Lupus Complex
Our sample consists of five young stars with circumstellar disks in the nearby ( pc; Bailer-Jones et al. 2018) Lupus cloud complex: RY Lupi, RU Lupi, MY Lupi, Sz 68, and J1608-3070. Table 1 lists the properties of each target from Alcalá et al. (2017), including stellar mass, disk inclination, and visual extinction . Interstellar is low along the line of sight to the Lupus clouds (Alcalá et al., 2017), making the region well-suited for UV observations. This group of young systems shows a broad range of outer disk morphologies in ALMA observations of their gas and dust distributions. At the time of the new HST observations, two targets (Sz 68, RU Lupi) were categorized as full, primordial disks and three (MY Lupi, RY Lupi, J1608-3070) were identified as transition disks from sub-mm images ( au; van der Marel et al. 2018) under the traditional classification scheme (see e.g. Strom et al. 1989; Skrutskie et al. 1990). However, RY Lupi differs from MY Lupi and J1608-3070 in that it has strong 10 m silicate emission (Kessler-Silacci et al., 2006) from warm grains close to the central star and undergoes periodic optical variability attributed to occultations by a warped inner disk (Manset et al., 2009). These signatures are not typical of depleted transition disks, indicating that the clearing of material seen inside 50 au is a gap, rather than a cavity (Arulanantham et al., 2018; van der Marel et al., 2018). RU Lupi and MY Lupi were observed at high resolution (5 au) with ALMA as part of the Disk Substructures at High Angular Resolution Project (DSHARP; Andrews et al. 2018), which revealed multiple rings of 1.25 mm continuum emission within each disk (Huang et al., 2018). Sz 68, a triple system that was also included in DSHARP (Andrews et al., 2018), consists of a close binary and a distant third companion. The HST and ALMA observations presented here include emission from both binary components. However, the secondary star (component B) and its disk are much smaller and fainter than the circumprimary disk (, Ghez et al. 1997; , Kurtovic et al. 2018), indicating that the bulk of the UV emission comes from the primary component.
| Target | Distance | References | |||||
|---|---|---|---|---|---|---|---|
| [pc] | [mag] | ∘ | [au] | [au] | |||
| RU Lupi**High-resolution ALMA images of RU Lupi have revealed a series of rings inside 50 au (Huang et al., 2018). The two rings with constrained values have inclinations of 20∘ and 17∘, so we use an average of the two. For both RU Lupi and MY Lupi, the radii are locations of the dust rings resolved by (Huang et al., 2018). | 159 | 0.8 | 0.07 | 18.5∘ | 14, 17, 21, 24, 29.1, 34, 42, 50 | aaBailer-Jones et al. 2018 bbHuang et al. 2018 ccvan der Marel et al. 2018 | |
| RY Lupi | 158 | 1.47 | 0.1 | 68 | 50 | 50 | aaBailer-Jones et al. 2018 ddAnsdell et al. 2016 |
| MY Lupi $\ast$$\ast$footnotemark: | 156 | 1.02 | 0.04 | 73 | 8, 20, 30, 40 | 25 | aaBailer-Jones et al. 2018 bbHuang et al. 2018 ddAnsdell et al. 2016 |
| Sz 68 | 154 | 2.13 | 0.15 | 34 | aaBailer-Jones et al. 2018 eefootnotemark: | ||
| J1608-3070 | 155 | 1.81 | 0.055 | 74 | 75 | 60 | aaBailer-Jones et al. 2018 ddAnsdell et al. 2016 |
These systems were selected for follow-up with HST after a large ALMA survey of the Lupus clouds identified them as hosts to some of the most massive dust disks in the region (Ansdell et al., 2016, 2018). However, physical-chemical models of the 13CO and C18O emission demonstrate that the total gas masses are unexpectedly low (Miotello et al., 2016, 2017), which can be attributed to either shorter timescales than predicted for removing gas from the disk (e.g. via external photoevaporation) or chemical pathways that trap carbon in larger molecules with higher freeze-out temperatures. Since UV photons are critical regulators of chemical processes in disk environments (see e.g. Aikawa et al. 2002; Bergin et al. 2003; Bethell & Bergin 2011; Walsh et al. 2012, 2015; Cazzoletti et al. 2018; Visser et al. 2018), the HST data we present here provide currently missing observational constraints on the levels of irradiation at the surface of the gas disk.
2.2. Observations
All five systems were observed with the Hubble Space Telescope (HST), using both the Cosmic Origins Spectrograph (COS; Green et al. 2012) and the Space Telescope Imaging Spectrograph (STIS; Woodgate et al. 1997a, b). Table 2 lists exposure times and program IDs for the observations. The FUV spectra for three of our targets were previously presented in France et al. 2012 (RU Lupi), Arulanantham et al. 2018 (RY Lupi), and Alcala’ et al. 2019 (MY Lupi).
| RU Lupi**The G160M 1589 setting was used for RU Lupi instead of 1577. | RY Lupi | MY Lupi | Sz 68 | J1608-3070 | |
|---|---|---|---|---|---|
| Program ID | 12036, 8157 | 14469 | 14604 | 14604 | 14604 |
| Exposure Time [s] | |||||
| Observation Date | |||||
| HST-COS G140L | 2448 | 5658 | 5538 | 5574 | |
| (1280; ) | 2016 Jun 16 | 2018 Sep 8 | 2018 Jul 27 | 2018 Jul 30 | |
| HST-COS G130M | 1686 | 654 | 1242 | 1212 | 1218 |
| (1291; ) | 2012 Jul 20 | 2016 Jun 16 | 2018 Sep 8 | 2018 Jul 27 | 2018 Jul 30 |
| HST-COS G160M | 1938 | 648 | 1296 | 1266 | 1278 |
| (1577; ) | 2012 Jul 21 | 2016 Jun 16 | 2018 Sep 8 | 2018 Jul 27 | 2018 Jul 30 |
| HST-STIS G230L | 2400 | 2028 | 1968 | 1986 | |
| (2375; ) | 2016 Jun 16 | 2018 Sep 8 | 2018 Jul 26 | 2018 Jul 30 | |
| HST-STIS G430L | 120 | 60 | 60 | 60 | 60 |
| (4300; ) | 2001 Jul 12 | 2016 Jun 16 | 2018 Sep 8 | 2018 Jul 26 | 2018 Jul 30 |
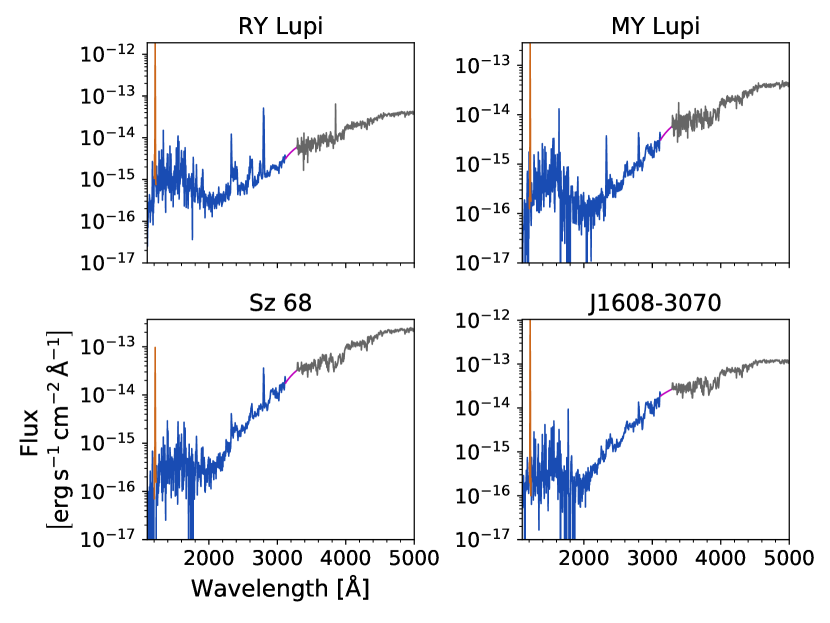
Five different modes of HST-COS and HST-STIS were used to observe four of our systems, to cover wavelengths from 1100-5000 Å. NUV coverage is not included for the fifth star, RU Lupi, which was observed as part of a different program. These data were used to extrapolate the FUV continuum down to the hydrogen ionization edge at 912 Å, which is a critical region for photodissociation of abundant molecular species (e.g. H2 and CO) and gas-phase chemistry but not readily accessible with available UV facilities (France et al., 2014). All five spectral modes were then stitched together to produce a SED for each system using the methods outlined in France et al. (2014) and Arulanantham et al. (2018). Figure 1 shows an overview of the SEDs, highlighting the strong contribution from the accretion-dominated NUV continuum . Accretion processes enhance the FUV continuum as well, but the total flux at Å is dominated by line emission from hot, atomic gas (e.g. Ly, C IV, C II). Our resulting library of radiation fields, which encompasses far-ultraviolet to optical wavelengths, is available to the community111http://cos.colorado.edu/kevinf/ctts_fuvfield.html. We anticipate that the data will be used in gas-phase chemical modeling efforts that require an understanding of stellar irradiation at the disk surface.
Sub-mm CN fluxes for this work were taken from the literature, providing measurements of gas in the cold, outer regions of the disk. The data were acquired with the SMA (Öberg et al., 2010, 2011), the IRAM 30-m telescope (Guilloteau et al., 2013), and ALMA (van Terwisga et al., 2019), causing the full sample to span several different observing configurations and spectral features. While the Lupus ALMA survey measured fluxes from the strongest hyperfine CN transitions (van Terwisga et al., 2019), features are reported from targets in Taurus-Auriga (Guilloteau et al., 2013; Öberg et al., 2011). To convert the fluxes from different datasets to comparable quantities, we adopted the methodology of van Terwisga et al. (2019) and used the ratio
| (1) |
to obtain CN flux estimates for the Lupus disks. This scaling accounts for the gas temperature distribution within the disk, under the assumption that the CN emission is optically thin. The value chosen by van Terwisga et al. (2019), which we use here, is the median from the grid of models studied by Cazzoletti et al. (2018), which spanned a range from 1.1-2.1.
The total flux in all 19 hyperfine transitions listed by Guilloteau et al. (2013) was estimated by scaling the flux in the three strongest features (226.874, 226.887, and 226.892 GHz) by a factor of 1.67, as calculated by those authors from the measured flux ratios. We applied the same scaling to the 226.874 GHz fluxes from Öberg et al. (2010, 2011); however, these measurements are likely slightly underestimated, since they do not include the weaker emission lines at 226.887 and 226.892 GHz, and we depict them as lower limits in the figures presented here. We also note that different methods were used to derive the CN fluxes, with van Terwisga et al. (2019) using aperture photometry and Guilloteau et al. (2013) and Öberg et al. (2010, 2011) using the integrated spectral lines. Guilloteau et al. (2013) account for beam dilution in their flux measurements by incorporating a “beam filling factor” in their CN line fitting procedure, while Öberg et al. (2010, 2011) estimate synthesized beam sizes. We emphasize that the differences in observing methodologies outlined here introduce systematic uncertainties into our analysis that may contribute 30% to the Lupus CN fluxes and 50% to the Öberg et al. (2010, 2011) measurements that are scaled and presented here.
Infrared HCN features, originating in the warmer inner disk, were measured directly from observations with the InfraRed Spectrograph (IRS) onboard the Spitzer Space Telescope (Houck et al., 2004). All targets except J1608-3070 were observed in the high-resolution mode over the course of several different observing programs. The data were retrieved from the Combined Atlas of Sources with Spitzer IRS Spectra (CASSIS; Lebouteiller et al. 2011, 2015), which provides a complete catalog of Spitzer/IRS observations. Fluxes from the 14 m HCN band were measured over the wavelength range defined for the feature in Najita et al. (2013). That work used slab models of the molecular gas disk to identify line-free spectral windows for each target, which we used as a reference for continuum subtraction. Although the measurement errors from the Spitzer spectra are %, the continuum subtraction procedure is likely the largest source of uncertainty in the final HCN fluxes. We quantify this by measuring the fluxes using three different sets of continuum regions defined by Pascucci et al. (2009); Teske et al. (2011); Najita et al. (2013), finding that the resulting fluxes are consistent to within 20%. The average and standard deviation of the three measurements for each target are reported in Table 3, along with observing program IDs and PIs.
| Target | Program ID | PI | Observation Date | HCN Fluxes | CN Reference |
|---|---|---|---|---|---|
| [mm/dd/yyyy] | [ erg s-1 cm-2] | ||||
| AA Tau | 20363 | J. Carr | 2005 Oct 15 | Guilloteau et al. 2013 | |
| BP Tau | 20363 | J. Carr | 2006 Mar 19 | Guilloteau et al. 2013 | |
| DE Tau | 50641 | J. Carr | 2008 Oct 8 | Guilloteau et al. 2013 | |
| DM Tau | 30300 | J. Najita | 2007 Mar 24 | Guilloteau et al. 2013 | |
| DR Tau | 50641 | J. Carr | 2008 Oct 8 | Guilloteau et al. 2013 | |
| DS Tau | 50498 | J. Houck | 2008 Nov 9 | Guilloteau et al. 2013 | |
| GM Aur | 30300 | J. Najita | 2007 Mar 14 | Öberg et al. 2010 | |
| HN Tau A | 50641 | J. Carr | 2008 Oct 1 | ||
| LkCa 15 | 40338 | J. Najita | 2008 Nov 5 | Öberg et al. 2010 | |
| MY Lupi | 20611 | C. Wright | 2005 Aug 8 | van Terwisga et al. 2019 | |
| RU Lupi | 172 | N. Evans | 2004 Aug 30 | van Terwisga et al. 2019 | |
| RY Lupi | 172 | N. Evans | 2004 Aug 30 | van Terwisga et al. 2019 | |
| SU Aur | 50641 | J. Carr | 2008 Nov 5 | Guilloteau et al. 2013 | |
| Sz 68 | 172 | N. Evans | 2004 Aug 30 | van Terwisga et al. 2019 | |
| T Tau | 40113 | F. Lahuis | 2008 Oct 1 | Guilloteau et al. 2013 | |
| J1608-3070 | van Terwisga et al. 2019 | ||||
| V4046 Sgr | 3580 | M. Honda | 2005 Apr 19 | Öberg et al. 2011 |
2.3. Archival HST Data from YSOs in Taurus-Auriga
To increase the sample size of this study and compare properties between different star-forming regions, we include all Taurus-Auriga sources from the literature with both sub-mm CN fluxes and UV spectra from HST-STIS and/or HST-COS. Disks in Taurus are roughly equivalent in age to the Lupus systems (1-3 Myr; Andrews et al. 2013; Alcalá et al. 2014) and have similar dust mass distributions (Ansdell et al., 2016; Pascucci et al., 2016), making it easier to isolate the impact of the UV radiation field on the molecular gas distributions. The UV observations were carried out as part of the COS Guaranteed Time program (PI: J. Green; PIDs: 11533, 12036), The Disks, Accretion, and Outflows (DAO) of T Tau stars program (PI: G. Herczeg; PID: 11616), and Project WHIPS (Warm H2 In Protoplanetary Systems; PI: K. France; PID: 12876). HST-COS observations were acquired with both the G130M and G160M gratings for all systems, providing wavelength coverage over the same range of FUV wavelengths (1100-1700 Å) as the spectra obtained for the five Lupus disks. Spectral features from these data (e.g. emission line strengths, accretion rates) have previously been analyzed in a number of papers, including Yang et al. (2012), Ardila et al. (2013), Ingleby et al. (2013), France et al. (2011a, 2012, 2014, 2017), and references therein. We mirror the techniques described in those works to identify various properties in the new Lupus spectra, reporting uniform measurements over the entire Lupus/Taurus-Auriga disk sample.
2.4. Uncertainty in Literature Measurements of
Observations at FUV wavelengths are highly affected by the amount of dust and gas along the line of sight to a disk , making accurate reddening corrections critical in interpreting the spectral features. France et al. (2017) report a statistically significant positive correlation between (derived from e.g. broadband color excesses, deviations from stellar photospheric templates; Kenyon & Hartmann 1995; Hartigan & Kenyon 2003) and the total luminosity from UV-fluorescent H2. The trend implies that more molecular gas emission is seen from disks with more intervening material; however, there is no physical or chemical process that would produce such a relationship between circumstellar and interstellar material, making systematic overestimates in the measurements a more likely driver. This effect must be removed in order to accurately assess relationships between the UV spectral features.
To provide an estimate of the line-of-sight interstellar extinction that is less sensitive to the circumstellar dust properties, McJunkin et al. (2014) used observed Ly profiles to directly measure the amount of neutral hydrogen (H I) along the line of sight. values were then calculated as (Bohlin et al., 1978). France et al. (2017) find that the correlation between and becomes statistically insignificant when the McJunkin et al. (2014) reddening values are adopted, so we adopt the H I-derived values for the analysis presented here.
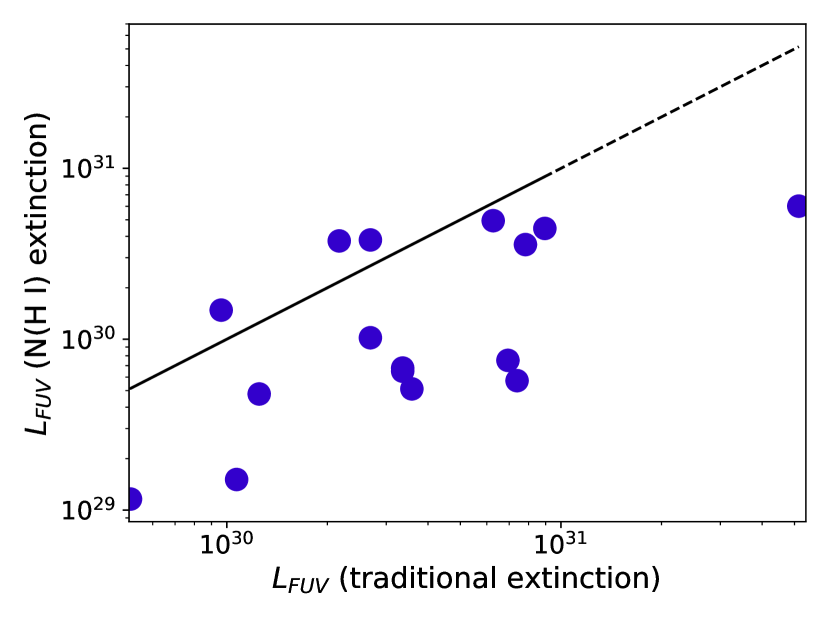
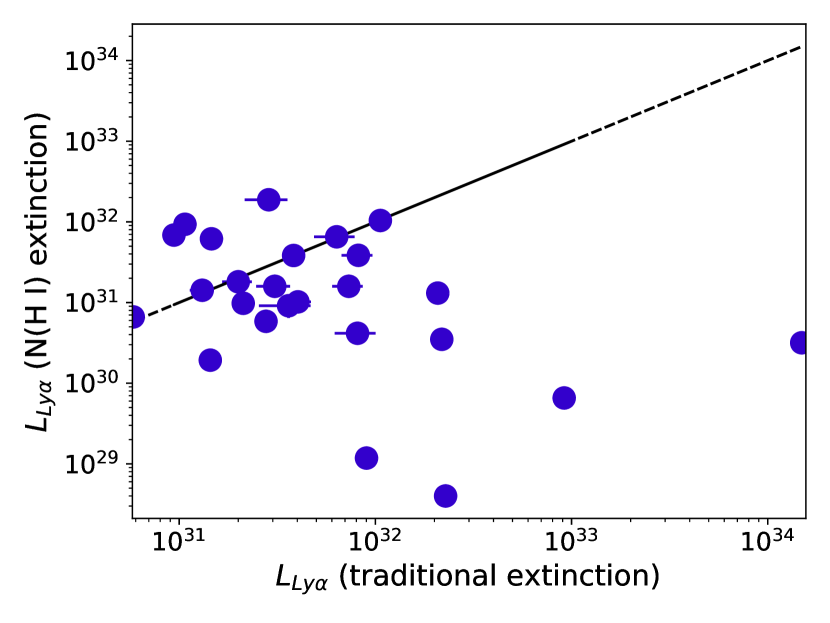
Extinctions derived using the McJunkin et al. (2014) method are typically significantly lower than reported in the literature, since the measurements isolate interstellar from circumstellar material that may significantly increase estimates (e.g. DR Tau; ). Figure 2 compares the FUV continuum luminosities calculated with -based values to the measurements using more traditional methods to estimate , using targets from McJunkin et al. (2014) and France et al. (2017). We find that the two luminosities are roughly consistent for most disks, demonstrating that the trends presented later in this work are independent of the choice of . Figure 2 also presents the same comparison for Ly luminosities measured using the two different values, showing just five major outliers that have the largest changes in as well . Of these outliers, only DR Tau is included in the sample we analyze in this work, and all other targets have . We therefore conclude that the trends in Ly emission presented here are also not driven by the choice of .
2.5. Normalized UV Luminosities
Models of UV-sensitive molecular gas distributions have included a broad range of stellar blackbody temperatures, UV excesses due to accretion, and total UV luminosities, allowing the authors to isolate the impact of UV irradiation from disk geometric properties such as disk mass, flaring angle, and pressure scale height (see e.g. van Zadelhoff et al. 2003; Walsh et al. 2015; Cazzoletti et al. 2018; Bergner et al. 2019). Other observational work has split the targets by spectral type, allowing the authors to roughly correct for stellar mass and temperature (Pascucci et al., 2009). However, the sample we present here is too small to meaningfully bin the data by both disk and stellar properties. Instead, we divide the individual UV components by the total UV luminosity , defined as the sum of fluxes from the FUV continuum, Ly, UV-H2, C IV, and C II].
Since both and fluxes from the individual UV components are impacted by target properties in the same way (e.g. , ), this correction allows us to evaluate the entire sample without binning the data based on disk or stellar parameters. The normalization also reduces the impact of systematic uncertainties in measuring , as described in Section 2.4, although we note that resonant scattering effects may preferentially enhance Ly fluxes in deeper layers of the disk (see e.g. Bethell & Bergin 2011), relative to emission at other FUV and NUV wavelengths. When the data were analyzed before accounting for the diversity of disk and stellar parameters, no correlations were observed between any of the UV tracers and the 14 m HCN or sub-mm CN fluxes. We therefore conclude that normalizing the UV luminosities allows us to provide more physically meaningful information about UV-dependent gas-phase chemistry than using the raw fluxes alone. All plots also differentiate between targets with resolved dust sub-structure (open markers) and full, primordial disks (filled markers), demonstrating that the results are roughly independent of evolutionary phase.
3. Results
The HST-COS and HST-STIS spectra described above provide direct measurements of the UV radiation field, which we use to estimate the UV flux reaching the surface of the gas disk. Here we focus on the role of UV photons in producing CN, which has been detected in ALMA Band 7 observations of a large sample of disks in the Lupus clouds (van Terwisga et al., 2019), including the five studied here. We present the following results under the assumption that the dominant reaction pathway for CN production in disks is
| (2) | ||||
where H is gas that has been pumped into excited vibrational states by FUV photons (Walsh et al., 2015; Heays et al., 2017; Cazzoletti et al., 2018). HCN can then be formed via reactions with H2 and CH4
| (3) | ||||
(Baulch et al., 1994; Walsh et al., 2015; Visser et al., 2018). Destruction of HCN by UV photons also significantly influences the total abundance of CN in the disk (Walsh et al., 2015; Cazzoletti et al., 2018; Pontoppidan et al., 2019), with photodissociation occurring at a rate of s-1 under a typical interstellar radiation field and a rate of s-1 under a standard T Tauri Ly profile (van Dishoeck et al., 2006; Heays et al., 2017). Although The UMIST Database for Astrochemistry (McElroy et al., 2013) lists many other reactions for CN formation, physical-chemical models demonstrate that the H pathway is the most important route (see e.g. Visser et al. 2018). This may be attributed to the high abundance of H2 in disks, relative to molecular species like C2H and OH that are required for alternate pathways (Visser et al., 2018).
3.1. Photodissociation of N2 by the FUV Continuum
Gas-phase chemical models of protoplanetary disks find that column densities of nitrogen-dependent molecular species (e.g. CN, HCN) vary with the total FUV flux at the disk surface (Pascucci et al., 2009; Walsh et al., 2012, 2015). The trend is attributed to photoabsorption, since five excited electronic transitions of N2 fall between 912-1100 Å. Absorption at these wavelengths produces pre-dissociated N2 via coupling to the continuum (Li et al., 2013; Visser et al., 2018). As shown in Eq. 1, the atomic nitrogen products react with H to produce NH, therefore catalyzing formation of molecules like CN and HCN (Walsh et al., 2015; Cazzoletti et al., 2018).
The predicted relationship between molecular abundances and UV irradiation is corroborated by observational studies at IR wavelengths, which find that disks around cool M stars show less emission from nitrogen bearing molecules than disks around hotter solar-type stars (Pascucci et al., 2009, 2013; Najita et al., 2013). The difference is attributed to varying UV photon production rates, which are expected to be lower in cooler stars (van Zadelhoff et al., 2003; Walsh et al., 2012, 2015). To further investigate this relationship from an observational perspective, we compare CN fluxes measured from ALMA observations (van Terwisga et al., 2019) to FUV fluxes from the HST-COS and HST-STIS spectra presented here.
Although our HST data are truncated below 1000 Å, the method from France et al. (2014) was used to estimate the FUV continuum at shorter wavelengths. The extrapolation was performed on binned fluxes, which were calculated in 210 line-free regions from the longer wavelength data. The continua were fitted with a second order polynomial and extended down to 912 Å. For uniformity with the larger sample presented in France et al. (2014), we report the total integrated flux from wavelengths 1650 Å and compare these FUV continuum luminosities to both CN and HCN emission (see Figure 3).
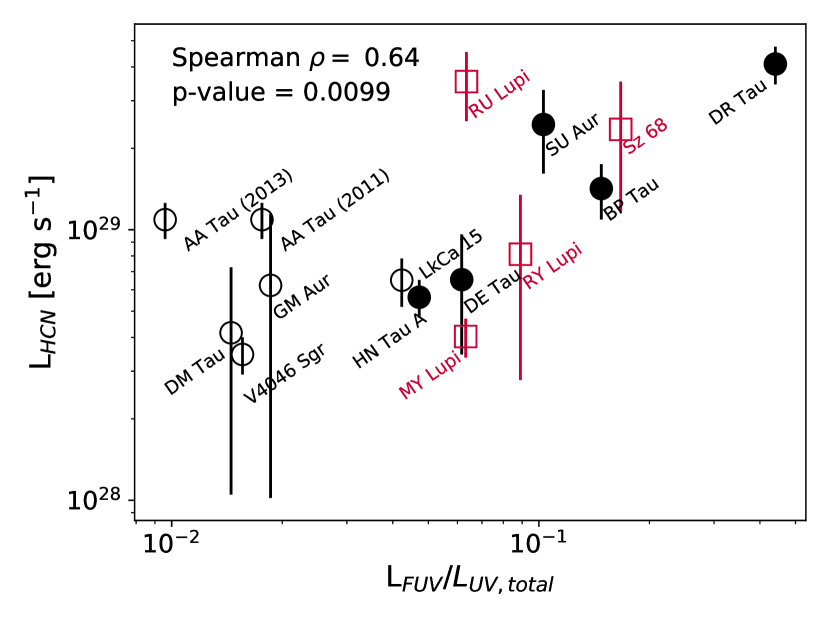
We report a significant positive correlation between the FUV and IR HCN fluxes , a trend that is consistent with model predictions. An analysis of the H-leverage values and studentized residuals for a linear regression model of the form shows that the DR Tau and AA Tau (2013) spectra are highly influential data points. When these outliers are removed from the correlation, the Spearman rank coefficient increases to , although remains at 0.01 because of the reduction in sample size. Both targets are included in Figure 3, but we note that the AA Tau (2013) spectrum in particular is impacted by an inner disk warp (Schneider et al., 2015; Hoadley et al., 2015; Loomis et al., 2017) that is attenuating the FUV flux. In contrast with both the HCN results and modeling work, we find a significant negative correlation between the FUV and sub-mm CN fluxes that points to increased photodissociation of CN in disks with strong FUV irradiation. Both DR Tau and AA Tau are once again the most influential data points.
The degeneracy between gas column densities and temperature of the emitting region makes it difficult to conclusively determine whether the observed trends are due to efficient molecule formation/destruction pathways or increased emission from warmer disks. The negative correlation between sub-mm CN emission and the FUV continuum implies that this trend at least is dominated by photodissociation, since increased UV irradiation could lead to a warmer disk and therefore an opposite relationship. However, the trend of increased IR HCN emission in systems with stronger FUV fluxes could be attributed to either scenario, with both a larger number of HCN molecules and higher temperatures leading to enhanced populations in the upper state of the 14 m transition. This result will become easier to interpret as more measurements of sub-mm HCN emission (see e.g. Öberg et al. 2010, 2011; Bergner et al. 2019) are acquired with ALMA in coming years. Despite the uncertainty in the driving force behind the HCN trend, the negative and positive correlations between the FUV continuum and CN and HCN, respectively, demonstrate that the amount of FUV flux in a given disk helps control the balance of formation and destruction pathways that determine abundances of UV-sensitive species.
3.2. Ly as a Regulator of Disk Chemistry
Ly emission is by far the strongest component of the UV radiation field, comprising roughly 75-95% of the total flux from Å in typical accreting T Tauri systems (Bergin et al., 2003; Herczeg et al., 2004; Schindhelm et al., 2012b; France et al., 2014). Its broad width in wavelength space encompasses transitions of a variety of molecules, including electronic transitions of H2 (Herczeg et al., 2002, 2004; Hoadley et al., 2017) and CO (France et al., 2011a; Schindhelm et al., 2012a) and photodissociation energies of HCN, C2H2 (Bergin et al., 2003; Walsh et al., 2015; Heays et al., 2017), and H2O (France et al., 2017). Destruction via Ly photons is not necessarily more efficient than dissociative transitions at other wavelengths, but this is mitigated by the large number of Ly photons relative to other regions of the UV spectrum. Unfortunately, the observed Ly feature is always contaminated by geocoronal emission and ISM absorption along the line-of-sight, making direct measurements difficult. Instead, we use the method from Schindhelm et al. (2012b) to reconstruct the Ly profiles for the five Lupus disks from observations of UV-fluorescent H2.
UV-H2 fluorescence is activated when a population of hot, vibrationally excited H2 ( K; Black & van Dishoeck 1987; Ádámkovics et al. 2016) is “pumped” from the ground electronic state into the first and second dipole-allowed excited electronic state by photons with energies that fall along the Ly line profile (Herczeg et al., 2002, 2004; France et al., 2011b). A cascade of UV emission lines is then observed as the molecular gas population transitions back to the ground electronic state. The features can be divided into groups called progressions, where a single progression, denoted , consists of all transitions out of the same upper electronic level with vibrational state and rotational state (Herczeg et al., 2002, 2004). We measured fluxes from the strongest emission lines in 12 progressions (see Table 2 of France et al. 2012) by integrating over models of a Gaussian profile convolved with the HST-COS line-spread function (LSF) and superimposed on a linear continuum. Upper limits on features indistinguishable from the continuum were calculated as the RMS flux within a 3 Å range across the expected line center. The total progression fluxes were then used as Ly “data” , where the value for each data point is the Ly pumping wavelength for the electronic transition. We then fit a model Ly profile to the data points.
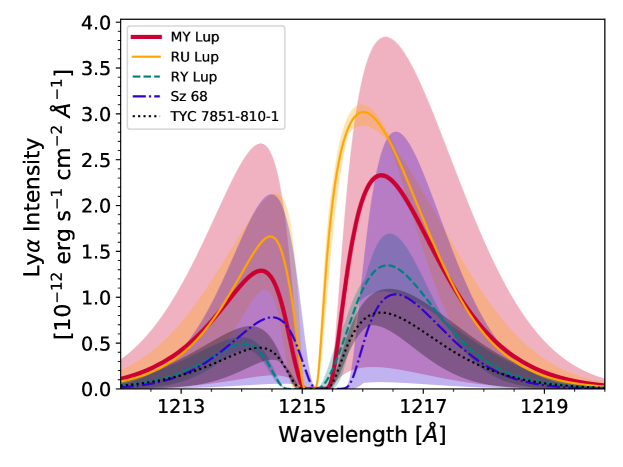
The Ly model consists of an initial “intrinsic” Gaussian emission line, an H I outflow between the star/accretion shock and the molecular gas disk, and a population of H2 that absorbs the Ly photons. We allow five model parameters to vary: the amplitude of the intrinsic profile , the velocity and column density of the outflowing H I , and the temperature and column density of the absorbing H2 . The FWHM of the intrinsic profile for each system was fixed to the average, maximum, and minimum values from Schindhelm et al. (2012b), resulting in three model profiles for each target. Posterior distributions for the model parameters were constructed using MCMC sampling (Foreman-Mackey et al., 2013) within the bounds defined by Schindhelm et al. (2012b). However, we find that the model uncertainties are better captured by the variations in the average, maximum, and minimum FWHM profiles. Figure 4 shows the median Ly profile at the disk surface for all five Lupus systems, with colored contours representing the bounds set by the three FWHM values (see Table 4).
| Target | |||||
|---|---|---|---|---|---|
| [erg s-1 cm-2 Å-1] | [km s-1] | [dex] | [K] | [dex] | |
| RU Lupi | |||||
| RY Lupi | |||||
| MY Lupi | |||||
| Sz 68 | |||||
| J1608-3070 |
We compare the total luminosities from our reconstructed Ly profiles to the the CN and HCN luminosities in Figure 5. Since CN molecules can also form as byproducts of HCN or CH3CN photodissociation (Walsh et al., 2015) via Ly photons near 1216 Å (Nuth & Glicker, 1982; Bergin et al., 2003), we expect that increased Ly irradiation of the disk surface will increase the significance of dissociative pathways in regulating both CN and HCN column densities. However, no statistically significant relationships are detected between Ly and either HCN or CN . We do note that the Spearman rank coefficients themselves are consistent with model predictions, with increased CN and decreased HCN emission observed from targets with stronger Ly emission.
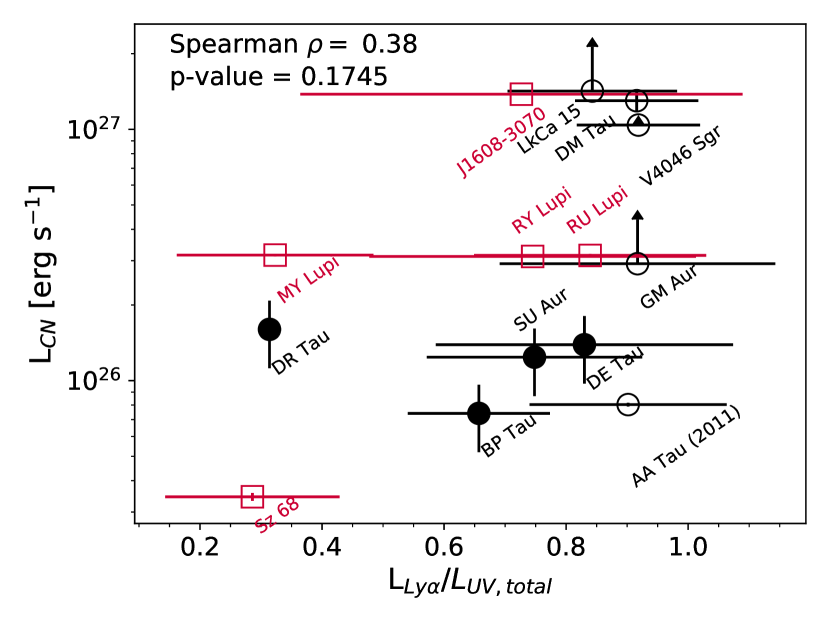
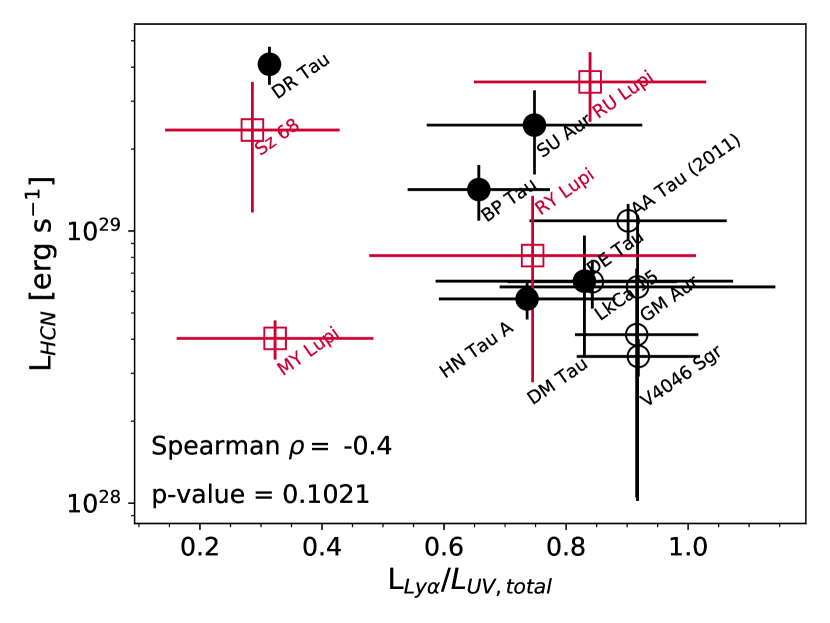
Since the Ly profiles are derived from UV-fluorescent H, the lack of correlation between CN and Ly emission may be attributed to the radial stratification of the UV-H2 and sub-mm CN. The UV-H2 emission originates from gas in surface layers of the inner disk , while the CN population extends to radii of 30-50 au in the outer disk (van Terwisga et al., 2019; Bergner et al., 2019). Similarly, vertical stratification may be responsible for the null relationship between HCN emission and Ly emission, with UV-H2 emission originating from much closer to the disk surface than the 14 m HCN features. A direct comparison between observed Ly, HCN, and CN luminosities likely requires more careful treatment of optical depth effects. Furthermore, a bootstrapping analysis of the data returns confidence intervals on the Spearman rank coefficients of [-0.71, -0.29] and [0.2, 0.67] for the HCN and CN vs. correlations. Although the upper limits of the confidence intervals are consistent with robust linear relationships, it is possible that targets with larger uncertainties on the reconstructed Ly profiles (e.g. MY Lupi, Sz 68) are masking underlying trends in the data.
We also note that the HST-COS, Spitzer-IRS, and sub-mm CN observations were not conducted simultaneously (see Tables 2, 3), implying that the reconstructed Ly profiles may not be representative of the flux reaching the disk surface at the time of the molecular gas observations. However, an HST analysis of older K and M dwarfs has demonstrated that Ly line strengths do not increase as much as other atomic features during flares (e.g. Si IV 1400; Loyd et al. 2018), perhaps indicating that Ly emission also remains steady during typical YSO variability. Although France et al. (2011) report a strong correlation between the FUV continuum and the C IV 1550 fluxes that are often used as a proxy for mass accretion rate, multiple phased observations of a single target are likely required to determine whether the FUV continuum also fluctuates with accretion rate during periods of variability. Such observations will be acquired in the next few years through the Ultraviolet Legacy Library of Young Stars as Essential Standards (ULLYSES)222http://www.stsci.edu/stsci-research/research-topics-and-programs/ullyses Director’s Discretionary program on HST.
3.3. Mapping the population of H
3.3.1 Ly-pumped H2
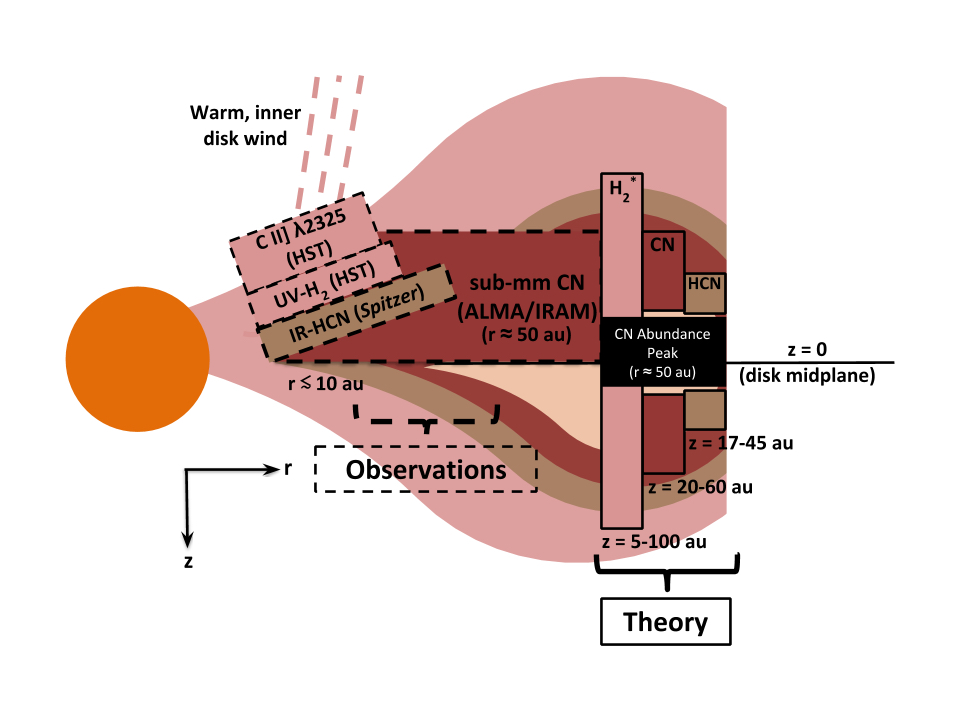
As introduced in Section 3.2, we detect a suite of emission lines from hot ( K; Ádámkovics et al. 2016), fluorescent H2 in the HST-COS spectra of all five disks. Although our HST-COS spectra are not spatially resolved, HST-STIS spectra of the same features in the disk around TW Hya show that the H2 emission must be within 2 au of the central star (Herczeg et al., 2004). The features may therefore provide constraints on the distribution of H available for CN and HCN formation in the inner disk region. Figure 6 provides a cartoon demonstrating the rough spatial locations of the emitting gas.
The UV-H2 emission lines are spectrally resolved (i.e. broader than the HST-COS resolution), allowing us to extract information about the spatial distribution of hot, fluorescent gas. Assuming that the material is in a Keplerian disk, the FWHMs of the emission lines can be mapped to an average radial location as
| (4) |
(Salyk et al., 2011a; France et al., 2012), where is the stellar mass and is the disk inclination. We average the FWHMs of the strongest emission lines from the [1,4], [1,7], [0,1], and [0,2] progressions and calculate a radius for each progression (see Table 5), finding that the bulk UV-H2 emission originates inside 2 au for all five disks. The most distant emission radii in the [1,4] and [1,7] progressions are measured for J1608-3070, which has the largest sub-mm dust cavity . This is consistent with the results of Hoadley et al. (2015), who found that disks with less advanced dust evolution typically have broad UV-H2 features that are dominated by gas located close to the star. Although resonant scattering should allow pumping photons from the Ly line wings to penetrate deeper into the disk than those from the line center (Bethell & Bergin, 2011), we find no trends between the average emitting radius calculated for each progression and the Ly pumping wavelength responsible for exciting the transitions.
| Target | ||||||||
|---|---|---|---|---|---|---|---|---|
| [km/s] | [au] | [km/s] | [au] | [km/s] | [au] | [km/s] | [au] | |
| RU Lupi | ||||||||
| RY Lupi**The FWHMs listed here for RY Lupi are from single-component fits to the emission lines. Arulanantham et al. (2018) presents a more detailed analysis of the H2 line shapes, showing that the strongest features in the [1,4] progression are better fit by a two-component model. We also adopt the disk inclination from van der Marel et al. (2018) , instead of the scattered light inclination from Manset et al. (2009) . | ||||||||
| MY Lupi | ||||||||
| Sz 68 | ||||||||
| J1608-3070 |
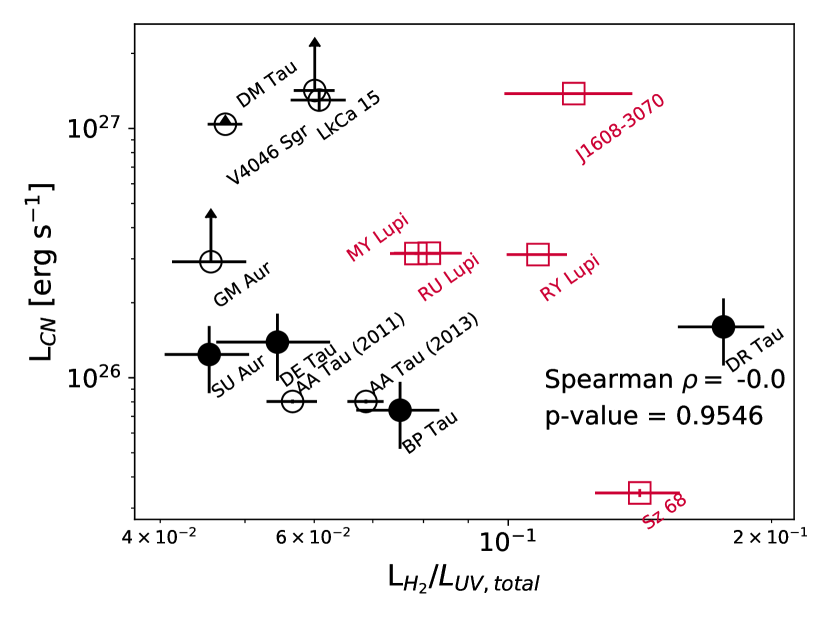
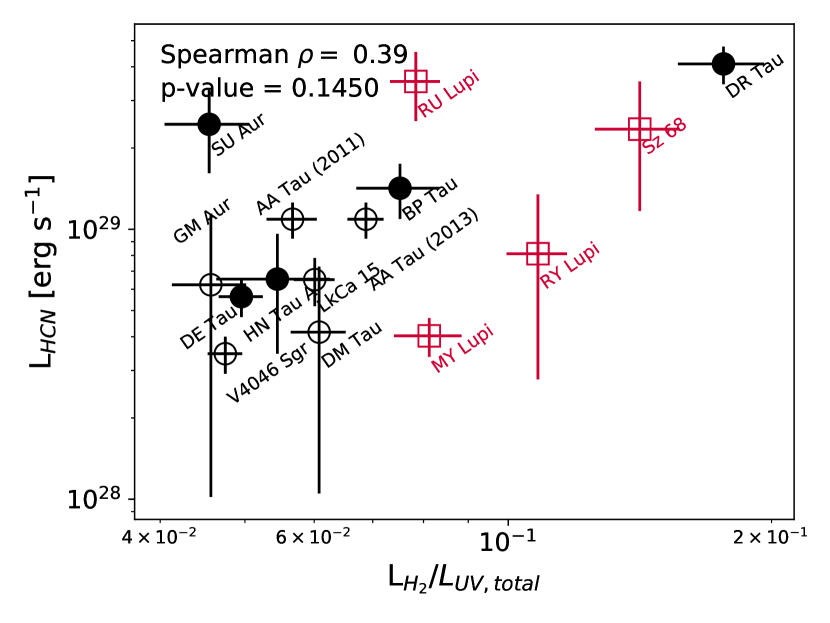
Since H is required to produce CN (see Eq. 1), the UV-H2 features are a probe of the uppermost layer of available reactants located at the average radius of emitting gas . We explore this relationship by comparing the CN and HCN luminosities to the total flux from fluorescent UV-H2 emission lines (see Figure 7), finding that neither species is correlated with the UV-H2. In the case of HCN, the scatter can be attributed to the vertical stratification effects discussed in Section 3.2, since the H and HCN abundances are expected to peak at different heights relative to the disk midplane (Cazzoletti et al., 2018). Ly photons are only able to pump H in a thin surface layer, so the UV-H2 features do not contain information from vibrationally excited gas present deeper in the disk that would be co-located with the HCN. By contrast, the sub-mm emission traces CN molecules in the cold outer disk, where the population of H declines due to extinction of pumping photons from the UV continuum (Visser et al., 2018; Cazzoletti et al., 2018). The radial distribution of UV-H2 may provide estimates of either how far Ly emission is able to travel in the disk or a rough boundary for the population of H. We explore this degeneracy further in Section 4 by using 2-D radiative transfer models to reproduce the UV-H2 emission lines.
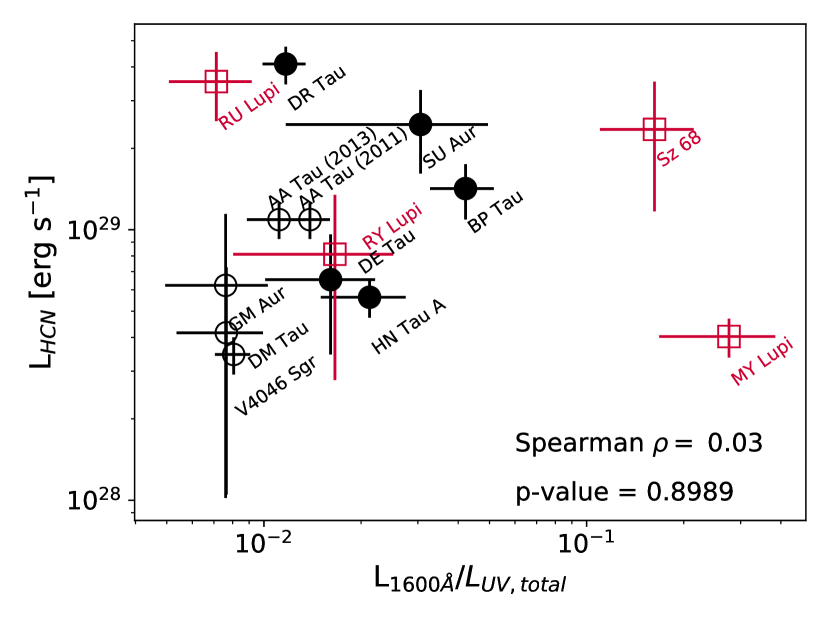
3.3.2 1600 Å “Bump” as a Signature of H2O Dissociation
Previous studies of UV continuum emission from young stars with disks have identified an excess “bump” in the spectra around 1600 Å (Herczeg et al., 2004; Bergin et al., 2004). The feature is attributed to continuum and line emission from Ly-pumped H, where the population of H is indirectly produced during H2O dissociation in the inner disk ( au; France et al. 2017). While the Ly and bump luminosities are strongly correlated , no relationship is observed between the bump and X-ray luminosities (Espaillat et al., 2019). This implies that Ly photons may play a more prominent role than the X-ray radiation field in regulating the distribution of hot H2O and vibrationally excited H2 at radii close to the central star.
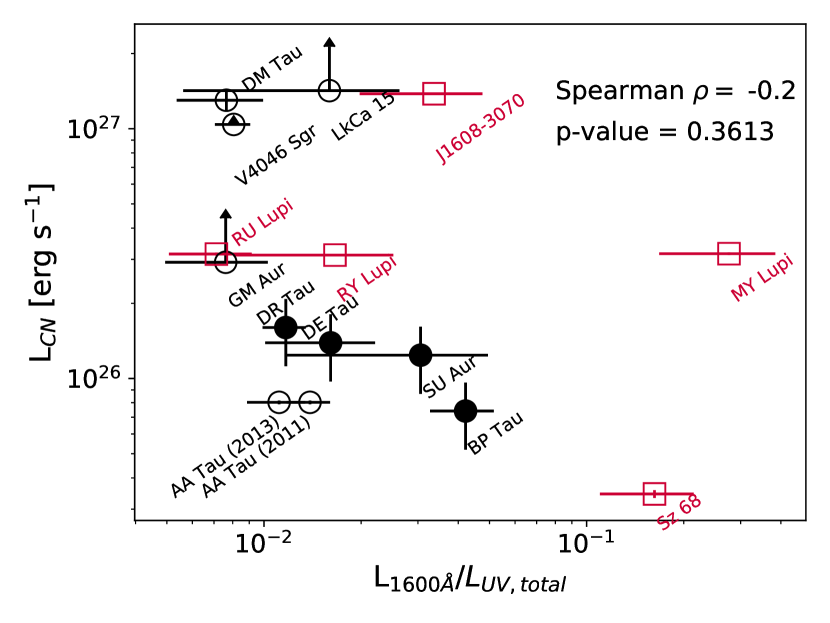
We use the method described in France et al. (2017) to measure bump fluxes and calculate luminosities for the three disks in our sample that were not included in that work. A second order polynomial fit to the FUV continuum, representative of the underlying flux, was integrated from 1490-1690 Å and subtracted from the total observed flux in the same wavelength region. The residual flux can be attributed to the bump alone (see Table 6). Figure 8 compares the CN/HCN and bump luminosities, again showing no clear linear trend between the spectral features. Similar to the Ly-pumped fluorescent gas, the H responsible for producing the bump is therefore likely located higher in the disk surface than the 14 m HCN and constrained to closer radii than the sub-mm CN.
| Target | ccFUV continuum luminosities are accurate to within a factor of 1.5-2. | ||||
|---|---|---|---|---|---|
| [1030 erg s-1] | [1029 erg s-1] | [1029 erg s-1] | [1029 erg s-1] | [1029 erg s-1] | |
| RU Lupi | aaValues from France et al. (2017). | 49.4aaValues from France et al. (2017). | |||
| RY Lupi | aaValues from France et al. (2017). | 8.3 | |||
| MY Lupi | 18bbReconstructed Ly profiles have large uncertainties, due to noisy UV-H2 emission lines. | 3.5 | |||
| Sz 68 | 5bbReconstructed Ly profiles have large uncertainties, due to noisy UV-H2 emission lines. | 3.2 | |||
| J1608-3070 | 37bbReconstructed Ly profiles have large uncertainties, due to noisy UV-H2 emission lines. | 4.4 |
3.4. C II] 2325 Emission as a Tracer of Inner Disk C+
The semi-forbidden C II] emission lines at 2325 are detected in all the Lupus and Taurus-Auriga targets with HST-STIS spectra. Models of the feature in other young systems find that its shape is consistent with an origin at the base of a warm, inner disk ( au) wind, coincident with surface layers of the disk itself (Gómez de Castro & Ferro-Fontán, 2005) and with similar formation conditions to the [O I] 6300 Å line (Simon et al., 2016). Studies of the [O I] line show that the profile is narrower in systems with dust-depleted inner disks (Simon et al., 2016; Banzatti et al., 2019), indicating that the base of the wind, and therefore all the emitting gas it contains, shifts to more distant radii within the disk. C II] therefore may also be an important observational proxy for the population of inner disk C+.
Simon et al. (2016) find that the low-velocity component of the [O I] profile is consistent with Keplerian rotation, with emitting gas originating in radially separated components located between 0.05 and 5 au. Only one target (AA Tau) in the sample presented here was observed at high enough spectral resolution and signal-to-noise to obtain kinematic information from the C II] emission, with three individual features resolved at 2325.40, 2326.93, and Å. We find that the central feature (2326.93 Å) has a similar FWHM to the broad component of the [O I] 6300 Å line (96 km s-1; Banzatti et al. 2019), which likely implies that the two emission lines have similar inner disk origins. The C II] 2325 emission is also correlated with the ionization fraction derived from carbon recombination lines (e.g. DR Tau; McClure 2019), providing further support that the two features come from a roughly co-spatial population of inner disk gas.
Ionized carbon (C+) is a key reactant in the main formation pathways of C2H (Henning et al., 2010; Walsh et al., 2015; Miotello et al., 2019) and CN (Walsh et al., 2015; Visser et al., 2018; Cazzoletti et al., 2018). C+ also plays an important role in CO2 destruction, with physical-chemical models showing an enhancement in the CO2 column density at au, where gas self-shielding allows the C+/C ratio to drop below unity (Walsh et al., 2012). We note that the FUV C II 1335 resonant feature is also included in the datasets presented here. However, its line profiles are likely dominated by the accretion pre-shock region and protostellar chromosphere and consistently show detectable wind absorption signatures (Johns-Krull & Herczeg, 2007), requiring a more complicated method to untangle the associated population of C+ that is directly involved in molecule formation and destruction than needed for the C II] 2325 feature.
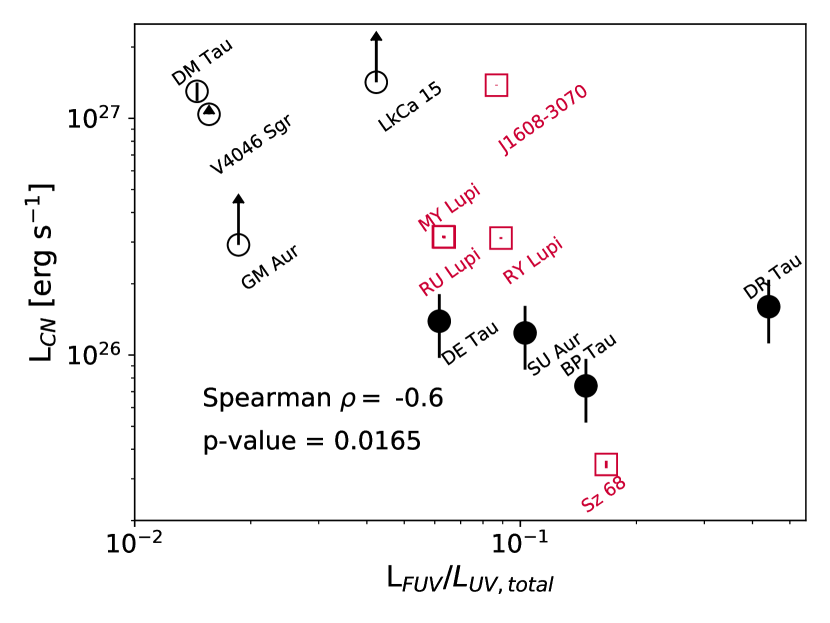
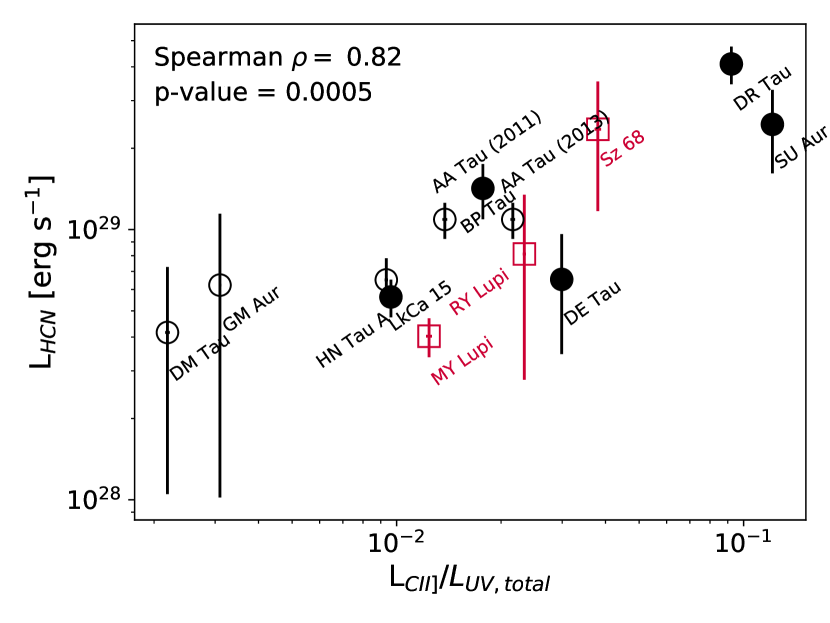
To explore whether the C II] emission is related to the CN and HCN observations, C II] line fluxes were measured for each target in our sample by integrating the dereddened HST-STIS spectra over a wavelength range spanning all three C II] features and subtracting a linear continuum (see Table 6). Figure 9 compares the CN, HCN, and C II] 2325 luminosities, showing statistically significant relationships between the relative fluxes from C II] and emission from both molecular species. We find that HCN emission is stronger in systems with higher C II] fluxes , although CN emission appears to decline as C II] fluxes increase . However, we note that the CN relationship is largely driven by GM Aur and SU Aur, which both have high H-leverage values and studentized residuals when included in a linear regression model of the form .
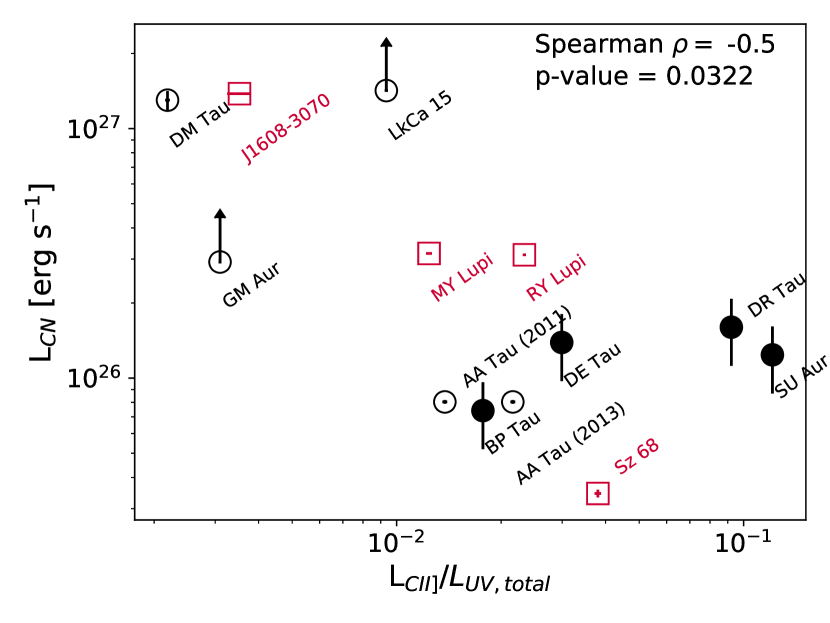
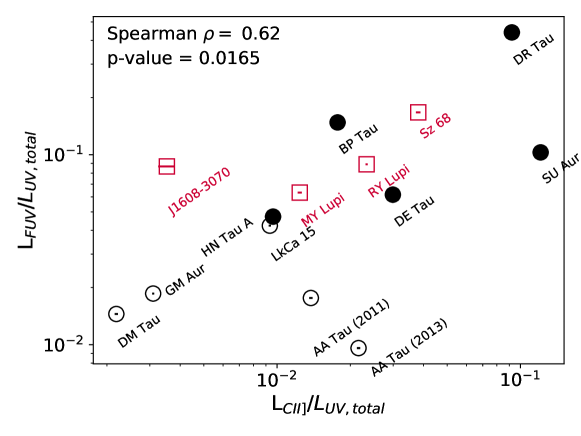
The negative correlation between fractional C II] and sub-mm CN emission points to a relationship between C II] 2325 emission and the FUV continuum (see Figure 10), implying that more CN is photodissociated in systems with stronger FUV fluxes and correspondingly larger C II] fluxes. Since the FUV continuum is strongly associated with accretion (France et al., 2014), we explore whether the population of C+ is similarly driven. Although we find that the C II] emission is not significantly correlated with the mass accretion rate , the positive relationship between C II] and the FUV continuum may still be a byproduct of accretion-related processes that are difficult to trace without contemporaneous measurements of mass accretion rates and C II] fluxes. Since only a handful of targets presented here have high-resolution HST-STIS observations of the C II] 2325 feature, a more detailed kinematic analysis of the line properties is outside the scope of this work.
4. Discussion
Physical-chemical models of disks have suggested that emission from Ly and the FUV continuum directly impact molecular gas abundances, providing photons at the energies required for gas-phase reactions to proceed. Although we find significant correlations between both 14 m HCN and sub-mm CN and the FUV continuum, neither species appears to be related to Ly emission. In order to understand this discrepancy, we examine the impact of disk geometry on the observed spectra and consider whether the optical depth of the inner disk has a significant impact on our results.
4.1. Extent of UV-H2 Emitting Region
UV-H2 features observed with HST-COS are typically much broader than the instrument resolution , implying that most of the detected flux is emitted at radii 10 au from the central star (see e.g. France et al. 2012). This is supported by HST-STIS spectra of H2 in the disk around TW Hya, which show that the UV-H2 emission lines are not spatially extended and are therefore confined to the inner disk (Herczeg et al., 2002). However, physical-chemical models suggest that both Ly and FUV photons reach large swaths of the outer disk (see e.g. Cleeves et al. 2016). The FUV photons can pump H2 into vibrationally excited states at radii where the gas temperature is too low for thermal populations of H to survive (see e.g. Cazzoletti et al. 2018). Ly photons then act as a searchlight illuminating the vibrationally excited population.
Since fluorescent emission is not detected from the outer disk (see Figure 11), the radial extent of the UV-H2 emitting region may be restricted by either:
-
1.
the extent to which Ly pumping photons can travel into the disk (Ly-limited), or
-
2.
the total abundance of H, excited thermally and via FUV-pumping (H-limited).
The negative correlation between sub-mm CN fluxes and the FUV continuum (measured both directly and via C II] 2325 emission) reported here implies that UV photons are able to reach the outer disk, perhaps enhancing the population of H in those regions. With this in mind, we focus on a simple model of the Ly-limited scenario. A more advanced full disk H distribution will be analyzed in a future paper on the H-limited scenario.
4.2. 2-D Radiative Transfer Models of UV-H2 Emission
To investigate whether our UV-H2 observations are Ly-limited, we use the 2-D radiative transfer model developed by Hoadley et al. (2015) to reproduce the distributions of fluorescent gas in 4/5 of the Lupus disks presented here. The model propagates Ly photons into a Keplerian disk with a power-law temperature gradient of coefficient , fixed temperature at a radial distance of 1 au, and a minimum K for UV-fluorescence,
| (5) |
a pressure scale height dependent on the radial temperature distribution and stellar mass ,
| (6) |
and a surface density distribution with characteristic radius , power-law coefficient , and normalization factor
| (7) |
We calculate the mass density distribution at some height above the disk midplane for the entire volume of H2 gas and the corresponding number density and optical depth of molecules in the upper level of each progression. Once the physical structure of the underlying hot H2 population has been derived, the distribution of UV-H2 flux from each transition is calculated as
| (8) |
where represents the geometric fraction of the disk exposed to Ly photons (held constant at 0.25; Herczeg et al. 2004), F∗,Lyα is the Ly flux reaching the gas, is the branching ratio that describes the likelihood of a given transition relative to all other transitions from the same upper level, and is the sightline from the observer to a gas parcel at position in the disk. The flux distribution is then summed over the entire disk, producing an emission line profile that we fit directly to the observed UV-H2 spectra. The resulting model distribution of gas informs us about where in the disk the H is exposed to Ly radiation, providing radial constraints on the uppermost layer of reactants for producing CN molecules in the inner disk.
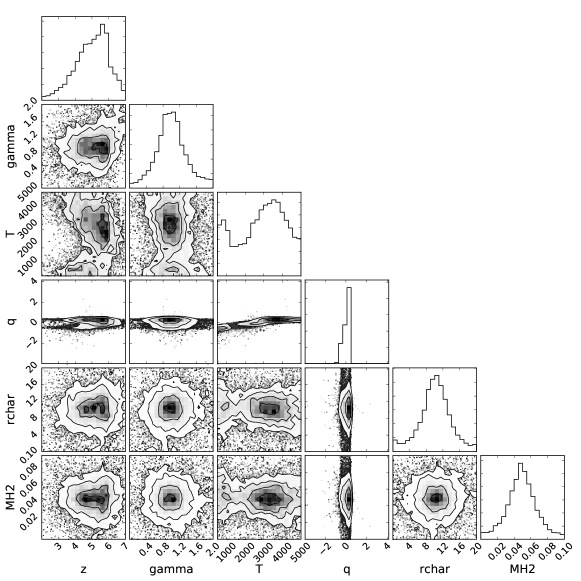
To fit these models to the observed UV-H2 features from the Lupus disks, we used the reconstructed Ly profiles shown in Figure 4 to estimate for each progression. The disk inclinations and stellar masses were fixed to values from the literature (see Table 1). The parameters , , , , , and were allowed to vary, and uncertainties on the best-fit models were estimated using MCMC re-sampling (Foreman-Mackey et al., 2013) with uniform priors spanning the grid space defined by Hoadley et al. (2015). The MCMC algorithm used 3000 walkers to explore the parameter space, finding no strong degeneracies between the six variables (see Figure A.1 for an example corner plot). The final distributions of UV-H2 flux were most sensitive to the values of and used to define the radial temperature structure defined in Equation 5.
4.3. Radial Distributions of Flux from UV-H2
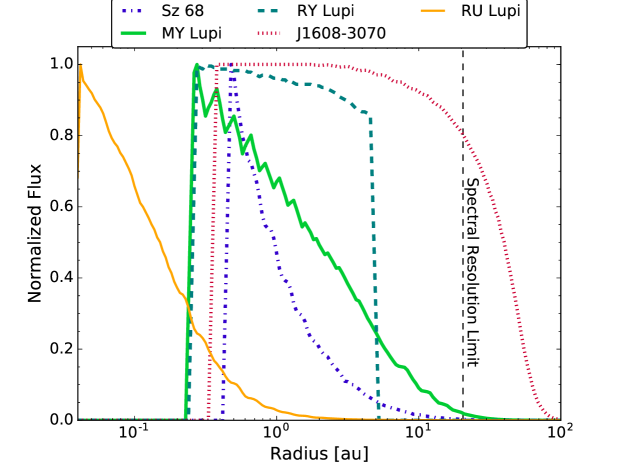
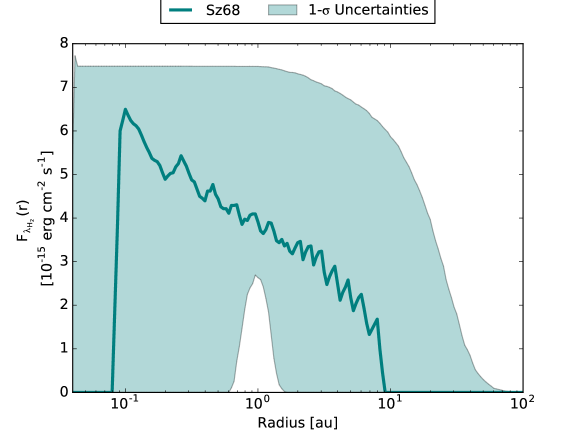
Figure 11 shows the radial distributions of UV-H2 flux that best reproduce the observed emission lines from the Lupus disks. The shapes of the gas distributions are generally correlated with the sub-mm dust distributions, in agreement with the results from Hoadley et al. (2015) that showed less UV-H2 close to the star in disks with dust gaps or cavities. Sz 68, which is a close binary (Ghez et al., 1997), shows a distribution that is sharply truncated at 10 au. This is consistent with UV-H2 emission from the primary component alone (Kurtovic et al., 2018), with Ly photons reaching the gas surface layers out to the circumprimary disk edge. MY Lupi, which has two shallow gaps at 8 and 20 au (Huang et al., 2018), shows no sign of breaks in the gas disk at those radii, although the flux distribution declines rapidly from its peak at 0.25 au. Finally, we report that the UV-H2 emission in J1608-3070 extends to more distant radii than the other systems, with a flat distribution from 0.3-10 au followed by a slow decline to the outer disk regions. This is consistent with the observed dust depletion inside of 75 au (van der Marel et al., 2018), which allows FUV photons to travel further in the disk and pump a more extended population of H2 into vibrationally excited states. However, we note that the outer radius of the UV-H2 distribution is limited by the HST-COS spectral resolution . Given the stellar mass and disk inclination of J1608-3070, this corresponds to a spatial scale maximum of 20 au.
Although the UV-H2 lines do not originate from the same region as the sub-mm CN emission, the distributions of UV-H2 flux provide constraints on either the radial extent of the population of H in surface layers of the gas disk or the location where those surface layers become optically thick to Ly photons. However, the 2-D radiative transfer models described above only include the thermal population of H and do not account for FUV-pumped gas located at more distant radii. Distinguishing between the Ly-limited and H-limited scenarios for UV-H2 emission, and subsequently identifying disk regions where H-driven CN formation pathways can proceed, will require a model that accounts for both the thermal and non-thermal gas populations. This relationship between the spatial distributions of H and CN will therefore be explored in more detail in a forthcoming paper.
5. Summary & Conclusions
We have analyzed the ultraviolet spectral properties of 19 young stars in the Lupus and Taurus-Auriga associations, using spectra from HST-COS and HST-STIS to directly measure fluxes from Ly, the FUV continuum, semi-forbidden C II] 2325, and UV-fluorescent H2. Each of these is a potential tracer of the photochemical pathways responsible for producing CN and HCN molecules in disks. To investigate the formation chemistry of these two species, we compare the UV tracers to sub-mm CN and 14 m HCN fluxes. We find that
-
1.
HCN fluxes are positively correlated with relative fluxes from the FUV continuum and C II] 2325, implying that disks with strong continuum fluxes are more readily able to produce the atomic N and C+ reactants required in the first step of the main HCN formation pathway.
-
2.
By contrast, CN fluxes are negatively correlated with relative fluxes from the FUV continuum and C II] 2325. This result indicates that while molecule formation may proceed more efficiently when more atomic N is produced, CN destruction may increase accordingly as well.
-
3.
Neither CN or HCN emission is significantly correlated with Ly emission. However, we report very tentative positive (CN) and negative (HCN) correlations that are consistent with modeling work that predicts increased photodissociation with stronger Ly irradiation.
We attribute the lack of correlations between CN and HCN emission and UV-H2 fluxes to the spatial distributions of the three molecular species: the UV-H2 is concentrated in surface layers of the inner disk, the sub-mm CN emission extends from the inner to the outer disk, and the HCN emission originates in deeper layers of the inner disk. By combining UV spectra with IR and sub-mm fluxes from UV-dependent molecular gas species, we are able to investigate model predictions of molecule formation pathways and observationally confirm that the FUV continuum plays an important role in regulating CN and HCN populations in protoplanetary disks. The analysis presented here can be extended to additional species (e.g. hydrocarbons) in the era of JWST, which will enable higher spectral resolution observations of warm molecular gas and more accurate physical-chemical models of surface reactions in planet-forming systems.
6. Acknowledgements
We are thankful to the referee for their thoughtful comments that helped strengthen the analysis presented here. NA is supported by NASA Earth and Space Science Fellowship grant 80NSSC17K0531 and HST-GO-14604 (PIs: C.F. Manara, P.C. Schneider). H.M.G. was supported by program HST-GO-15204.001, which was provided by NASA through a grant from the Space Telescope Science Institute, which is operated by the Associations of Universities for Research in Astronomy, Incorporated, under NASA contract NAS5-26 555. We are grateful to M.K. McClure and C. Walsh for helpful discussions regarding the analysis presented here. This paper makes use of the following ALMA data: ADS/JAO.ALMA#2013.1.00220.S. ALMA is a partnership of ESO (representing its member states), NSF (USA) and NINS (Japan), together with NRC (Canada), MOST and ASIAA (Taiwan), and KASI (Republic of Korea), in cooperation with the Republic of Chile. The Joint ALMA Observatory is operated by ESO, AUI/NRAO and NAOJ. This work utilized the RMACC Summit supercomputer, which is supported by the National Science Foundation (awards ACI-1532235 and ACI-1532236), the University of Colorado Boulder, and Colorado State University. The Summit supercomputer is a joint effort of the University of Colorado Boulder and Colorado State University. This research made use of Astropy,111http://www.astropy.org a community-developed core Python package for Astronomy (Astropy Collaboration et al., 2013; The Astropy Collaboration et al., 2018).
Appendix A UV-H2 Spectra and Modeling Results
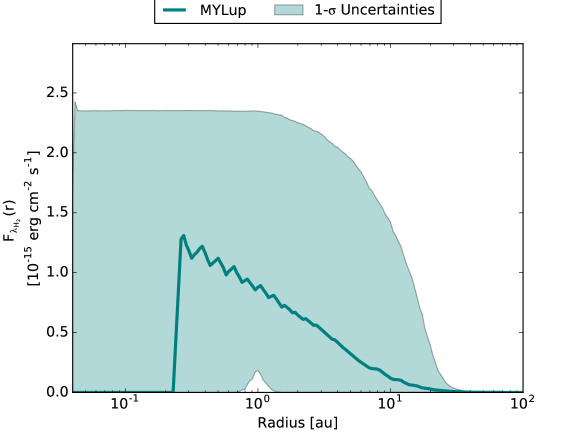
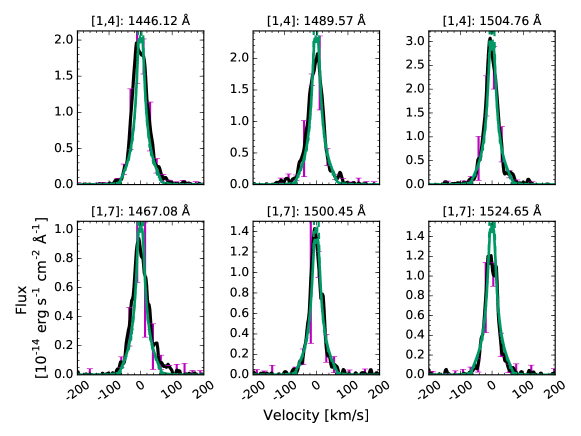
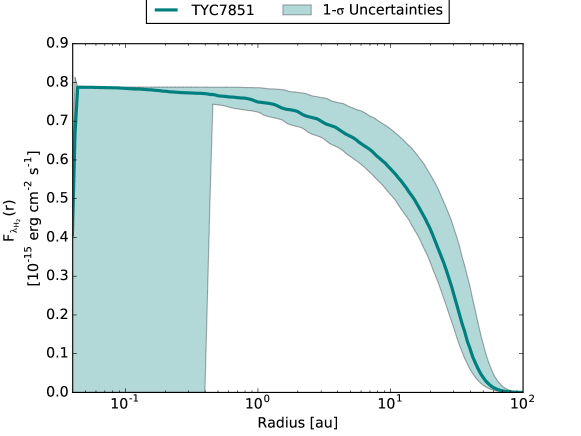
We present the nine strongest observed UV-H2 emission lines for RU Lupi, MY Lupi, Sz 68, and J1608-3070, with “best-fit” models from the 2-D radiative transfer approach described in Section 4.2 overlaid on the data. The corresponding model radial distributions of UV-H2 flux for each system, with contours representing bounds, are shown as well.
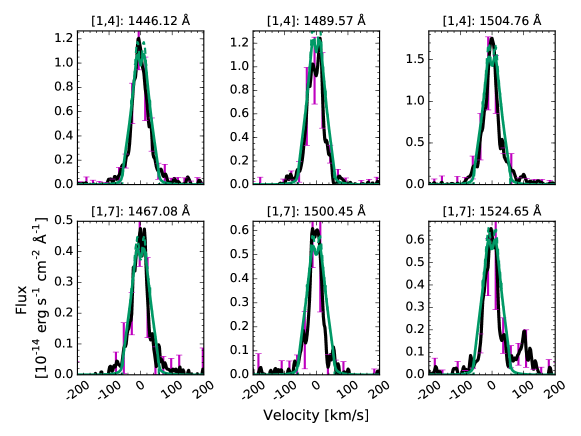
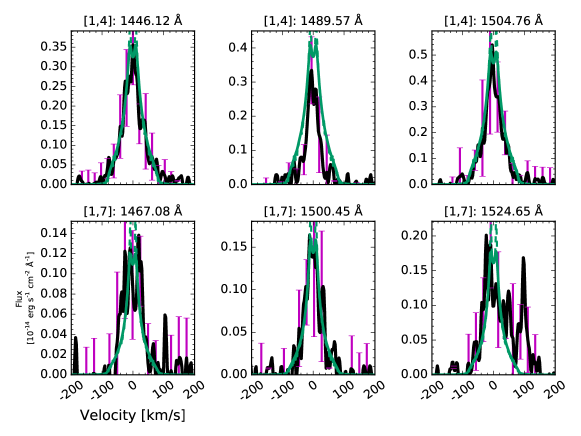
. Dashed lines show the model profile prior to convolution with the HST-COS line spread function (LSF), while the solid lines are used to show the convolved line profile.
References
- Ádámkovics et al. (2016) Ádámkovics, M., Najita, J. R., & Glassgold, A. E. 2016, ApJ, 817, 82
- Agúndez et al. (2008) Agúndez, M., Cernicharo, J., & Goicoechea, J. R. 2008, A&A, 483, 831
- Agúndez et al. (2018) Agúndez, M., Roueff, E., Le Petit, F., & Le Bourlot, J. 2018, A&A, 616, A19
- Aikawa et al. (2002) Aikawa, Y., van Zadelhoff, G. J., van Dishoeck, E. F., & Herbst, E. 2002, A&A, 386, 622
- Alcala’ et al. (2019) Alcala’, J. M., Manara, C. F., France, K., Schneider, C. P., Arulanantham, N., Miotello, A., Guenther, H. M., & Brown, A. 2019, arXiv e-prints
- Alcalá et al. (2017) Alcalá, J. M., et al. 2017, A&A, 600, A20
- Alcalá et al. (2014) —. 2014, A&A, 561, A2
- Andrews et al. (2018) Andrews, S. M., et al. 2018, ApJ, 869, L41
- Andrews et al. (2013) Andrews, S. M., Rosenfeld, K. A., Kraus, A. L., & Wilner, D. J. 2013, ApJ, 771, 129
- Ansdell et al. (2017) Ansdell, M., Williams, J. P., Manara, C. F., Miotello, A., Facchini, S., van der Marel, N., Testi, L., & van Dishoeck, E. F. 2017, AJ, 153, 240
- Ansdell et al. (2018) Ansdell, M., et al. 2018, ApJ, 859, 21
- Ansdell et al. (2016) —. 2016, ApJ, 828, 46
- Ardila et al. (2013) Ardila, D. R., et al. 2013, ApJS, 207, 1
- Arulanantham et al. (2018) Arulanantham, N., et al. 2018, ApJ, 855, 98
- Astropy Collaboration et al. (2013) Astropy Collaboration et al. 2013, A&A, 558, A33
- Bailer-Jones et al. (2018) Bailer-Jones, C. A. L., Rybizki, J., Fouesneau, M., Mantelet, G., & Andrae, R. 2018, AJ, 156, 58
- Banzatti et al. (2019) Banzatti, A., Pascucci, I., Edwards, S., Fang, M., Gorti, U., & Flock, M. 2019, ApJ, 870, 76
- Barenfeld et al. (2016) Barenfeld, S. A., Carpenter, J. M., Ricci, L., & Isella, A. 2016, ApJ, 827, 142
- Baulch et al. (1994) Baulch, D. L., et al. 1994, Journal of Physical and Chemical Reference Data, 23, 847
- Bergin et al. (2003) Bergin, E., Calvet, N., D’Alessio, P., & Herczeg, G. J. 2003, ApJ, 591, L159
- Bergin et al. (2004) Bergin, E., et al. 2004, ApJ, 614, L133
- Bergner et al. (2019) Bergner, J. B., Öberg, K. I., Bergin, E. A., Loomis, R. A., Pegues, J., & Qi, C. 2019, ApJ, 876, 25
- Bethell & Bergin (2011) Bethell, T. J., & Bergin, E. A. 2011, ApJ, 739, 78
- Black & van Dishoeck (1987) Black, J. H., & van Dishoeck, E. F. 1987, ApJ, 322, 412
- Bohlin et al. (1978) Bohlin, R. C., Savage, B. D., & Drake, J. F. 1978, ApJ, 224, 132
- Bottinelli et al. (2010) Bottinelli, S., et al. 2010, ApJ, 718, 1100
- Cazzoletti et al. (2019) Cazzoletti, P., et al. 2019, arXiv e-prints
- Cazzoletti et al. (2018) Cazzoletti, P., van Dishoeck, E. F., Visser, R., Facchini, S., & Bruderer, S. 2018, A&A, 609, A93
- Chapillon et al. (2012) Chapillon, E., Guilloteau, S., Dutrey, A., Piétu, V., & Guélin, M. 2012, A&A, 537, A60
- Cleeves et al. (2016) Cleeves, L. I., Öberg, K. I., Wilner, D. J., Huang, J., Loomis, R. A., Andrews, S. M., & Czekala, I. 2016, ApJ, 832, 110
- Cleeves et al. (2018) Cleeves, L. I., Öberg, K. I., Wilner, D. J., Huang, J., Loomis, R. A., Andrews, S. M., & Guzman, V. V. 2018, ApJ, 865, 155
- Dent et al. (2013) Dent, W. R. F., et al. 2013, PASP, 125, 477
- Espaillat et al. (2019) Espaillat, C. C., Robinson, C., Grant, S., & Reynolds, M. 2019, arXiv e-prints
- Foreman-Mackey et al. (2013) Foreman-Mackey, D., Hogg, D. W., Lang, D., & Goodman, J. 2013, PASP, 125, 306
- France et al. (2017) France, K., Roueff, E., & Abgrall, H. 2017, ApJ, 844, 169
- France et al. (2014) France, K., Schindhelm, E., Bergin, E. A., Roueff, E., & Abgrall, H. 2014, ApJ, 784, 127
- France et al. (2011a) France, K., et al. 2011a, ApJ, 734, 31
- France et al. (2012) —. 2012, ApJ, 756, 171
- France et al. (2011b) France, K., Yang, H., & Linsky, J. L. 2011b, ApJ, 729, 7
- Ghez et al. (1997) Ghez, A. M., McCarthy, D. W., Patience, J. L., & Beck, T. L. 1997, ApJ, 481, 378
- Gómez de Castro & Ferro-Fontán (2005) Gómez de Castro, A. I., & Ferro-Fontán, C. 2005, MNRAS, 362, 569
- Green et al. (2012) Green, J. C., et al. 2012, ApJ, 744, 60
- Greenwood et al. (2019) Greenwood, A. J., Kamp, I., Waters, L. B. F. M., Woitke, P., & Thi, W.-F. 2019, A&A, 626, A6
- Guilloteau et al. (2013) Guilloteau, S., Di Folco, E., Dutrey, A., Simon, M., Grosso, N., & Piétu, V. 2013, A&A, 549, A92
- Hartigan & Kenyon (2003) Hartigan, P., & Kenyon, S. J. 2003, ApJ, 583, 334
- Heays et al. (2017) Heays, A. N., Bosman, A. D., & van Dishoeck, E. F. 2017, A&A, 602, A105
- Henning et al. (2010) Henning, T., et al. 2010, ApJ, 714, 1511
- Herczeg et al. (2002) Herczeg, G. J., Linsky, J. L., Valenti, J. A., Johns-Krull, C. M., & Wood, B. E. 2002, ApJ, 572, 310
- Herczeg et al. (2005) Herczeg, G. J., et al. 2005, AJ, 129, 2777
- Herczeg et al. (2004) Herczeg, G. J., Wood, B. E., Linsky, J. L., Valenti, J. A., & Johns-Krull, C. M. 2004, ApJ, 607, 369
- Hoadley et al. (2015) Hoadley, K., France, K., Alexander, R. D., McJunkin, M., & Schneider, P. C. 2015, ApJ, 812, 41
- Hoadley et al. (2017) Hoadley, K., France, K., Arulanantham, N., Loyd, R. O. P., & Kruczek, N. 2017, ApJ, 846, 6
- Houck et al. (2004) Houck, J. R., et al. 2004, ApJS, 154, 18
- Huang et al. (2018) Huang, J., et al. 2018, ApJ, 869, L42
- Ingleby et al. (2013) Ingleby, L., et al. 2013, ApJ, 767, 112
- Johns-Krull & Herczeg (2007) Johns-Krull, C. M., & Herczeg, G. J. 2007, ApJ, 655, 345
- Kenyon & Hartmann (1995) Kenyon, S. J., & Hartmann, L. 1995, ApJS, 101, 117
- Kessler-Silacci et al. (2006) Kessler-Silacci, J., et al. 2006, ApJ, 639, 275
- Kurtovic et al. (2018) Kurtovic, N. T., et al. 2018, ApJ, 869, L44
- Lebouteiller et al. (2015) Lebouteiller, V., Barry, D. J., Goes, C., Sloan, G. C., Spoon, H. W. W., Weedman, D. W., Bernard-Salas, J., & Houck, J. R. 2015, The Astrophysical Journal Supplement Series, 218, 21
- Lebouteiller et al. (2011) Lebouteiller, V., Barry, D. J., Spoon, H. W. W., Bernard-Salas, J., Sloan, G. C., Houck, J. R., & Weedman, D. W. 2011, ApJS, 196, 8
- Li et al. (2013) Li, X., Heays, A. N., Visser, R., Ubachs, W., Lewis, B. R., Gibson, S. T., & van Dishoeck, E. F. 2013, A&A, 555, A14
- Long et al. (2019) Long, F., et al. 2019, ApJ, 882, 49
- Long et al. (2018) —. 2018, ApJ, 863, 61
- Loomis et al. (2017) Loomis, R. A., Öberg, K. I., Andrews, S. M., & MacGregor, M. A. 2017, ApJ, 840, 23
- Loyd et al. (2018) Loyd, R. O. P., et al. 2018, ApJ, 867, 71
- Madhusudhan et al. (2011) Madhusudhan, N., Mousis, O., Johnson, T. V., & Lunine, J. I. 2011, ApJ, 743, 191
- Manset et al. (2009) Manset, N., Bastien, P., Ménard, F., Bertout, C., Le van Suu, A., & Boivin, L. 2009, A&A, 499, 137
- McClure (2019) McClure, M. K. 2019, arXiv e-prints
- McElroy et al. (2013) McElroy, D., Walsh, C., Markwick, A. J., Cordiner, M. A., Smith, K., & Millar, T. J. 2013, A&A, 550, A36
- McJunkin et al. (2014) McJunkin, M., France, K., Schneider, P. C., Herczeg, G. J., Brown, A., Hillenbrand, L., Schindhelm, E., & Edwards, S. 2014, ApJ, 780, 150
- Miotello et al. (2019) Miotello, A., et al. 2019, arXiv e-prints
- Miotello et al. (2016) Miotello, A., van Dishoeck, E. F., Kama, M., & Bruderer, S. 2016, A&A, 594, A85
- Miotello et al. (2017) Miotello, A., et al. 2017, A&A, 599, A113
- Najita et al. (2013) Najita, J. R., Carr, J. S., Pontoppidan, K. M., Salyk, C., van Dishoeck, E. F., & Blake, G. A. 2013, ApJ, 766, 134
- Nuth & Glicker (1982) Nuth, J. A., & Glicker, S. 1982, J. Quant. Spec. Radiat. Transf., 28, 223
- Öberg et al. (2008) Öberg, K. I., Boogert, A. C. A., Pontoppidan, K. M., Blake, G. A., Evans, N. J., Lahuis, F., & van Dishoeck, E. F. 2008, ApJ, 678, 1032
- Öberg et al. (2010) Öberg, K. I., et al. 2010, ApJ, 720, 480
- Öberg et al. (2011) —. 2011, ApJ, 734, 98
- Pascucci et al. (2009) Pascucci, I., Apai, D., Luhman, K., Henning, T., Bouwman, J., Meyer, M. R., Lahuis, F., & Natta, A. 2009, ApJ, 696, 143
- Pascucci et al. (2013) Pascucci, I., Herczeg, G., Carr, J. S., & Bruderer, S. 2013, ApJ, 779, 178
- Pascucci et al. (2016) Pascucci, I., et al. 2016, ApJ, 831, 125
- Pontoppidan et al. (2019) Pontoppidan, K. M., Salyk, C., Banzatti, A., Blake, G. A., Walsh, C., Lacy, J. H., & Richter, M. J. 2019, ApJ, 874, 92
- Pontoppidan et al. (2010) Pontoppidan, K. M., Salyk, C., Blake, G. A., Meijerink, R., Carr, J. S., & Najita, J. 2010, ApJ, 720, 887
- Salyk et al. (2011a) Salyk, C., Blake, G. A., Boogert, A. C. A., & Brown, J. M. 2011a, ApJ, 743, 112
- Salyk et al. (2011b) Salyk, C., Pontoppidan, K. M., Blake, G. A., Najita, J. R., & Carr, J. S. 2011b, ApJ, 731, 130
- Schindhelm et al. (2012a) Schindhelm, E., France, K., Burgh, E. B., Herczeg, G. J., Green, J. C., Brown, A., Brown, J. M., & Valenti, J. A. 2012a, ApJ, 746, 97
- Schindhelm et al. (2012b) Schindhelm, E., et al. 2012b, ApJ, 756, L23
- Schneider et al. (2015) Schneider, P. C., France, K., Günther, H. M., Herczeg, G., Robrade, J., Bouvier, J., McJunkin, M., & Schmitt, J. H. M. M. 2015, A&A, 584, A51
- Schwarz et al. (2018) Schwarz, K. R., Bergin, E. A., Cleeves, L. I., Zhang, K., Öberg, K. I., Blake, G. A., & Anderson, D. 2018, ApJ, 856, 85
- Simon et al. (2016) Simon, M. N., Pascucci, I., Edwards, S., Feng, W., Gorti, U., Hollenbach, D., Rigliaco, E., & Keane, J. T. 2016, ApJ, 831, 169
- Skrutskie et al. (1990) Skrutskie, M. F., Dutkevitch, D., Strom, S. E., Edwards, S., Strom, K. M., & Shure, M. A. 1990, AJ, 99, 1187
- Strom et al. (1989) Strom, K. M., Strom, S. E., Edwards, S., Cabrit, S., & Skrutskie, M. F. 1989, AJ, 97, 1451
- Tazzari et al. (2017) Tazzari, M., et al. 2017, A&A, 606, A88
- Teske et al. (2011) Teske, J. K., Najita, J. R., Carr, J. S., Pascucci, I., Apai, D., & Henning, T. 2011, ApJ, 734, 27
- The Astropy Collaboration et al. (2018) The Astropy Collaboration et al. 2018, ArXiv e-prints
- van der Marel et al. (2018) van der Marel, N., et al. 2018, ApJ, 854, 177
- van Dishoeck et al. (2006) van Dishoeck, E. F., Jonkheid, B., & van Hemert, M. C. 2006, Faraday Discussions, 133, 231
- van Terwisga et al. (2019) van Terwisga, S. E., et al. 2019, A&A, 623, A150
- van Zadelhoff et al. (2003) van Zadelhoff, G. J., Aikawa, Y., Hogerheijde, M. R., & van Dishoeck, E. F. 2003, in SFChem 2002: Chemistry as a Diagnostic of Star Formation, ed. C. L. Curry & M. Fich, 440
- Visser et al. (2018) Visser, R., Bruderer, S., Cazzoletti, P., Facchini, S., Heays, A. N., & van Dishoeck, E. F. 2018, A&A, 615, A75
- Walsh et al. (2012) Walsh, C., Nomura, H., Millar, T. J., & Aikawa, Y. 2012, ApJ, 747, 114
- Walsh et al. (2015) Walsh, C., Nomura, H., & van Dishoeck, E. 2015, A&A, 582, A88
- Williams et al. (2019) Williams, J. P., Cieza, L., Hales, A., Ansdell, M., Ruiz-Rodriguez, D., Casassus, S., Perez, S., & Zurlo, A. 2019, ApJ, 875, L9
- Woodgate et al. (1997a) Woodgate, B., et al. 1997a, in Bulletin of the American Astronomical Society, Vol. 29, American Astronomical Society Meeting Abstracts #190, 836
- Woodgate et al. (1997b) Woodgate, B. E., et al. 1997b, in Proc. SPIE, Vol. 3118, Imaging Spectrometry III, ed. M. R. Descour & S. S. Shen, 2–12
- Yang et al. (2012) Yang, H., et al. 2012, ApJ, 744, 121