Single DNA Electron Spin Resonance Spectroscopy in Aqueous Solutions
Magnetic resonance spectroscopy of single biomolecules under near-physiological conditions may substantially advance understanding of biological function, yet remains very challenging. Here we use nitrogen-vacancy centers in diamonds to detect electron spin resonance spectra of individual, tethered DNA duplexes labeled with a nitroxide spin label in aqueous buffer solutions at ambient temperatures. This paves the way for magnetic resonance studies on single biomolecules and their inter-molecular interactions in a native-like environment.
Given the enormous power of magnetic resonance spectroscopy, including Nuclear Magnetic Resonance (NMR) and Electron Spin Resonance (ESR), in interrogating molecular structure and dynamics, intensive efforts are being devoted to developments of single spin magnetic resonance spectroscopy, and rapid progresses are being made Wrachtrup2016JMR . The use of nitrogen-vacancy (NV) centers in diamonds is one of the most promising venues for single spin detection Wrachtrup2008Nature ; Lukin2008Nature ; Degen2017RMP , for example, we have previously reported single-molecule ESR spectroscopy of proteins labeled with a nitroxide spin label and embedded in a poly-lysine layer at diamond surfaces Du2015Science . However, in all prior NV work, the target is either embedded within the diamond lattice Shi2013PRB ; Yacoby2013NatPhys ; Yacoby2014nnano or fixed at the diamond surface Wrachtrup2011NJP ; Lukin2014NanoLett ; Du2015Science . A majority of biomolecules function in aqueous solutions under ambient temperatures (i.e., physiological conditions), at which the molecules undergo a high degree of motions. NV-detection of single molecules at physiological conditions posts significant additional challenges as compared to studies at a stationary solid phase, and has not yet been reported.
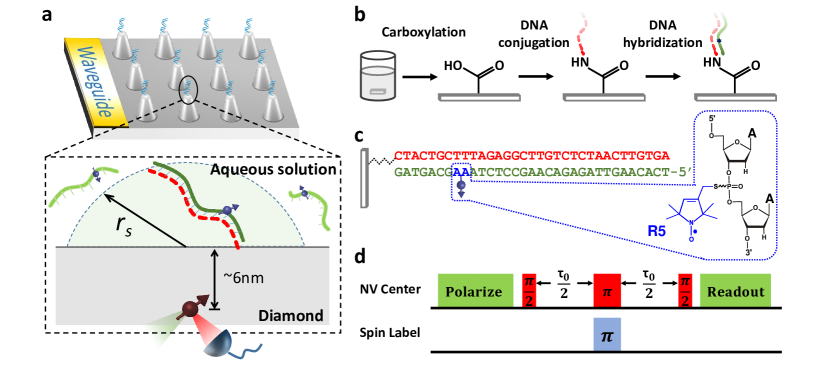
We reported here two technical advancements to enable ESR measurements of single spin-labeled DNAs at physiological conditions. We implemented a diamond pillar array design (Fig. 1a, Supplementary Note 1 and Online Methods), which reduces the detection time by nearly one order. This enabled one to record multiple ESR spectra before the labels are quenched due to laser irradiation Wrachtrup2017SciAdv . Furthermore, to confine a spin-labeled DNA duplex within the 10 nm detection range from a shallowly embedded NV, a chemical tethering scheme was devised Lukin2016Science , in which a non-labeled DNA was covalently attached to the diamond surface, then hybridized with a complementary strand with a spectroscopic label (Fig. 1b and Online Methods). Atomic Force Microscopy imaging indicated that the tethered DNA forms an evenly distributed single layer at the diamond surface (Supplementary Note 2A). Characterizations using a Cy3-labeled DNA complementary strand and fluorescence confocal microscopy demonstrated that DNA duplex localization depends on the presence of the covalently attached non-labeled strand. Under experimental conditions used in this work, spacing between the DNA duplexes was estimated to be 21 nm (Supplementary Note 2B). This resulted in a 14% probability of a single DNA duplex located within the detection range of an NV sensor, while the probability of detecting two or more DNA duplexes was 1% (Supplementary Note 3B). As such, the signal detected from a single NV center was predominately from a single DNA duplex.
Using the tethering scheme, DNA duplexes with a covalently attached nitroxide spin label (designed as R5 Tangprasertchai2015 , see Fig. 1c) were localized at the diamond pillar surface (Fig. 1b,c), and ESR spectrum was detected by a double electron-electron resonance pulse sequence Du2015Science (Fig. 1d, Supplementary Note 3A). Fig. 2a shows an example of an NV-detected spectrum of a 14N R5-labeled DNA obtained with an external magnetic field G, which shows three peaks. The isotropic hyperfine coupling, measured between the two side peaks, was MHz, similar to that obtained from an ensemble measurement (Fig. 2b and Supplementary Note 4) (see further discussion of below). Note that while both the NV-detected spectrum (Fig. 2a top) and the ensemble spectrum (Fig. 2b) show a three-line pattern expected due to hyperfine interactions between the electron spin () and the 14N nucleic spin (), the center peak of the NV-detected spectrum (gyromagnetic ratio of MHz/G or g-factors = ) is likely composed of signals from both the 14N nitroxide and paramagnetic diamond surface defects Yacoby2014nnano , which have similar g-factors and therefore are not separable in the measurements (see also Supplementary Note 3C-3E). Consistent with this interpretation, the two side-peaks disappeared upon prolong laser irradiation that has been reported to quench the nitroxide (Fig. 2a, bottom) Wrachtrup2017SciAdv . Furthermore, for diamond surfaces not exposed to spin-labeled DNAs, the NV-detected spectra showed only one peak without splitting (Supplementary Note 3D). Together, observations of the side-peaks in the NV-detected spectra indicated that for the first time, single spin-labeled DNA molecules were detected by magnetic resonance in solutions at ambient temperatures.
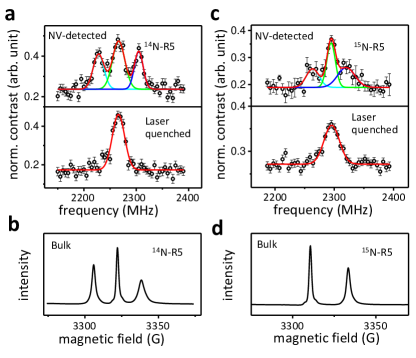
To further verify detection of nitroxide-labeled DNAs, the 14N R5 label was substituted to a 15N R5, which is expected to change the hyperfine coupling (Supplementary Note 4). Indeed, prior to nitroxide decomposition, the NV-detected spectrum showed two side peaks (Fig. 2c, top) that gave an MHz. This ratio of is consistent with that of the gyromagnetic ratio , thus confirming NV detection of spin-labeled DNA. Note that while the 15N R5 labeled DNA showed the expected two-line pattern in the ensemble measurements (Fig. 2d and Supplementary Note 4), the NV-detected early time point spectrum shows three peaks (Fig. 2c, top). The center peak was assigned to the paramagnetic diamond surface defects, which is persistent upon prolong laser radiation (Fig. 2c, bottom). Overall, the 14N and 15N data unambiguously demonstrate detection of an external nitroxide labeled DNA.
Analyses of NV-detected spectra led to a number of interesting observations. First, the values varied by 12%, reflecting heterogeneity among the individual molecules in the solution (Supplementary Note 3C). All values measured from NV-detected spectra were smaller () than that measured in the bulk solution (Supplementary Note 3C). It is known that a more hydrophobic environment, such as that at the diamond surface, reduces hyperfine couplings Kurad2003 . the variations may reflect heterogeneity of the polarity profile at the individual DNA duplexes, although many other factors (e.g., spin label dynamics, local electrostatics) cannot be completely ruled out (see also Supplementary Note 5A). A second observation is that the NV-detected DNA spectrum showed sharp side-peaks with very small lineshape variations (Fig. 2 and Supplementary Fig. 6). This differs from those measured from proteins fixed in the poly-lysine layer Du2015Science , and reflects the high degree of motions expected from a DNA in solutions (Supplementary Note 5A). Analyses showed that the side-peaks of the NV-detected spectrum were best matched with simulations in which the label undergoes an isotropic rotation with a rotational correlation time of 1.0 ns (Supplementary Note 5B), which is comparable to that reported in bulk solution measurements of R5-labeled DNAs tethered to nano-diamonds DNA_nanodiamond . Overall, these analyses indicate that analyzing the NV-detected single molecule spectrum provides information on the local environment and motional dynamics of the biomolecule. However, a lot more work, including significant increases in the number of spectrum observed, is required in order to retrieve functional information regarding the target biomolecule.
In conclusion, we developed NV-based methods that enabled ESR spectroscopic analyses of single spin-labeled DNA molecules in aqueous solutions at ambient temperatures. As demonstrated by developments of single-molecule methodologies in other fields such as fluorescent spectroscopy zhuang2000single and force microscopy AFM , the ability to conduct single molecule measurements in solutions opens up a large number of possibilities for investigating structure, dynamics, and interaction of biomolecules in their native environment. The work reported represents a significant step forward towards single-molecule magnetic resonance investigation of biomolecular structure and function.
I Methods
Methods, including statements of data availability and any associated accession codes and references, are available in the online version of the paper.
Note: Any Supplementary Information and Source Data files are available in the online version of the paper.
II Acknowledgements
This work was supported in part by the National Key R&D Program of China (Grants No. 2016YFA0502400, 2013CB921800), the National Natural Science Foundation of China (Grants No. 81788104, 11227901, 31470835, 91636217, 11722544; PZQ: 21328101), CAS (Grants No. XDB01030400, QYZDY-SSW-SLH004, YIPA2015370), the CEBioM, the Fundamental Research Funds for the Central Universities (WK2340000064, WK2030040088), and the US National Science Foundation (PZQ: CHE-1213673, MCB-1716744).
III Author contributions
J.D. supervised the entire project. J.D., F.S. and P.Z.Q. designed the experiments. F.K., P.Z., and F.S. performed the experiments. X.Z. and P.Z.Q. prepared the DNA duplex. X.Z. M.C. X.R. J.S. and P.Z.Q. and measured the ensemble data. P.Z., M.C., Z.W., S.C., and P.Z.Q. carried the chemical bonding process. M.W., X.Y., and P.W. fabricated the pillar and measured the imaging by AFM. Q.Z. tested the coherence of NVs. F.K. and Z.Q. performed the calculation. F.S., F.K., P.Z., P.Z.Q., and J.D. wrote the manuscript. All authors discussed the results and commented on the manuscript.
IV Additional information
Correspondence and requests for materials should be addressed to J.D. and P.Z.Q.
V Competing financial interests
The authors declare no competing financial interests.
Reference
- (1) Wrachtrup, J. & Finkler, A. J. Magn. Reson. 269, 225–236 (2016).
- (2) Balasubramanian, G. et al. Nature 455, 648–651 (2008).
- (3) Maze, J. R. et al. Nature 455, 644–647 (2008).
- (4) Degen, C. L., Reinhard, F. & Cappellaro, P. Rev. Mod. Phys. 89, 035002 (2017).
- (5) Shi, F. et al. Science 347, 1135–1138 (2015).
- (6) Shi, F. et al. Phys. Rev. B 87, 195414 (2013).
- (7) Grinolds, M. S. et al. Nat. Phys. 9, 215–219 (2013).
- (8) Grinolds, M. S. et al. Nat. Nanotechnol. 9, 279 (2014).
- (9) Grotz, B. et al. New J. Phys. 13, 055004 (2011).
- (10) Sushkov, A. O. et al. Nano Lett. 14, 6443–6448 (2014).
- (11) Schlipf, L. et al. Sci. Adv. 3, e1701116 (2017).
- (12) Lovchinsky, I. et al. Science 351, 836–841 (2016).
- (13) Tangprasertchai, N. S. et al. Method Enzymol. 564, 427 – 453 (2015).
- (14) Kurad, D., Jeschke, G. & Marsh, D. Biophys. J. 85, 1025–1033 (2003).
- (15) Akiel, R. D. et al. J. Phys. Chem. B 120, 4003–4008 (2016).
- (16) Zhuang, X. et al. Science 288, 2048–2051 (2000).
- (17) Rugar, D., Budakian, R., Mamin, H. J. & Chui, B. W. Nature 430, 329–332 (2004).
- (18) Hausmann, B. J. M. et al. New J. Phys. 13, 045004 (2011).
- (19) Qin, P. Z. et al. Nat. Protoc. 2, 2354 (2007).
- (20) Zhang, X., Cekan, P., Sigurdsson, S. T. & Qin, P. Z. Method Enzymol. 469, 303 – 328 (2009).
VI ONLINE METHODS
Diamond Sensors. All diamonds used were obtained commercially, 100-oriented, and electronic-grade. NV centers were created by implantation of 4 keV 15N ions with a dose of . The diamond nanopillars were fabricated by electron beam lithography (EBL) and reactive ion etching (RIE) to enhance the photon collection efficiency Hausmann2011 . First the negative electron-beam resisting hydrogen silsesquioxane (HSQ) was spun on the diamond to a thickness of 350 nm. The HSQ layer was patterned by electron-beam writing followed by tetra-methyl ammonium hydroxide (TMAH, 4%) developing. The nanopillars were then formed after reactive ion etching with mixed CHF3 and O2, with the etching depth at 400 nm. Finally hydrofluoric acid was used to remove the HSQ resisting layer.
DNA samples. All DNAs were produced by solid-phase chemical synthesis and obtained commercially. The DNA strand for covalent attachment to diamond surface (i.e., NH2-DNA) has a sequence of 5’ NH2-CTACTGCTTTAGAGGCTTGTCTCTAACTTGTGA-3’, with "NH2" representing an Amino Modifier C6 at the 5’ terminus. The complementary DNA strand (designated as s1) has a sequence of 5’-TCACAAGTTAGAGACAAGCCTCTAAAGCAGTAG-3’. The 5’ Cy3-modified s1 strand (Cy3-s1) was obtained commercially. The R5 spin-label [1-oxyl-2,2,5,5-tetramethyl-pyrroline] (Fig. 1c) was attached to phosphorothioate-modified s1 strands following previously reported protocols and purified by HPLC Qin2007 ; Tangprasertchai2015 . The labeling efficiency of the DNA was estimated to be by a spin counting procedure Zhang2009 .
Covalent attachment of DNA at the diamond surface. Prior to DNA attachment, the diamond surface was cleaned in four steps: (a) submerging in Piranha solution (2:1 mixture of concentrated H2SO4 and 30% hydrogen peroxide) at C for at least 4 hours; (b) submerging in concentrated HNO3 at C for one hour; (c) submerging in 1M NaOH at C for one hour; and (d) submerging in 1M HCl at C for one hour. Following each step, the diamond was rinsed with deionized water.
Following surface cleaning, a freshly prepared solution containing 10 M NH2-DNA, 5 mM EDC [1-ethyl-3-(-3-dimethylaminopropyl) carbodiimide hydrochloride, Sigma-Aldrich (39391-50ML)] in 100 mM MES (pH 5.0) was applied to the diamond surface. Reaction was allowed to proceed at room temperature for 30 minutes, after which the diamond surface was rinsed with deionized water. This procedure was repeated for 3 times to maximize the amount of DNA tethered at the diamond surface.
To hybridize the complementary strand to the tethered DNA strand, a 2 M Cy3 or R5-labeled s1 strand solution was prepared in 100 mM NaCl buffer. 2 L of this solution was added to the diamond surface. After allowing the reaction to proceed in the dark for 10 hours at room temperature, the diamond surface was rinsed with Phosphate Buffered Saline (PBS) for at least 3 times before either ESR, fluorescent, or Atomic Force Microscopy measurement.
NV center-based ESR spectroscopy. The measurements were carried out on a home-built system following previously reported procedures Du2015Science . Briefly, a 532 nm green laser was used to illuminate the NV centers for initialization and readout. The external magnetic field was set at G. The microwave (MW) and Radio frequency (RF) irradiations were generated by an arbitrary waveform generator (Agilent M8190a), amplified (Mini-circuits ZHL-20W-13+ for MW, ZHL-16W-43+ for RF) and delivered by a coplanar waveguide fabricated on a glass substrate. Double electron-electron resonance pulse sequences were used to detect the weak signal from the spin labels (Fig. 1d). The MW pulses, which manipulate the NV-center for detection, was set at approximately 0.6 GHz. The RF pulse, which manipulates the spin label, was scanned between GHz. The pulses width of the MW and RF pulses was approximately 11 ns and 50 ns respectively, corresponding to Rabi frequencies around 45 MHz and 10 MHz, respectively. The phase accumulating duration between the MW pulses was 4 us (see Supplementary Note 3A for more details). The detected spectral signals were normalized by the amplitude of Rabi oscillations.
Data availability. Data supporting the findings of this study are available within the article and its Supplementary Information file, and from the corresponding authors upon reasonable request.