Linking the formation and fate of exo-Kuiper belts within solar system analogues
Abstract
Escalating observations of exo-minor planets and their destroyed remnants both passing through the solar system and within white dwarf planetary systems motivate an understanding of the orbital history and fate of exo-Kuiper belts and planetesimal discs. Here we explore how the structure of a au annulus of planetesimals orbiting inside of a solar system analogue that is itself initially embedded within a stellar cluster environment varies as the star evolves through all of its stellar phases. We attempt this computationally challenging link in four parts: (1) by performing stellar cluster simulations lasting 100 Myr, (2) by making assumptions about the subsequent quiescent 11 Gyr main-sequence evolution, (3) by performing simulations throughout the giant branch phases of evolution, and (4) by making assumptions about the belt’s evolution during the white dwarf phase. Throughout these stages, we estimate the planetesimals’ gravitational responses to analogues of the four solar system giant planets, as well as to collisional grinding, Galactic tides, stellar flybys, and stellar radiation. We find that the imprint of stellar cluster dynamics on the architecture of km-sized exo-Kuiper belt planetesimals is retained throughout all phases of stellar evolution unless violent gravitational instabilities are triggered either (1) amongst the giant planets, or (2) due to a close ( au) stellar flyby. In the absence of these instabilities, these minor planets simply double their semimajor axis while retaining their primordial post-cluster eccentricity and inclination distributions, with implications for the free-floating planetesimal population and metal-polluted white dwarfs.
keywords:
Kuiper belt: general – minor planets, asteroids: general – planets and satellites: dynamical evolution and stability – stars: formation – stars: evolution – white dwarfs.1 Introduction
The Kuiper Belt and scattered disc refer to the collection of minor planets which orbit the Sun at separations between tens and hundreds of astronomical units. These objects provide crucial constraints on the temporal evolution of the solar system. With respect to formation, the New Horizons mission has revolutionised our understanding of Pluto’s geophysical history (Stern et al., 2015; Moore et al., 2016) as well as the formation pathway of the “squashed snowman” binary object 486958 Arrokoth (2014 MU69 Ultima Thule) (Nesvorný et al., 2019; Stern et al., 2019). Alternatively, with respect to the fate of Kuiper Belt and scattered disc objects, we must look towards the interstellar interlopers or sōlus lapis 1I/‘Oumuamua (Meech et al., 2017; Williams, 2017) and 2I/Borisov (Guzik et al., 2019) or elsewhere, in evolved extrasolar planetary systems (Portegies Zwart et al., 2018).
Besides the Sun, the only other stars around which the presence of individual minor planets have been observed or inferred are young hot stars – where variable absorption is inferred to come from gas (Ferlet et al., 1987; Welsh & Montgomery, 2015) and possibly dust (Rappaport et al., 2018) released by individual comets – and white dwarfs (Vanderburg et al., 2015; Manser et al., 2019; Vanderbosch et al., 2019), which represent the endpoint of stellar evolution for nearly all Milky Way stars. The destroyed remnants of other minor planets are observed through the presence of over 40 debris discs around white dwarfs (e.g. Zuckerman & Becklin, 1987; Graham et al., 1990; Gänsicke et al., 2006; Farihi, 2016; Dennihy et al., 2018; Swan et al., 2019a) and the constituents of over 1000 minor planets are observed inside the atmospheres of white dwarfs (Zuckerman et al., 2003, 2010; Koester et al., 2014; Coutu et al., 2019). This minor planet destruction provides a unique means to probe the bulk composition of asteroids and comets beyond our Solar System.
Consequently, linking the formation and fate of minor planets has importance in multiple astrophysical contexts. However, the computationally challenging nature of this task has motivated investigations which focus on a single or a few phases of stellar evolution. For example, the dynamical origin of the currently observed Kuiper Belt architecture has been the subject of numerous investigations (e.g., Gomes et al., 2008; Liou & Kaufmann, 2008; Punzo, Capuzzo-Dolcetta & Portegies Zwart,, 2014; Nesvorný, 2018) that are almost entirely restricted to the early main-sequence phase of the Sun, or have considered just the post-formation evolution (e.g., Tiscareno & Malhotra, 2009; Lawler et al., 2017; Shannon & Dawson, 2018). Other theoretical studies dedicated to minor planets are focused solely on the white dwarf phase (e.g., Alcock et al., 1986; Wyatt et al., 2014; Stone et al., 2015; Veras et al., 2015a, 2016a; Brown et al., 2017; Grishin & Veras, 2019; Makarov & Veras, 2019), and sometimes on individual systems (Gurri et al., 2017; Veras et al., 2017a; Duvvuri et al., 2019; Veras et al., 2020a).
Between the main-sequence and white dwarf phases of stellar evolution, most stars experience violent physical alterations during the giant branch phases. Minor planets are particularly susceptible to these changes (Veras, 2016a) and the consequences have again represented the focus of investigations during this phase alone. These changes include radiative destruction due to YORP-induced rotational fission (Veras et al., 2014a; Veras & Scheeres, 2020) – potentially contributing to the formation of debris discs (Bonsor & Wyatt, 2010; Bonsor et al., 2013, 2014) – and orbital evolution due to the both the Yarkovsky effect (Veras et al., 2015b, 2019) and stellar mass loss (Omarov, 1962; Hadjidemetriou, 1963). In particular, stellar mass loss can eject these minor planets (Veras et al., 2011), which may eventually pass through other planetary systems (Do et al., 2018; Moro-Martín, 2019).
Other investigations which included minor planet evolution have attempted to bridge the gap between several stellar evolutionary phases and/or included the influence of major planets (Bonsor et al., 2011; Debes et al., 2012; Frewen & Hansen, 2014; Veras et al., 2016b; Caiazzo & Heyl, 2017; Mustill et al., 2018; Smallwood et al., 2018, 2019; Antoniadou & Veras, 2016, 2019) or binary stars (Bonsor & Veras, 2015; Hamers & Portegies Zwart, 2016; Petrovich & Muñoz, 2017). None, however, have calibrated their minor planet initial conditions – which could sensitively determine the eventual accretion rate onto white dwarfs – with the results of planetary system formation within stellar clusters.
Nearly all planetary systems are formed in clustered stellar environments. Hence, theoretical investigations of these systems are of paramount importance, despite detections of only a few dozen cluster planets (Brucalassi et al. 2017, Mann et al. 2017, Leão et al. 2018, and see Table 1 of Cai et al. 2019 for an up-to-date listing of cluster planets). Many studies have focused on how photoevaporation from young hot stars affects major planet formation and migration (Adams et al., 2004; Veras & Armitage, 2004; Anderson et al., 2013; Dai et al., 2018; Winter et al., 2018; Concha-Ramírez et al., 2019; Nicholson et al., 2019) and how frequent and slow stellar flybys influence the resulting major planet architecture (Malmberg et al., 2007, 2011; Hao et al., 2013; Zheng et al., 2015; Shara et al., 2016; Hamers & Tremaine, 2017; Cai et al., 2017, 2019; Flammini Dotti et al., 2019; Li et al., 2019; van Elteren et al., 2019). Less-studied have been the consequences for minor planets (see, e.g., Brasser et al., 2006; Pfalzner et al., 2018; Hands et al., 2019; Batygin et al., 2020).
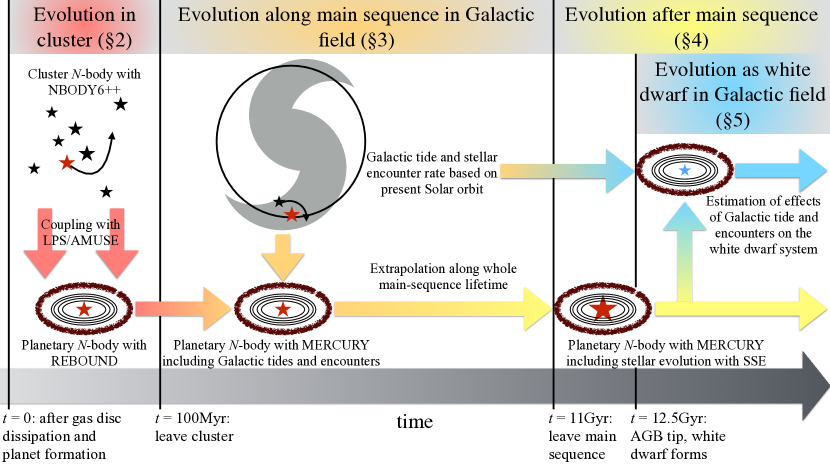
Here, we attempt to qualitatively trace the evolution, across all stellar phases, of exo-Kuiper Belts and planetesimal discs which are shaped in a stellar cluster environment. In order to restrict the enormous parameter space associated with this task, we consider only solar system analogues (Sun-like stars with Jupiter, Saturn, Uranus and Neptune) and split the temporal evolution into four distinct segments: [i] stellar cluster evolution (Section 2), [ii] main-sequence evolution (Section 3), [iii] giant branch evolution (Section 4) and [iv] white dwarf evolution (Section 5). A schematic overview of the different segments and the numerical codes used is given in Figure 1. We discuss the results in Section 6 and conclude in Section 7.
2 Star cluster evolution
Star formation occurs in regions with a stellar density that is substantially higher than that of the Galactic neighbourhood. Consequently, within a cluster, close stellar flybys are frequent and slow; they can help sculpt the orbital distribution of objects which are sufficiently far from their parent stars. Modelling these interactions is challenging primarily because of the different timescales (cluster evolution and planetary evolution) which must be simulated self-consistently, and secondarily because of the large parameter space.
In this section, we detail our cluster simulations. We describe our computational approach in Section 2.1 before outlining the initial conditions for our star clusters (Section 2.2) and planetary systems (Section 2.3); we report the simulation output in Section 2.4.
2.1 Computational approach
Planetary system evolution is fundamentally different from star cluster evolution. In the absence of major instabilities, planets evolve quiescently and are subject to only minor perturbations from mutual gravitational interactions and external perturbations from passing stars. The timescale for orbital changes is typically secular.
Star clusters, on the other hand, evolve through two-body relaxation and close few-body encounters (which may involve close binaries). These processes produce changes on orbital timescales rather than secular timescales. Further, star cluster dynamics more readily exhibits deterministic chaos, where systems with slightly different initial conditions diverge from each other in phase space exponentially, in less than an orbital time (e.g., Miller, 1964; Quinlan & Tremaine, 1992).
For these reasons, executing a combined simulation of planetary systems in star clusters is challenging. The main obstacle to overcome is not actually establishing the different timescales or hierarchies in the integrations111Close stellar binaries and planetary systems can be treated similarly., but rather accurately modelling the resonant and secular effects in the internal evolution of planetary systems. While different authors have advocated special symplectic methods to model planetary systems accurately (e.g. Wisdom & Holman, 1991), Kokubo, Yoshinaga & Makino (1998) demonstrated how small improvements in the Hermite integrator used for star cluster simulations can lead to an accurate treatment of its internal planetary systems over Gyr timescales.
We previously successfully performed simulations involving star clusters and their internal internal planetary systems by using a single -body code (NBODY6++GPU with massless particles, e.g., Shu et al. in preparation, Spurzem, et al., 2009). In this work, we follow a different method, one used by Flammini Dotti et al. (2019) and Cai et al. (2017, 2019). Here we first integrate the star cluster dynamics, recording the trajectories of stars and their nearest neighbours. Then, we add in planetary systems (including the exo-Kuiper belt objects) to selected host stars; the evolution of these planetary systems is performed by another code, named LonelyPlanets (Cai et al., 2017, 2018, 2019; Flammini Dotti et al., 2019, 2020). LonelyPlanets utilises the recorded perturbations from the star cluster simulation outputs as external perturbations to the planetary systems.
Hence, the star cluster simulations are carried out by NBODY6++GPU (Wang et al., 2015, 2016), whereas the planetary systems are integrated by LonelyPlanets (hereafter, LPS). This approach represents a fast and accurate method for integrating the evolution of planetary systems in star clusters, under the condition that the force of the planets on the stellar population can be neglected. The star cluster evolution is integrated through the Hermite scheme, using NBODY6++GPU. This code is the latest updated version of the original NBODY6 (Aarseth, 1999) and NBODY6++ (Spurzem, 1999). The greatest improvement in the last version is the feature which takes advantage of graphical processing units (GPUs) and task parallelization. The latter is achieved through MPI (Message Passing Interface; Tapamo, 2009), where both regular and irregular forces are parallelized. The GPU usage significantly improves NBODY6++GPU performance, especially for long-range (regular) gravitational forces
LPS is based on the AMUSE framework (Portegies Zwart et al., 2011; McMillan et al., 2012; Pelupessy et al., 2013; Portegies Zwart et al., 2018). AMUSE helps us consolidate our methodology, which can be summarised in four steps: (i) setting initial conditions for modelling the star cluster and planetary systems; (ii) modelling numerically the dynamics and stellar evolution of the star cluster; (iii) identifying close encounters experienced by the planet-hosting stars; and (iv) modelling the evolution of the planetary systems under the influence of the closest perturbers. In our work we will consider the five closest perturbers to the host stars, and these perturbers are identified by using the standard method for neighbour selection in the NBODY6++GPU simulations.
NBODY6++GPU integrates the star clusters, and stores data at a high temporal resolution (i.e., star cluster output) by using the block time step scheme (BTS, Cai et al., 2015). The latter approach prevents data redundancy for planetary systems in the low temporal resolution regime (i.e., planetary output). These data are then sent to the REBOUND integrator (Rein & Liu, 2012), which integrates the planetary system until the next BTS output set of data: in our dataset the star cluster output time-step of years was adopted. We use the HDF5222https://www.hdfgroup.org/ output format (Portell de Mora et al., 2011), a highly efficient storage scheme organised in a database-like structure.
As the star cluster and the planetary systems evolve, escaping bodies are removed. The criterion for escape of a star in a stellar cluster in NBODY6++GPU is when , where is the star cluster’s tidal radius (see Sec. 2.2 for further info). In LPS, the escapers from the planetary system are those particles with orbital eccentricities .
2.2 Star cluster initial conditions
We place our planetary systems each within a stellar cluster of 2000 stars containing an initial total mass of M⊙. The initial mass function (IMF) for the stars in the cluster follows a Kroupa (2001) IMF. The stellar masses are drawn from the range M⊙ with an expected average mass of M⊙. We use a (Plummer, 1911) model in virial equilibrium as the density profile for the cluster from which the initial positions and velocities of the stars are drawn. The initial half-mass radius is pc while the initial central density is M. These values are motivated from studies of the star cluster in which the Sun might have been born (Portegies Zwart, 2009, 2019). Furthermore, we assume a standard solar neighborhood tidal field (Heisler & Tremaine, 1986) and no primordial mass segregation.
The fraction of primordial binary systems is set to per cent in order to (i) keep the external perturbations “clean” and associate external perturbations entirely with single stars and not three-body effects, (ii) avoid circumbinary planetary systems and potential exchange interactions, and (iii) maintain a reasonable computational cost for the simulations. In reality, observations indicate that the binary fraction varies from a few per cent to half, where the lower bound is more representative of globular clusters and the upper bound is more representative of the field (Geller et al., 2008; Raghavan et al., 2010; Milone et al., 2012). A binary flyby typically increases the cross-section for planetary ejection and collisions (Wang et al., 2020). Hence, including binary flybys would have likely increased the extent of destabilisation of the disc, although the severity of the destabilisation would have been dependent on multiple parameter choices.
NBODY6++GPU includes stellar evolution of single and binary stars according to Hurley et al. (2000) and Hurley et al. (2001). We assume a solar metallicity for all stars, and include further improvements by taking into account fallback from supernova explosions and stellar winds of massive stars (Belczynski, Kalogera & Bulik, 2002). Also, kicks occurring at the formation of neutron stars according to Hobbs et al. (2005) are included. Although stellar evolution is modelled in our cluster simulations, the effects of mass loss of the host star on the planetary systems are not: the consequences for the major and minor planets during the main sequence phase would be negligible for our 1 M⊙ host stars.
We define a tidal radius as given in Cai et al. (2016). This radius is similar to the Jacobi radius and is related to the quantity that was defined by King (1962) (see Ernst, Just & Spurzem 2009 for further discussion). The differences between these three quantities are small, of order unity. Our -body simulation considers stars who reach twice the tidal radius as escapers and removes them from the system, meaning that some stars which are unbound from the cluster are followed. We do acknowledge, however, that the concept of a spherical tidal radius is an approximation; in reality the tidal escape problem is much more complicated (cf. e.g. Ernst, Just & Spurzem 2009). By keeping stars in the simulation which are not bound to the cluster, we can follow for the dynamics near the Lagrangian points with our -body simulations in detail.
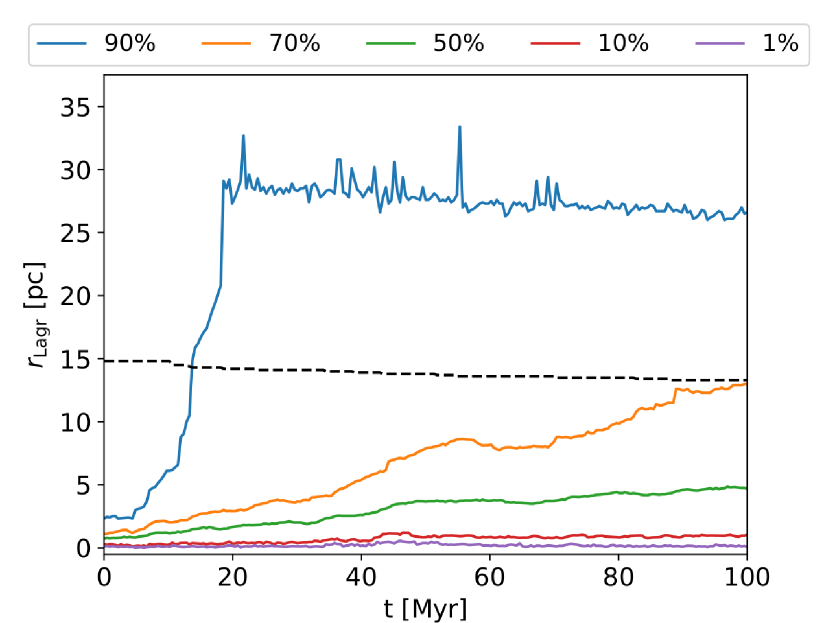
Fig. 2 provides an overview of the global evolution of our star cluster through the Lagrangian radii, which contain the indicated fraction of current total mass. Note that the 90% Lagrangian radius stays approximately constant after it has reached twice the tidal radius, because at this point we start removing particles from the simulation. We have also plotted the tidal radius as a function of time in that figure. At the time where the tidal radius is equal to the half mass radius (50% Lagrangian radius), the mass loss of the bound part of the star cluster is 50%: this time defines the half-life of the cluster. In this paper we simulate the cluster environment of our planetary systems for 100 Myr because after this time the cluster is going to dissolve and will have reduced its central density significantly; most strong encounters will have occurred by 100 Myr.
2.3 Planetary system initial conditions
Now we turn to the planetary systems. We define as the time when the natal protoplanetary disc has dissipated, and all that remains are major and minor planets, as well as the parent Sun-like star (with a mass of 1.0 ).
At this time, we emplace four major planets into an artificial system. The major planets are analogues of Jupiter, Saturn, Uranus and Neptune in mass, radius and current separation. As the protoplanetary disk lifetime was likely a few million years (Pascucci & Tachibana, 2010; Williams & Cieza, 2011), and (at least in the Sun’s case) the protostar may form a few Myrs after the first stars in the cluster (Adams, 2010), the star may depart the cluster slightly earlier than is assumed here.
Besides circular, co-planar orbits, we assume currently-observed planetary separations because the original orbital distribution of the four giant planets in our solar system is unknown. The giant planets were likely in a more compact configuration in the past, and Neptune’s outward migration explains resonant populations in the Kuiper Belt (Malhotra, 1993). On the other hand, a prior inwards migration of the giant planets can explain Jupiter’s composition and the asymmetry of its Trojan populations (Öberg & Wordsworth, 2019; Pirani et al., 2019). Additionally, the giant planets likely underwent at least one gravitational instability which has re-ordered the planets at some, still-uncertain, previous epoch (Thommes et al., 2002; Tsiganis et al., 2005; Morbidelli et al., 2007; Nesvorný & Morbidelli, 2012; Morbidelli et al., 2018). These instabilities have also shaped the Kuiper Belt and scattered disc. Furthermore, the current configuration of the four giant planets in the solar system is not expected to undergo any future instability amongst themselves (without an external influence) during the remainder of the Sun’s main-sequence lifetime (Laskar & Gastineau, 2009; Hayes et al., 2010; Zeebe, 2015; Veras, 2016b).
This analogue solar system serves as a template for our simulations. We generate 11 of these systems and impose different planetesimal disc configurations on each. We deposit 2000 massless particles in each planetesimal disc in an annulus extending from au to 1000 au, placing them uniformly in semimajor axis. Although these test particles are massless, we treat each as having a diameter of at least 100 km for the later application of radiative forces. The outer distance bound of 1000 au approximates the aphelion of distant solar system objects such as 90377 Sedna. These particles feel the gravitational force of the star and planets, but do not exert a force. The particles, which will henceforth be denoted by planetesimals, are on initially circular and co-planar orbits with randomly distributed mean anomalies.
These discs are initially dynamically cold in order to ensure that subsequent changes to the eccentricity and inclination are not primordial, and can be interpreted entirely in terms of gravitational excitation by stars and major planets. These discs are similar to the broad planetesimal discs formed in the models of Carrera et al. (2017), where photo-evaporation of a disc several hundred au wide drives efficient planetesimal formation by the streaming instability at large radii.
However, there is no observational confirmation that the models adopted in Carrera et al. (2017) are correct. Hence, because the disc is composed of test particles, we could divide the disc into different regions that may be treated independently. One natural dividing line is the maximum radial extent of observed debris discs. This value is debatable, particularly with respect to how they evolve out of protoplanetary discs (Andrews, 2020), but we adopt a value of 150 au.
A value of 150 au appears to represent a reasonable upper limit given infrared observations of debris discs (Sibthorpe et al., 2018, and the catalogue of resolved debris discs by Pawellek and Krivov333https://www.astro.uni-jena.de/index.php/theory/catalog-of-resolved-debris-disks.html); see also Krivov et al. (2013) with the caveat that some of these discs may actually be background galaxies (Gáspár & Rieke, 2014). However, we caution that non-detectability does not necessarily translate into absence, because dust production drops off inversely to the third or fourth power of distance (Shannon & Wu, 2011). Nevertheless, we henceforth characterize our discs in two regions, from (i) au, and (ii) au.
2.4 Results from star cluster simulations
The key results of these simulations are: (i) flybys are rarely intrusive enough to non-negligibly alter the orbital parameters of the major planets, (ii) the resulting distributions of the planetesimal discs differ substantially between systems, reflective of the perturbative environment in which they were placed, and (iii) the observed debris disc range () au is well-protected from cluster perturbations except in extreme cases. For example, the fraction of surviving planetesimals after 100 Myr in the 11 systems span almost the entire possible range; see Table 1 for the au sample, and Table 2 for the au sample.
| Highlighted | ||||
|---|---|---|---|---|
| systems | 0 Myr | 10 Myr | 90 Myr | 100 Myr |
| 2000 | 2000 | 2000 | 2000 (100%) | |
| 2000 | 2000 | 1996 | 1996 (99.8%) | |
| System #3 | 2000 | 1989 | 1963 | 1963 (98.2%) |
| System #4 | 2000 | 1985 | 1958 | 1957 (97.9%) |
| 2000 | 2000 | 1645 | 1641 (82.1%) | |
| 2000 | 2000 | 1515 | 1507 (75.3%) | |
| 2000 | 1714 | 961 | 957 (47.9%) | |
| System #1 | 2000 | 1832 | 853 | 853 (42.7%) |
| 2000 | 1985 | 725 | 719 (36.0%) | |
| System #2 | 2000 | 1221 | 193 | 193 (9.7%) |
| 2000 | 917 | 60 | 57 (2.9%) |
| Highlighted | ||||
|---|---|---|---|---|
| systems | 0 Myr | 10 Myr | 90 Myr | 100 Myr |
| 225 | 225 | 225 | 225 (100%) | |
| 225 | 225 | 225 | 225 (100%) | |
| System #3 | 225 | 225 | 225 | 225 (100%) |
| System #4 | 225 | 225 | 225 | 225 (100%) |
| 225 | 225 | 225 | 225 (100%) | |
| 225 | 225 | 225 | 225 (100%) | |
| 225 | 225 | 200 | 200 (88.9%) | |
| System #1 | 225 | 225 | 225 | 225 (100%) |
| 225 | 225 | 225 | 225 (100%) | |
| System #2 | 225 | 225 | 153 | 153 (68.0%) |
| 225 | 225 | 26 | 26 (11.6%) |
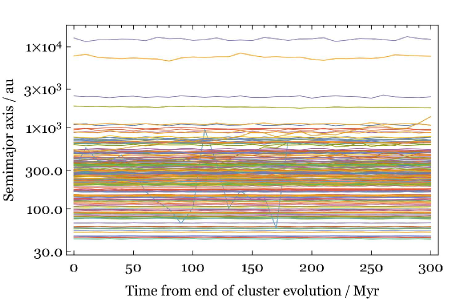
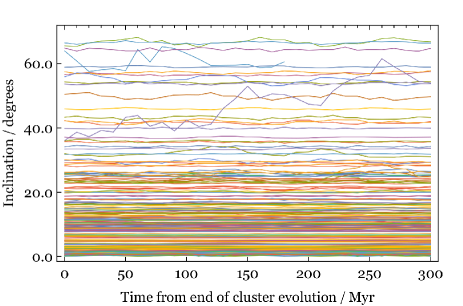
Cluster Evolution: System #1 Cluster Evolution: System #2
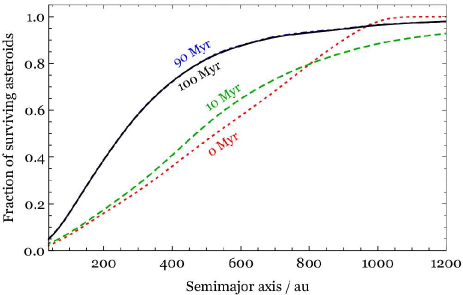
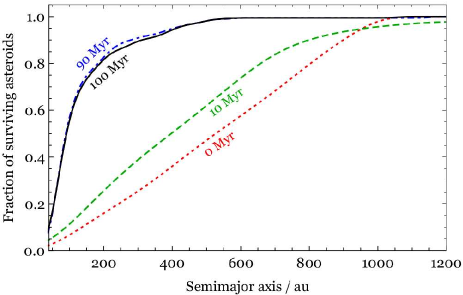
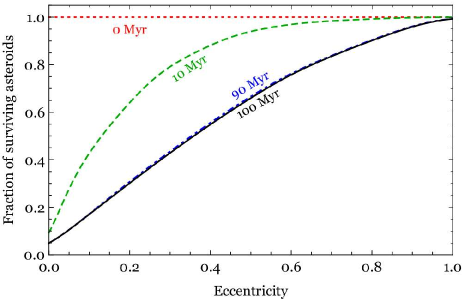
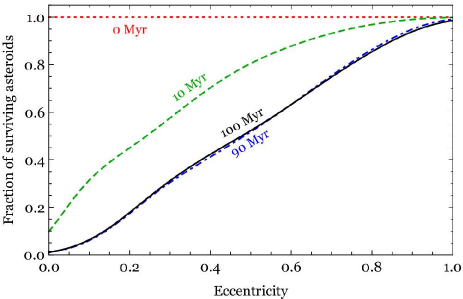
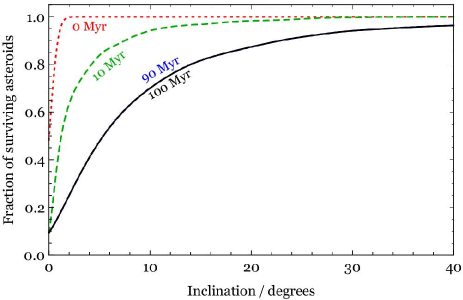
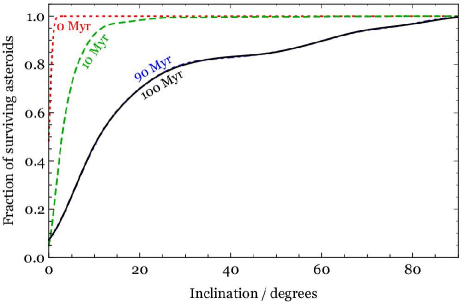
Figure 3 provides detailed illustrations for two of these systems for the entire au disc. The left panels shows the system with 43 per cent surviving planetesimals (labelled “system #1”) and the right panels show the system with 9.7 per cent surviving planetesimals (labelled “system #2”). The top, middle and bottom panels respectively illustrate the semimajor axis, eccentricity and inclination distributions. The left and right panels provide different viewpoints on each distribution. The fraction of surviving planetesimals for the inner au regions of both systems is 100 per cent, and hence is not shown separately.
The figure reveals that the outermost regions of each planetesimal disc are stripped. Other systems (not shown) which retain nearly their entire planetesimal discs harbour a more homogeneous distribution of semimajor axes throughout the 100 Myr cluster evolution. Figure 3 also illustrates how initially circular and co-planar planetesimals orbit distributions fan out in eccentricity and inclination space. The four snapshots in time which are displayed in the figures demonstrate the significant extent of the dynamical excitation from 0 Myr to 10 Myr and the insignificant evolution from 90 Myr to 100 Myr; i.e. by 100 Myr, the systems have effectively dynamically settled (see also van Elteren et al. 2019).
3 Main-sequence evolution
At Myr, we assume that the planetary systems have left the cluster environment and evolve for the remainder of the star’s main-sequence evolution “in the field”. The duration of the main-sequence evolution (about 11 Gyr) is determined by assuming that the star’s initial mass and metallicity are the same as the Sun’s. Variations in this value will arise depending on the stellar model used, but do not noticeably affect the final qualitative result.
Unlike in the previous section, numerically integrating the planetary systems for the entire 11 Gyr is not computationally feasible. The primary factors which restrict the timescale for such integrations are the total number of bodies and the presence of the exo-Jupiter (the planet with the shortest orbital period, unless a planetesimal is perturbed within 5 au of the star at some epoch). Therefore, we proceed [i] by arguing that the planetesimal evolution is negligible during this phase, and [ii] supporting this argument with limited duration integrations.
3.1 Argument for negligible evolution
We begin our argument by asserting that close stellar flybys in the field are infrequent and fast compared to those in the cluster environment. Further, the Milky Way Galaxy is a collisionless system. Because the relaxation time in the Solar neighborhood is longer than a Hubble time (see Binney & Tremaine 2008), major encounters are rare after the cluster dissolves (Portegies Zwart & Jílková, 2015). Consequently, over an 11 Gyr timescale, the expected single closest encounter distance with a planetary system is on the order of several hundred au (Zakamska & Tremaine, 2004; Veras & Moeckel, 2012; Correa-Otto & Gil-Hutton, 2017). Hence, for this particular closest encounter, whether an individual planetesimal at that distance would be significantly perturbed becomes a function of geometry.
Additionally, because the main-sequence lifetime of 11 Gyr is two orders of magnitude higher than the 100 Myr cluster timescale, additional processes which act over long timescales need to be considered at this stage. Three of these processes are Galactic tides, collisional grinding, and radiative forces.
3.1.1 Galactic tides
The consequences of Galactic tides are a strong function of stellar density (or location in the Milky Way), inclination with respect to the Galactic disc, and planetesimal-star separation. If, for example, our simulated systems were in the Galactic bulge, then Galactic tides acting over 10 Gyr would significantly affect planetesimal discs (Veras & Evans, 2013a). However, in the Solar neighbourhood, the effect is muted: the orbital eccentricity of a highly-inclined Sedna-like object (with a semimajor axis of about 550 au and eccentricity of about 0.85) may change by a maximum of about due to tides (Veras & Evans, 2013b). Because all of our planetesimals have semimajor axes within a factor of two of Sedna’s, their eccentricity changes due to tides are likely to be comparable to those from stellar flybys (just over much longer timescales).
We note that the Galactic environment of a planetary system likely changes with time. In fact, stars migrate in the Galaxy through interaction with time-varying spiral arms in a process called “churning” (Sellwood & Binney, 2002). Our present understanding of the Galactic metallicity gradients and age–metallicity relations suggests that the Sun was born 1–3 kpc closer to the Galactic centre than its current location (Minchev et al., 2013, 2018; Frankel et al., 2018; Feltzing et al., 2019). This distance is comparable to the scale length of the Galactic thin disc (Bland-Hawthorn & Gerhard, 2016), and so field star densities at the Solar birth radius could have been higher than the present value by a factor of a few. We are therefore slightly underestimating the impact of field star encounters and Galactic tides in this section.
3.1.2 Collisional grinding
Collisional grinding amongst planetesimals would not eject planetesimals nor their fragments from their original annulus. Instead, the consequence of mutual collisions between planetesimals is a change in their size distribution (Dohnanyi, 1969; Bottke et al., 2005). This alteration does not affect the way we represent our systems in our numerical integrations because we model our planetesimals as massless point particles, and do not make assumptions about the initial masses of our disc. Further, the physical evolution of our surviving large planetesimals ( km) is independent of our main results, because we know a posteriori that these objects will not pollute the eventual white dwarf, and become interstellar planetesimals at a negligible rate compared with those generated from the initial cluster evolution.
The consequence of changing the size distribution is that the ground-down planetesimals may become small enough to be affected physically and orbitally by stellar radiation (see Section 3.1.3), particularly during the giant branch phases of stellar evolution (see Section 4.1.3). Hence, if one imposes a size and mass distribution onto our massless particles, then depending on these parameters, no 100 km-sized planetesimals may survive throughout the main sequence. The actual collisional lifetimes of objects are a nontrivial function of many parameters, including the dispersal threshold for collisions (critical specific energy), the eccentricity distribution, the inclination distribution, and the breaking radius between the gravity and strength-dominated regimes (e.g. Wyatt et al., 2007; Löhne et al., 2008). For typical parameters assumed or calculated for extrasolar debris disks, collisional evolution is not significant for objects above 100 km in size (e.g., Kenyon & Bromley, 2008; Kobayashi & Löhne, 2014; Krivov et al., 2018). So, in this paper, we consider only surviving planetesimals larger than 100 km (which do not change their orbital elements due to collisions)444 For added perspective, in the solar system, the collisional evolution of the Main Belt asteroids has been investigated in a high-level of detail within subsets of the belt itself (e.g. Cibulková et al., 2014). The collisional evolution of the Kuiper Belt is more speculative, and often based on the fraction of binary asteroids (Nesvorný et al., 2011; Dell’Oro et al., 2012; Brunini & Zanardi, 2016). Nevertheless, Kuiper Belt objects greater than about 10 km in size are not thought to have undergone collisional evolution over the last 4 Gyr or so (Brasser & Morbidelli, 2013; Jutzi et al., 2017; Morbidelli & Nesvorny, 2019) and hence represent remnants of early dynamical instability which involved Neptune (Wolff et al., 2012; Parker, 2015; Chen et al., 2016; Nesvorný & Vokrouhlický, 2016; Volk & Malhotra, 2019). However, Sedna may be a remnant of collisional evolution far beyond the Kuiper belt (Silsbee & Tremaine, 2018)..
3.1.3 Radiative forces
Important radiative forces on planetesimals primarily arise from the YORP and Yarkovsky effects (Vokrouhlický et al., 2015). These forces describe the orbital movement (Yarkovsky effect) and the spin changes (YORP effect) from thermal imbalances created by nonzero thermal inertia and anisotropically emitted thermal radiation. The secular consequences of both effects have been observationally verified within the Main Belt, despite the fantastically small accelerations produced by the Sun’s radiation (often on the order of 1 pm s-2 for the Yarkovsky effect). The YORP effect can break apart planetesimals by spinning them up to the point of rotational fission (Holsapple, 2007; Warner et al., 2009; Polishook et al., 2017), which primarily affects the size distribution of the fragments, rather than their orbits. Both the Yarkovsky and YORP effects are negligible at distances of at least 40 au along the main sequence, and so their contribution here can be ignored.
Overall, we argue that planetesimal disc objects with sizes km have orbits which vary negligibly during the 11 Gyr main-sequence phase of stellar evolution. The extent of their orbital variation should be eccentricity shifts on the order of hundredths, unless a stellar flyby achieves a particularly close encounter within hundreds of astronomical units.
3.2 Short simulations
We now attempt to support our argument by conducting feasibly short (hundreds of Myr) -body simulations with a limited number of planetesimals (200 per simulation) but including both Galactic tides and stellar flybys. The results of these simulations may then be extrapolated over the entire main-sequence. The planetesimals are treated as test particles and hence are not assigned masses.
We perform these simulations using the RADAU (variable timestep) integrator in the Mercury integration package (Chambers, 1999) with implemented routines for Galactic tides from Veras & Evans (2013a) and stellar flybys from Veras et al. (2014b). We assume our systems reside in the Solar neighbourhood and adopt the corresponding numerical values associated with tides and flybys from those investigations: for the flybys, we assume a spatial stellar density of 0.392 pc-3 (Parravano et al., 2011) and an encounter velocity of 46 km/s (García-Sánchez et al., 2001). We also assume that the input values of the orbital elements of the planetesimals and giant planets equal the corresponding output values from our cluster simulations555 In our stellar cluster simulations in Section 2, the cluster evolution does slightly change the orbits of the giant planets, with the exo-Neptune experiencing the largest change. The typical scale of the changes for the exo-Neptune are 0.01-0.1 au in semimajor axis, 0.005-0.025 in eccentricity, and in inclination..
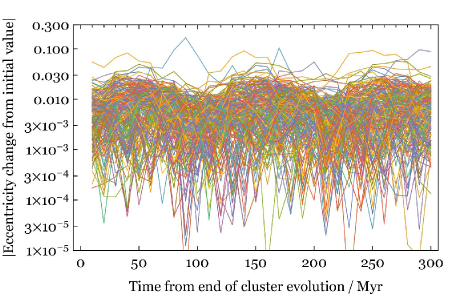
Main-Sequence Evolution
System #1 with four giant planets System #1 without four giant planets
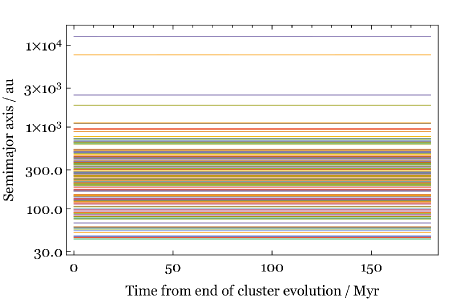
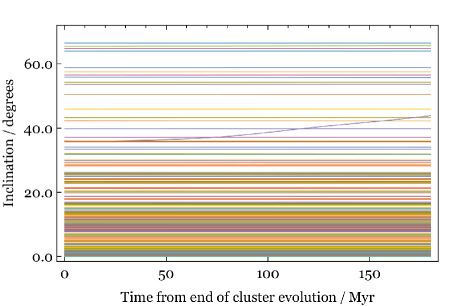
Main-Sequence Evolution
System #3 with four giant planets
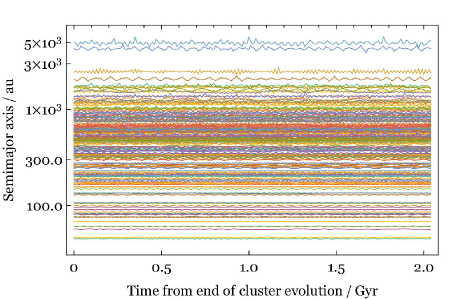
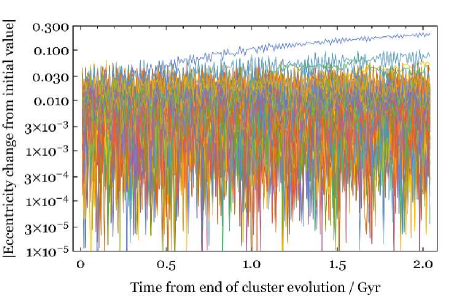
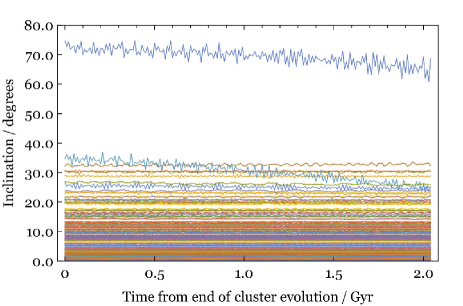
Figure 4 illustrates the time evolution of 200 randomly chosen planetesimals which survived the cluster evolution from the left panels of Fig. 3. The left panels of Figure 4 include the four giant planets, and the right panels do not, in order to illustrate that these planets represent the greatest driver of planetesimal orbital evolution. The middle panels display the eccentricity change from the initial values, highlighting how major planets usually vary planetesimal eccentricities either increasing or decreasing them by orders of magnitude more than stellar flybys or Galactic tides. In the simulations in the left panel, the closest stellar encounter occurred at a distance of 1786 au at 226 Myr into the simulation, whereas for the simulations in the right panel, the closest stellar encounter was at 7842 au at 9.5 Myr into the simulation. Note that around these times there is no discernibly significant change in the orbital parameters.
In all cases, the eccentricity variation rarely exceeds 0.03. The two highest curves on the middle right panel correspond to the two planetesimals with semimajor axes of about au and illustrate the secular oscillations produced from the Galactic tide; these planetesimals are outliers to the main distribution. In the simulations with major planets, only one of these 200 planetesimals becomes unstable (the jagged blue line in the upper left panel) and features the greatest eccentricity change of any planetesimal666We note that if some planetesimal disc objects were initially highly eccentric, then these relatively modest eccentricity changes would be much more significant. For example, consider a body at 1000 au with a pericentre at 40 au and an eccentricity of 0.96. If its eccentricity were increased by 0.03, its pericentre would now be at just 10 au, close enough to interact with Saturn..
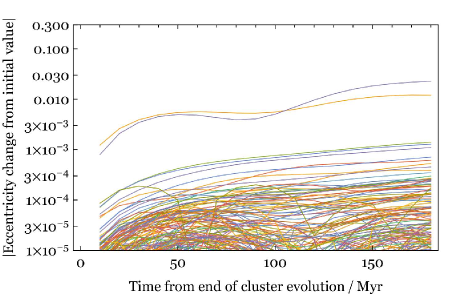
Figure 5 displays results for a different system (denoted “System #3”) which retained 98 per cent of its planetesimals after cluster evolution, and for which we ran the integration (200 planetesimals only) for much longer (2 Gyr) than System #1. Despite the longer timescale, the overall result is the same as Fig. 4: planetesimal discs maintain their post-cluster orbital elements except for the outliers. The longer timescale also allows oscillations in the orbital element distributions of these outliers (the furthest planetesimals) to be more readily detected. These oscillations arise from a combination of stellar flybys and Galactic tides. The amplitude of the inclination oscillations is highest for the most inclined (relative to the Galactic plane) planetesimal. Stellar flybys again do not appear to significantly affect the planetesimal dynamics, despite 35 close approaches within au, with the closest approach located at 1237 au at 1.52 Gyr into the simulation.
4 Giant branch evolution
In our short main sequence simulations, the orbital structure of the planetesimal discs remained effectively static. By assuming that later in the main sequence the disc was not significantly disturbed by a gravitational instability nor a close stellar flyby, we now consider the consequences of giant branch evolution. Giant stars undergo significant physical changes: a star will inflate its envelope out to a distance of about 1 au, lose about half of its mass through stellar winds, and increase its luminosity by a factor of about .
4.1 Description of effects
4.1.1 Stellar engulfment
The expansion of the stellar envelope can directly engulf closely orbiting planets, and tidally draw into the envelope planets which reside beyond the maximum extent of the stellar envelope. This critical engulfment distance has been extensively investigated, but nevertheless varies depending on the stellar and tidal models adopted (Kunitomo et al., 2011; Mustill & Villaver, 2012; Adams & Bloch, 2013; Nordhaus & Spiegel, 2013; Villaver et al., 2014; Madappatt et al., 2016; Staff et al., 2016; Gallet et al., 2017; Rao et al., 2018; Sun et al., 2018). Regardless, all models agree that objects orbiting a star beyond a few au would avoid engulfment.
Although planetesimal discs would survive engulfment, they could be affected by tides indirectly. Engulfment of planets changes the secular resonance structure of the system (Petrovich & Muñoz, 2017; Smallwood et al., 2018, 2019), which may trigger instabilities (collisions or ejections) in previously stable regions. However, for solar system analogues (Smallwood et al., 2018, 2019), where an exo-Mercury, exo-Venus and maybe an exo-Earth would be engulfed (Schröder & Smith, 2008), the secular resonance region of greatest importance would be internal to the giant planets. Hence, we need not consider engulfment for our planetesimal discs.
4.1.2 Stellar mass loss
Stellar mass loss, however, must be considered. The changing potential expands the orbits of all planets and planetesimals (Omarov, 1962; Hadjidemetriou, 1963). If the mass loss is assumed to be isotropic (Veras et al., 2013a), then objects within about au (including the planetesimal discs and four giant planets) would all double their semimajor axis. The extent to which their eccentricities change is positively correlated with semimajor axis, and usually neglected below a certain “adiabatic” limit (Veras et al., 2011). For distances of au, we should expect eccentricity shifts just on the order of hundredths. Hence, the result of stellar mass loss on our planetesimal discs would be a larger, but self-similar, annulus.
However, although the mutual semimajor axis ratios between planetesimals and planets would not change due to adiabatic mass loss, the decrease in mass from the central star may nevertheless trigger instability (Debes & Sigurdsson, 2002). Whether and when this trigger is activated depends on number of bodies, mass of bodies and mutual separation between the bodies (Bonsor et al., 2011; Debes et al., 2012; Mustill et al., 2013; Portegies Zwart, 2013; Veras et al., 2013b; Frewen & Hansen, 2014; Mustill et al., 2014; Veras & Gänsicke, 2015; Veras et al., 2016b, 2017b, 2018). We will explore the extent of the potential instability in our planetesimal discs due to the presence of an exo-Neptune through numerical simulations.
4.1.3 Stellar luminosity
First, we comment on the effects of the increased luminosity of the host star during the giant branch phases. While grain-sized particles may be “blown-out” by radiation pressure (Bonsor & Wyatt, 2010; Dong et al., 2010; Martin et al., 2020; Zotos & Veras, 2020), larger minor planets are subject to other effects. For example, the enhanced YORP effect would effectively destroy solar system Main Belt asteroids between 100 m and 10 km in size due to rotational spin-up (Veras et al., 2014a). Because the planetesimal’s change in spin rate is inversely proportional to the square of both the separation and planetesimal radius, the YORP effect on 100 km planetesimals would be at least four orders of magnitude smaller. Hence, we can safely neglect the YORP effect in post-main-sequence planetesimal discs with planetesimals larger than about 100 km.
However, planetesimals which survive YORP-induced spin-up may be orbitally perturbed by the enhanced Yarkovsky effect. We can estimate the extent of the Yarkovsky effect during the giant branch phase for a main-sequence star by using equations 108 and 110 of Veras et al. (2015b). Across the tip of the asymptotic giant branch, where the stellar luminosity is greatest, a planetesimal with a radius of 100 km and a distance of 40 au would shift777These estimates are about the same orders of magnitude as the excitations expected from the integrated monotonic Yarkovsky drift across the 11 Gyr main-sequence evolution. its semimajor axis by about au and its eccentricity by about . A shift of au is negligible because that value is orders of magnitude smaller than the typical libration widths of strong resonances in the trans-Neptunian region. Veras et al. (2019) provide further evidence that the Yarkovsky effect for 100 km planetesimals in this region is negligible by considering a variety of limiting Yarkovsky models that place bounds on the motion.
4.1.4 Galactic tides and stellar flybys
Regarding Galactic tides and stellar flybys during the giant branch phases, the primary difference from the main-sequence phase is the timescale over which these perturbations act. The durations of the main-sequence, red giant branch and asymptotic giant branch phases for a Sun-like star are about 11 Gyr, 1.5 Gyr and 5 Myr, respectively. These differences indicate that Galactic tides and stellar flybys are less disruptive during the giant branch phases than on the main sequence. Figure 3 of Veras et al. (2014c) plots the relative importance of Galactic tides, stellar flybys and stellar mass loss for the planets orbiting red giant branch and asymptotic giant branch stars as a function of stellar mass and Galactocentric distance. That figure illustrates that we can neglect Galactic tides and stellar flybys during the giant branch phases of stellar evolution.
4.1.5 Collisional grinding
Collisional evolution within the disc during giant branch evolution follows the description in Section 3.1.2, except now the stellar mass is a function of time. Bonsor & Wyatt (2010) analyzed this case, and found that the collisional lifetime increases as the star loses mass. The primary reason is because this stellar mass loss expands the disc and increases the pairwise distance amongst all of its contents. The planetesimals are hence “safer” during giant branch evolution than along the main sequence.
4.2 Numerical simulations
We now perform -body numerical simulations to quantify the changes in the orbital architectures of planetesimal discs during the giant branch phases of evolution. The above discussion suggests that we can neglect radiative forces (assuming our test particles are larger than about 100 km, which is our assumption), any residual effects from the engulfment of terrestrial planets, and external perturbers. What remains to be explored by these simulations is potential instability triggered by mass loss with Neptune and the planetesimals (we know that the giant planets themselves will remain stable from Veras 2016b).
The code we adopt in this section is different from the individual codes used in Sections 2 and 3 (see Fig. 1). Here, because we must concurrently model stellar and planetary evolution, we use the code presented in Mustill et al. (2018). This code is an updated version from the one that was first presented in Veras et al. (2013b) and uses the RADAU integrator from the Mercury integration package (Chambers, 1999).
We choose RADAU as the integrator because it is non-symplectic (allowing it to handle an arbitrarily-changing potential) but very accurate, being able to accurately track not only a planet’s semimajor axis but also its orbital phase. We adopt a tolerance value for the RADAU integrator of . The stellar evolution input is provided by the SSE code (Hurley et al., 2000). The output from the stellar evolution code is fed to Mercury, where the stellar mass is updated at every subdivision of a timestep for the force calculations. The stellar radius is updated every timestep, when checks are made for the removal of particles by collision with the star (no collisions occurred in our simulations).
We adopt the default numerical parameters in the SSE code for our simulations. Among these is the Reimers mass loss coefficient, which is set to 0.5. This coefficient dictates the time evolution of the mass loss. Veras & Wyatt (2012) sampled a realistic range of these coefficients for the future evolution of the Sun, and found that the total amount of mass lost ranges from about to depending on the choice of coefficient. Also, the time at which the asymptotic giant branch phase is initiated can vary by hundreds of Myr depending on this coefficient choice. Further, higher coefficients produce greater mass loss rates, yielding a solar system post-main-sequence escape boundary range of au (well beyond the outer boundary of most of our planetesimals). These variations due to coefficient choice are not sufficiently large to warrant partitioning the available computational resources in order to sample different coefficients.
As justified in Section 3, we adopt for our initial conditions the outputted values of the simulations performed in Section 2. We start our simulations right before the start of the red giant branch phase, which is 10.94 Gyr after the instance of Zero-Age-Main-Sequence (ZAMS). We run these simulations for the entire duration of the giant branch phases (1.5 Gyr) plus during the start of the white dwarf phase, for 8 Gyr in System #1 and 2.4 Gyr in another system denoted System #4.
Post-Main-Sequence Evolution: System #1
Post-Main-Sequence Evolution: System #4
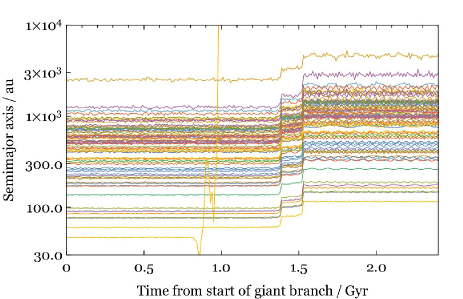
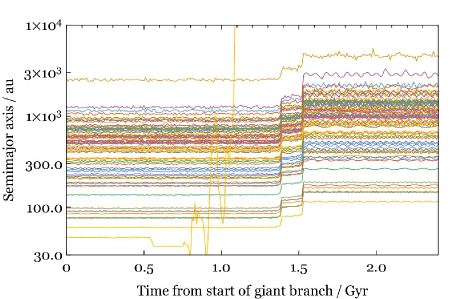
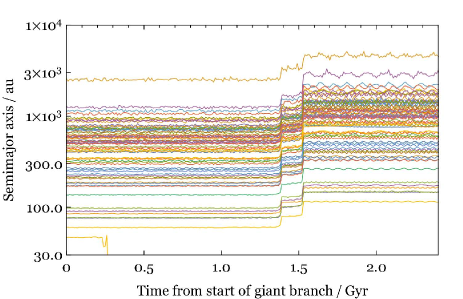
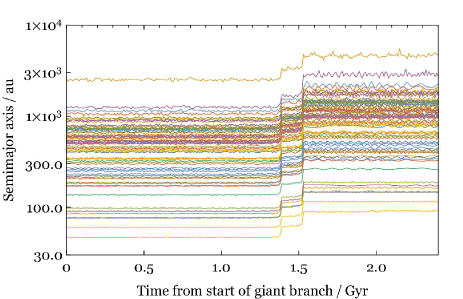
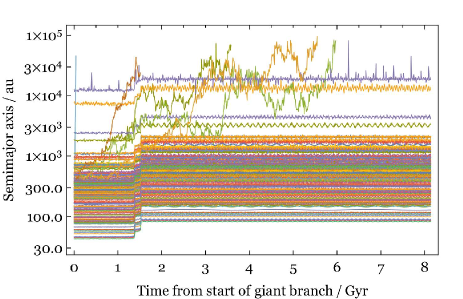
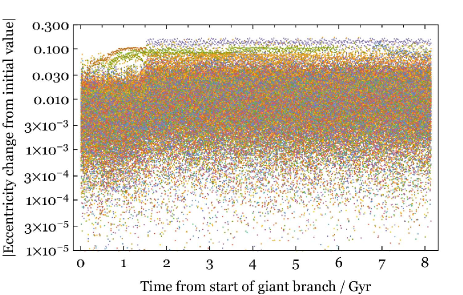
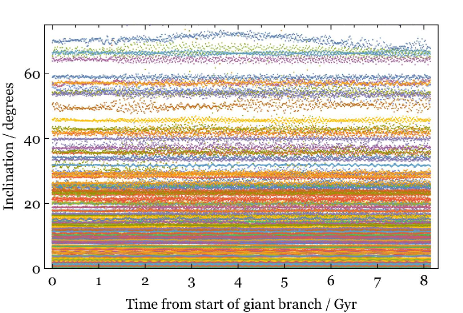
Figure 6 illustrates the results for System #1. The doubling of the semimajor axes occurs in two distinct steps, corresponding to the tips of the red giant and asymptotic giant branch phases around 1.5 Gyr into the simulation. During this time, an planetesimal’s eccentricity variation is shifted upwards by an amount which is correlated to semimajor axis: roughly, for and au, eccentricity variation is changed respectively to and . The inclination remains unaltered by mass loss, an expected result when the mass loss is isotropic (Veras et al., 2013a; Dosopoulou & Kalogera, 2016a, b). Further, the mutual inclination between the major planets and the planetesimals during the mass loss episode is not expected to contribute to possible instability (Veras et al., 2018).
The plots in Figure 6 do illustrate some instability, which is to be expected. However, only 5 of the 200 planetesimals simulated become unstable, meaning that the planetesimal disc remains relatively undisturbed, just with double the semimajor axis and a usually negligible eccentricity shift.
The occurrence of instability is stochastic. In order to test how the extent of instability changes due to chaos, in Fig. 7 we show the evolution of a different system (denoted system #4) of 70 planetesimals, where the integration was repeated three times with the same initial conditions. However, in each case the integration was interrupted and restarted at different times during the giant branch evolution. Each plot exhibits different variations in the oscillations of each curve, and in three of the four plots, one planetesimal becomes unstable (in the other there is no instability). The robustness of the evolution in all cases suggests that the variations in instabilities introduced by stochasticity do not affect our conclusions.
5 White dwarf evolution
Evolution during the white dwarf phase proceeds similarly to that along the main sequence phase (Section 3), but with a few differences. The largest objects ( km) in the planetesimal disc now occupy a (primarily) au annulus, from originally a au annulus. Further, the timescale for white dwarf cooling can reach a Hubble time ( 13 Gyr), although the oldest known metal-polluted white dwarf has a cooling age of about 8 Gyr (Hollands et al., 2017, 2018) 888 A white dwarf with a cooling age of 8 Gyr corresponds to a main-sequence progenitor mass larger than the that we considered here. Older polluted systems may exist but are difficult to detect because of their faintness..
White dwarf luminosities monotonically decrease from the moment they are born (e.g. Mestel, 1952). This fact, coupled with the extended semimajor axes of the planetesimals, illustrates that the Yarkovsky and YORP effects are negligible for the km objects. We note importantly, however, that boulders and pebbles may still be significantly affected by this radiation around young white dwarfs, where even the weaker force generated by Poynting–Robertson drag may crowd the region around the white dwarf with debris (Stone et al., 2015; Veras et al., 2015c).
We can estimate the consequences of doubling of the semimajor axis of our planetesimal discs with respect to external forces. For Galactic tides, Veras & Evans (2013b) defined two different regimes: “adiabatic” and “nonadiabatic” (similar to the terms used for mass loss), where the adiabatic regime is defined by when the orbital timescale is faster than the Galactic tidal timescale. They showed how the equations of motion differ in these two regimes. The planetesimal discs here are comfortably within the adiabatic regime (Veras et al., 2014c), where Galactic tides do not alter the semimajor axis , but vary the eccentricity and inclination by an amount proportional to . Further, for stellar flybys, equation 46 of Veras & Moeckel (2012) indicates that the number of flybys which trigger an orbital eccentricity exceeding a given value is, roughly, also proportional to . Hence, doubling the semimajor axis increases the eccentricity excitation from external forces approximately by a factor of 2.8. Consequently, for this eccentricity variation to reach 0.1 during the white dwarf phase, it would need to be at the 0.03 level during the main-sequence.
Such eccentricity variations are important only if they are already on a highly-eccentric orbit or could trigger instability with a sufficiently close major planet. Instability with the exo-Neptune is the primary driver of orbital architecture variation of an exo-Kuiper belt during the white dwarf phase. Bonsor et al. (2011) quantified how a single planet orbiting a white dwarf could drive external exo-Kuiper belt objects out of their annulus inward, and Mustill et al. (2018) did the same, but for systems of three major planets. Mustill et al. (2018) demonstrated that in order for these objects to actually reach the Roche radius of the white dwarf (and hence pollute it), a gravitational instability amongst multiple major planets is necessary. Instability amongst terrestrial planets provides a much better match to the observed pollution rate as a function of time (Hollands et al., 2018) than do giant planets (such as the solar system giant planets).
Because Jupiter, Saturn, Uranus and Neptune are expected to remain stable through at least 10 Gyr of Solar white dwarf cooling (Laskar & Gastineau, 2009; Hayes et al., 2010; Zeebe, 2015; Veras, 2016b), we hence do not expect scattered disc objects such as Sedna to pollute the Solar white dwarf. The orbital elements of these scattered disc objects will have not significantly changed since the last scattering event (either amongst planets or from stellar flybys). In solar system analogues with no such scattering events, the orbital elements should reflect the values attained at the end of stellar cluster dispersion.
6 Discussion
Our study aimed to achieve a qualitative understanding of how the largest ( km) planetesimal disc objects evolve through time. We focussed on the initial semimajor axis range au. Planetesimals likely formed in a more restricted range; as discussed earlier, observations of debris discs indicates that their maximal radial extent is approximately 150 au. Nevertheless, because we adopted test particles, we were able to explore locations exterior to 150 au to which a planetesimal might have been perturbed.
Our results do not profess to answer, but instead provide a foundation for, tackling major topical questions, such as: what is the frequency of interstellar interlopers within the solar system from post-main-sequence ejection (Do et al., 2018; Rafikov, 2018; Moro-Martín, 2019)? (Section 6.1), and what is the dominant delivery mechanism in metal-polluted white dwarf systems (Veras, 2016a)? ( Section 6.2)
Obtaining answers to both questions requires a comparative population analysis, which we now perform.
6.1 Implications for white dwarf pollution
The mass reservoirs which primarily generate white dwarf pollution are still unknown. One candidate reservoir is the population of large exo-Kuiper belt planetesimals, which has been the focus of this study.
This reservoir is particularly important to consider because Bonsor et al. (2011) demonstrated that a Neptune analogue at a 30 au separation from the star could scatter a sufficient amount of exo-Kuiper belt material extending out from 30 au to about 48 au towards the white dwarf to explain metal accretion rates. This conclusion is strongly dependent on the belt structure and the time at which the belt was initialized. Unlike our study, Bonsor et al. (2011) modelled planetesimals which were much closer to the planet and hence much more conducive to instabilities due to overlapping resonances. They also performed integrations along main-sequence evolution for just yr (to dynamically settle the belt), followed by integrations during giant branch evolution.
Hence, placing that study into context is important when comparing the amount of pollution that has been generated in both studies. Bonsor et al. (2011) did not perform stellar cluster simulations and we did not consider planetesimals closer to (within 40 au) the exo-Neptune. Further, we note that our nil result for pollution should not imply that planetesimals at or slightly beyond 40 au can never pollute white dwarfs. Major planets could exist beyond 30 au (a notable example being the HR 8799 system; Marois et al. 2008, 2010) and could generate the same type of instability that was showcased in Bonsor et al. (2011) in those regions to generate pollution.
Further, by considering an annulus of planetesimals extending out to au, we also have probed pollution prospects towards the inner exo-Oort-cloud. Separations out to au have previously been largely unexplored, as previous exo-Oort cloud-based studies have modelled minor planets in the separation range au (Caiazzo & Heyl, 2017), au (Stone et al., 2015) and au (Veras et al., 2014b).
The numerical integrations in all these studies of planetesimals beyond au yielded nonzero quantities of white dwarf pollutants, partially triggered by excitation due to giant branch mass loss (Veras & Wyatt, 2012; Veras et al., 2014b, c). These excited planetesimals evolve non-adiabatically in both the mass loss (Veras et al., 2011) and Galactic tidal (Veras et al., 2014c) senses (meaning that their orbital evolution due to each force cannot be characterised in a closed explicit form), and hence are actually more likely to strike the white dwarf than planetesimals in our initial separation range of au999We note that none of these studies have explicitly explored the sensitive dependence of exo-Oort-cloud evolution on the specific Galactic model adopted (Portegies Zwart et al., 2018; Torres et al., 2019) nor exchange mechanisms with both planetesimal discs (Weissman & Levison, 1997; Shannon et al., 2015, 2019) and the interstellar medium (Heisler & Tremaine, 1986)..
We conclude that the range au represents a “sweet spot” where we would not expect pollutants dynamically, at least for solar system analogues. Further, chemically, most pollutants are rocky (Zuckerman et al., 2007; Gänsicke et al., 2012; Jura & Young, 2014; Harrison et al., 2018; Hollands et al., 2018; Doyle et al., 2019; Swan et al., 2019b; Xu et al., 2019; Bonsor et al., 2020) rather than volatile-rich (Xu et al., 2017), suggesting that the main source of pollutants lies inward of 30 au. Despite this chemical suggestion, which has increased in robustness over the last few years, many investigations have dynamically invoked the reservoir of planetesimals initially beyond 30 au as a viable source of white dwarf pollution (Bonsor et al., 2011; Veras et al., 2014b; Stone et al., 2015; Caiazzo & Heyl, 2017), helping to motivate our study.
6.2 Implications for interstellar planetesimals
Another motivation for our investigation is to explore the effect of “full-lifetime evolution” on the eventual ejection of planetesimals from an initial au disc. The flux of such planetesimals in space is unknown, but was predicted to be large enough to produce interstellar interlopers, even before the discovery of 1I/‘Oumuamua (Moro-Martín et al., 2009). These planetesimals provide important probes of the outer parts of planetary systems, probes which are not yet available by other means (McGlynn & Chapman, 1989; Stern, 1990; Wyatt et al., 2017).
After the discovery of 1I/‘Oumuamua, theoretical investigations of interstellar interlopers blossomed (e.g. Do et al., 2018; Jackson et al., 2018; Katz, 2018; Portegies Zwart et al., 2018; Rafikov, 2018; Raymond et al., 2018a, b; ’Oumuamua ISSI Team et al., 2019; Moro-Martín, 2018, 2019; Malamud & Perets, 2020), ensuring that our study is timely. Because those other studies focus on individual aspects of generating and delivering these planetesimals to the solar system, a comprehensive framework is needed to consolidate the plethora of ideas posed.
We do not claim to provide such a framework. However, what we do, for the first time, is bring together all phases of stellar evolution in a self-consistent way for the au region. Our findings are similar to our result for white dwarf pollution: dynamical stagnation. Just as our planetesimals do not collide with the star, they also rarely escape after the stellar cluster phase.
During the cluster phase, we showed that for the au semimajor axis region, the escape fraction could be any value depending on the physical and orbital properties of the stars in the cluster (in Table 1, the escape fraction during the cluster phase ranged from 2.9 per cent to 100 per cent). This result was not a priori trivial because the planetesimals were initially dynamically cold (on circular and coplanar orbits), and with a maximum semimajor axis that was set at just 1000 au, which is two orders of magnitude smaller than the typical Hill ellipsoid axes of a planetary system (Veras et al., 2014c).
In subsequent phases of stellar evolution, the ejection fraction is comparatively negligible. As we illustrated in Figs. 4-5, ejection does not occur along the main sequence except during a chance, particularly close flyby. During post-main-sequence evolution, ejection is more likely, but only at the few per cent level (see Fig. 6), and sometimes not at all (Fig. 7).
Consequently, we conclude that for the au range, ejection predominantly occurs during the early cluster phase. Although post-main-sequence origins of interlopers like 1I/‘Oumuamua and 2I/Borisov are possible, in this context tidal disruption events around white dwarfs (Rafikov, 2018; Malamud & Perets, 2020) may be more likely to occur than ejection during the giant branch phases.
Despite how our conclusion about ejection occurring primarily during the cluster phase is solely based on stars with four giant planets, we speculate that this conclusion is robust throughout the Galaxy: although the highest mass white dwarf progenitors would yield the greatest giant branch excitation and ejection potential (Veras et al., 2011, 2020b), most stars in the Milky Way are actually less massive than the Sun.
7 Conclusion
Both metal-polluted white dwarfs and the interstellar planetesimals 1I/‘Oumuamua and 2I/Borisov provide strong motivation for investigating the full life cycle of minor planets. Here, we take one step towards achieving this understanding by focusing on large ( km) planetesimals in an initial semimajor axis range of au, which corresponds to a planetesimal disc or exo-Kuiper belt.
For the first time, we attempted to link the formative pathways of these belts from their stellar birth cluster to their fate, when the star leaves the main sequence and eventually transforms into a white dwarf. We performed this task through a series of arguments and simulations which encompass the strongest forces on these planetesimals, from stellar radiation to mutual, external and major planet perturbations in solar system analogues. We found that the planetesimal orbital distributions obtained at the end of stellar cluster evolution can be used to predict the evolved form of these distributions during the white dwarf phase unless a major gravitational instability (amongst major planets or with a passing star) occurred in-between. This prediction just entails inflating the planetesimal semimajor axes by an amount which is inversely proportional to the stellar mass loss; the au range represents a “sweet spot” where other forces are ineffectual at producing major changes.
Acknowledgements
We thank the referee for their insightful and detailed comments, which have significantly improved the manuscript. DV gratefully acknowledges the support of the STFC via an Ernest Rutherford Fellowship (grant ST/P003850/1). KR and RS acknowledge the support of the DFG priority program SPP 1992 “Exploring the Diversity of Extrasolar Planets” (SP 345/20-1). FFD and MBNK were supported by the Research Development Fund (grant RDF-16-01-16) of Xi’an Jiaotong-Liverpool University (XJTLU), and MBNK acknowledges support from the National Natural Science Foundation of China (grant 11573004). MXC thanks Santiago Torres and Diptajyoti Mukherjee for insightful discussions. AJM acknowledges funding from the Knut and Alice Wallenberg Foundation (project grant 2014.0017) and the Swedish Research Council (starting grant 2017-04945). AS is supported by funding from the European Research Council under the European Community’s H2020 (2014-2020/ERC Grant Agreement No. 669416 ‘LUCKY STAR’). RS has been supported by National Astronomical Observatories of Chinese Academy of Sciences, Silk Road Project, and by National Natural Science Foundation of China under grant No. 11673032. Star cluster simulations have been done on the GPU accelerated cluster “kepler”, funded by Volkswagen Foundation grants 84678/84680.
References
- Aarseth (1999) Aarseth S. J., 1999, Celest. Mech. Dyn. Astron., 73, 127
- Aarseth (2010) Aarseth S. J., 2010, Gravitational N-Body Simulations. Cambridge Monographs on Mathematical Physics. Cambridge University Press, Cambridge.
- Adams (2010) Adams, F. C. 2010, ARA&A, 48, 47
- Adams & Bloch (2013) Adams, F. C., & Bloch, A. M. 2013, ApJL, 777, L30
- Adams et al. (2004) Adams, F. C., Hollenbach, D., Laughlin, G., et al. 2004, ApJ, 611, 360
- Alcock et al. (1986) Alcock, C., Fristrom, C. C., & Siegelman, R. 1986, ApJ, 302, 462
- Anderson et al. (2013) Anderson, K. R., Adams, F. C., & Calvet, N. 2013, ApJ, 774, 9
- Andrews (2020) Andrews, S. M. 2020, In Press ARA&A , arXiv:2001.05007
- Antoniadou & Veras (2016) Antoniadou, K. I., & Veras, D. 2016, MNRAS, 463, 4108
- Antoniadou & Veras (2019) Antoniadou, K. I., & Veras, D. 2019, A&A, 629, A126
- Batygin et al. (2020) Batygin, K., Adams, F. C., Batygin, Y. K., et al. 2020, AJ, 159, 101
- Belczynski, Kalogera & Bulik (2002) Belczynski K., Kalogera V., Bulik T., 2002, ApJ, 572, 407
- Binney & Tremaine (2008) Binney, J., & Tremaine, S. 2008, Galactic Dynamics: Second Edition
- Bland-Hawthorn & Gerhard (2016) Bland-Hawthorn, J., & Gerhard, O. 2016, ARAA, 54, 529
- Bonsor & Wyatt (2010) Bonsor, A., & Wyatt, M. 2010, MNRAS, 409, 1631
- Bonsor et al. (2011) Bonsor, A., Mustill, A. J., & Wyatt, M. C. 2011, MNRAS, 414, 930
- Bonsor et al. (2013) Bonsor, A., Kennedy, G. M., Crepp, J. R., et al. 2013, MNRAS, 431, 3025
- Bonsor et al. (2014) Bonsor, A., Kennedy, G. M., Wyatt, M. C., et al. 2014, MNRAS, 437, 3288
- Bonsor & Veras (2015) Bonsor, A., & Veras, D. 2015, MNRAS, 454, 53
- Bonsor et al. (2020) Bonsor, A., Carter, P. J., Hollands, M., et al. 2020, MNRAS In Press, arXiv:2001.04499
- Booth et al. (2009) Booth, M., Wyatt, M. C., Morbidelli, A., et al. 2009, MNRAS, 399, 385
- Bottke et al. (2005) Bottke, W. F., Durda, D. D., Nesvorný, D., et al. 2005, Icarus, 179, 63
- Brasser et al. (2006) Brasser, R., Duncan, M. J., & Levison, H. F. 2006, Icarus, 184, 59
- Brasser & Morbidelli (2013) Brasser, R., & Morbidelli, A. 2013, Icarus, 225, 40
- Brown et al. (2017) Brown, J. C., Veras, D., & Gänsicke, B. T. 2017, MNRAS, 468, 1575
- Brucalassi et al. (2017) Brucalassi, A., Koppenhoefer, J., Saglia, R., et al. 2017, A&A, 603, A85
- Brunini & Zanardi (2016) Brunini, A., & Zanardi, M. 2016, MNRAS, 455, 4487
- Cai et al. (2015) Cai M. X., Meiron Y., Kouwenhoven M. B. N., Assmann P., Spurzem R., 2015, ApJS, 219, 31
- Cai et al. (2016) Cai M. X., Gieles M., Heggie D. C., Varri A. L., 2016, MNRAS, 455, 596
- Cai et al. (2017) Cai, M. X., Kouwenhoven, M. B. N., Portegies Zwart, S. F., et al. 2017, MNRAS, 470, 4337
- Cai et al. (2018) Cai M. X., Portegies Zwart S., van Elteren A., 2018, MNRAS, 474, 5114
- Cai et al. (2019) Cai, M. X., Portegies Zwart, S., Kouwenhoven, M. B. N., et al. 2019, MNRAS, 489, 4311
- Caiazzo & Heyl (2017) Caiazzo, I., & Heyl, J. S. 2017, MNRAS, 469, 2750
- Carrera et al. (2017) Carrera, D., Gorti, U., Johansen, A., et al. 2017, ApJ, 839, 16
- Cassan et al. (2012) Cassan, A., Kubas, D., Beaulieu, J.-P., et al. 2012, Nature, 481, 167
- Chambers (1999) Chambers, J. E. 1999, MNRAS, 304, 793
- Chen et al. (2016) Chen, Y.-Y., Ma, Y., & Zheng, J. 2016, MNRAS, 458, 4277
- Cibulková et al. (2014) Cibulková, H., Brož, M., & Benavidez, P. G. 2014, Icarus, 241, 358
- Concha-Ramírez et al. (2019) Concha-Ramírez, F., Wilhelm, M. J. C., Portegies Zwart, S., et al. 2019, MNRAS, 490, 5678
- Correa-Otto & Gil-Hutton (2017) Correa-Otto, J. A., & Gil-Hutton, R. A. 2017, A&A, 608, A116
- Coutu et al. (2019) Coutu, S., Dufour, P., Bergeron, P., et al. 2019, ApJ, 885, 74
- Dai et al. (2018) Dai, Y.-Z., Liu, H.-G., Wu, W.-B., et al. 2018, MNRAS, 480, 4080
- Debes & Sigurdsson (2002) Debes, J. H., & Sigurdsson, S. 2002, ApJ, 572, 556
- Debes et al. (2012) Debes, J. H., Walsh, K. J., & Stark, C. 2012, ApJ, 747, 148
- Dell’Oro et al. (2012) Dell’Oro, A., Cellino, A., & Paolicchi, P. 2012, MNRAS, 425, 1492
- Dennihy et al. (2018) Dennihy, E., Clemens, J. C., Dunlap, B. H., Fanale, S. M., Fuchs, J. T., Hermes, J. J. 2018, ApJ, 854, 40
- Do et al. (2018) Do, A., Tucker, M. A., & Tonry, J. 2018, ApJL, 855, L10
- Dohnanyi (1969) Dohnanyi, J. S. 1969, JGR, 74, 2531
- Dong et al. (2010) Dong, R., Wang, Y., Lin, D. N. C., et al. 2010, ApJ, 715, 1036
- Dosopoulou & Kalogera (2016a) Dosopoulou, F., & Kalogera, V. 2016a, ApJ, 825, 70
- Dosopoulou & Kalogera (2016b) Dosopoulou, F., & Kalogera, V. 2016b, ApJ, 825, 71
- Doyle et al. (2019) Doyle, A. E., Young, E. D., Klein, B., et al. 2019, Science, 366, 356
- Duvvuri et al. (2019) Duvvuri, G., Redfield, S. & Veras, D. 2019, Submitted to AAS Journals
- Ernst, Just & Spurzem (2009) Ernst A., Just A., Spurzem R., 2009, MNRAS, 399, 141
- Farihi (2016) Farihi, J. 2016, New Astronomy Reviews, 71, 9
- Feltzing et al. (2019) Feltzing, S., Bowers, J. B., & Agertz, O. 2019, arXiv e-prints, arXiv:1907.08011
- Ferlet et al. (1987) Ferlet R., Hobbs L. M., Madjar A. V., 1987, A&A, 185, 267
- Flammini Dotti et al. (2019) Flammini Dotti, F., Kouwenhoven, M. B. N., Cai, M. X., et al. 2019, MNRAS, 489, 2280
- Flammini Dotti et al. (2020) Flammini Dotti F., Cai M. X., Spurzem R., Kouwenhoven M. B. N., 2020, Origins: From the Protosun to the First Steps of Life. Proceedings of the International Astronomical Union, Volume 345, pp. 293-294
- Frankel et al. (2018) Frankel, N., Rix, H.-W., Ting, Y.-S., et al. 2018, ApJ, 865, 96
- Frewen & Hansen (2014) Frewen, S. F. N., & Hansen, B. M. S. 2014, MNRAS, 439, 2442
- Gallet et al. (2017) Gallet, F., Bolmont, E., Mathis, S., et al. 2017, A&A, 604, A112
- Gänsicke et al. (2006) Gänsicke, B. T., Marsh, T. R., Southworth, J., & Rebassa-Mansergas, A. 2006, Science, 314, 1908
- Gänsicke et al. (2012) Gänsicke, B. T., Koester, D., Farihi, J., et al. 2012, MNRAS, 424, 333
- García-Sánchez et al. (2001) García-Sánchez, J., Weissman, P. R., Preston, R. A., et al. 2001, A&A, 379, 634
- Gáspár & Rieke (2014) Gáspár, A., & Rieke, G. H. 2014, ApJ, 784, 33
- Geller et al. (2008) Geller, A. M., Mathieu, R. D., Harris, H. C., et al. 2008, AJ, 135, 2264
- Gomes et al. (2008) Gomes, R. S., Fernández, J. A., Gallardo, T., et al. 2008, The Solar System Beyond Neptune, 259
- Graham et al. (1990) Graham, J. R., Matthews, K., Neugebauer, G., & Soifer, B. T. 1990, ApJ, 357, 216
- Grishin & Veras (2019) Grishin, E., & Veras, D. 2019, MNRAS, 489, 168
- Gurri et al. (2017) Gurri, P., Veras, D., & Gänsicke, B. T. 2017, MNRAS, 464, 321
- Guzik et al. (2019) Guzik, P., Drahus, M., Rusek, K., et al. 2019, Nature Astronomy, 467
- Hadjidemetriou (1963) Hadjidemetriou, J. D. 1963, Icarus, 2, 440
- Hamers & Portegies Zwart (2016) Hamers A. S., Portegies Zwart S. F., 2016, MNRAS, 462, L84
- Hamers & Tremaine (2017) Hamers, A. S., & Tremaine, S. 2017, AJ, 154, 272
- Hands et al. (2019) Hands, T. O., Dehnen, W., Gration, A., et al. 2019, MNRAS, 490, 21
- Hao et al. (2013) Hao W., Kouwenhoven M. B. N., Spurzem R., 2013, MNRAS, 433, 867
- Harrison et al. (2018) Harrison, J. H. D., Bonsor, A., & Madhusudhan, N. 2018, MNRAS, 479, 3814
- Hayes et al. (2010) Hayes, W. B., Malykh, A. V., & Danforth, C. M. 2010, MNRAS, 407, 1859
- Heisler & Tremaine (1986) Heisler, J., & Tremaine, S. 1986, Icarus, 65, 13
- Hobbs et al. (2005) Hobbs G., Lorimer D. R., Lyne A. G., Kramer M., 2005, MNRAS, 360, 974
- Hollands et al. (2017) Hollands, M. A., Koester, D., Alekseev, V., Herbert, E. L., & Gänsicke, B. T. 2017, MNRAS, 467, 4970
- Hollands et al. (2018) Hollands, M. A., Gänsicke, B. T., & Koester, D. 2018, MNRAS, 477, 93.
- Holsapple (2007) Holsapple, K. A. 2007, Icarus, 187, 500
- Hurley et al. (2000) Hurley, J. R., Pols, O. R., & Tout, C. A. 2000, MNRAS, 315, 543
- Hurley et al. (2001) Hurley J. R., Tout C. A., Aarseth S. J., Pols O. R., 2001, MNRAS, 323, 630
- Jackson et al. (2018) Jackson, A. P., Tamayo, D., Hammond, N., et al. 2018, MNRAS, 478, L49
- Jura & Young (2014) Jura, M., & Young, E. D. 2014, Annual Review of Earth and Planetary Sciences, 42, 45
- Jutzi et al. (2017) Jutzi, M., Benz, W., Toliou, A., et al. 2017, A&A, 597, A61
- Katz (2018) Katz, J. I. 2018, MNRAS, 478, L95
- Kenyon & Bromley (2008) Kenyon S. J., Bromley B. C., 2008, ApJS, 179, 451
- King (1962) King I., 1962, AJ, 67, 471
- Kobayashi & Löhne (2014) Kobayashi H., Löhne T., 2014, MNRAS, 442, 3266
- Koester et al. (2014) Koester, D., Gänsicke, B. T., & Farihi, J. 2014, A&A, 566, A34
- Kokubo, Yoshinaga & Makino (1998) Kokubo E., Yoshinaga K., Makino J., 1998, MNRAS, 297, 1067
- Krivov et al. (2013) Krivov, A. V., Eiroa, C., Löhne, T., et al. 2013, ApJ, 772, 32
- Krivov et al. (2018) Krivov A. V., Ide A., Löhne T., Johansen A., Blum J., 2018, MNRAS, 474, 2564
- Kunitomo et al. (2011) Kunitomo, M., Ikoma, M., Sato, B., Katsuta, Y., & Ida, S. 2011, ApJ, 737, 66
- Kroupa (2001) Kroupa P., 2001, MNRAS, 322, 231
- Laskar & Gastineau (2009) Laskar, J., & Gastineau, M. 2009, Nature, 459, 817
- Lawler et al. (2017) Lawler S. M., Shankman C., Kaib N., Bannister M. T., Gladman B., Kavelaars J. J., 2017, AJ, 153, 33
- Leão et al. (2018) Leão, I. C., Canto Martins, B. L., Alves, S., et al. 2018, A&A, 620, A139
- Li et al. (2019) Li, D., Mustill, A. J., & Davies, M. B. 2019, MNRAS, 488, 1366
- Liou & Kaufmann (2008) Liou, J.-C., & Kaufmann, D. E. 2008, The Solar System Beyond Neptune, 425
- Löhne et al. (2008) Löhne, T., Krivov, A. V., & Rodmann, J. 2008, ApJ, 673, 1123
- Madappatt et al. (2016) Madappatt, N., De Marco, O., & Villaver, E. 2016, MNRAS, 463, 1040
- Makarov & Veras (2019) Makarov, V. V., & Veras, D. 2019, ApJ, 886, 127
- Malamud & Perets (2020) Malamud, U., & Perets, H. B. 2020, MNRAS, 129
- Malhotra (1993) Malhotra, R. 1993, Nature, 365, 819
- Malmberg et al. (2007) Malmberg, D., de Angeli, F., Davies, M. B., et al. 2007, MNRAS, 378, 1207
- Malmberg et al. (2011) Malmberg, D., Davies, M. B., & Heggie, D. C. 2011, MNRAS, 411, 859
- Mann et al. (2017) Mann, A. W., Gaidos, E., Vanderburg, A., et al. 2017, AJ, 153, 64
- Manser et al. (2019) Manser, C. J., Gänsicke, B. T., Eggl, S., et al. 2019, Science, 364, 66
- Marois et al. (2008) Marois, C., Macintosh, B., Barman, T., et al. 2008, Science, 322, 1348
- Marois et al. (2010) Marois, C., Zuckerman, B., Konopacky, Q. M., et al. 2010, Nature, 468, 1080
- Martin et al. (2020) Martin, R. G., Livio, M., Smallwood, J. L., et al. 2020, MNRAS, In Press
- McGlynn & Chapman (1989) McGlynn, T. A., & Chapman, R. D. 1989, ApJL, 346, L105
- McMillan et al. (2012) McMillan S., Portegies Zwart S., van Elteren A., Whitehead A., 2012, in Capuzzo-Dolcetta R., Limongi M., Tornambe‘ A., eds, ASP Conf. Ser. Vol. 453, Advances in Computational Astrophysics: Methods, Tools, and Outcome. Astron. Soc. Pac., San Francisco, p. 129
- Meech et al. (2017) Meech, K. J., Weryk, R., Micheli, M., et al. 2017, Nature, 552, 378
- Mestel (1952) Mestel, L. 1952, MNRAS, 112, 583
- Miller (1964) Miller R. H., 1964, ApJ, 140, 250
- Milone et al. (2012) Milone, A. P., Piotto, G., Bedin, L. R., et al. 2012, A&A, 540, A16
- Minchev et al. (2013) Minchev, I., Chiappini, C., & Martig, M. 2013, A&A, 558, A9
- Minchev et al. (2018) Minchev, I., Anders, F., Recio-Blanco, A., et al. 2018, MNRAS, 481, 1645
- Moore et al. (2016) Moore, J. M., McKinnon, W. B., Spencer, J. R., et al. 2016, Science, 351, 1284
- Morbidelli et al. (2007) Morbidelli, A., Tsiganis, K., Crida, A., et al. 2007, AJ, 134, 1790
- Morbidelli et al. (2018) Morbidelli, A., Nesvorny, D., Laurenz, V., et al. 2018, Icarus, 305, 262
- Morbidelli & Nesvorny (2019) Morbidelli, A., & Nesvorny, D. 2019, arXiv:1904.02980, Review chapter to be published in the book “The Transneptunian Solar System”, Eds: Dina Prialnik, Maria Antonietta Barucci, Leslie Young, Elsevier
- Moro-Martín et al. (2009) Moro-Martín, A., Turner, E. L., & Loeb, A. 2009, ApJ, 704, 733
- Moro-Martín (2018) Moro-Martín, A. 2018, ApJ, 866, 131
- Moro-Martín (2019) Moro-Martín, A. 2019, AJ, 157, 86
- Mustill & Villaver (2012) Mustill, A. J., & Villaver, E. 2012, ApJ, 761, 121
- Mustill et al. (2013) Mustill, A. J., Marshall, J. P., Villaver, E., et al. 2013, MNRAS, 436, 2515
- Mustill et al. (2014) Mustill, A. J., Veras, D., & Villaver, E. 2014, MNRAS, 437, 1404
- Mustill et al. (2018) Mustill, A. J., Villaver, E., Veras, D., Gänsicke, B. T., Bonsor, A. 2018, MNRAS, 476, 3939.
- Nesvorný et al. (2011) Nesvorný, D., Vokrouhlický, D., Bottke, W. F., et al. 2011, AJ, 141, 159
- Nesvorný & Morbidelli (2012) Nesvorný, D., & Morbidelli, A. 2012, AJ, 144, 117
- Nesvorný & Vokrouhlický (2016) Nesvorný, D., & Vokrouhlický, D. 2016, ApJ, 825, 94
- Nesvorný (2018) Nesvorný, D. 2018, ARA&A, 56, 137
- Nesvorný et al. (2019) Nesvorný, D., Li, R., Youdin, A. N., et al. 2019, Nature Astronomy, 3, 808
- Nicholson et al. (2019) Nicholson, R. B., Parker, R. J., Church, R. P., et al. 2019, MNRAS, 485, 4893
- Nordhaus & Spiegel (2013) Nordhaus, J., & Spiegel, D. S. 2013, MNRAS, 432, 500
- Öberg & Wordsworth (2019) Öberg, K. I., & Wordsworth, R. 2019, AJ, 158, 194
- Omarov (1962) Omarov, T. B. 1962, Izv. Astrofiz. Inst. Acad. Nauk. KazSSR, 14, 66
- ’Oumuamua ISSI Team et al. (2019) ’Oumuamua ISSI Team, Bannister, M. T., Bhandare, A., et al. 2019, Nature Astronomy, 3, 594
- Parker (2015) Parker, A. H. 2015, Icarus, 247, 112
- Parravano et al. (2011) Parravano, A., McKee, C. F., & Hollenbach, D. J. 2011, ApJ, 726, 27
- Pascucci & Tachibana (2010) Pascucci, I., & Tachibana, S. 2010, Protoplanetary Dust: Astrophysical and Cosmochemical Perspectives, 263
- Pelupessy et al. (2013) Pelupessy F. I., van Elteren A., de Vries N., McMillan S. L. W., Drost N., Portegies Zwart S. F., 2013, A&A ,557, A84
- Petrovich & Muñoz (2017) Petrovich, C., & Muñoz, D. J. 2017, ApJ, 834, 116
- Pfalzner et al. (2018) Pfalzner, S., Bhandare, A., Vincke, K., et al. 2018, ApJ, 863, 45
- Pirani et al. (2019) Pirani, S., Johansen, A., Bitsch, B., et al. 2019, A&A, 623, A169
- Plummer (1911) Plummer H. C., 1911, MNRAS, 71, 460
- Polishook et al. (2017) Polishook, D., Moskovitz, N., Thirouin, A., et al. 2017, Icarus, 297, 126
- Portegies Zwart (2009) Portegies Zwart S. F., 2009, ApJL, 696, L13
- Portegies Zwart et al. (2011) AMUSE: Astrophysical Multipurpose Software Environment, Astrophysics Source Code Library, record (ascl:1107.007)
- Portegies Zwart (2013) Portegies Zwart, S. 2013, MNRAS, 429, L45
- Portegies Zwart & Jílková (2015) Portegies Zwart S. F., Jílková L., 2015, MNRAS, 451, 144
- Portegies Zwart et al. (2018) Portegies Zwart S., Torres S., Pelupessy I., Bédorf J., Cai M. X., 2018, MNRAS, 479, L17
- Portegies Zwart et al. (2018) Portegies Zwart, S., Torres, S., Pelupessy, I., et al. 2018, MNRAS, 479, L17
- Portegies Zwart (2019) Portegies Zwart S., 2019, A&A, 622, A69
- Portell de Mora et al. (2011) Portell de Mora J., García-Berro E., Estepa C., Castañeda J., Clotet M., 2011, SPIE, 818305, SPIE.8183
- Punzo, Capuzzo-Dolcetta & Portegies Zwart, (2014) Punzo D., Capuzzo-Dolcetta R., Portegies Zwart S., 2014, MNRAS, 444, 2808
- Quinlan & Tremaine (1992) Quinlan G. D., Tremaine S., 1992, MNRAS, 259, 505
- Rafikov (2018) Rafikov, R. R. 2018, ApJ, 861, 35
- Raghavan et al. (2010) Raghavan, D., McAlister, H. A., Henry, T. J., et al. 2010, ApJS, 190, 1
- Rein & Liu (2012) Rein H., Liu S.-F., 2012, A&A, 537, A128
- Rao et al. (2018) Rao S., et al., 2018, A&A, 618, A18
- Rappaport et al. (2018) Rappaport, S., Vanderburg, A., Jacobs, T., et al. 2018, MNRAS, 474, 1453
- Raymond et al. (2018a) Raymond, S. N., Armitage, P. J., Veras, D., et al. 2018a, MNRAS, 476, 3031
- Raymond et al. (2018b) Raymond, S. N., Armitage, P. J., & Veras, D. 2018b, ApJL, 856, L7
- Schröder & Smith (2008) Schröder, K.-P., & Smith, R.C. 2008, MNRAS, 386, 155
- Sellwood & Binney (2002) Sellwood, J. A., & Binney, J. J. 2002, MNRAS, 336, 785
- Shannon & Wu (2011) Shannon, A., & Wu, Y. 2011, ApJ, 739, 36
- Shannon et al. (2015) Shannon, A., Jackson, A. P., Veras, D., et al. 2015, MNRAS, 446, 2059
- Shannon & Dawson (2018) Shannon A., & Dawson R., 2018, MNRAS, 480, 1870
- Shannon et al. (2019) Shannon, A., Jackson, A. P., & Wyatt, M. C. 2019, MNRAS, 485, 5511
- Shara et al. (2016) Shara, M. M., Hurley, J. R., & Mardling, R. A. 2016, ApJ, 816, 59
- Sibthorpe et al. (2018) Sibthorpe, B., Kennedy, G. M., Wyatt, M. C., et al. 2018, MNRAS, 475, 3046
- Silsbee & Tremaine (2018) Silsbee, K., & Tremaine, S. 2018, AJ, 155, 75
- Smallwood et al. (2018) Smallwood, J. L., Martin, R. G., Livio, M., & Lubow, S. H. 2018, MNRAS, 480, 57
- Smallwood et al. (2019) Smallwood, J. L., Martin, R. G., Livio, M., Lubow, S. H., & Veras, D. 2019, Submitted to MNRAS
- Spurzem (1999) Spurzem R., 1999, J. Comput. Appl. Math., 109, 407
- Spurzem, et al. (2009) Spurzem R., Giersz M., Heggie D. C., Lin D. N. C., 2009, ApJ, 697, 458
- Staff et al. (2016) Staff, J. E., De Marco, O., Wood, P., Galaviz, P., & Passy, J.-C. 2016, MNRAS, 458, 832
- Stern (1990) Stern, S. A. 1990, PASP, 102, 793
- Stern et al. (2015) Stern, S. A., Bagenal, F., Ennico, K., et al. 2015, Science, 350, aad1815
- Stern et al. (2019) Stern, S. A., Weaver, H. A., Spencer, J. R., et al. 2019, Science, 364, aaw9771
- Stone et al. (2015) Stone, N., Metzger, B. D., & Loeb, A. 2015, MNRAS, 448, 188
- Sun et al. (2018) Sun M., Arras P., Weinberg N. N., Troup N. W., Majewski S. R., 2018, MNRAS, 481, 4077
- Swan et al. (2019a) Swan, A., Farihi, J., & Wilson, T. G. 2019a, MNRAS, 484, L109
- Swan et al. (2019b) Swan, A., Farihi, J., Koester, D., et al. 2019b, MNRAS, 490, 202
- Tapamo (2009) Tapamo H., 2009, in Gracia J., de Colle F., Downes T., eds, Lecture Notes in Physics, Vol. 791, Jets From Young Stars V. Springer Verlag , Berlin, p. 3
- Thommes et al. (2002) Thommes, E. W., Duncan, M. J., & Levison, H. F. 2002, AJ, 123, 2862
- Tiscareno & Malhotra (2009) Tiscareno, M. S., & Malhotra, R. 2009, AJ, 138, 827
- Torres et al. (2019) Torres, S., Cai, M. X., Brown, A. G. A., et al. 2019, A&A, 629, A139
- Tsiganis et al. (2005) Tsiganis, K., Gomes, R., Morbidelli, A., et al. 2005, Nature, 435, 459
- van Elteren et al. (2019) van Elteren, A., Portegies Zwart, S., Pelupessy, I., et al. 2019, A&A, 624, A120
- Vanderbosch et al. (2019) Vanderbosch, Z., Hermes, J. J., Dennihy, E., et al. 2019, Submitted to ApJL, arXiv:1908.09839
- Vanderburg et al. (2015) Vanderburg, A., Johnson, J. A., Rappaport, S., et al. 2015, Nature, 526, 546
- Veras & Armitage (2004) Veras, D., & Armitage, P. J. 2004, MNRAS, 347, 613
- Veras et al. (2011) Veras, D., Wyatt, M. C., Mustill, A. J., Bonsor, A., & Eldridge, J. J. 2011, MNRAS, 417, 2104
- Veras & Moeckel (2012) Veras, D., & Moeckel, N. 2012, MNRAS, 425, 680
- Veras & Wyatt (2012) Veras, D., & Wyatt, M. C. 2012, MNRAS, 421, 2969
- Veras et al. (2013a) Veras, D., Hadjidemetriou, J. D., & Tout, C. A. 2013a, MNRAS, 435, 2416
- Veras et al. (2013b) Veras, D., Mustill, A. J., Bonsor, A., & Wyatt, M. C. 2013b, MNRAS, 431, 1686
- Veras & Evans (2013a) Veras, D., & Evans, N. W. 2013a, MNRAS, 430, 403
- Veras & Evans (2013b) Veras, D., & Evans, N. W. 2013b, CeMDA, 115, 123
- Veras et al. (2014a) Veras, D., Jacobson, S. A., Gänsicke, B. T. 2014a, MNRAS, 445, 2794
- Veras et al. (2014b) Veras, D., Shannon, A., Gänsicke, B. T. 2014b, MNRAS, 445, 4175
- Veras et al. (2014c) Veras, D., Evans, N. W., Wyatt, M. C., & Tout, C. A. 2014c, MNRAS, 437, 1127
- Veras & Gänsicke (2015) Veras, D., Gänsicke, B. T. 2015, MNRAS, 447, 1049
- Veras et al. (2015a) Veras, D., Eggl, S., Gänsicke, B. T. 2015a, MNRAS, 452, 1945
- Veras et al. (2015b) Veras, D., Eggl, S., Gänsicke, B. T. 2015b, MNRAS, 451, 2814
- Veras et al. (2015c) Veras, D., Leinhardt, Z. M., Eggl, S., Gänsicke, B. T. 2015c, MNRAS, 451, 3453
- Veras (2016a) Veras, D. 2016a, Royal Society Open Science, 3, 150571
- Veras (2016b) Veras, D. 2016b, MNRAS, 463, 2958
- Veras et al. (2016a) Veras, D., Marsh, T. M., Gänsicke, B. T. 2016a, MNRAS, 461, 1413
- Veras et al. (2016b) Veras, D., Mustill, A. J., Gänsicke, B. T., et al. 2016b, MNRAS, 458, 3942
- Veras et al. (2017a) Veras, D., Carter, P. J., Leinhardt, Z. M., & Gänsicke, B. T. 2017a, MNRAS, 465, 1008
- Veras et al. (2017b) Veras, D., Georgakarakos, N., Dobbs-Dixon, I., & Gänsicke, B. T. 2017b, MNRAS, 465, 2053
- Veras et al. (2018) Veras D., Georgakarakos N., Gänsicke B. T., Dobbs-Dixon I., 2018, MNRAS, 481, 2180
- Veras et al. (2019) Veras, D., Higuchi, A., & Ida, S. 2019, MNRAS, 485, 708
- Veras & Scheeres (2020) Veras, D., Scheeres, D., 2020, MNRAS, 492, 2437
- Veras et al. (2020a) Veras, D., McDonald, C. H., & Makarov, V. V. 2020a, MNRAS, 492, 5291
- Veras et al. (2020b) Veras, D., Tremblay, P.-E., Hermes, J. J., et al. 2020b, MNRAS In Press, arXiv:2001.08757
- Villaver et al. (2014) Villaver, E., Livio, M., Mustill, A. J., & Siess, L. 2014, ApJ, 794, 3
- Vokrouhlický et al. (2015) Vokrouhlický, D., Bottke, W. F., Chesley, S. R., et al. 2015, Asteroids IV, 509
- Volk & Malhotra (2019) Volk, K., & Malhotra, R. 2019, AJ, 158, 64
- Wang et al. (2015) Wang L., Spurzem R., Aarseth S., Nitadori K., Berczik P., Kouwenhoven M. B. N., Naab T., 2015b, MNRAS, 450, 4070
- Wang et al. (2016) Wang L., Spurzem R., Aarseth S.,Giersz M., Askar A., Berczik P., Naab T., Schadow R., Kouwenhoven M. B. N., 2016, MNRAS, 458, 1450
- Wang et al. (2020) Wang, Y.-H., Perna, R., & Leigh, N. W. C. 2020, Submitted to MNRAS, arXiv:2002.05727
- Warner et al. (2009) Warner, B. D., Harris, A. W, Pravec, P. 2009, Icarus, 202, 134
- Weissman & Levison (1997) Weissman, P. R., & Levison, H. F. 1997, ApJL, 488, L133
- Welsh & Montgomery (2015) Welsh, B. Y., & Montgomery, S. L. 2015, Advances in Astronomy, 2015, 980323
- Williams & Cieza (2011) Williams, J. P., & Cieza, L. A. 2011, ARA&A, 49, 67
- Williams (2017) Williams, G. 2017, MPEC, 2017-U181: : Comet C/2017 U1 (PanStarrs). IAU Minor Planet Center https://www.minorplanetcenter.net/mpec/K17/K17UI1.html
- Winter et al. (2018) Winter, A. J., Clarke, C. J., Rosotti, G., et al. 2018, MNRAS, 478, 2700
- Wisdom & Holman (1991) Wisdom, J.; Holman, M., 1991, AJ,102, 1528
- Wolff et al. (2012) Wolff, S., Dawson, R. I., & Murray-Clay, R. A. 2012, ApJ, 746, 171
- Wyatt et al. (2007) Wyatt, M. C., Smith, R., Su, K. Y. L., et al. 2007, ApJ, 663, 365
- Wyatt et al. (2014) Wyatt, M. C., Farihi, J., Pringle, J. E., & Bonsor, A. 2014, MNRAS, 439, 3371
- Wyatt et al. (2017) Wyatt, M. C., Bonsor, A., Jackson, A. P., et al. 2017, MNRAS, 464, 3385
- Xu et al. (2017) Xu, S., Zuckerman, B., Dufour, P., et al. 2017, ApJ, 836, L7
- Xu et al. (2019) Xu, S., Dufour, P., Klein, B., et al. 2019, AJ, 158, 242
- Zakamska & Tremaine (2004) Zakamska, N. L., & Tremaine, S. 2004, AJ, 128, 869
- Zeebe (2015) Zeebe, R. E. 2015, ApJ, 798, 8
- Zheng et al. (2015) Zheng, X., Kouwenhoven, M. B. N., & Wang, L. 2015, MNRAS, 453, 2759
- Zotos & Veras (2020) Zotos, E.E., Veras, D., Submitted to A&A
- Zuckerman & Becklin (1987) Zuckerman, B., & Becklin, E. E. 1987, Nature, 330, 138
- Zuckerman et al. (2003) Zuckerman, B., Koester, D., Reid, I. N., Hünsch, M. 2003, ApJ, 596, 477
- Zuckerman et al. (2007) Zuckerman, B., Koester, D., Melis, C., Hansen, B. M., & Jura, M. 2007, ApJ, 671, 872
- Zuckerman et al. (2010) Zuckerman, B., Melis, C., Klein, B., Koester, D., & Jura, M. 2010, ApJ, 722, 725