-Bubble Model for Mixed Unit Interval Graphs and its Applications:
The MaxCut Problem Revisited††thanks: Jan Kratochvíl was supported by grant GAČR 19-17314J of the Czech National Science Foundation.
Tomáš Masařík and Jana Novotná received funding from the European
Research Council (ERC) under the European Union’s Horizon 2020
research and innovation programme Grant Agreement 714704, and
from Charles University student grant SVV-2017-260452.
††thanks: An extended abstract of this manuscript will appear at Mathematical Foundations of Computer Science (MFCS) 2020 [29]
Abstract
Interval graphs, intersection graphs of segments on a real line (intervals), play a key role in the study of algorithms and special structural properties. Unit interval graphs, their proper subclass, where each interval has a unit length, has also been extensively studied. We study mixed unit interval graphs—a generalization of unit interval graphs where each interval has still a unit length, but intervals of more than one type (open, closed, semi-closed) are allowed. This small modification captures a much richer class of graphs. In particular, mixed unit interval graphs are not claw-free, compared to unit interval graphs.
Heggernes, Meister, and Papadopoulos defined a representation of unit interval graphs called the bubble model which turned out to be useful in algorithm design. We extend this model to the class of mixed unit interval graphs and demonstrate the advantages of this generalized model by providing a subexponential-time algorithm for solving the MaxCut problem on mixed unit interval graphs. In addition, we derive a polynomial-time algorithm for certain subclasses of mixed unit interval graphs. We point out a substantial mistake in the proof of the polynomiality of the MaxCut problem on unit interval graphs by Boyaci, Ekim, and Shalom (2017). Hence, the time complexity of this problem on unit interval graphs remains open. We further provide a better algorithmic upper-bound on the clique-width of mixed unit interval graphs. Clique-width is one of the most general structural graph parameters, where a large group of natural problems is still solvable in the tractable time when an efficient representation is given. Unfortunately, the exact computation of the clique-width representation is -hard. Therefore, good upper-bounds on clique-width are highly appreciated, in particular, when such a bound is algorithmic.
20(0, 12)
![]() {textblock}20(-0.25, 12.9)
{textblock}20(-0.25, 12.9)
![]()
1 Introduction
A graph is an intersection graph if there exists a family of nonempty sets such that for each vertex in , a set is assigned in a way that there is an edge in if and only if .
We say that has an -intersection representation.
Any graph can be represented as an intersection graph since per each vertex, we can use the set of its incident edges. However, many important graph classes can be described as intersection graphs with a restricted family of sets. Depending on the geometrical representation, different types of intersection graphs are defined, for instance, interval, circular-arc, disk graphs, etc.
Interval graphs are intersection graphs of segments of the real line, called intervals.
Such a representation is being referred to as interval representation.
They have been a well known and widely studied class of graphs from both the theoretical and the algorithmic points of view since 1957.
They were first mentioned independently in combinatorics (Hajos, 1957 [22, 9]) and genetics (Benzer, 1959 [3]).
Interval graphs have a nice structure, they are chordal and, therefore, also perfect which provides a variety of graph decompositions and models. Such properties are often useful tools for the algorithm design—the most common algorithms on them are based on dynamic programming.
Therefore, many classical -hard problems are polynomial-time solvable on interval graphs,
for instance Hamiltonian cycle (Keil 1985 [27]), Graph isomorphism (Booth, 1976 [6]) or Colorability (Golumbic, 1980 [19]) are solvable even in linear time.
Surprisingly, the complexity of some well-studied problems is still unknown despite extensive research, e.g. the -labeling problem, or the packing coloring problem.
Interval graphs have many real applications in diverse areas including genetics [3], economics, and archaeology [36, 37].
According to Golumbic [19], many real-world applications involve solving problems on graphs which are either interval graphs themselves or are related to interval graphs in a natural way.
An important subclass of interval graphs is the class of proper interval graphs, graphs which can be represented by such an interval representation that no interval properly contains another one. Another interval representation is a representation with intervals (of the same type) of only unit lengths, graphs which have such a representation are called unit interval graphs.
Roberts proved in 1969 [35] that a graph is a proper interval graph if and only if it is a unit interval graph.
Later, Gardi came up with a constructive combinatorial proof [17].
The mentioned results do not specifically care about what types of intervals (open, closed, semi-closed) are used in the interval representation.
However, as far as there are no restrictions on lengths of intervals, it does not matter which types of intervals are used [39].
The same applies if there is only one type of interval in the interval representation.
However, this is not true when all intervals in the interval representation have unit length and at least two types of intervals are used.
In particular, the claw can be represented using one open interval and three closed intervals.
Recently, it has been observed that a restriction on different types of intervals in the unit interval representation leads to several new subclasses of interval graphs.
We denote the set of all open, closed, open-closed, and closed-open intervals of unit length by , , and , respectively.
Let be the set of all types of unit intervals.
Although there are 16 different combinations of types of unit intervals, it was shown in [13, 34, 39, 25, 40] in the years 2012–2018 that they form only four different classes of mixed unit interval graphs.
In particular, the following closure holds:
where unit open and closed interval graphs have -representation, semi-mixed unit interval graphs have -representation, and mixed unit interval graphs have -representation. Hence, mixed unit interval graphs allow all types of intervals of unit length.
Definition 1.
A graph is a mixed unit interval graph if it has a -intersection representation. We call such representation a mixed unit interval representation.
There are lots of characterizations of interval and unit interval graphs. Among many of the characterizations, we single out a matrix-like representation called bubble model [23]. A similar notion was independently discovered by Lozin [31] under the name canonical partition. In the bubble model, vertices of a unit interval graph are placed into a “matrix” where each matrix entry may contain more vertices as well as it can be empty. Edges of are represented implicitly with quite strong conditions: each column forms a clique; and in addition, edges are only between consecutive columns where they form nested neighborhood (two vertices and from consecutive columns are adjacent if and only if occurs in a higher row than ). In particular, there are no edges between non-consecutive columns. This representation can be computed and stored in linear space given a proper interval ordering representation.
We introduce a similar representation of mixed unit interval graphs, called -bubble model, and we extend some results from unit interval graphs to mixed unit interval graphs using this representation. The representation has almost the same structure as the original bubble model, except that edges are allowed in the same row under specific conditions. We show that a graph is a mixed unit interval graph if and only if it can be represented by a -bubble model.
Theorem 1.
A graph is a mixed unit interval graph if and only if it has a -bubble model. Moreover, given a mixed unit interval representation of graph on vertices, a -bubble model can be constructed in time.
In addition, we show properties of our model, such as the relation of the size of a maximum independent set or maximum clique, and the size of the model, see Subsection 2.6.
Given a graph , the MaxCut problem is a problem of finding a partition of vertices of into two sets and such that the number of edges with one endpoint in and the other one in is maximum among all partitions. There were two results about polynomiality of the MaxCut problem in unit interval graphs in the past years; the first one by Bodlaender, Kloks, and Niedermeier in 1999 [5], the second one by Boyaci, Ekim, and Shalom which has been published in 2017 [7]. The result of the first paper was disproved by authors themselves a few years later [4]. In the second paper, the authors used a bubble model for proving the polynomiality. However, we realized that this algorithm is also incorrect. Moreover, it seems to us to be hardly repairable. We provide further discussion and also a concrete example, in Subsection 3.2. The complexity of the MaxCut problem in interval graphs was surprisingly unknown for a long time. Interestingly, a result about -completeness by Adhikary, Bose, Mukherjee, and Roy has appeared on arXiv [1] very recently111After the submission of the conference version of this paper..
Using the -bubble model, we obtain at least a subexponential-time algorithm for MaxCut in mixed unit interval graphs. We are not aware of any subexponential algorithms on interval graphs. In general graphs, there has been extensive research dedicated to approximation of MaxCut in subexponential time, see e.g. [2] or [24]. Furthermore, we obtain a polynomial-time algorithm if the given graph has a -bubble model with a constant number of columns. This extends a result by Boyaci, Ekim, and Shalom [8] who showed a polynomial-time algorithm for MaxCut on unit interval graphs which have a bubble model with two columns (also called co-bipartite chain graphs). The question of whether the MaxCut problem is polynomial-time solvable or -hard in unit interval graphs still remains open.
Theorem 2.
Let be a mixed unit interval graph. The maximum cardinality cut can be found in time
Corollary 3.
The size of a maximum cut in the graph class defined by -bubble models with columns can be determined in the time . Moreover, for in time .
he third part of the paper is devoted to clique-width, one of the graph parameters that is used to measure the complexity of a graph. Many -hard problems can be solved efficiently on graphs with bounded clique-width [11]. In general, it is -complete to compute the exact value of clique-width. Furthermore, it is -complete even to decide if the graph has clique-width at most for a given number , see [15].
Unit interval graphs are known to have unbounded clique-width [20]. It follows from results by Fellows, Rosamond, Rotics, and Szeider [14], and Kaplan and Shamir [26] that the clique-width of (mixed) unit interval graphs is upper-bounded by (the maximum size of their clique) . Heggernes, Meister, and Papadopoulos [23] improved this result for unit interval graphs using the bubble model. There, the clique-width is upper-bounded by a minimum of (the maximum size of an independent set) + 1, and a parameter related to the bubble model representation which is in the worst case . We use similar ideas to extend these bounds to mixed unit interval graphs using the -bubble model. In particular, we obtain that the upper-bound on clique-width is the minimum of the analogously defined parameter for a -bubble model and . The upper-bound is still in the worst case . The upper-bound can be also expressed in the number of rows or columns of -bubble model. Refer to Theorem 21 and Corollary 22 in Section 4 for further details. As a consequence, we obtain an analogous result to Corollary 3 for rows using the following result. Fomin, Golovach, Lokshtanov, and Saurabh [16] showed that the MaxCut problem can be solved in time where is clique-width of the input graph. By the combination of their result and our upper-bounds on clique-width (Theorem 21 in Section 4) we derive not only polynomial-time algorithm when the number of columns is bounded (with worse running time) but also a polynomial-time algorithm when the number of rows is bounded, formulated as Corollary 4.
Corollary 4.
The size of a maximum cut in the graph class defined by -bubble models with rows can be determined in the time .
1.1 Preliminaries and Notation
By a graph we mean a finite, undirected graph without loops and multiedges. Let be a graph. We denote by and the vertex and edge set of , respectively; with and . Let and denote the maximum size of an independent set of and the maximum size of a clique in , respectively. By a family we mean a multiset which allows the possibility that even though .
Let be real numbers. We call the set closed interval , the set open interval , the set open-closed interval , and the set closed-open interval . By semi-closed interval we mean interval which is open-closed or closed-open. We denote the set of all open, closed, open-closed, and closed-open intervals of unit length by , , and , respectively. Formally, and We further denote the set of all unit intervals by
From now on, we will be speaking only about unit intervals.
Let be an interval, we define the left and right end of as and , respectively. Let be unit intervals, are almost twins if The type of an interval is a pair where
Let be a graph and an interval representation of . Let be represented by an interval , where , in . The type of a vertex in , denoted by , is the pair . We use if it is clear which interval representation we have in mind. We follow the standard approach where the maximum over the empty set is . The notion of denotes the standard “big 0” notion which ignores polylogarithmic factors, i.e, , where is a constant.
1.1.1 Recognition and -representation of mixed unit interval graphs
All the classes of mixed unit interval graphs can be characterized using forbidden induced subgraphs, sometimes by infinitely many. Rautenbach and Szwarcfiter [34] gave a characterization of -graphs using five forbidden induced subgraphs. Joos [25] gave a characterization of mixed unit interval graphs without twins by an infinite class of forbidden induced subgraphs. Shuchat, Shull, Trenk, and West [39] proved independently also this characterization, moreover, they complemented it by a quadratic-time algorithm that produces a mixed proper interval representation. Finally, Kratochvíl and Talon [40] characterized the remaining classes.
Le and Rautenbach [30] characterized graphs that have a mixed unit interval representations in which all intervals have integer endpoints, and provided a quadratic-time algorithm that decides whether a given interval graph admits such a representation.
We refer the reader to the original papers for more details and concrete forbidden subgraphs.
Moreover, there are nice structural results of the subclasses of mixed unit interval graphs. For example, it is shown in [34] that for -intersection representations, open intervals are only really needed to represent claws, in particular, for any -graph there exist a -representation such that for every open interval, there is a closed interval with the same endpoints. More structural results can be found in [40].
Theorem 5 ([40]).
The classes of semi-mixed and mixed unit interval graphs can be recognized in time . Moreover, there exists an algorithm which takes a graph on input, and outputs a corresponding -representation of in time .
Corollary 6 ([40]).
It is possible to modify the algorithm for semi-mixed unit interval graphs such that given a mixed unit interval graph , it outputs a mixed unit interval representation of in time .
2 Bubble model for mixed unit interval graphs
In this section, we present a -bubble model, a new representation of mixed unit interval graphs which is inspired by the notion of bubble model for proper interval graphs created by Heggernes, Meister, and Papadopoulos [23] in 2009.
2.1 Definition of bubble model
First, we present the bubble model for proper interval graphs as it was introduced by Heggernes et al.
Definition 2 (Heggernes et al. [23], reformulated).
If is a finite non-empty set, then a 2-dimensional bubble structure for is a partition , where for every with and , and are pairwise disjoint. The graph given by , denoted as , is defined as follows:
-
1.
has a vertex for every element in , and
-
2.
is an edge of if and only if there are indices such that , and one of the two conditions holds: either or .
A bubble model for a graph is a 2-dimensional bubble structure for such that
Theorem 7 (Heggernes et al. [23]).
A graph is a proper interval graph if and only if it has a bubble model.
We define a similar matrix-type structure for mixed unit interval graphs where each set is split into four parts and edges are allowed also in the same row under specific conditions.
Definition 3.
Let be a finite non-empty set and be a 2-dimensional bubble structure for such that , are pairwise disjoint, and for every and with and . We call the partition a 2-dimensional -bubble structure for .
We call each set a bubble, and each set a quadrant of the bubble . The type of a quadrant , , is the pair . We denote by both and , for example . Bubbles with the same -index form a row of , and with the same -index a column of , we say vertices from bubbles appear in row , and we denote as their row-index. We define an analogous notion for columns. We denote the index of the first row with a non-empty bubble as . Thus, is the first non-empty bubble in the column . Let be a bubble, then and is the row-index and column-index of , respectively. Let , ; we say that is under than and is above if .
Definition 4.
Let be a 2-dimensional -bubble structure for . The graph given by , denoted as , is defined as follows:
-
1.
,
-
2.
is an edge of if and only if there are indices such that , or , , and one of the three conditions holds:
-
(a)
, or
-
(b)
and , or
-
(c)
and and .
-
(a)
The definition says that the edges are only between vertices from the same or consecutive columns and if and , there is an edge between and if and only if is lower than (), or they are in the same row and .
Observation 8.
Vertices from the same column form a clique, as well as vertices from the same bubble. Moreover, vertices from the same bubble are almost-twins and their neighborhoods can differ only in the same row, anywhere else they behave like twins. Vertices from the same bubble quadrant are true twins.
Definition 5.
Let be a graph. A -bubble model for a graph is a 2-dimensional -bubble structure for such that
-
(i)
is isomorphic to , and
-
(ii)
each column and each row contains a non-empty bubble, and
-
(iii)
no column ends with an empty bubble, and
-
(iv)
, and for every
For a -bubble model , by the number of rows of we mean . We define the size of the -bubble model as the number of columns multiplied by the number of rows, i.e.,
See Figure 1 with an example of a mixed unit interval graph, given by a mixed unit interval representation, and by a -bubble model.
2.2 Construction of -bubble model
First, we construct a mixed unit interval representation of a graph using the quadratic-time algorithm see Corollary 6; then each vertex of is represented by a corresponding interval in . Having a mixed unit interval representation of the graph, our algorithm outputs a -bubble model for the graph in time.
Given a mixed unit interval representation , we put all intervals (vertices) that are almost-twins in into a single bubble, to the particular quadrant which corresponds by its type to the type of the interval. From now on, we speak about bubbles only, we denote the set of all such bubbles by . We are going to determine their place (row and column) to create a 2-dimensional -bubble structure for . We show that the -bubble structure is a -bubble model for our graph. Based on the order by endpoints of intervals in the representation from left to right, we obtain the same order on bubbles in . The idea of the algorithm is to process the bubbles in the order , and assign to each bubble its column immediately after processing it. During the processing, the algorithm maintains an auxiliary path in order to assign rows at the end. Thus, rows are assigned to each bubble after all bubbles are processed.
For bubbles , denotes that is smaller than in order We denote the order of bubbles by subscripts, i.e., are all bubbles in the described order . For technical reasons, we create two new bubbles: , such that . We refer to them as auxiliary bubbles, in particular, if we speak about bubbles, we exclude auxiliary bubbles. We enhance the representation in a way that each bubble has a pointer defined as follows.
In order to set rows at the end, the algorithm is creating a single oriented path that has the necessary information about the height of elements in the -bubble structure being constructed. Some of the arcs of the path can be marked with level indicator (). For ease of notation, we use to say that is the next element on path after . Note that we can view as an order of bubbles; we denote by , the information that occurs earlier than on . Also from technical reasons, starts and ends with and , respectively. Except and pointers and , the algorithm remembers the highest bubble of column , denoted by . Also, denote by , the index of the currently processed column.
Now, we are able to state the algorithm for assigning columns and rows to bubbles in and its properties which will be useful for showing the correctness.
-
Property 1:
Bubbles are processed (and therefore added somewhere to ) one by one respecting the order .
-
Property 2:
The order induced by of already processed vertices never changes, i.e., once then for the rest of the algorithm.
-
Property 3:
The arc of between bubbles and has the level indicator () if and only if . Moreover, if the arc from to has level indicator, then .
-
Property 4:
whenever .
-
Property 5:
is the closest ancestor of on in the previous column, i.e., .
-
Property 6:
The order induced by of vertices in the same column is exactly the order of those vertices induced by .
2.3 Algorithm
Given bubbles in ordered by , the algorithm creates by processing bubbles one by one in order . The algorithm outputs a row and a column to each bubble. Initially, set , , =1 and .
Suppose that bubbles have been already processed, for . Split the cases of processing bubble based on the following possibilities:
-
i.
: First increase by one, then set and .
-
ii.
: First increase by one, then set and . Let be . Substitute arc in from to with two new arcs to that has indicator set and from to .
-
iii.
: Set .
We continue only with cases i. and iii. and distinguish multiple possibilities:
-
1.
: Let be . Then substitute arc in from to with two new arcs to that has indicator set and from to .
-
2.
: And split this case further based on the properties of .
-
2a.
: Let be . Substitute arc in from to with two new arcs to and from to .
-
2b.
: Let be . Then substitute arc in from to with two new arcs to and from to .
-
2a.
Now, assign rows to bubbles by a single run over , inductively: Take the first bubble of and assign . Let be the last bubble on with already set row index. We are about to determine . If arc in from to has indicator, set , otherwise .
2.4 Correctness
Here, we show that the algorithm above gives us a -bubble model for a graph given by mixed unit interval representation. It gives us the forward implication of Theorem 1.
Lemma 9.
Given a mixed unit interval representation of a connected graph on vertices, the -bubble model can be constructed in time.
Proof of Lemma 9.
We show the correctness of the construction, i.e., that the constructed object satisfies Definition 5 and that declared Properties 1-6 are satisfied during the whole algorithm. It follows immediately from the construction that Properties 1–4 are satisfied. Observe that is always in the previous column than , for . Moreover, observe that in step ii. of the algorithm, Then, Property 5 follows from the construction. Property 6 can be seen by examining the construction. Let be two bubbles in the same column such that . Either , then is put later than on . Or , then, by the construction, is put after and is put after . In both cases, . Using Property 2, the Property 6 holds.
Let be the -bubble structure for output by the construction above and be a graph given by . We show that is a -bubble model for . Parts (ii), (iii) from Definition 4 are clearly satisfied. It remains to show (i) and (iv).
Let us start with (i), that is is isomorphic to .
Let , . Recall that if and only if . Since this case is trivially satisfied, without loss of generality, we assume . We distinguish a few cases based on the position of and in .
First, let and be in nonconsecutive columns in . Denote by . By the definition, and are nonadjacent in . By the construction, there exists a nonempty bubble in such that it is the top bubble of column . It follows that , by Property 4, and also . Since the construction assigns to a different column than , we know that . It gives immediate conclusion that are not adjacent in .
Second, let and be in the same column in . Vertices are adjacent by the definition in . By the construction, there exists a nonempty bubble in such that it is the top bubble of the same column and . Therefore, are adjacent in .
Third, let and appear in consecutive columns in . We denote . By the definition, vertices are adjacent in if and only if either , or and . By Properties 1 and 2 of , it is sufficient to verify only the situation when bubble was added. Observe that if then . We split the case into the following all possibilities:
Part (iv) follows by the construction of . When is added on , by Property 5, . Note that . We obtain for every possible . Also note that .
It remains to show the running-time of the algorithm. Note that can be easily computed by a single run over the representation, as well as the assigning columns can be done simultaneously by a single run over the representation (having and remembering top bubbles of columns). Moreover, rows of the vertices are assigned by a single run over path which leads to overall running time where is the number of intervals of the given mixed unit interval representation. ∎
2.5 Proof of Theorem 1
Proof of Theorem 1.
First, we prove the reverse implication: given a -bubble model for a graph , we construct a mixed unit interval representation of . Let be a -bubble model of . Let
We create a mixed unit interval representation of as follows. Let , where . The corresponding interval of has the properties:
Note that all vertices from the same bubble are represented by intervals that are almost twins (they have the same left ends) and the type of an interval corresponds with the type of the bubble quadrant. Since was chosen such that for any row in , the graph given by the constructed mixed unit interval representation is isomorphic to the graph given by .
The forward implication follows from Lemma 9.∎
2.6 Properties of -bubble model
In this section, we give basic properties of a -bubble model which are used later in the text. It is readily seen that a -bubble model of graph has at most rows and columns where is the number of vertices of since each column and each row contains at least one vertex. Consequently, the size of a -bubble model is at most
Two basic characterizations of a graph are the size of a maximum clique and the size of a maximum independent set in the graph. The problem of finding those numbers is -complete in general but it is polynomial-time solvable in interval graphs. We show a relation between those two numbers and the size of a -bubble model for the graph. We start with the size of a maximum independent set.
Lemma 10.
Let be a mixed unit interval graph, and let be a -bubble model for . The number of columns of is at least and at most .
Proof.
Let be a maximum independent set of , and let be the number of columns of . We have that from the property that two non-consecutive columns from are not adjacent in . Since each column forms a clique, only one vertex from each column can be in . Therefore, ∎
In the bubble model for unit interval graphs, is equal to the number of columns [23]. However, the gap in Lemma 10 cannot be narrowed in general—consider an even number and the following unit interval graphs: path on -vertices () and a clique on vertices (). There exists a unit interval representation of using only closed intervals which leads to a -bubble model of containing one row and columns, where . A -bubble model of contains rows and one column, where .
Another important and useful property of graphs is the size of a maximum clique. We show that a maximum clique of a mixed unit interval graph can be found in two consecutive columns of a -bubble model of the graph, see Figure 2.
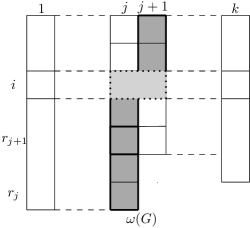
Lemma 11.
Let be a mixed unit interval graph, and let be a -bubble model for . Then the size of a maximum clique is
Proof.
Let be a maximum clique of . Notice, does not contain two vertices from nonconsecutive columns, as there are no edges between nonconsecutive columns. Furthermore, vertices and from two consecutive columns and , respectively, can be in only if is under or they are in the same row in quadrants of types and , respectively.
On the other hand, vertices from one column of create a clique in . Moreover, if we split any two consecutive columns and in row (for any index ), the second part of with the first part of form a clique. This is true even together with bubble quadrants . ∎
3 Maximum cardinality cut
This section is devoted to the time complexity of the MaxCut problem on (mixed) unit interval graphs.
3.1 Notation
A cut of a graph is a partition of into two subsets , where . Since is the complement of , we say for the brevity that a set is a cut and similarly we use terms cut vertex and non-cut vertex for a vertex and , respectively. The cut-set of cut is the set of edges of with exactly one endpoint in , we denote it . Then, the value is the cut size of . A maximum (cardinality) cut on is a cut with the maximum size among all cuts on . We denote the size of a maximum cut of by . Finally, the MaxCut problem is the problem of determining the size of the maximum cut.
3.2 Time complexity is still unknown on unit interval graphs
As it was mentioned in the introduction, there is a paper A polynomial-time algorithm for the maximum cardinality cut problem in proper interval graphs by Boyaci, Ekim, and Shalom from 2017 [7], claiming that the MaxCut problem is polynomial-time solvable in unit interval graphs and giving a dynamic programming algorithm based on the bubble model representation. We realized that the algorithm is incorrect; this section is devoted to it.
We start with a counterexample to the original algorithm.
Example.
Let , where , , , , be a bubble model for a graph , see also Figure 3. In other words, this bubble model corresponds to a unit interval graph on vertices where there is an edge , and vertices create a complete graph without an edge .
Then, according to the paper [7], the size of a maximum cut in is eight. To be more concrete, the algorithm from [7] fills the following values of dynamic table: , for , and finally, which is the output of the algorithm. However, the size of a maximum cut in is only seven. Suppose, for contradiction, that the size of a maximum cut is eight. As there are ten edges in total in , at least one vertex of the triangle must be a cut-vertex and one not. Then, those two vertices have three common neighbors. Therefore, the size of a maximum cut is at most seven which is possible; for example, are cut-vertices.
The brief idea of the algorithm in [7] is to process the columns from the biggest to the lowest column from the top bubble to the bottom one. Once we know the number of cut-vertices in the actual processed bubble (in the column ) and the number of cut-vertices which are above in the columns and , we can count the exact number of edges. For each bubble and each such number of cut-vertices in the columns and (above the bubble), we remember only the best values of MaxCut 222We refer the reader to the paper [7] for the notation and the description of the algorithm..
We claim that the algorithm and its full idea from [7] are incorrect since we lose the consistency there—to obtain a maximum cut, we do not remember anything about the distribution of cut vertices within bubbles, that was used in the previously processed column. Therefore, there is no guarantee that the final outputted cut of the computed size exists. To be more specific, one of two problems is in the moving from the column to the column since we forget there too much. The second problem is that for each bubble and for each possible numbers we count the size of a specific cut and we choose some values , (possibly different; they represents the number of cut-vertices in the bubbles ) which maximize the values of . In few steps later, when we are processing the bubble , again, for each possible values and we choose some values and such that they maximize the size of . However, we need to be consistent with the selection in the previous column, i.e., to guarantee that for any particular values , and .
A straightforward correction of the algorithm would lead to remembering too much for a polynomial-time algorithm. However, we can be inspired by it to obtain a subexponential-time algorithm. We attempted to correct the algorithm or extend the idea leading to the polynomiality. However, despite lots of effort, we were not successful and it seemed to us that the presented algorithm is hardly repairable. We note here, that there is another paper by the same authors [8] where a very similar polynomial algorithm is used for MaxCut of co-bipartite chain graphs with twins. Those graphs can be viewed as graphs given by bubble models with two columns; but having two columns is a crucial property for the algorithm.
To conclude, the time complexity of the MaxCut problem on unit interval graphs is still not resolved and it seems to be a challenging open question.
3.3 Subexponential algorithm in mixed unit interval graphs
Here, we present a subexponential-time algorithm for the MaxCut problem in mixed unit interval graphs. Our aim is to have an algorithm running in time. Some of the ideas, for unit interval graphs, originated in discussion with Karczmarz, Nadara, Rzazewski, and Zych-Pawlewicz at Parameterized Algorithms Retreat of University of Warsaw 2019 [10].
Let us start with a notation. Let be a graph, be a subgraph of , and be a cut of , we say that a cut of agrees with in if on . Let be a mixed unit interval graph. We take a -bubble model for and we distinguish columns of according to their number of vertices. We denote by the number of vertices in bubble and by the number of vertices in column , i.e., and . We call a column with a heavy column, otherwise a light column. We call consecutive heavy columns and their two bordering light columns a heavy part of (if starts or ends with a heavy column, for brevity, we add an empty column at the beginning or the end of , respectively), and we call their light columns borders. Heavy part might contain no heavy columns in the case that two light columns are consecutive.
Note that we can guess all possible cuts in one light column without exceeding the aimed time and that most of those light column guesses are independent of each other—once we know the cut in the previous column, it does not matter what the cut is in columns before. Furthermore, there are at most consecutive heavy columns which allow us to process them together. More formally, we show that we can determine a maximum cut independently for each heavy part, given a fixed cut on its borders, as stated in the following lemma.
Lemma 12.
Let be a mixed unit interval graph and be a -bubble model for partitioned into heavy parts in this order. If is a (fixed) cut of light columns in G() such that is a cut of , , then the size of a maximum cut of that agrees with in light columns is
where denotes the size of a maximum cut of that agrees with in its borders .
Proof.
It is readily seen that once we have a fixed cut in an entire column of a bubble model, a maximum cut of columns which are to the left of (including ) is independent on a maximum cut of those which are to the right of (including ). Therefore, we can sum the sizes of maximum cuts in heavy parts which are separated by fixed cuts. However, the cut size of middle light columns is counted twice since they are contained in two heavy parts. Therefore, we subtract them. ∎
Now, our aim is to determine the size of a maximum cut for a heavy part given a fixed cut on its borders. Note that if is a heavy part with no heavy columns, we can straightforwardly count the number of cut edges of , i.e., , assuming a fixed cut on borders is given. Therefore, we are focusing on a situation where at least one heavy column is present in a heavy part. We use dynamic programming to determine the size of a maximum cut on each such heavy part.
First, we present a brief idea of the dynamic programming approach, followed by technical definitions and proofs later. We take bubbles in which are not in borders and process themone-by-one in top-bottom, left-right order. When processing a bubble, we consider all the possibilities of numbers of cut-vertices in each its quadrant. We refer to the already processed part after -th step as , that is is the induced subgraph of with where and are borders of and , are first bubbles in top-bottom, left-right order in (as it is shown in Figure 4).
We store all possible -tuples , where is the number of heavy columns, characterizes the number of all cut vertices in the -th heavy column, and number characterizes the number of cut vertices of types in the last processed bubble. Then, we define recursive function where will be related to the maximum size of a cut that has exactly cut vertices in column (for all ) in the already processed part . More precisely, we want the recursive function to satisfy the properties later covered by Lemma 13. Once, satisfies the desired properties, we easily obtain the size of a maximum cut in the heavy part (Theorem 14, below).
Now, we present a key observation for the construction of . Observe, by the properties of -bubble model, that the edges of can be partitioned into following disjoint sets:
-
edges of the graph ,
-
edges inside ,
-
edges between and the same column above ,
-
edges between and the next column above ,
-
edges between and the bubble in the previous column and the same row as ,
-
edges between and column below ,
-
edges between and the bubble in column in the same row as .
Therefore, the idea there is to count the size of a desired cut of using the sizes of possible cuts in and add the size of a cut using edges . The former is stored in and the later can be counted from the number of cut vertices in currently processed bubble and numbers in the -tuple we are processing.
Now, let us properly define the function and prove Theorem 2 formally. We develop more notation. Let be a heavy part with heavy columns (numbered by ) and borders and . Let ,…, be bubbles in numbered in the top-bottom, left-right order. Let and be (fixed) cuts in and . To handle borders, we define auxiliary functions , which output the number of cut vertices in borders in a specific position depending on the given row and column; they output if the given column is not next to the borders. We define:
-
the number of (fixed) cut vertices in under the row (or 0 if the previous column is not ):
-
the number of (fixed) cut vertices of type in the left border in the row :
-
the number of (fixed) cut vertices in the right border above the row :
-
the number of (fixed) cut vertices of type in the right border in the row :
We denote the number of vertices in by , analogously , We further denote the set of counts corresponding to all possible choices of cut vertices in the bubble by , i.e.,
In addition, we denote the set of -tuples characterizing all possible counts of cut-vertices in the heavy columns and an auxiliary number characterizing the count of possible edges from the last processed bubble, by
Let denote the number of cut-edges between two sets , which are complete to each other and , , contains cut vertices and non-cut vertices, i.e., We remark that it is important to know the numbers of non-cut vertices ( and ), however, we will not write them explicitly for the easier formulas. It will be seen that they can be, for instance, stored in parallel with the numbers of cut vertices (or counted in each step again).
Finally, we define a recursive function by the following recurrence relation:
| otherwise | : | ||
| w | |||
| a |
We denote by the induced subgraph of with where and are borders of .
Lemma 13.
For each and for every , the value is equal to the maximum size of a cut in that satisfies the following
-
for every , the number of cut vertices in the column in is equal to , and agrees with in , and
-
is equal to the number of cut vertices from ,
or is equal to if there is no such cut.
Proof.
We prove Lemma 13 by induction on the number of steps (bubbles). Since is in the first heavy column, Lemma 13 is true for by Definition 5 (iv).
In the inductive step, suppose that for every , is equal to the size of a maximum cut in such that the number of cut vertices in each column , for every , in is equal to , and the number of cut vertices from is equal to . Or is equal to if such a cut does not exist.
As it was mentioned, the edges of can be partitioned into disjoint sets —. Recall:
-
edges of the graph ,
-
edges inside ,
-
edges between and the same column above ,
-
edges between and the next column above ,
-
edges between and the bubble in the previous column and the same row as ,
-
edges between and column below ,
-
edges between and the bubble in column in the same row as .
Note that is non-empty only if is in the column , similarly is non-empty only if is in the column . Let be fixed. At first assume, is a maximum cut in (that agrees with in ) such that it contains vertices from the column for each and vertices from ; we say satisfies the conditions . We discuss the case where no such cut exists, later. We denote by the number of vertices in , , and by the sum of these values, i.e., . We denote by , and by . Then,
Which leads to the expression:
By the induction hypothesis,
| (1) |
It gives us together with the right part of the equation, the definition of for , and . Therefore,
Furthermore, we show that is the size of a cut satisfying the conditions . Since the value of the function is for any number a size of a cut in which satisfies the conditions , or (if no such cut exists), we can extend that cut into by adding vertices from where and . Consequently, is a size of a cut on satisfying that it contains vertices from the column and vertices from . At least one such cut exists, by (1). Therefore, . It leads to the equation , otherwise, is not a maximum cut.
In a similar way, we can extend every cut on to . Therefore, if there exist no cut on which satisfies the conditions , there exists no cut in which can be extended to the cut on satisfying the conditions . Consequently, by the definition of since for all -tuples which appear in the definition. ∎
Finally, we obtain the next theorem about a maximum cut of a heavy part as a corollary of Lemma 13.
Theorem 14.
Let be a heavy part with heavy columns (numbered by ) and borders and . Let ,…, be bubbles in numbered in the top-bottom, left-right order. Let and be (fixed) cuts in and . Then, the size of a maximum cut in that agrees with in light columns is
Towards proving Theorem 2 and Corollary 3, it remains to prove the time complexity of processing a heavy part.
Lemma 15.
Let be a heavy part with columns, bubbles, and a fixed cut in the borders. The size of a maximum cut of that agrees with the fixed cut in the borders can be determined in the time:
where is the number of vertices in the column , i.e., , and .
Proof.
We analyze the time complexity of the algorithm from Lemma 15. Let denote all the possible -tuples. Then The time for processing a bubble is . The time complexity of processing is then
Now, we are ready to prove Theorem 2.
Proof of Theorem 2.
By Lemma 12, heavy parts can be processed independently on each other, given a cut on their borders. Moreover, it is sufficient for a light column to remember only the biggest cuts on the left of (containing ) for each possible cut in . Therefore, there is no need to guess cuts in all light columns at once. It is sufficient to guess a cut only in two consecutive light columns at once.
Observe that there are at most guesses of cut vertices for a light column and there are at most light columns. Therefore, the time complexity of determining the size of a maximum cut in is at most where is the maximum time for processing a heavy part. Now, we want to prove that a time complexity of processing a heavy part with a given guess of light columns is
By Lemma 15, the time complexity of processing a heavy part with a given guess of light columns is
To sum up, we can determine the size of a maximum cut in the time: For brevity, we analyzed only the size of a maximum cut. However, the maximum cut itself can be determined retroactively in the time , as well. ∎
Lemma 15 has a nice corollary for graphs with a -bubble model with a constant number of columns. According to Lemma 15, we are able to solve the MaxCut problem in those graphs in polynomial time which is formulated as Corollary 3 in the introduction.Therefore, we improved another polynomial-time algorithm by Boyaci, Ekim, Shalom [8] solving the MaxCut problem in co-bipartite chain graphs with possible twins (which is exactly the class of graphs defined by a classic bubble model with only two columns).
Proof.
Let be a graph on vertices which is defined by a -bubble model with columns and bubbles. The bubble model can be seen as a heavy part with no cut-vertices in its borders. By Lemma 15, the size of a maximum cut in can be determined in time where is the number of vertices in the bubble quadrant and is the number of vertices in the column , i.e., , and .
By Arithmetic Mean-Geometric Mean Inequality (AM-GM) we obtain
It remains to prove the special case where Notice, it is sufficient to distinguish only between vertices in quadrants of types and in the first column, and simillarly and in the second column. Therefore, we obtain instead of which leads to the time complexity ∎
Note that Theorem 14 states the explicit size of a maximum cut.
4 Clique-width of mixed unit interval graphs
The clique-width is one of the parameters which are used to measure the complexity of a graph. Many -hard problems, those which are expressible in Monadic Second-Order Logic using second-order quantifiers on vertices (), can be solved efficiently in graphs of bounded clique-with [11]. For instance, 3-coloring. Definition of the clique-width is quite technical but it follows the idea that a graph of the clique-width at most can be iteratively constructed such that in any time, there are at most types of vertices, and vertices of the same type behave indistinguishably from the perspective of the newly added vertices.
Definition 6 (Courcelle 2000).
The clique-width of a graph , denoted by , is the smallest integer number of different labels that is needed to construct the graph using the following operations:
-
0.
creation of a vertex with label ,
-
1.
disjoint union (denoted by ),
-
2.
relabeling: renaming all labels to (denoted by ),
-
3.
edge insertion: connecting all vertices with label to all vertices with label , ; already existing edges are not doubled (denoted by ).
Such a construction of a graph can be represented by an algebraic term composed of the operations , , and , called cwd-expression. We call k-expression a cwd-expression in which at most different labels occur. Using this, we can say that the clique-width of a graph is the smallest integer such that the graph can be defined by a -expression.
Example.
The diamond graph on the four vertices (the complete graph without an edge ) is defined by the following cwd-expression:
Therefore, .
Fellows, Rosamond, Rotics, and Szeider [15] proved in 2009 that the deciding whether the clique-width of a graph is at most is -complete. Therefore, researchers put effort into computing an upper-bound of the clique-width.
Courcelle and Olariu [12] showed in 2000 that bounded treewidth implies bounded clique-width (but not vice versa). They showed that for any graph with the treewidth , the clique-width of is at most .
Golumbic and Rotics [20] proved that unit interval graphs have unbounded clique-width, consequently, (mixed unit) interval graphs have unbounded clique-width as well. Therefore, computing upper-bounds are of particular interest. Fellows et al. [14] showed that the clique-width of a graph is bounded by its pathwidth + 2, therefore, the clique-width of interval graphs as well as of unit interval graphs is upper-bounded by the size of their maximum clique + 1 [26, 14]. Using a bubble model structure, subclasses of unit interval graphs were characterized in terms of (linear) clique-width [31, 32]. Courcelle [12] observed that clique-width can be computed componentwise.
Lemma 16 (Courcelle 2000,[12]).
Any graph satisfies that
We provide an upper-bound of the clique-width of a graph depending on the number of columns in a -bubble model of . We express it also in the size of a maximum independent set.
Lemma 17.
Let be a mixed unit interval graph and be a -bubble model of . Then , where is the number of columns of . Moreover, a -expression defining the graph can be constructed in time from .
Proof.
The proof is inspired by the proof for unit interval graphs [23].
We find a -expression defining and, therefore, prove that . We use labels where label will be assigned to -th column of and the remaining three labels, denoted by , are used for maintaining the last two added vertices.
We define a linear order on vertices of according to as follows:
-
(i)
We take the vertices from top to bottom, left to right. Formally, let , we define if or
-
(ii)
we define the following order on bubble quadrants:
-
(iii)
we define an arbitrary linear order on vertices in the same quadrant of the same bubble.
The idea of the proof is that every column has its own label and we need three more labels for maintaining the last added vertices. We will add vertices to in the described order which ensures that a new vertex is complete to all vertices from the following column and anti-complete to all vertices from the previous column except those from the same row. Recall that according to the definition of -bubble model, there is an edge between vertices and if and only if and . Therefore, vertices from the last constructed bubble in the previous column must have two distinct labels according to the types of the vertices. However, once we add all vertices from the actual bubble, we do not need to distinguish between vertices from the previous column, anymore. Therefore, we rename their labels to the label of their column.
Formally. Let be the first (smallest) vertex of according to the defined linear order. We know that is from the first column by Definition 5 (iv). If is of type or , we label it by , otherwise by 1, so the expression for is if is of type or , and otherwise.
Let be the first non-processed vertex from , i.e., a label is assigned to all preceding vertices. Let are currently unused labels or is used in the actual bubble and is unused, and may be used (in the previous column). Note that at most one label from is used in the previous column any time. We split the proof according to the type of , the bubble quadrant where belongs.
-
(a)
. We use label for . Then, we make (the only one vertex with label ) complete to vertices with labels (if ) and . Relabel to .
-
(b)
. We use label for . Then, we make (the only one vertex with label ) complete to vertices with labels (if ), , . Relabel to .
-
(c)
. We use label for . Then, we make all vertices with label complete to vertices with labels (if ), , . (Do not relabel vertices with label ).
-
(d)
. We use label for . Then, we make (the only one vertex with label ) complete to vertices with labels (if ), , , . Relabel to .
If all vertices from were used, we rename all vertices with the label to if If , we relabel to .
For the correctness, observe that the previous column has always at most two labels and in a), b), and d) the temporary label for is unique (no other vertices are labeled by it at that time). The rest follows from the definition of adjacency in the -bubble model. Since we constructed using at most labels, .
The described algorithm processes each vertex once and each vertex has at most three labels in total. Moreover, the algorithm needs a constant work for each vertex—for instance, a cwd-expression for the option a) is:
where is the already constructed graph before adding the vertex . Therefore, the -expression defining is constructed in linear time given a -bubble model in an appropriate structure. ∎
Theorem 18.
Let be a mixed unit interval graph. Then . Moreover, a -expression defining the graph can be constructed in time provided a -bubble model of is given.
Next, we provide a different bound for clique-width which is obtained by a small extension of the proof for unit interval graphs using the bubble model by Heggernes, Meister, and Papadopoulos [23]. We include the full proof for completeness.
We need more notation. Let be a mixed unit interval graph and let be a -bubble model for . We say that vertices from the same column of create a group if they have the same neighbours in the following column of . Let , the group number of vertex in , denoted by , is defined as the maximum number of groups in over the sets and . Then the group number of in is defined as
Lemma 19.
Let is a mixed unit interval graph and a -bubble model for . The following inequality holds
Proof.
Let Observe that is a clique (for both the possibilities of ), see Lemma 11. Moreover, is not included in the counting the group number of , and no vertex can be in more than one group. Therefore, for any vertex which leads to the desired inequality. ∎
Theorem 20.
Let be a mixed unit interval graph and a -bubble model for . Then Moreover, a -expression defining the graph can be constructed in time provided a -bubble model of is given.
Proof.
Our aim is to find a -expression defining . We add vertices in the order from left to right, top to bottom of processing vertices of type at first, i. e., in the following linear order:
-
(i)
for , where or
-
(ii)
-
(iii)
an arbitrary linear order on the vertices in the same quadrant of the same bubble.
Now, we follow the original proof. Shortly, we add each vertex in a proper way. We assume that a label is assigned for each previous vertex and all the vertices which belong to the same group have the same label. At first, we change to 1 the label of all the previous vertices which are nonadjacent to . We know that at most distinct labels are used in the remaining groups, say labels . This is true since all the groups are adjacent to and because of the linear order.
Note that it is important to add first all the vertices of type from a bubble. Otherwise, remaining groups could be there; in the situation that is of type , a potentially one distinct label is needed for , and another for . One the other hand, if all the vertices of type precede vertices of type in one bubble, this situation does not happen—a potential label of would be released. Therefore, it is enough to take into account only the parts , and , and not the bigger one , in the definition of .
We use a free label, say , for and join all the vertices with this label with vertices with labels . Next, change the label of to a label of its group if belongs to an already existing group. We continue with the next vertex. During the processing of each vertex, we need no more than its group number + 2 distinct labels. Therefore,
It remains to determine the running time for the construction of the expression defining . Assume a -bubble model is given in a way that going over all vertices takes linear time in the number of vertices. First, we count the time for the creation of groups. For each vertex we compare its neighbors from the next column with the neighbors of the previous vertex in this column. Therefore, the splitting vertices into groups and determining the group number of take time. In a constant time, we determine a free label for each vertex. Then, we need to check the labels of groups in the neighborhood of each vertex and create a long cwd-expression, yielding time in total. Furthermore, each vertex is at most once relabeled to 1 since once it is relabeled to 1, its label remains 1 for the rest of the algorithm. Therefore, the relabeling of vertices that are nonadjacent to a newly added vertex takes time in total. To sum up, the algorithm outputs the construction in time. ∎
Theorem 21.
Let be a mixed unit interval graph. Then
where is a -bubble model for . Moreover, the corresponding expression can be constructed in time providing is given, otherwise in time.
Observe that . A combination of Theorem 21 and Lemma 17 givesa useful Corollary 22. In particular, if the number of rows or number of columns is bounded, than clique-width is bounded.
Corollary 22.
Let be a mixed unit interval graph. Then where is the number of columns and is the length of a longest column in a -bubble model for .
Note that by an application of Lemma 4.1 in [31], slightly worse bounds on clique-width in terms of rows and columns can also be derived. In particular, if we take two natural orderings of the bubbles in the -bubble model, one taking rows first and the other taking columns first, we obtain two times larger multiplicative factor than in Corollary 22.
5 Conclusion
The main contribution of this work is a new representation of mixed unit interval graphs—the -bubble model. This structure is particularly useful in the design of algorithms and their analysis. Using the -bubble model, we presented new upper-bounds for the clique-width of mixed unit interval graphs and designed a subexponential-time algorithm for the MaxCut problem on mixed unit interval graphs. We further realized that the state-of-the-art polynomial-time algorithm for the MaxCut problem on unit interval graphs is incorrect. A long-term task is to determine the difference between the time complexity of basic problems on unit interval graphs compared to interval graphs. In particular, on a more precise scale of mixed unit interval graphs, determine what is a key property for the change of the complexity. Independently, a long-standing open problem is the time complexity of the MaxCut problem on unit interval graphs, in particular, decide if it is NP-hard or polynomial-time solvable. An interesting direction to pursue the first task could be the study of labeling problems; either -labeling or Packing Coloring. Both problems were motivated by assigning frequencies to transmitters.The -labeling problem was first introduced by Griggs and Yeh in 1992 [21]. The packing coloring problem is newer, it was introduced by Goddard et al. in 2008 [18]. Although, these are well-known problems, quite surprisingly, their time complexity is open for interval graphs.
The -labeling problem assigns labels to vertices such that the labels of neighboring vertices differ by at least two and the labels of vertices in distance two are different. The time complexity of this problem is still wide open even for unit interval graphs, despite partial progress on specific values for the largest used label. Sakai proved that the value of the largest label lies between and where is the chromatic number [38].
The packing coloring problem asks for an existence of such a mapping that for all with the distance between and is at least . This problem is wide open on interval graphs. Recently, there was a small progress on unit interval graphs leading to an FPT algorithm (time for some computable function and parameter ). It is shown in [28] that the packing coloring problem is in FPT parameterized by the size of a maximum clique. We note that the algorithm can be straightforwardly extended to mixed unit interval graphs. However, a polynomial-time algorithm or alternatively NP-hardness for (unit) interval graphs is of a much bigger interest.
Acknowledgements
The authors would like to thank Vít Jelínek for helpful comments. This paper is based on the master thesis of Jana Novotná [33].
References
- [1] Ranendu Adhikary, Kaustav Bose, Satwik Mukherjee, and Bodhayan Roy. Complexity of maximum cut on interval graphs, 2020. arXiv:2006.00061.
- [2] Sanjeev Arora, Boaz Barak, and David Steurer. Subexponential algorithms for unique games and related problems. Journal of the ACM, 62(5):1–25, November 2015. doi:10.1145/2775105.
- [3] Seymour Benzer. On the topology of the genetic fine structure. Proceedings of the National Academy of Sciences of the United States of America, 45(11):1607, 1959. doi:10.1073/pnas.45.11.1607.
- [4] Hans L. Bodlaender, Celina M. H. de Figueiredo, Marisa Gutierrez, Ton Kloks, and Rolf Niedermeier. Simple max-cut for split-indifference graphs and graphs with few p’s. In Celso C. Ribeiro and Simone L. Martins, editors, Experimental and Efficient Algorithms, Third International Workshop, WEA 2004, Angra dos Reis, Brazil, May 25-28, 2004, Proceedings, volume 3059 of Lecture Notes in Computer Science, pages 87–99. Springer, 2004. doi:10.1007/978-3-540-24838-5\_7.
- [5] Hans L. Bodlaender, Ton Kloks, and Rolf Niedermeier. SIMPLE MAX-CUT for unit interval graphs and graphs with few ps. Electronic Notes in Discrete Mathematics, 3:19–26, 1999. doi:10.1016/S1571-0653(05)80014-9.
- [6] Kellogg S. Booth and George S. Lueker. Testing for the consecutive ones property, interval graphs, and graph planarity using PQ-tree algorithms. Journal of Computer and System Sciences, 13(3):335–379, 1976. doi:10.1016/S0022-0000(76)80045-1.
- [7] Arman Boyaci, Tinaz Ekim, and Mordechai Shalom. A polynomial-time algorithm for the maximum cardinality cut problem in proper interval graphs. Information Processing Letters, 121:29–33, 2017. doi:10.1016/j.ipl.2017.01.007.
- [8] Arman Boyaci, Tinaz Ekim, and Mordechai Shalom. The maximum cardinality cut problem in co-bipartite chain graphs. Journal of Combinatorial Optimization, 35(1):250–265, 2018. doi:10.1007/s10878-015-9963-x.
- [9] Andreas Brandstädt, Van Bang Le, and Jeremy P. Spinrad. Graph Classes: A Survey, volume 3. Society for Industrial and Applied Mathematics, Philadelphia, PA, USA, 1999. doi:10.1137/1.9780898719796.
- [10] Personal communication with Adam Karczmarz, Wojciech Nadara, Anna Zych-Pawlewicz, and Pawel Rzazewski. Parameterized Algorithms Retreat of University of Warsaw 2019.
- [11] Bruno Courcelle, Johann A. Makowsky, and Udi Rotics. Linear time solvable optimization problems on graphs of bounded clique-width. Theory of Computing Systems, 33(2):125–150, 2000. doi:10.1007/s002249910009.
- [12] Bruno Courcelle and Stephan Olariu. Upper bounds to the clique width of graphs. Discrete Applied Mathematics, 101(1–3):77–114, 2000. doi:10.1016/S0166-218X(99)00184-5.
- [13] Mitre C. Dourado, Van B. Le, Fábio Protti, Dieter Rautenbach, and Jayme L. Szwarcfiter. Mixed unit interval graphs. Discrete Mathematics, 312(22):3357–3363, 2012. doi:10.1016/j.disc.2012.07.037.
- [14] Michael R. Fellows, Frances A. Rosamond, Udi Rotics, and Stefan Szeider. Clique-width minimization is NP-hard. In Proceedings of the 38th Annual ACM Symposium on Theory of Computing, Seattle, WA, USA, May 21–23, 2006, pages 354–362, 2006. doi:10.1145/1132516.1132568.
- [15] Michael R. Fellows, Frances A. Rosamond, Udi Rotics, and Stefan Szeider. Clique-width is NP-complete. SIAM Journal on Discrete Mathematics, 23(2):909–939, 2009. doi:10.1137/070687256.
- [16] Fedor V. Fomin, Petr A. Golovach, Daniel Lokshtanov, and Saket Saurabh. Almost optimal lower bounds for problems parameterized by clique-width. SIAM Journal on Computing, 43(5):1541–1563, January 2014. doi:10.1137/130910932.
- [17] Frédéric Gardi. The Roberts characterization of proper and unit interval graphs. Discrete Mathematics, 307(22):2906–2908, 2007. doi:10.1016/j.disc.2006.04.043.
- [18] Wayne Goddard, Sandra M. Hedetniemi, Stephen T. Hedetniemi, John M. Harris, and Douglas F. Rall. Braodcast chromatic numbers of graphs. Ars Comb., 86, 2008.
- [19] Martin Charles Golumbic. Algorithmic graph theory and perfect graphs. Computer Science and Applied Mathematics, XX:284, 1980. doi:10.1016/C2013-0-10739-8.
- [20] Martin Charles Golumbic and Udi Rotics. On the clique-width of some perfect graph classes. International Journal of Foundations of Computer Science, 11(3):423–443, 2000. doi:10.1142/S0129054100000260.
- [21] Jerrold R. Griggs and Roger K. Yeh. Labelling graphs with a condition at distance 2. SIAM Journal on Discrete Mathematics, 5(4):586–595, 1992. doi:10.1137/0405048.
- [22] Gyorgy Hajós. Über eine art von graphen. Internationale Mathematische Nachrichten, 11:65, 1957.
- [23] Pinar Heggernes, Daniel Meister, and Charis Papadopoulos. A new representation of proper interval graphs with an application to clique-width. Electronic Notes in Discrete Mathematics, 32:27–34, 2009. doi:10.1016/j.endm.2009.02.005.
- [24] Samuel B. Hopkins, Tselil Schramm, and Luca Trevisan. Subexponential lps approximate max-cut, 2019. arXiv:1911.10304.
- [25] Felix Joos. A characterization of mixed unit interval graphs. Journal of Graph Theory, 79(4):267–281, 2015. doi:10.1002/jgt.21831.
- [26] Haim Kaplan and Ron Shamir. Pathwidth, bandwidth, and completion problems to proper interval graphs with small cliques. SIAM Journal on Computing, 25(3):540–561, 1996. doi:10.1137/S0097539793258143.
- [27] J. Mark Keil. Finding hamiltonian circuits in interval graphs. Information Processing Letters, 20(4):201–206, 1985. doi:10.1016/0020-0190(85)90050-X.
- [28] Minki Kim, Bernard Lidický, Tomáš Masařík, and Florian Pfender. Notes on complexity of packing coloring. Information Processing Letters, 137:6–10, 2018. doi:10.1016/j.ipl.2018.04.012.
- [29] Jan Kratochvíl, Tomáš Masařík, and Jana Novotná. U-bubble model for mixed unit interval graphs and its applications: The maxcut problem revisited. In Javier Esparza and Daniel Král’, editors, 45th International Symposium on Mathematical Foundations of Computer Science, MFCS 2020, August 24-28, 2020, Prague, Czech Republic, volume 170 of LIPIcs, pages 53:1–53:14. Schloss Dagstuhl - Leibniz-Zentrum für Informatik, 2020. doi:doi:10.4230/LIPIcs.MFCS.2020.53.
- [30] Van Bang Le and Dieter Rautenbach. Integral mixed unit interval graphs. Discrete Applied Mathematics, 161(7–8):1028–1036, 2013. doi:10.1016/j.dam.2012.09.013.
- [31] Vadim V. Lozin. Minimal classes of graphs of unbounded clique-width. Annals of Combinatorics, 15(4):707–722, October 2011. doi:10.1007/s00026-011-0117-2.
- [32] Daniel Meister and Udi Rotics. Clique-width of full bubble model graphs. Discrete Applied Mathematics, 185:138–167, April 2015. doi:10.1016/j.dam.2014.12.001.
- [33] Jana Novotná. Computational and structural apects of interval graphs and their variants. 2019. URL: https://dodo.is.cuni.cz/handle/20.500.11956/80360.
- [34] Dieter Rautenbach and Jayme Luiz Szwarcfiter. Unit interval graphs of open and closed intervals. Journal of Graph Theory, 72(4):418–429, 2013. doi:10.1002/jgt.21650.
- [35] F. S. Roberts. Indifference graphs. Proof Techniques in Graph Theory, pages 139–146, 1969. URL: https://ci.nii.ac.jp/naid/10025491782/en/.
- [36] F. S. Roberts. Some applications of graph theory. Draft, 2000.
- [37] F.S. Roberts, Society for Industrial, and Applied Mathematics. Graph Theory and Its Applications to Problems of Society. CBMS-NSF Regional Conference Series in Applied Mathematics. Society for Industrial and Applied Mathematics, 1978.
- [38] Denise Sakai. Labeling chordal graphs: Distance two condition. SIAM Journal of Discrete Mathematics, 7(1):133–140, 1994. doi:10.1137/S0895480191223178.
- [39] Alan Shuchat, Randy Shull, Ann N. Trenk, and Lee C. West. Unit mixed interval graphs. Congressus Numerantium, 221:189–223, 2014.
- [40] Alexandre Talon and Jan Kratochvíl. Completion of the mixed unit interval graphs hierarchy. Journal of Graph Theory, 87(3):317–332, 2018. doi:10.1002/jgt.22159.