Sympathetic eruptions of two filaments with an identifiable causal link observed by the Solar Dynamics Observatory
Abstract
Filament eruptions occurring at different places within a relatively short time internal, but with a certain physical causal connection are usually known as sympathetic eruption. Studies on sympathetic eruptions are not uncommon. However, in the existed reports, the causal links between sympathetic eruptions remain rather speculative. In this work, we present detailed observations of a sympathetic filament eruption event, where an identifiable causal link between two eruptive filaments is observed. On 2015 November 15, two filaments (F1 in the north and F2 in the south) were located at the southwestern quadrant of solar disk. The main axes of them were almost parallel to each other. Around 22:20 UT, F1 began to erupt, forming two flare ribbons. The southwestern ribbon apparently moved to southwest and intruded southeast part of F2. This continuous intrusion caused F2’s eventual eruption. Accompanying the eruption of F2, flare ribbons and post-flare loops appeared in northwest region of F2. Meanwhile, neither flare ribbons nor post-flare loops could be observed in southeastern area of F2. In addition, the nonlinear force-free field (NLFFF) extrapolations show that the magnetic fields above F2 in the southeast region are much weaker than that in the northwest region. These results imply that the overlying magnetic fields of F2 were not uniform. So we propose that the southwest ribbon formed by eruptive F1 invaded F2 from its southeast region with relatively weaker overlying magnetic fields in comparison with its northwest region, disturbing F2 and leading F2 to erupt eventually.
1 Introduction
Solar filaments are cool and dense plasma suspended in the corona, which are also known as prominences when observed at the limb of the Sun. It is widely accepted that filaments are always located above the magnetic polarity inversion lines (PILs). According to their locations, the filaments could be divided into three classes: active region filaments forming inside active regions, intermediate filaments arising between active regions, and quiescent filaments which are located at solar quiescent regions (Zirker et al. 1997; Martin 1998; Mackay et al. 2010). Filament eruptions, solar flares, and coronal mass ejections are often seen as different manifestations of the same physical processes, and filament eruptions are believed to play a key role in the onset of these eruptions (Schmieder et al. 2013; Filippov 2018; Sinha et al. 2019). The popular filament eruption model is that a lifting filament stretches its overlying magnetic field lines, creating a current sheet between the anti-parallel field lines, where magnetic reconnection occurs, and then a bulk of plasma and magnetic structure are ejected into the interplanetary space. During a filament eruption, the footprints of the reconnecting overlying magnetic field lines continuously brighten different regions in the chromosphere and are observed as two flare ribbons which spread to both sides of the filament in a way of apparent motion, while the post-flare loops just are the newly formed low-lying loop lines (Kopp, & Pneuman 1976; Miklenic et al. 2007; Shibata, & Magara 2011; Hou et al. 2016; Yang & Zhang 2018).
The eruptions of stable filaments are triggered by the loss of the balance of forces acting on them (Porfir’eva & Yakunina 2013; Kliem et al. 2014; Zaitsev & Stepanov 2018). Several different mechanisms have been proposed and studied for the initiation of filament eruption, such as flux emergence and cancellation (Zhang et al. 2001; Zheng et al. 2017; Dacie et al. 2018), tether cutting reconnection (Moore et al. 2001; Cheng & Ding 2016; Woods et al. 2018), breakout reconnection (Sterling et al. 2011; Kliem et al. 2013; Sun et al. 2015; Chen et al. 2016), and torus or kink magnetohydrodynamic (MHD) instability (Aulanier et al. 2010; Riley et al. 2011; Hassanin & Kliem 2016; Dechev et al. 2018; Hou et al. 2018; Duchlev et al. 2019). A stable filament can also erupt due to the direct interaction from a surrounding filament, during which the magnetic system of the original stable filament is disturbed by magnetic reconnections. Results from Yang et al. (2017) showed that two nearby filaments, which were almost perpendicular to each other, could gradually approach to each other and eventually erupt due to the direct collision between them. Furthermore, a filament could also erupt for the mass injection from a surrounding erupting filament (Su et al. 2007).
In addition to the filament eruptions mentioned above, sympathetic eruptions between filaments are also ubiquitous. These eruptions are defined as consecutive filament eruptions occurring within a short time in different locations but having a certain physical connection (Török et al. 2011; Jiang et al. 2014; Yang et al. 2012; Wang et al. 2016; Joshi et al. 2016; Li et al. 2017). Two filaments, which reside above different PILs and share the same overlying magnetic system, could interact sympathetically, i.e., the first erupting filament disturbs the magnetic system of the second filament and leads to its eruption (Shen et al. 2012). A series of erupting filaments could be connected by magnetic separatrices or quasi-separatrix layers. These filaments could be disturbed by each other and erupted sympathetically by a chain of magnetic reconnections (Schrijver & Title 2011). However, due to the lack of direct observational evidences, it has been debated whether the close temporal correlation between sympathetic eruptions is purely coincidental, or causally linked. The exact mechanism of sympathetic eruptions is still not well understood (Biesecker & Thompson 2000; Török et al. 2011; Wang et al. 2018).
In the present work, we show a detailed process of sympathetic eruptions of two filaments by using high-quality data from the Solar Dynamics Observatory (SDO; Pesnell et al. 2012). In this event, a flare ribbon caused by an eruptive filament intruded the location of an adjacent filament and finally led it to erupt. The remainder of this paper is organized as follows. Section 2 describes the observations and data analysis taken in our study. In Section 3, we investigate the sympathetic event and present the results of observation in detail, which are followed by summary and discussion in Section 4.
2 Observations and Data Analysis
We study sympathetic eruptions of two filaments in the southwest quadrant of solar disk on 2015 November 15-16. The north filament (F1) lies in southwest of AR 12452 and the south filament (F2) is located at southeast of AR 12449 and AR 12450. They are mainly observed by SDO/Atmospheric Imaging Assembly (AIA; Lemen et al. 2012) and SDO/Helioseismic and Magnetic Imager (HMI; Schou et al. 2012). The AIA provides full-disk images taken in 10 extreme ultraviolet (EUV) and ultraviolet (UV) wavelengths. The pixel size and cadence of the EUV images are 0.″6 and 12s, (24 s for UV wavelengths), respectively. In this study, images in five AIA EUV channels (131 Å, 171 Å, 193 Å, 211 Å, and 304 Å) on 2015 November 15-16 are used for the multi-wavelength analysis of sympathetic eruptions of two filaments. We employ the HMI line-of-sight (LOS) magnetic field data from the SDO to analyze evolution of the photospheric magnetic fields related to the two filaments. These data have a pixel size of 0.″5 and a cadence of 45 s. The HMI and AIA images are preprocessed by standard routines in solar software package (SSW), and all the data are differentially rotated to a reference time (00:00 UT on November 16). To investigate the chromosphere configuration of the associated filaments, we also employ corresponding H observations from the Global Oscillation Network Group (GONG; Harvey et al. 2011). GONG has collected H images observed at seven sites around the world since mid-2010 and provides successive global H observations online.
In order to reconstruct the three-dimensional (3D) magnetic fields above F1 and F2, we perform nonlinear force-free field (NLFFF) extrapolation by using the optimization method (Wheatland et al. 2000; Wiegelmann 2004). The boundary condition for the NLFFF extrapolation is an HMI full-disk vector magnetogram with a pixel spacing of 0.″5 at 22:00 UT on 2015 November 15, which is produced by using the Very Fast Inversion of the Stokes Vector (VFISV) inversion code every 12 minutes (Borrero et al. 2011). The azimuthal component of the vector field is processed by Minimum Energy method to resolve the 180° ambiguity (Metcalf 1994; Leka et al. 2009). Then we transform the vector magnetic field and the geometric mapping of the observed field in the image plane into the heliographic plane (Gary & Hagyard 1990). The NLFFF calculation is conducted within a box of uniformly spaced grid points with . Moreover, we calculate the decay index of the horizontal magnetic fields above F2, which is defined as (Kliem & Török 2006) and provides important information about the strapping fields stabilizing the filament.
3 Results
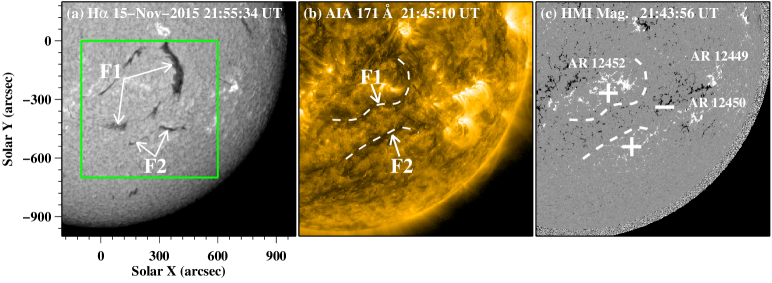
The event analyzed here occurred on 2015 November 15-16. As shown in Figure 1, two sinistral filaments (F1 in the north and F2 in the south) were located at the southwest quadrant of solar disk. The filament F1 lay in the southwest of AR 12452 and the filament F2 was near southeast of AR 12449 and AR12450 on November 15. In H observations, the lengths of them are about 500 Mm and 250 Mm, respectively. Two filaments both lay above the PILs and their main axes were almost parallel to each other. The filament F1 and filament F2 were separated by negative magnetic fields between them.
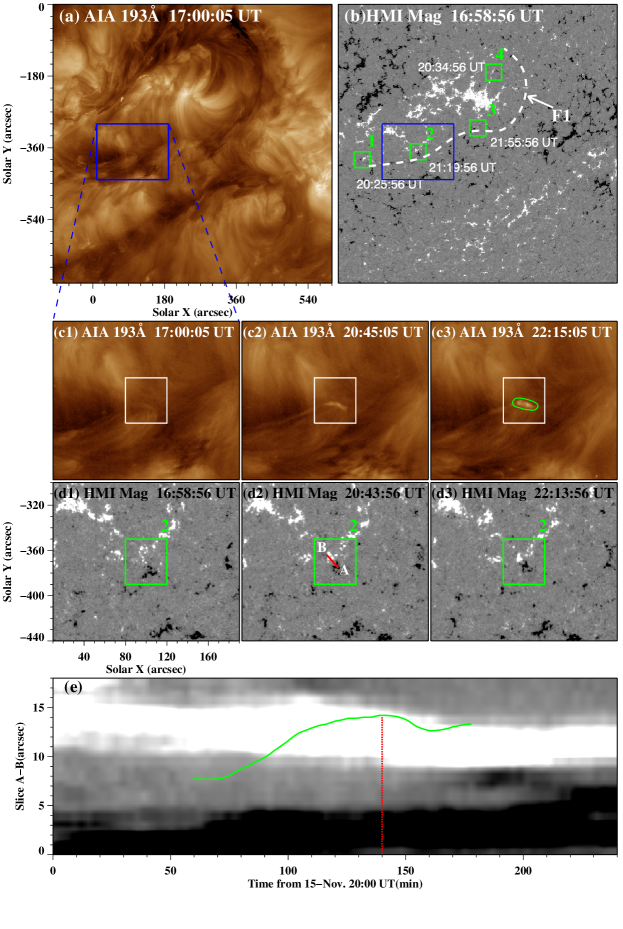
Since about 22:20 UT on November 15, the northern filament (F1) began to rise quickly and then erupted. After examining magnetograms and 193 Å images, we notice that magnetic flux cancellation occurred around barbs of F1 accompanied by 193 Å brightening before F1 eruption (see Figure 2 and online animation of this figure). The FOVs of panels (c1)-(c3) and panels (d1)-(d3) in Figure 2 are outlined by the blue rectangles in panels (a) and (b), respectively. And four sites of flux cancellation along the PIL of F1 are marked by the green boxes where the magnetic fields with opposite polarities kept approaching to each other (see panel (b)). In these four box regions, the magnetograms are replaced by the corresponding HMI magnetograms on November 15 around 20:26 UT, 21:20 UT, 21:56 UT, and 20:35 UT, respectively. To investigate the temporal evolution of the flux cancellation and brightening in detail, we focus on the box region “2”. Combining the AIA 193 Å images and HMI magnetograms, one can see that the flux cancellation is accompanied by the EUV brightening. From 17:00 UT to 22:15 UT, the emission enhancement (see panels (c1)-(c3)) as well as the flux cancellation (see panels (d1)-(d3)) continuously appeared in this box region. Along the red line “A-B” shown in panel (d2), we make a time-slice plot (see panel (e)) in HMI LOS magnetograms. Moreover, the 193 Å light curve of the area contoured by the green curve in panel (c3) is superimposed on the time-slice plot (see the green curve in panel (e)). It is shown that two magnetic fields with opposite polarities kept approaching to each other in the box region “2” from 20:00 UT to 24:00 UT. Meanwhile, the emission strength mentioned above continued to enhance from 21:00 UT to 22:20 UT and reached a peak at about 22:20 UT (see the red dotted line in panel (e)).
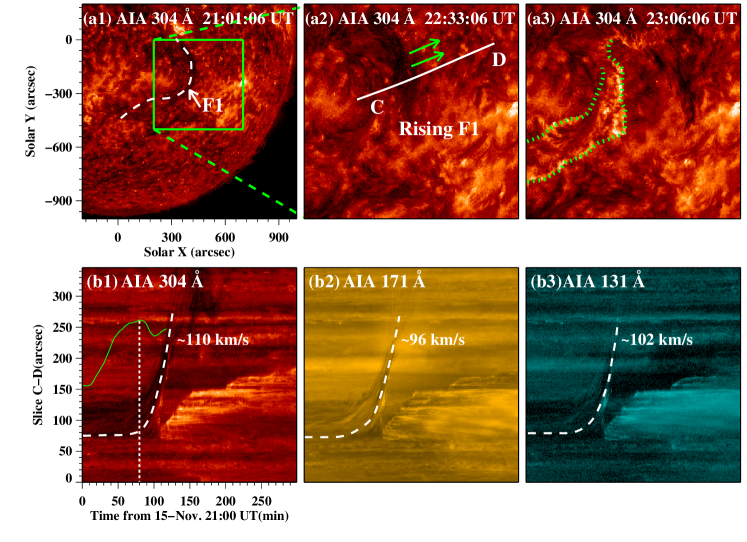
The detailed process of F1 eruption is displayed in Figure 3. We focus on the northwest area of F1 (see the FOV marked by the green square in panel (a1)), where eruption of F1 is the most significant, to show the F1 eruption in detail. Since about 22:20 UT, F1 started to rise and then erupted northwestward at about 23:00 UT, accompanied by formations of two flare ribbons (outlined by the green dotted curves in panel (a3)). These two flare ribbons appeared on both sides of the magnetic neutral line of F1 and then apparently separated from each other in directions perpendicular to the magnetic neutral line of F1. The northeastern ribbon spread northeastward and the southwestern one spread southwestward. To study the kinematic evolution of F1, we made time slices from 304 Å, 171 Å, and 131 Å images along the cut “C-D” shown in panel (a2). As displayed by the time-slice plots in panels (b1)-(b3), the filament F1 underwent three kinematic phases: slow rising, accelerating and constant velocity. By linear fitting, the erupting speeds of F1 during constant velocity phase are estimated as about 100 km s-1. The light curve of 193 Å in the area contoured by the green curve in Figure 2(c3) is superimposed on the time-slice image of 304 Å (see the green curve in panel (b1)). It can be seen that the peak time of brightening and eruptive time of F1 was almost coincident (see the vertical white dotted line in panel (b1)). The detailed process of F1 eruption is also seen in online animation of Figure 3.
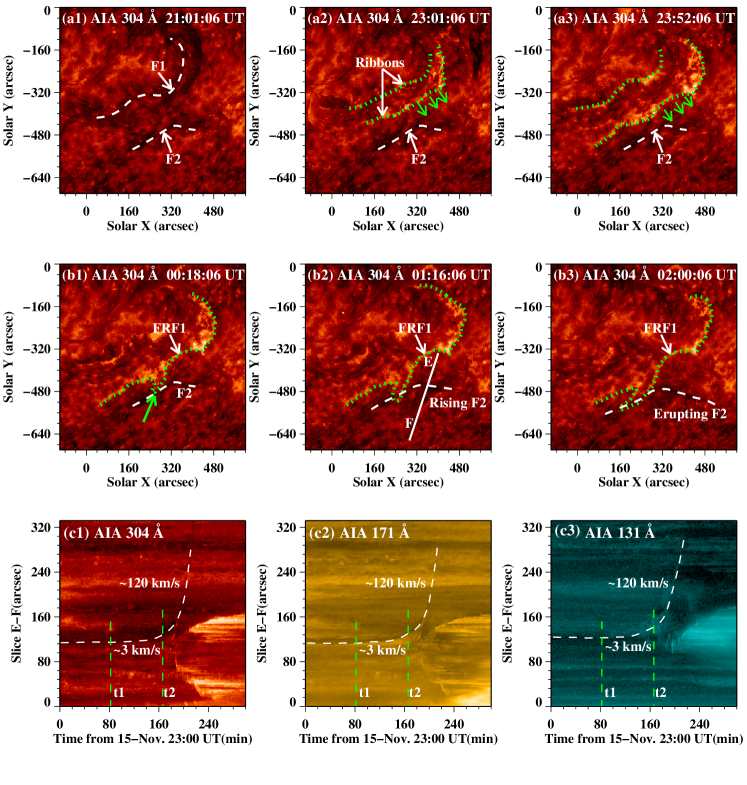
Once formation, the southwestern flare ribbon related to eruptive F1 (FRF1) continuously apparently moved to southwest. At about 23:50 UT, the northwestern part of FRF1 ceased its motion, but the southeastern part of FRF1 kept moving southwestward, approaching the site of F2 and intruded the location of F2 around 00:18 UT on November 16 (see Figure 4(a1)-(b1)). This intrusion lasted for about 100 minutes. After that, the filament F2 began to lift slowly, and accelerated to erupt eventually (see panels (b2)-(b3)). In order to investigate the kinematic evolution of F2 in detail, we made time slices (see panels (c1)-(c3)) from 304 Å, 171 Å and, 131 Å images along a slit “E-F” (see panel (b2)). In panels (c1)-(c3), the dashed curves approximate the tracks of F2 in different wavelengths, the two vertical green dashed lines indicate the times when F2 began to rise (t1) and to erupt (t2) respectively. We notice that F2 appeared as dark belts and it was almost stable before 00:20 UT, when FRF1 reached the site of F2 (panel (b1), see also the green vertical dashed line “t1” in panels (c1)-(c3)). During 00:20 UT to 01:50 UT, F2 rose slowly accompanied the successive intrusion of FRF1 and the rising speed was about 3 km s-1. At about 01:50 UT, F2 began to rise quickly and then erupted (see the green vertical dashed line “t2” in panels (c1)-(c3)), with the speeds of around 120 km s-1. The temporal evolution of FRF1 spreading, interaction between FRF1 and F2, and F2 eruption is also shown in online animation of Figure 4.
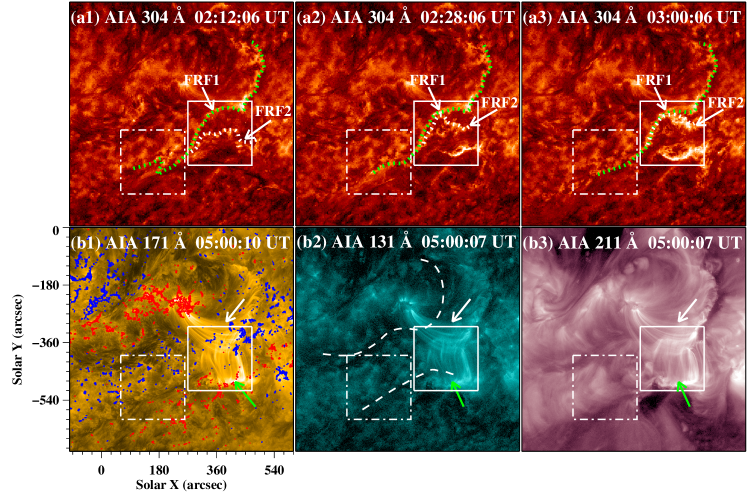
Since about 02:10 UT, the eruptive F2 also produced two flare ribbons at its northwest area (see the white solid squares in Figure 5), which appeared on both sides of the magnetic neutral line of F2 and then apparently separated from each other in directions perpendicular to the magnetic neutral line of F2 (see panels (a1)-(a3)). The northern ribbon (FRF2) related to F2 eruption approached FRF1 formed by F1 eruption. Finally, there displayed a clear separating line between the two approaching ribbons (panel (a3)), implying that there is a magnetic separatrice between the two filaments and that F1 and F2 belong to two different magnetic systems. Seen from 171 Å, 131 Å, and 211 Å images, two sets of post-flare loops appeared in the northwest area in gradual phases after the eruptions of F1 and F2. The footpoints of post-flare loops could be identified as the flare ribbons related to the eruptions of F1 and F2, respectively. There are two evidences that can be seen about the correlation between the flare ribbons (post-flare loops) and their corresponding eruptive filaments. The first one is temporal correlation, i.e., FRF1 appeared shortly after the F1 eruption (see Figure 3), and FRF2 appeared following immediately the eruptive F2 (see Figure 4). The other one is spatial correlation, i.e., the flare ribbons (post-flare loops) formed by different eruptive filaments appeared on both sides of different magnetic neutral lines (see Figure 5). These post-flare loops and their footpoints are displayed in panels (b1)-(b3). It is shown that these loops were rooted on the positive and negative magnetic fields on each side of the two neutral lines. However, we also notice that neither clear flare ribbons nor obvious post-flare loops appeared in southeast region of F2 (see the dash-dotted squares in Figure 5). The distribution of flare ribbons and post-flare loops related to eruptive F2 implies that the overlying magnetic fields of F2 are not uniform, and they are weaker in southeast area but stronger in northwest region. The temporal evolution of FRF2 and post-flare loops after F2 eruption is also shown in online animation of Figure 5.
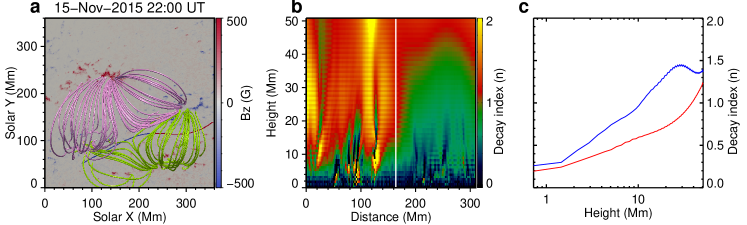
In order to confirm the non-uniformity of the magnetic fields above F2, We performed NLFFF reconstruction of the overlying magnetic fields of F2 based on the photospheric vector magnetic fields at 22:00 UT on 2015 November 15. Moreover, we calculated the decay index distribution of the reconstructed horizontal magnetic fields above F2. As shown in Figure 6(a), the red-blue curve denotes the magnetic neutral line related to F2, and the blue and red segments correspond to the southeast and northwest regions of F2, respectively. It is obvious that the magnetic fields above F2 in the southeast region are weaker than those in the northwest region (see the green curves). The results shown in panels (b) and (c) also reveal that the decay index of horizontal magnetic fields above F2 in the southeast region is significantly larger than that in the northwest region. This means that the overlying horizontal magnetic fields of F2 decay faster with increasing altitude in southeast region than in northwest region. The NLFFF modeling results shown here well support the observations and our speculation that the overlying magnetic fields of F2 are not uniform.
4 Summary and Discussion
Using the high-quality data from the SDO, we present eruptive processes of two filaments (F1 and F2) that occurred on 2015 November 15-16. F1 and F2 were separated by negative magnetic fields and their main axes were almost parallel to each other. On November 15, a sequence of emergence and cancellation of the magnetic flux appeared inside the F1 channel and then F1 erupted. The erupting F1 produced two flare ribbons. The southwestern ribbon spread southwestward and intruded the southeastern region of F2, which lasted about 100 minutes, and then F2 erupted. The eruptive F2 produced also two flare ribbons in its northwestern region, which moved northward and southward respectively. During the evolution of these ribbons, there displayed a clear separating line between the two nearby ribbons related to F1 and F2 eruptions, implying that there is a magnetic separatrice between the two filaments and that F1 and F2 belong to different magnetic systems. In gradual phases after the eruptions of F2, post-flare loops appeared in northwest region of F2, but neither flare ribbons nor post-flare loops were observed in southeast area of F2. Furthermore, the NLFFF extrapolated 3D magnetic fields and decay index distribution of the horizontal fields above F2 reveal that the overlying magnetic fields of F2 in the southeast region are weaker than those in the northwest region and that the overlying horizontal magnetic fields of F2 decay faster with increasing altitude in southeast region than in northwest region.
The eruptions of filaments are closely connected to the evolution of underneath magnetic fields, such as magnetic flux emergence and cancellation. The relationship between them has been analyzed in previous studies (Mandrini et al. 2014; Panesar et al. 2016; Zheng et al. 2017; Yang, & Chen 2019). Zhang et al. (2001) discovered that when the major solar eruption event (a giant filament eruption, a great flare, or an extended Earth-directed coronal mass ejection) happened, the only obvious magnetic change in the course of the event is magnetic flux cancellation at many sites in the vicinity of the filament. Li et al. (2015) found that the location of emerging flux within the filament channel is probably crucial to filament eruption. They suggested that if the flux emergence appeared nearby filament’s barbs, flux cancellation was prone to occur, which probably caused the filament eruption. In the present work, prior to the eruption of F1, obvious magnetic flux cancellation and emission brightening could be observed in F1 channel (Figure 2). When the emission reached the peak, F1 began to erupt (see the dotted vertical white line in Figure 3(b1)). So, we suggest that the flux cancellation happening in F1 channel results in F1 eruption.
As mentioned above, a filament probably erupts due to the magnetic flux emergence and cancellation. If there is another stable filament located just beside this erupting filament coincidentally, the interaction between these two filaments usually is inevitable and the direct collision would result in the eruption of the second filament (Bone et al. 2009; Zheng et al. 2017). However, different from the filament-filament interactions, the sympathetic filament eruptions occur without direct touching between the bodies of filaments or material of filaments (Bumba & Klvana 1993; Wang et al. 2001; Lugaz et al. 2017). The exact nature of sympathetic eruptions is still a controversial issue. Observational investigations (Jiang et al. 2011; Shen et al. 2012; Joshi et al. 2016; Wang et al. 2018) and numerical simulations (Ding et al. 2006; Török et al. 2011; Lynch & Edmondson 2013) suggest that magnetic reconnections of large-scale magnetic fields, which are induced indirectly or directly by distant or nearby eruptions, may be the crucial physical links between sympathetic eruptions, for the reconnections could weaken and partially remove the overlying magnetic fields on the other filaments, resulting in their destabilization and eruptions.
In this work, F2 began to erupt about 100 minutes after FRF1 intruded southeast location of F2 (see Figures 4(b1)-(b3)). And then, we observed two different manifestations in northwest and southeast regions of F2. There were clear flare ribbons formed by the eruptive F2 in the northwest area of F2, which spread northward and southward respectively and the northern one extended to the edge of FRF1 (see Figure 5(a3)). Meanwhile, clear post-flare loops were also observed in the northwest region of F2. But, neither clear flare ribbons nor obvious post-flare loops could be observed in the southeast area of F2 (see Figure 5, and the online animation of Figure 5). These observational results imply that the distribution of the overlying magnetic fields of F2 is not uniform, i.e., the overlying magnetic fields of F2 are stronger in its northwest area, but weaker in its southeast region. The NLFFF reconstructions well support the observations and our speculation that the overlying magnetic fields of F2 are not uniform (see Figure 6). As shown in Figure 4 and its corresponding movie, the northwestern part of FRF1 ceased its apparent motion to the southwest at about 23:50 UT on November 15, meanwhile the southwestern part of FRF1 kept moving southwestward, approaching the site of F2. We suggest that it is possible that the stronger overlying magnetic fields of F2 in northwest area partially blocked FRF1 from expanding southwestward further. In contrast, the weaker overlying magnetic fields in the southeast region of F2 made F2 to be more sensitive to external disturbances happening in that region. As a result, when the southeast part of FRF1 continuously intruded the southeast site of F2, F2 was disturbed to slowly rise and erupt eventually. Note that the AIA observations of full eruption of F2 shows that no active eruption is clearly observed in the southeast part of F2 at the initial phase. The possible reasons, in our opinions, are as follows: Firstly, the speed at which F2 started to rise is too small to distinguish clearly. Secondly, as shown in the H observations, the plasma density of F2 in the southeast region is much less than that in the northwest region (see Figure 1(a)). So it is reasonable that the eruption of F2 appeared more obviously in the northwest region even though it started in the southeast region. Finally, the projection effect may also make a difference here, causing the observations different from the real situations.
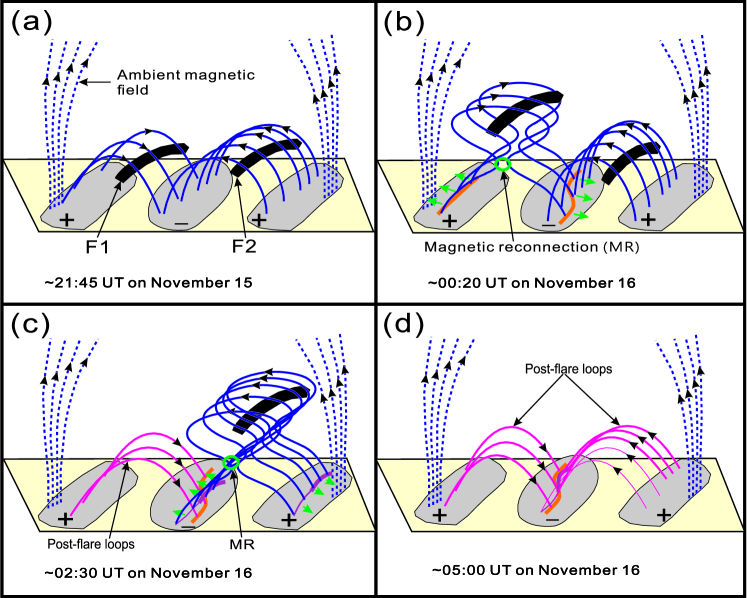
Because no any direct touch between F1 and F2 was observed, we conjecture that the interaction occurring between F1 and F2 belongs to sympathetic one. And the causal link of the sympathetic interaction is that FRF1 invades the southeastern region of F2, where the overflying magnetic fields of F2 are very weak. Based on the multi-wavelength observations, we present a schematic diagram in Figure 7 to illustrate this sympathetic eruptions event. Difference of field line density in Figure 7 is used to indicate the non-uniformity distribution of the overlying magnetic fields of F2. Panel (a) represents the initial magnetic topology of the two filaments and the overlying ambient coronal fields. Flux cancellation happening around the barbs of F1 disturbs F1 (see Figure 2) and results in its final eruption (see Figure 3). Then two flare ribbons are formed after the eruption of F1, one of which keeps spreading toward F2, intruding and disturbing the magnetic system of F2 in its southeast area (panel (b)). As the overlying magnetic fields of F2 are very weak in the disturbed location, the successive disturbance destabilizes F2, and F2 erupts eventually (panel (c), also see Figure 4). After the eruptions of F2, the clear flare ribbons (shown by the thick purple curves) and post-flare loops (shown by the thick red curves in panel (d)) only appear in F2’s northwest region, where the overlying magnetic fields are strong (panels (c)-(d), also see solid squares in Figure 5). And the thin purple and red curves in panels (c)-(d), respectively, are employed to indicate the ambiguous flare ribbons and post-flare loops in F2’s southeast area, where the overlying magnetic fields are very weak (also see the dash-dotted squares in Figure 5).
In the existing research reports on sympathetic filament eruptions, the directly observable criterion is mostly the correlation of the eruptive time between two filaments. Joshi et al. (2016) interpreted two successive eruptions as sympathetic eruptions, which occurred in different active regions and associated by a chain of magnetic reconnections. The phenomenon that fast rise of the second filament began soon after the first filament eruption was suggested as sympathetic eruptions (Li et al. 2017). In the present work, in addition to the temporal correlation, an identifiable causal link between two sympathetic eruptive filaments was observed. To our knowledge, similar observations have never been reported before.
References
- Aulanier et al. (2010) Aulanier, G., Török, T., Démoulin, P., & DeLuca, E. E. 2010, ApJ, 708, 314
- Biesecker & Thompson (2000) Biesecker, D. A., & Thompson, B. J. 2000, Journal of Atmospheric and Solar-Terrestrial Physics, 62, 1449
- Bone et al. (2009) Bone, L. A., van Driel-Gesztelyi, L., Culhane, J. L., et al. 2009, Sol. Phys., 259, 31
- Borrero et al. (2011) Borrero, J. M., Tomczyk, S., Kubo, M., et al. 2011, Sol. Phys., 273, 267
- Bumba & Klvana (1993) Bumba, V., & Klvana, M. 1993, Ap&SS, 199, 45
- Chen et al. (2016) Chen, Y., Du, G., Zhao, D., et al. 2016, ApJ, 820, L37
- Cheng & Ding (2016) Cheng, X., & Ding, M. D. 2016, ApJS, 225, 16
- Dacie et al. (2018) Dacie, S., Török, T., Démoulin, P., et al. 2018, ApJ, 862, 117
- Dechev et al. (2018) Dechev, M., Koleva, K., & Duchlev, P. 2018, New A, 59, 45
- Ding et al. (2006) Ding, J. Y., Hu, Y. Q., & Wang, J. X. 2006, Sol. Phys., 235, 223
- Duchlev et al. (2019) Duchlev, P., Dechev, M., & Koleva, K. 2019, Bulgarian Astronomical Journal, 30, 99
- Filippov (2018) Filippov, B. 2018, MNRAS, 475, 1646
- Gary & Hagyard (1990) Gary, G. A., & Hagyard, M. J. 1990, Sol. Phys., 126, 21
- Harvey et al. (2011) Harvey, J. W., Bolding, J., Clark, R., et al. 2011, AAS/Solar Physics Division Abstracts #42, 17.45
- Hassanin & Kliem (2016) Hassanin, A., & Kliem, B. 2016, ApJ, 832, 106
- Hou et al. (2016) Hou, Y., Zhang, J., Li, T., et al. 2016, ApJ, 829, L29
- Hou et al. (2018) Hou, Y. J., Zhang, J., Li, T., et al. 2018, A&A, 619, A100
- Jiang et al. (2011) Jiang, Y., Yang, J., Hong, J., Bi, Y., & Zheng, R. 2011, ApJ, 738, 179
- Jiang et al. (2014) Jiang, Y., Yang, J., Wang, H., et al. 2014, ApJ, 793, 14
- Joshi et al. (2016) Joshi, N. C., Schmieder, B., Magara, T., Guo, Y., & Aulanier, G. 2016, ApJ, 820, 126
- Kliem et al. (2013) Kliem, B., Su, Y. N., van Ballegooijen, A. A., & DeLuca, E. E. 2013, ApJ, 779, 129
- Kliem et al. (2014) Kliem, B., Török, T., Titov, V. S., et al. 2014, ApJ, 792, 107
- Kliem & Török (2006) Kliem, B., & Török, T. 2006, Phys. Rev. Lett., 96, 255002
- Kopp, & Pneuman (1976) Kopp, R. A., & Pneuman, G. W. 1976, Sol. Phys., 50, 85
- Leka et al. (2009) Leka, K. D., Barnes, G., Crouch, A. D., et al. 2009, Sol. Phys., 260, 83
- Lemen et al. (2012) Lemen, J. R., Title, A. M., Akin, D. J., et al. 2012, Sol. Phys., 275, 17
- Li et al. (2017) Li, S., Su, Y., Zhou, T., et al. 2017, ApJ, 844, 70
- Li et al. (2015) Li, T., Zhang, J., & Ji, H. 2015, Sol. Phys., 290, 1687
- Lugaz et al. (2017) Lugaz, N., Temmer, M., Wang, Y., & Farrugia, C. J. 2017, Sol. Phys., 292, 64
- Lynch & Edmondson (2013) Lynch, B. J., & Edmondson, J. K. 2013, ApJ, 764, 87
- Mackay et al. (2010) Mackay, D. H., Karpen, J. T., Ballester, J. L., Schmieder, B., & Aulanier, G. 2010, Space Sci. Rev., 151, 333
- Mandrini et al. (2014) Mandrini, C. H., Schmieder, B., Démoulin, P., Guo, Y., & Cristiani, G. D. 2014, Sol. Phys., 289, 2041
- Martin (1998) Martin, S. F. 1998, Sol. Phys., 182, 107
- Metcalf (1994) Metcalf, T. R. 1994, Sol. Phys., 155, 235
- Miklenic et al. (2007) Miklenic, C. H., Veronig, A. M., Vršnak, B., et al. 2007, A&A, 461, 697
- Moore et al. (2001) Moore, R. L., Sterling, A. C., Hudson, H. S., & Lemen, J. R. 2001, ApJ, 552, 833
- Panesar et al. (2016) Panesar, N. K., Sterling, A. C., Moore, R. L., & Chakrapani, P. 2016, ApJ, 832, L7
- Pesnell et al. (2012) Pesnell, W. D., Thompson, B. J., & Chamberlin, P. C. 2012, Sol. Phys., 275, 3
- Porfir’eva & Yakunina (2013) Porfir’eva, G. A., & Yakunina, G. V. 2013, Geomagnetism and Aeronomy, 53, 977
- Riley et al. (2011) Riley, P., Lionello, R., Linker, J. A., et al. 2011, Sol. Phys., 274, 361
- Schmieder et al. (2013) Schmieder, B., Démoulin, P., & Aulanier, G. 2013, Advances in Space Research, 51, 1967
- Schou et al. (2012) Schou, J., Scherrer, P. H., Bush, R. I., et al. 2012, Sol. Phys., 275, 229
- Schrijver & Title (2011) Schrijver, C. J., & Title, A. M. 2011, Journal of Geophysical Research (Space Physics), 116, A04108
- Shen et al. (2012) Shen, Y., Liu, Y., & Su, J. 2012, ApJ, 750, 12
- Shibata, & Magara (2011) Shibata, K., & Magara, T. 2011, Living Reviews in Solar Physics, 8, 6
- Sinha et al. (2019) Sinha, S., Srivastava, N., & Nandy, D. 2019, ApJ, 880, 84
- Su et al. (2007) Su, J., Liu, Y., Kurokawa, H., et al. 2007, Sol. Phys., 242, 53
- Sterling et al. (2011) Sterling, A. C., Moore, R. L., & Freeland, S. L. 2011, ApJ, 731, L3
- Sun et al. (2015) Sun, J. Q., Cheng, X., Ding, M. D., et al. 2015, Nature Communications, 6, 7598
- Török et al. (2011) Török, T., Chandra, R., Pariat, E., et al. 2011, ApJ, 728, 65
- Török et al. (2011) Török, T., Panasenco, O., Titov, V. S., et al. 2011, ApJ, 739, L63
- Wang et al. (2018) Wang, D., Liu, R., Wang, Y., et al. 2018, ApJ, 869, 177
- Wang et al. (2001) Wang, H., Chae, J., Yurchyshyn, V., et al. 2001, ApJ, 559, 1171
- Wang et al. (2016) Wang, R., Liu, Y. D., Zimovets, I., et al. 2016, ApJ, 827, L12
- Wheatland et al. (2000) Wheatland, M. S., Sturrock, P. A., & Roumeliotis, G. 2000, ApJ, 540, 1150
- Wiegelmann (2004) Wiegelmann, T. 2004, Sol. Phys., 219, 87
- Woods et al. (2018) Woods, M. M., Inoue, S., Harra, L. K., et al. 2018, ApJ, 860, 163
- Yang, & Chen (2019) Yang, B., & Chen, H. 2019, ApJ, 874, 96
- Yang et al. (2012) Yang, J., Jiang, Y., Zheng, R., et al. 2012, ApJ, 745, 9
- Yang et al. (2017) Yang, L., Yan, X., Li, T., Xue, Z., & Xiang, Y. 2017, ApJ, 838, 131
- Yang, & Zhang (2018) Yang, S., & Zhang, J. 2018, ApJ, 860, L25
- Zaitsev & Stepanov (2018) Zaitsev, V. V., & Stepanov, A. V. 2018, Journal of Atmospheric and Solar-Terrestrial Physics, 179, 149
- Zhang et al. (2001) Zhang, J., Wang, J., & Nitta, N. 2001, Chinese J. Astron. Astrophys., 1, 85
- Zheng et al. (2017) Zheng, R., Zhang, Q., Chen, Y., et al. 2017, ApJ, 836, 160
- Zirker et al. (1997) Zirker, J. B., Martin, S. F., Harvey, K., & Gaizauskas, V. 1997, Sol. Phys., 175, 27