Low work function in the 122-family of iron-based superconductors
Abstract
We determine the work functions of the iron arsenic compounds Fe2As2 () using photoemission spectroscopy to be 2.7 eV for CaFe2As2, 1.8 eV for BaFe2As2, and 1.3 eV for CsFe2As2. The work functions of these 122 iron-based superconductors track those of the elementary metal but are substantially smaller. The most likely explanation of this observation is that the cleaving surface exposes only half an -layer. The low work function and good photoemission cross section of BaFe2As2 and CsFe2As2 enable photoemission even from a common white LED light.
I Introduction
Iron-based high-temperature superconductors (FeSCs) are an intensely studied class of quantum materials. Superconductivity usually appears when nematic and antiferromagnetic phases are suppressed by doping or substitution Paglione and Greene (2010). A prime example are the phase diagrams of doped BaFe2As2, which belongs to the 122 family Shibauchi et al. (2014). The electronic structure is complex with several bands crossing the Fermi level. Angle-resolved photoemission spectroscopy (ARPES) is an indispensable probe of the multi-band and multi-orbital character Yi et al. (2017). Nematicity and magnetism lead to strong modifications of the band structure Hsieh et al. ; Yang et al. (2009); Kim et al. (2011); Wang et al. (2013); Kondo et al. (2010); Liu et al. (2009); Fuglsang Jensen et al. (2011); Yi et al. (2009); de Jong et al. (2010); Liu et al. (2010); Richard et al. (2010); Shimojima et al. (2010); Zabolotnyy et al. (2009); Yi et al. (2011); Pfau et al. (2019a); Fedorov et al. ; Watson et al. (2019). Further photoemission studies with higher resolution and in combination with different tuning parameters will be needed to form a consensus on band assignment and energy scales of these two ordering phenomena Yi et al. (2011); Pfau et al. (2019b); Fedorov et al. ; Watson et al. (2019).
The interpretation of photoemission spectra of FeSCs is complicated by the appearance of surface-related bands Fuglsang Jensen et al. (2011); Pfau et al. (2019a); van Heumen et al. (2011); Watson et al. (2019). The distinction between surface and bulk related features is indispensable for a correct band assignment. The dispersion of surface bands depends on the surface termination and reconstruction van Heumen et al. (2011). However, there is no consensus in the literature on this issue. The work function is an excellent indicator of the surface termination.
In a more general context, accurate analysis of photoemission spectra requires knowledge of the sample work function because it influences the kinetic energy and the emission angle of the outgoing electrons. The influence of the work function is particularly pronounced when the photon energy is of the order of the work function such as in laser-based ARPES Fero et al. (2014). It is therefore valuable to have a reliable information on the work function.
Previously, the work function of a few 122 FeSCs was estimated by measuring the barrier height in scanning tunneling spectroscopy: BaFe2As2 with eV, CaFe2As2 with eV Massee (2011); Hoffman (2011) and PrxCa1-xFe2As2 with 4.5 eV for the surface termination and 3.6 eV for the reconstructed surface Zeljkovic et al. (2013). The first two values are unusually low. The work function of most metals lies between 4 and 5 eV crc (2016). We expect the low work function in 122 FeSCs to influence laser-based ARPES more severely than in other compounds.
Here, we determine the work function of three Fe2As2 FeSCs with using laser-based photoemission spectroscopy Hüfner (2003). The work function for freshly cleaved CaFe2As2 is 2.7 eV, 1.8 eV for BaFe2As2, and 1.3 eV for CsFe2As2. These values track the work functions of the corresponding alkali and alkaline earth metals, but are considerably smaller in the 122 FeSCs. While there is no consensus in the literature which atoms terminate the cleaving surface, we explain our observation with a surface structure containing only half the -layer. The large distance between the surface atoms leads to smoothing of the charge distribution, which in turn lowers the work function. We observe that the work function changes considerably over the course of hours in ultra-high vacuum conditions due to adsorption of residual gas molecules onto the surface. In particular, the work function in CsFe2As2 is one of the lowest reported work functions for any material.
II Methods
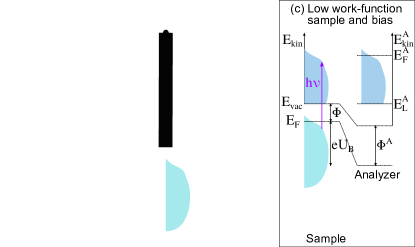
Figure 1 shows energy diagrams for photoemission from samples with different work functions. is defined as the energy required to promote an electron from the Fermi level to the vacuum level . According to Fig. 1(a), photons with energy , that is larger than the sample work function , emit electrons with a kinetic energy
| (1) |
is the electron binding energy with respect to the Fermi energy . The sample and the analyzer are electrically connected and therefore share the same Fermi energy . The difference of their work functions and then changes the kinetic energy of the photoemitted electrons such that the measured kinetic energy is given by
| (2) |
where is the work function of the material that covers the entrance of the analyzer. Photoemitted electrons with zero kinetic energy are accelerated towards the entrance of the analyzer and appear at non-zero kinetic energy for . This low-energy cut-off forms a parabola as function of in-plane momentum as seen for example in Fig. 2(e). The minimum of this parabola appears at normal emission, i.e. zero in-plane momentum.. The sample work function can then be determined by
| (3) |
where is the Fermi level as measured in the analyzer.
Figure 1(b) illustrates that electrons with a small kinetic energy do not reach the analyzer and hence is not accessible when the work function of the sample is lower than the work function of the analyzer. We overcome this problem by applying a negative bias voltage to the sample which accelerates electrons towards the analyzer and leads to an energy diagram as shown in Fig. 1(c). For the sake of simplicity we report here the absolute value of the bias voltage.
Our experimental setup is based on a Coherent RegA 9040 amplifier providing a fundamental photon energy of 1.50 eV with a repetition rate of 312 kHz. 6 eV photons for photoemission are generated by quadrupling the amplifier output. We detect the photoemitted electrons with a Scienta R4000 hemispherical analyzer. The overall energy resolution is 50 meV and dominated by the bandwidth of the ultrafast 6 eV pulses. Samples are cleaved in-situ at a base pressure of Torr. All measurements were performed at room temperature unless otherwise noted. We applied a variable bias voltage using standard alkaline batteries. We studied single crystals of CaFe2As2, BaFe2As2, and CsFe2As2. They were grown from an FeAs flux as described previously Chu et al. (2009); Rotundu et al. (2010).
III Results and Discussion
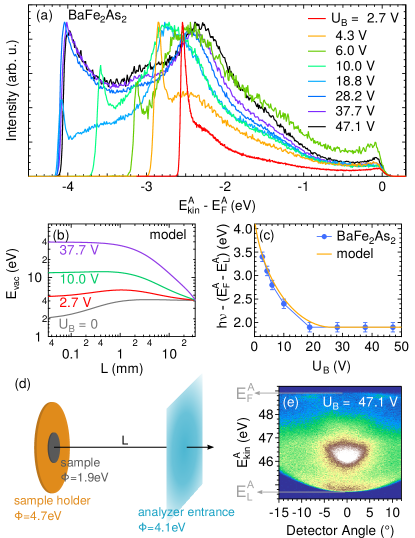
Figure 2(a) presents energy distribution curves (EDCs) of BaFe2As2 at normal emission for different bias voltages . We observe that the width of the spectrum increases with increasing . While this behavior is expected for small bias voltages from our considerations in Fig. 1(b,c), it is surprising for larger bias . We plot the apparent work function in Fig. 2(c). It approaches a constant value of 1.9 eV for eV.
We explain the bias dependence by considering an electrostatic model as shown in Fig. 2(d). We assume the sample to be a disk with a radius of 0.5 mm, which approximates our sample size. We assume a work function of eV for the sample as obtained from for large . The shape of the sample holder is approximated by a disk with a radius of 5 mm. It consists of copper with a work function of 4.7 eV. The analyzer entrance is considered to be an infinite plate 34 mm away from the sample, which corresponds to the distance in our experiment. The graphite-coated analyzer has a work function of 4.1 eV.
Using this model, we calculate the electrostatic potential along the axis ranging from the sample to the analyzer, which we plot in Fig. 2(b). The result demonstrates that photoemitted electrons with a small kinetic energy are not able to reach the detector if the bias voltage is too small to overcome the local potential well near the sample surface. The apparent work function from this model plotted in Fig. 2(c) reproduces the experimentally determined data well. Our model shows that a large enough bias needs to be applied to correctly extract the work function from the spectral width . We made sure that this width is independent of for the following measurements of . We show a typical ARPES spectrum in Fig. 2(e) where is seen at large kinetic energies and the parabola of the low-energy cut-off at low kinetic energies.
| (eV) | (eV) | |||
|---|---|---|---|---|
| CaFe2As2 | 2.7 | Ca | 2.9 | 45.8 |
| BaFe2As2 | 1.8 | Ba | 2.5 | 31.6 |
| CsFe2As2 | 1.3 | Cs | 2.0 | 8.6 |
| As | 3.8 |
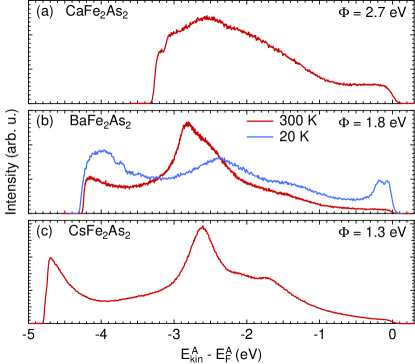
We determined the work function of three members of the 122 FeSC family: CaFe2As2, BaFe2As2, and CsFe2As2. The EDCs at normal emission are shown in Fig. 3. All three data sets were obtained immediately after cleaving. We summarize the results in Table 1. The error of the measurement determined from the width of the low-energy cut-off as well as the time and sample dependence is 0.1 eV. The work function of all three samples is much lower than the work function of most metals, for example eV for Au(111) or 4.81 eV for Fe(111) crc (2016). The work functions we determined on BaFe2As2 and CaFe2As2 agree reasonably well with those reported by Massee Massee (2011) and are only slightly higher.
Cleaving Fe2As2 is expected to leave the FeAs bond intact and to expose either As or -atoms Hoffman (2011). Tunneling images of cleaved surfaces typically show only half the atoms expected for a full or As layer, mostly in a or a reconstruction Hoffman (2011). However, there is no consensus in literature if the As or the atoms terminate the cleaving surface. Currently, proposals for the most common surface reconstructions include (i) a or reconstructed half layer of atoms Hsieh et al. ; Yin et al. (2009); Massee et al. (2009); Zhang et al. (2010); van Heumen et al. (2011); Nishizaki et al. (2011); Gao et al. (2010); Zeljkovic et al. (2013); Song et al. (2013); Li et al. (2014), (ii) a full layer of As with specific tunneling matrix elements Nascimento et al. (2009); Li et al. (2012); Niestemski et al. ; Nishizaki et al. (2011) or with a dimerizationLi et al. (2019); Huang et al. (2013), or (iii) a complete layer with a buckling reconstruction Li et al. (2019). While Massee reported that the work function is independent of the surface reconstruction and the same over dozens of cleaved samples Massee (2011), Zeljkovic found different work functions for differently reconstructed surfaces Zeljkovic et al. (2013). With the finite beam spot size, we likely probe different surface reconstructions at the same time but can only detect the lowest work function.
In Table 1, we compare to the work function of the elements Ca, Ba, and Cs, and of As. is consistently lower than the work function of the corresponding elements. However, we observe a clear correlation between and . This correlation suggests that the surfaces of cleaved Fe2As2 are consistently terminated by atoms.
Generally, the work function depends on three energy scales: (1) The chemical potential of the bulk, (2) a surface dipole created by the electronic wave function spilling out into the vacuum, and (3) an opposing surface dipole created by the smoothing of the charge distribution on a rough surface Lang and Kohn (1971); Smoluchowski (1941); Wigner and Bardeen (1935). (1) and (2) are governed by the valence electron density , which we list in Table 1 for the elementary metals. The work function is expected to decrease with decreasing Lang and Kohn (1971), which agrees with the trends of and of the FeSCs presented in Table 1. The difference between and can thus be attributed to (3). In general, a rougher surface has a larger dipole due to the smoothing of the electron distribution, which reduces the work function Smoluchowski (1941). A half layer of atoms on the surface results in a substantially rougher surface than for a complete layer and can explain why the work function in 122 FeSCs is smaller than in the polycrystalline metals. A similar but smaller effect can be expected for a buckling reconstruction of the atoms.
It has been shown that the surface reconstructions depend on cleaving temperature and can undergo structural transitions as function of temperature Massee et al. (2009); Massee (2011); Hsieh et al. . Our measurements of in BaFe2As2 do not show a significant difference between cleaving at room temperature and 20 K, see Fig. 3(b). We conclude that the main mechanism of the low work function is the half layer at the surface and not its particular ordering. This conclusion is supported by our observation (not shown) that an increase in temperature from 20 K to 200 K across the reported structural transition of the surface reconstruction does not lead to a sudden change in work function.
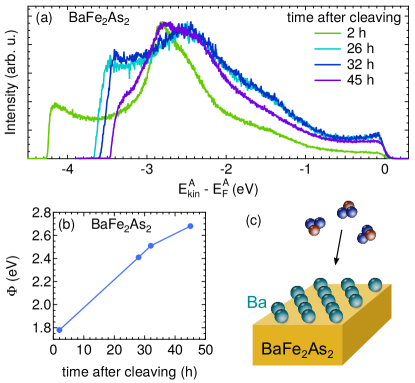
For photoemission studies of 122 FeSCs, it is important to understand that the work function changes over time due to the adsorption of residual gas molecules. We therefore studied the time dependence of the work function on BaFe2As2 at room temperature at a pressure of Torr and present the results in Fig. 4. We find that the work function increases by almost 1 eV over the course of 48 h. We explain this relatively large change by the difference between the small initial value of and the work function of eV of typical adsorbates such as water.
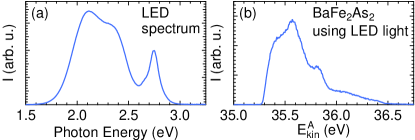
The low work function of 122 FeSCs can cause unexpected experimental challenges. Remarkably, the LED light that illuminates the inside of the vacuum chamber leads to substantial photoemission intensities from the BaFe2As2 sample. In Fig. 5(a), we present the optical spectrum of the LED after transmission through a BK7 window as used as viewports in our vacuum system. The main spectral intensity is located between 2 and 2.5 eV photon energy, which is large enough to overcome the work function of CsFe2As2 and BaFe2As2. A bias is again necessary to overcome the potential barrier and detect the photoelectrons with the analyzer as we showed earlier. The corresponding photoemission spectrum of BaFe2As2 is plotted in Fig. 5(b). Due to the considerable cross section for photoemission from these white LED lights, we performed our experiments with the lights switched off.
The work function of CsFe2As2 is one of the lowest reported for any material. Coating a surface with Cs has been widely used to lower a sample’s work function and values between 1.0 eV and 1.4 eV are typical Yuan et al. (2016); Su et al. (1983); Bazarov et al. (2008); Karkare et al. (2014); Zhang et al. (2011); Desplat and Papageorgopoulos (1980); Sun et al. (2007). This technique is for example applied for photocathodes such as Cs-O coated GaAs Su et al. (1983); Bazarov et al. (2008); Karkare et al. (2014); Zhang et al. (2011). Low work function materials are generally desirable for laser driven electron sources, because light in the visible range can be used. Such lasers typically provide a larger photon flux than UV sources.
IV Summary
The work function of 122 FeSCs determined by photoemission spectroscopy is lower than in other quantum materials. In particular, 1.3 eV found for CsFe2As2 is one of the lowest reported work functions for any material. The work function correlates with that of the alkaline earth and alkali atoms present at the surface, but is lowered by the roughness of the surface that contains only half an atomic layer. The low work function and good photoemission cross section leads to photoemission from a white LED light. We demonstrated that for low work function materials photoelectrons with a low kinetic energy are not able reach the analyzer and require the application of a bias voltage of up to 40 V to overcome the local potential well. The work function changes considerably over time under ultrahigh vacuum conditions due to the adsorption of residual gas molecules onto the sample surface.
Acknowledgements.
H.P. acknowledges support from the Alexander von Humboldt Foundation and from the German Science Foundation (DFG) under reference PF 947/1-1. J.C.P. is supported by a Gabilan Stanford Graduate Fellowship and a NSF Graduate Research Fellowship (Grant No. DGE-114747). The work at the ALS is supported by US DOE under contract no. DE-AC02-05CH11231. This work was supported by the U.S. Department of Energy, Office of Science, Basic Energy Sciences, Materials Sciences, and Engineering Division, under Contract No. DE-AC02-76SF00515.References
- Paglione and Greene (2010) J. Paglione and R. L. Greene, Nat. Phys. 6, 645 (2010).
- Shibauchi et al. (2014) T. Shibauchi, A. Carrington, and Y. Matsuda, Annu. Rev. Condens. Matter Phys. 5, 113 (2014).
- Yi et al. (2017) M. Yi, Y. Zhang, Z.-X. Shen, and D. Lu, npj Quantum Materials 2, 57 (2017).
- (4) D. Hsieh, Y. Xia, L. Wray, D. Qian, K. Gomes, A. Yazdani, G. F. Chen, J. L. Luo, N. L. Wang, and M. Z. Hasan, arxiv:0812.2289v1 .
- Yang et al. (2009) L. X. Yang, Y. Zhang, H. W. Ou, J. F. Zhao, D. W. Shen, B. Zhou, J. Wei, F. Chen, M. Xu, C. He, Y. Chen, Z. D. Wang, X. F. Wang, T. Wu, G. Wu, X. H. Chen, M. Arita, K. Shimada, M. Taniguchi, Z. Y. Lu, T. Xiang, and D. L. Feng, Phys. Rev. Lett. 102, 107002 (2009).
- Kim et al. (2011) Y. Kim, H. Oh, C. Kim, D. Song, W. Jung, B. Kim, H. J. Choi, C. Kim, B. Lee, S. Khim, H. Kim, K. Kim, J. Hong, and Y. Kwon, Phys. Rev. B 83, 064509 (2011).
- Wang et al. (2013) Q. Wang, Z. Sun, E. Rotenberg, F. Ronning, E. D. Bauer, H. Lin, R. S. Markiewicz, M. Lindroos, B. Barbiellini, A. Bansil, and D. S. Dessau, Phys. Rev. B 88, 235125 (2013).
- Kondo et al. (2010) T. Kondo, R. M. Fernandes, R. Khasanov, C. Liu, A. D. Palczewski, N. Ni, M. Shi, A. Bostwick, E. Rotenberg, J. Schmalian, S. L. Bud’ko, P. C. Canfield, and A. Kaminski, Phys. Rev. B 81, 060507 (2010).
- Liu et al. (2009) G. Liu, H. Liu, L. Zhao, W. Zhang, X. Jia, J. Meng, X. Dong, J. Zhang, G. F. Chen, G. Wang, Y. Zhou, Y. Zhu, X. Wang, Z. Xu, C. Chen, and X. J. Zhou, Phys. Rev. B 80, 134519 (2009).
- Fuglsang Jensen et al. (2011) M. Fuglsang Jensen, V. Brouet, E. Papalazarou, A. Nicolaou, A. Taleb-Ibrahimi, P. Le Fèvre, F. Bertran, A. Forget, and D. Colson, Phys. Rev. B 84, 014509 (2011).
- Yi et al. (2009) M. Yi, D. H. Lu, J. G. Analytis, J.-H. Chu, S.-K. Mo, R.-H. He, M. Hashimoto, R. G. Moore, I. I. Mazin, D. J. Singh, Z. Hussain, I. R. Fisher, and Z.-X. Shen, Phys. Rev. B 80, 174510 (2009).
- de Jong et al. (2010) S. de Jong, E. van Heumen, S. Thirupathaiah, R. Huisman, F. Massee, J. B. Goedkoop, R. Ovsyannikov, J. Fink, H. A. Dürr, A. Gloskovskii, H. S. Jeevan, P. Gegenwart, A. Erb, L. Patthey, M. Shi, R. Follath, A. Varykhalov, and M. S. Golden, EPL (Europhysics Letters) 89, 27007 (2010).
- Liu et al. (2010) C. Liu, T. Kondo, R. M. Fernandes, A. D. Palczewski, E. D. Mun, N. Ni, A. N. Thaler, A. Bostwick, E. Rotenberg, J. Schmalian, S. L. Budko, P. C. Canfield, and A. Kaminski, Nat. Phys. 6, 419 (2010).
- Richard et al. (2010) P. Richard, K. Nakayama, T. Sato, M. Neupane, Y.-M. Xu, J. H. Bowen, G. F. Chen, J. L. Luo, N. L. Wang, X. Dai, Z. Fang, H. Ding, and T. Takahashi, Phys. Rev. Lett. 104, 137001 (2010).
- Shimojima et al. (2010) T. Shimojima, K. Ishizaka, Y. Ishida, N. Katayama, K. Ohgushi, T. Kiss, M. Okawa, T. Togashi, X.-Y. Wang, C.-T. Chen, S. Watanabe, R. Kadota, T. Oguchi, A. Chainani, and S. Shin, Phys. Rev. Lett. 104, 057002 (2010).
- Zabolotnyy et al. (2009) V. B. Zabolotnyy, D. S. Inosov, D. V. Evtushinsky, A. Koitzsch, A. A. Kordyuk, G. L. Sun, J. T. Park, D. Haug, V. Hinkov, A. V. Boris, C. T. Lin, M. Knupfer, A. N. Yaresko, B. Büchner, A. Varykhalov, R. Follath, and S. V. Borisenko, Nature 457, 569 (2009).
- Yi et al. (2011) M. Yi, D. Lu, J.-H. Chu, J. G. Analytis, A. P. Sorini, A. F. Kemper, B. Moritz, S.-K. Mo, R. G. Moore, M. Hashimoto, W.-S. Lee, Z. Hussain, T. P. Devereaux, I. R. Fisher, and Z.-X. Shen, Proc. Natl. Acad. Sci. U.S.A. 108, 6878 (2011).
- Pfau et al. (2019a) H. Pfau, C. R. Rotundu, J. C. Palmstrom, S. D. Chen, M. Hashimoto, D. Lu, A. F. Kemper, I. R. Fisher, and Z.-X. Shen, Phys. Rev. B 99, 035118 (2019a).
- (19) A. Fedorov, A. Yaresko, E. Haubold, Y. Kushnirenko, T. Kim, B. Buechner, S. Aswartham, S. Wurmehl, and S. Borisenko, arxiv:1811.02430v2 .
- Watson et al. (2019) M. D. Watson, P. Dudin, L. C. Rhodes, D. V. Evtushinsky, H. Iwasawa, S. Aswartham, S. Wurmehl, B. Büchner, M. Hoesch, and T. K. Kim, npj Quantum Materials 4, 36 (2019).
- Pfau et al. (2019b) H. Pfau, S. D. Chen, M. Yi, M. Hashimoto, C. R. Rotundu, J. C. Palmstrom, T. Chen, P.-C. Dai, J. Straquadine, A. Hristov, R. J. Birgeneau, I. R. Fisher, D. Lu, and Z.-X. Shen, Phys. Rev. Lett. 123, 066402 (2019b).
- van Heumen et al. (2011) E. van Heumen, J. Vuorinen, K. Koepernik, F. Massee, Y. Huang, M. Shi, J. Klei, J. Goedkoop, M. Lindroos, J. van den Brink, and M. S. Golden, Phys. Rev. Lett. 106, 027002 (2011).
- Fero et al. (2014) A. Fero, C. Smallwood, G. Affeldt, and A. Lanzara, J. Electron Spectrosc. Relat. Phenom. 195, 237 (2014).
- Massee (2011) F. Massee, A tunneler’s view on correlated oxides and iron based superconductors, Ph.D. thesis, Universiteit van Amsterdam (2011).
- Hoffman (2011) J. E. Hoffman, Rep. Prog. Phys. 74, 124513 (2011).
- Zeljkovic et al. (2013) I. Zeljkovic, D. Huang, C.-L. Song, B. Lv, C.-W. Chu, and J. E. Hoffman, Phys. Rev. B 87, 201108(R) (2013).
- crc (2016) CRC Handbook of Chemistry and Physics, 97th ed. (CRC Press, 2016).
- Hüfner (2003) S. Hüfner, Photoelectron Spectroscopy (Springer-Verlag Berlin Heidelberg, 2003).
- Chu et al. (2009) J.-H. Chu, J. G. Analytis, C. Kucharczyk, and I. R. Fisher, Phys. Rev. B 79, 014506 (2009).
- Rotundu et al. (2010) C. R. Rotundu, B. Freelon, T. R. Forrest, S. D. Wilson, P. N. Valdivia, G. Pinuellas, A. Kim, J.-W. Kim, Z. Islam, E. Bourret-Courchesne, N. E. Phillips, and R. J. Birgeneau, Phys. Rev. B 82, 144525 (2010).
- Yin et al. (2009) Y. Yin, M. Zech, T. L. Williams, X. F. Wang, G. Wu, X. H. Chen, and J. E. Hoffman, Phys. Rev. Lett. 102, 097002 (2009).
- Massee et al. (2009) F. Massee, S. de Jong, Y. Huang, J. Kaas, E. van Heumen, J. B. Goedkoop, and M. S. Golden, Phys. Rev. B 80, 140507 (2009).
- Zhang et al. (2010) H. Zhang, J. Dai, Y. Zhang, D. Qu, H. Ji, G. Wu, X. F. Wang, X. H. Chen, B. Wang, C. Zeng, J. Yang, and J. G. Hou, Phys. Rev. B 81, 104520 (2010).
- Nishizaki et al. (2011) T. Nishizaki, Y. Nakajima, T. Tamegai, and N. Kobayashi, J. Phys. Soc. Jpn. 80, 014710 (2011).
- Gao et al. (2010) M. Gao, F. Ma, Z.-Y. Lu, and T. Xiang, Phys. Rev. B 81, 193409 (2010).
- Song et al. (2013) C.-L. Song, Y. Yin, M. Zech, T. Williams, M. M. Yee, G.-F. Chen, J.-L. Luo, N.-L. Wang, E. W. Hudson, and J. E. Hoffman, Phys. Rev. B 87, 214519 (2013).
- Li et al. (2014) G. Li, L. Liang, Q. Li, M. Pan, V. B. Nascimento, X. He, A. B. Karki, V. Meunier, R. Jin, J. Zhang, and E. W. Plummer, Phys. Rev. Lett. 112, 077205 (2014).
- Nascimento et al. (2009) V. B. Nascimento, A. Li, D. R. Jayasundara, Y. Xuan, J. O’Neal, S. Pan, T. Y. Chien, B. Hu, X. B. He, G. Li, A. S. Sefat, M. A. McGuire, B. C. Sales, D. Mandrus, M. H. Pan, J. Zhang, R. Jin, and E. W. Plummer, Phys. Rev. Lett. 103, 076104 (2009).
- Li et al. (2012) G. Li, X. He, J. Zhang, R. Jin, A. S. Sefat, M. A. McGuire, D. G. Mandrus, B. C. Sales, and E. W. Plummer, Phys. Rev. B 86, 060512(R) (2012).
- (40) F. C. Niestemski, V. B. Nascimento, B. Hu, W. Plummer, J. Gillett, S. Sebastian, Z. Wang, and V. Madhavan, arxiv:0906.2761v1 .
- Li et al. (2019) A. Li, J.-X. Yin, J. Wang, Z. Wu, J. Ma, A. S. Sefat, B. C. Sales, D. G. Mandrus, M. A. McGuire, R. Jin, C. Zhang, P. Dai, B. Lv, C.-W. Chu, X. Liang, P.-H. Hor, C.-S. Ting, and S. H. Pan, Phys. Rev. B 99, 134520 (2019).
- Huang et al. (2013) Y.-B. Huang, P. Richard, J.-H. Wang, X.-P. Wang, X. Shi, N. Xu, Z. Wu, A. Li, J.-X. Yin, T. Qian, B. Lv, C.-W. Chu, S.-H. Pan, M. Shi, and H. Ding, Chin. Phys. Lett. 30, 017402 (2013).
- Lang and Kohn (1971) N. D. Lang and W. Kohn, Phys. Rev. B 3, 1215 (1971).
- Smoluchowski (1941) R. Smoluchowski, Phys. Rev. 60, 661 (1941).
- Wigner and Bardeen (1935) E. Wigner and J. Bardeen, Phys. Rev. 48, 84 (1935).
- Yuan et al. (2016) D. Yuan, J. Yuan, Y. Huang, S. Ni, Z. Feng, H. Zhou, Y. Mao, K. Jin, G. Zhang, X. Dong, F. Zhou, and Z. Zhao, Phys. Rev. B 94, 060506 (2016).
- Su et al. (1983) C. Y. Su, W. E. Spicer, and I. Lindau, J. Appl. Phys. 54, 1413 (1983).
- Bazarov et al. (2008) I. V. Bazarov, B. M. Dunham, Y. Li, X. Liu, D. G. Ouzounov, C. K. Sinclair, F. Hannon, and T. Miyajima, J. Appl. Phys. 103, 054901 (2008).
- Karkare et al. (2014) S. Karkare, L. Boulet, L. Cultrera, B. Dunham, X. Liu, W. Schaff, and I. Bazarov, Phys. Rev. Lett. 112, 097601 (2014).
- Zhang et al. (2011) Y. Zhang, B. Chang, J. Niu, J. Zhao, J. Zou, F. Shi, and H. Cheng, Appl. Phys. Lett. 99, 101104 (2011).
- Desplat and Papageorgopoulos (1980) J.-L. Desplat and C. Papageorgopoulos, Surf. Sci. 92, 97 (1980).
- Sun et al. (2007) Y. Sun, Z. Liu, P. Pianetta, and D.-I. Lee, J. Appl. Phys. 102, 074908 (2007).