Anisotropic infall in the outskirts of OmegaWINGS galaxy clusters
Abstract
We study the effects of the environment on galaxy quenching in the outskirts of clusters at . We use a subsample of 14 WINGS and OmegaWINGS clusters that are linked to other groups/clusters by filaments and study separately galaxies located in two regions in the outskirts of these clusters according to whether they are located towards the filaments’ directions or not. We also use samples of galaxies in clusters and field as comparison. Filamentary structures linking galaxy groups/clusters were identified over the Six Degree Field Galaxy Redshift Survey Data Release 3. We find a fraction of passive galaxies in the outskirts of clusters intermediate between that of the clusters and the field’s. We find evidence of a more effective quenching in the direction of the filaments. We also analyse the abundance of post-starburst galaxies in the outskirts of clusters focusing our study on two extreme sets of galaxies according to their phase-space position: backsplash and true infallers. We find that up to of post-starburst galaxies in the direction of filaments are likely backsplash, while this number drops to in the isotropic infall region. The presence of this small fraction of galaxies in filaments that are falling into clusters for the first time and have been recently quenched, supports a scenario in which a significant number of filament galaxies have been quenched long time ago.
keywords:
galaxies: evolution – galaxies: clusters: general – galaxies: groups: general – galaxies: star formation – galaxies: statistics.1 Introduction
It is well known that the environment affects the properties of galaxies such as star formation, morphology, luminosity, colour, gas content, and the structure of their subsystems. In dense environments, galaxies tend to be massive, red, early-type, with little or no on-going star formation activity, inhabiting the red sequence of the diagram color-magnitude (CMD). On the other hand, a population of less massive, blue, late-type, and star forming galaxies that lie on the blue cloud of the CMD, is found in low density environments. Galaxy morphology correlates strongly with the local galaxy density or the distance from the cluster centre (e.g. Dressler 1980, Whitmore et al. 1993, Domínguez et al. 2001, Bamford et al. 2009, Paulino-Afonso et al. 2019). Colour and luminosity have been proposed as two of the properties that predict best the environment (e.g. Blanton et al. 2005, Martínez & Muriel 2006, Martínez et al. 2008). Moreover, the CMD correlates with the environment (e.g. Schawinski et al. 2007, Martínez et al. 2010, Cooper et al. 2010b, Coenda et al. 2018) and morphological types (e.g. Takamiya et al. 1995, Schawinski et al. 2009, Masters et al. 2010). This is related to the dependence of the fraction of star-forming galaxies on the environment (e.g. Hashimoto et al. 1998, Mateus & Sodré 2004, Rines & Diaferio 2005, Blanton & Moustakas 2009, Welikala et al. 2008, Schaefer et al. 2017, Coenda et al. 2019). In additon, galaxies in low density environments appear on average younger than their counterparts in high-density environments (e.g. Thomas et al. 2005, Cooper et al. 2010a, Zheng et al. 2017).
Clusters of galaxies are the most massive objects in virial equilibrium that can be found in the Universe. These systems grow by the accretion of galaxies and groups of galaxies from their outskirts preferentially alongside filaments, and, to a lesser extent, from other directions. The cluster environment is characterised by a deep gravitational potential well, and by an intra-cluster medium (ICM) which is filled with hot ionised gas. Inside clusters, galaxies have properties that differ from those in the field. Galaxies passing through the ICM at high velocities suffer ram pressure stripping that removes an important fraction of their cold gas (Gunn & Gott 1972, Abadi et al. 1999), with the consequent decrease of their SFR. The trip of a galaxy through the ICM can also remove the galaxy’s warm gas, mechanism known as starvation (Larson et al. 1980; McCarthy et al. 2008; Bekki 2009; Bahé et al. 2013; Vijayaraghavan & Ricker 2015). Starvation cuts off the supply of gas that cools out from the galaxy’s halo, thus inhibiting subsequent star formation. Other mechanisms that galaxies experience in their passage through the inner region of clusters which are responsible of affecting their evolution are: tidal stripping (e.g. Zwicky 1951; Gnedin 2003a; Villalobos et al. 2014); thermal evaporation (e.g. Cowie & Songaila 1977); and galaxy - galaxy interactions or harassment (e.g. Moore et al. 1996; Moore et al. 1999; Gnedin 2003b).
Most of the processes described in the previous paragraph tend to decrease or completely suppress the star formation in galaxies and are generally referred to as galaxy quenching. Besides all the aforementioned environmental sources of quenching, the shut down of the star formation can also be produced by intrinsic properties of galaxies. These processes are strongly correlated with the stellar mass, therefore they are collectively refered to as mass quenching. Among the suggested processes are: supernova-driven winds (e.g., Stringer et al. 2012; Bower et al. 2012), halo heating (Marasco et al., 2012), and AGN feedback (e.g., Nandra et al. 2007; Hasinger 2008; Silverman et al. 2008; Cimatti et al. 2013).
In the framework of the hierarchical formation of structures, clusters of galaxies are continuously accreting galaxies. It has been suggested that in this process of falling, galaxies could undergo different physical processes that could affect the star formation even before they reach the cluster. Consequently, to fully understand what the cluster environment produces in galaxies, it is of key importance to have a throughout characterisation of the population of galaxies in the outskirts of clusters. Several observations have shown that properties of galaxies such as star formation, gas content and colour, are affected by the cluster environment at large clustercentric distances (e.g. Solanes et al. 2002; Lewis et al. 2002; Gómez et al. 2003; Braglia et al. 2009; Park & Hwang 2009; Hansen et al. 2009; von der Linden et al. 2010; Haines et al. 2015; Rhee et al. 2017). In particular, spiral galaxies with low star formation rates were found in the outskirts of clusters in early studies such as Couch et al. (1998), or Dressler et al. (1999). In recent years, a deficit of star forming galaxies in the infalling region of clusters has been reported (e.g. Wetzel et al. 2013; Haines et al. 2015; Bianconi et al. 2018). This has been reproduced in simulations by Bahé et al. (2013). These results can be explained by the presence of environmental effects accelerating the consumption of the gas reservoir before galaxies enter in a cluster, a process known as pre-processing (e.g. Mihos 2004; Fujita 2004). An important fraction of the cluster galaxies have spent time in groups or filaments before they fall into the cluster (e.g. McGee et al. 2009; De Lucia et al. 2012; Wetzel et al. 2013; Hou et al. 2014). The population of galaxies in the outskirts of clusters includes not only galaxies that have not yet entered the cluster but also backsplash galaxies, i.e., galaxies that have passed close to the centre of the cluster since their infall and are now beyond the virial radius (e.g. Mamon et al. 2004; Gill et al. 2005; Mahajan et al. 2011). For an adequate characterisation of the properties of galaxies that are falling into clusters, it is important to take into account the contamination by backsplash galaxies, which, having orbited through the inner regions of a cluster, could have been affected by the physical processes present in that extreme environment. The backsplash scenario in the evolution of galaxies has also been explored in Rines & Diaferio (2005), Pimbblet et al. (2006), Aguerri & Sánchez-Janssen (2010) and Muriel & Coenda (2014).
Some studies have analysed the infall region considering all possible directions, while other works consider the fall through filaments only. The ESO Distant Cluster Survey (White et al., 2005) has been used to study the infall region of clusters in the redshift range (Just et al., 2015). They find that the fraction of red galaxies in the outskirts of clusters is intermediate between the field and cluster values, and conclude that pre-processing may have already started during the fall. In addition, Bianconi et al. (2018) analyse a galaxy cluster sample down from the Local Cluster Substructure Survey, and find that the fraction of star forming galaxies in infalling groups, is lower as a function of the clustercentric distance than in the overall galaxy population in clusters. They consider this as an evidence of pre-processing of galaxies within groups that are falling into galaxy clusters. Einasto et al. (2018) have studied the structure and galaxy population in the cluster A2142 and its outskirts. They propose that this cluster has been formed as a result of infalling groups and past and recent mergers, along the filament axis.
Using cosmological simulations, Zinger et al. (2018) have found that the hot gas is removed from galaxy halos, and this process is more effective between 1 and 3 virial radii. They argue that the removal of gas from the galaxy’s halo sets the stage for the quenching of the star formation by starvation over 2-3 Gyr before it enters the cluster. Although it is a slow process (the gas in the disc cannot be replenished and the star formation in the galaxy will eventually cease), it anticipates the quenching that will be completed once the galaxy enters the cluster.
There are several works that focus the analysis on the properties of galaxies in the filament region. Kraljic et al. (2018) have studied the impact of the large-scale environment on galaxy properties in the nearby Universe, using the Galaxy And Mass Assembly (GAMA, Driver et al. 2009). They identify peaks of density, filaments, and walls, in the distribution of galaxies. They find that the fraction of red galaxies increases when approaching to the peaks of density within filaments. Using the same survey, Alpaslan et al. (2016) have found that isolated spiral galaxies have higher stellar masses and lower SFR towards the inner regions of filaments than in the filament periphery. Similarly, Laigle et al. (2018) study the properties of galaxies with photometric redshifts in the range and find that, at fixed stellar mass, passive galaxies are more confined towards the core of filaments.
Using the Sloan Digital Sky Survey (SDSS, York et al. 2000), Chen et al. (2017) find that at the same local density, galaxies that reside closer to filaments are more massive than those further out, in agreement with Alpaslan et al. (2016) and Laigle et al. (2018). Using the same survey, but at intermediate redshifts, , Zhang et al. (2013) detect an evolution in the blue fraction of filament galaxies located in between pairs of clusters, that is not observed in clusters. At higher redshift (), Malavasi et al. (2017) use the VIPERS survey (Guzzo et al., 2014) and find a segregation in star formation, in the sense that star-forming galaxies are preferentially located in the outskirts of filaments. A different result was reported by Darvish et al. (2014), who find at an intrinsic enhancement of the fraction of emitters in filaments with respect to clusters and the field. More recently, Vulcani et al. (2019) analyse the spatial distribution of emission of galaxies in filaments and find four galaxies with recent star formation. They hypothesize that these galaxies are passing through filaments that are able to cool the gas and increase the star formation.
Galaxies are accreted to clusters mainly through filaments (e.g. Colberg et al. 1999; Ebeling et al. 2004), and to a lesser extent from other directions. A question that arises is whether, depending on the infall direction, they experience different processes. In other words, whether the properties of galaxies in the outskirts of clusters are the same in all directions, or, on the contrary, they depend on the presence of filaments linking clusters. Martínez et al. (2016) select filaments between galaxy groups in the SDSS up to . They distinguish whether galaxies are falling into groups along filaments or from other directions (isotropic infalling). They find that filaments play a specific role in quenching galax ies that is revealed when comparing to the isotropic infall region. A similar analysis has been recently done using VIPERS data in the redshift range by Salerno et al. (2019), finding similar results to the low redshift analysis by Martínez et al. (2016), and showing that the filament environment was able to effectively quench galaxies as early as .
Our goal is to study the effects of environment upon galaxies that are falling into rich clusters. We distinguish between galaxies that are infalling in the directions defined by filaments from those that are being accreted isotropically. Studying the peripheries of galaxy clusters has a serious drawback in the contamination by interloper galaxies, making necessary the use of spectroscopic redshifts. The OmegaWINGS spectroscopic survey (Gullieuszik et al. 2015; Moretti et al. 2017 ) enlarges the number of cluster members of WINGS clusters (Fasano et al. 2006; Moretti et al. 2014) out to large radii, reaching the virial radius and beyond. Therefore, these surveys constitute an excellent sample for studying the outskirts of galaxy clusters.
This article is organised as follows: we describe the galaxy data in Sect. 2.1; Sect. 2.2 deals with the identification of filaments and the resulting cluster sample; the outskirts of clusters are described in Sect. 2.3. In Sect. 3 we compare the fraction of passive (3.1), emission line (3.1), and post-starburst (3.2) galaxies, in clusters, field, filaments, and the isotropic infall region. We also discuss the implications of our results in that section. Finally, we summarise our main results in Sect. 4. Throughout the paper we assume a flat cosmology with density parameters , , and a Hubble’s constant .
2 Samples
2.1 WINGS and OmegaWINGS clusters and galaxies
Clusters of galaxies used in this paper are a subsample drawn from the OmegaWINGS spectroscopic survey (hereafter OW, Gullieuszik et al. (2015); Moretti et al. (2017). This survey is an extension of the WIde-field Nearby Galaxy-cluster Survey (WINGS, Fasano et al. 2006; Moretti et al. 2014), a multi-wavelength survey designed to cover the outskirts of 76 rich clusters, with redshift range that were selected from the ROSAT All Sky Survey (Ebeling et al. 1996).
OmegaWINGS extends the WINGS survey in terms of cluster spatial coverage for 46 of these clusters, imaging in the U, B, and V bands have been obtained covering an area of 1 deg2. Also, it covers a wide range of velocity dispersion , X-ray luminosity , and . The target selection was similar for the two surveys (Cava et al., 2009; Moretti et al., 2017). They were selected to have a total magnitude brighter than , excluding only those well above the color-magnitude sequence with . We selected the galaxies brighter than (the absolute magnitude limit of a galaxy with V=20 in the more distant cluster of the sample, see Paccagnella et al. (2017)).
The spectroscopic redshifts were computed with a semiautomatic method, which involves the automatic cross correlation technique and the emission lines identification, with a very high success rate ( for the whole sample, see Cava et al. 2009 and Moretti et al. 2017). To establish the correction for incompleteness (geometrical and magnitude) in the spectroscopic catalogues, they use the ratio of number of spectra yielding a redshift to the total number of galaxies in the parent photometric catalogue, calculated both as a function of V magnitude and radial projected distance from the brightest cluster galaxy (BCG). All our calculations have been done weighing each galaxy to correct for both incompletenesses.
The final spectroscopic sample includes 14,801 galaxies in the 35 out of 46 OmegaWINGS clusters that have spectroscopic completeness higher than . Galaxy properties (stellar masses and spectral types) have been derived by fitting the fiber spectra with SINOPSIS (SImulatiNg OPtical Spectra wIth Stellar population models), a spectrophotometric model fully described in Fritz et al. (2007, 2014b). Stellar masses are computed using the initial mass function proposed by Salpeter (1955).
The OW galaxies have been classified according to their spectral characteristics in three different types: passive (PAS), emission-line (EML) and post-starburst (PS). Those galaxies classified as PS are likely to have their star formation suddenly truncated at some point during the last . For more details on the spectral classification we refer the reader to Fritz et al. (2014b) and Paccagnella et al. (2017).
2.2 Filaments of galaxies
The goal of this paper is to understand the effects of the filaments upon galaxies by comparing the properties of OW galaxies in the outskirts of clusters taking into account whether they are in filaments, or they are infalling from other directions. Therefore, we select a subsample of OW clusters for which we are able to determine they are nodes of filamentary structures.
Filament identification was performed in an independent sample of groups/clusters (hereafter systems) in the area surveyed by the Six Degree Field Galaxy Survey111http://www-wfau.roe.ac.uk/6dFGS/index.html (6dFRS, Jones et al. 2004) Data Release 3 (DR3, Jones et al. 2009) following the procedure of Martínez et al. (2016)222A paper on this filament sample is currently in preparation (Martínez et al. 2020).:
-
1.
We use as potential nodes of filaments those systems identified by Lim et al. (2017) over the 6dFGRS DR3, that are more massive than . By choosing this low-mass cut-off we are selecting all massive systems while reducing the contamination by spurious systems.
-
2.
We search for all pairs of systems that are separated by less than in redshift space. This is equivalent to in Martínez et al. (2016) with , which was chosen to be similar to the characteristic length of the redshift space two-point correlation function of groups this massive (Zandivarez et al., 2003). These pairs are candidates to be linked by filaments.
-
3.
We compute the projected galaxy overdensity in cuboid-like regions defined in redshift space in the region between the candidate nodes (see Martínez et al. 2016 for details). We consider a pair of candidate nodes to be linked by a filament if the overdensity is , where and are the number of tracer and (normalised) random galaxies in the region, respectively.
To compute galaxy overdensities in the item (iii) above, we use a sample of tracer galaxies that includes all 6dFGRS galaxies brighter than that have redshift quality equal to 3 or 4 (see Jones et al. 2009). This constitutes a reliable sample of galaxies with well established completness criteria. We construct a random catalogue based on these tracer galaxies (100 times denser) following the cloning procedure developed by Cole (2011). For this purpose, we constructed an angular coverage mask using the original targets selected for redshift measurement in 6dFGRS, the tracer sample, and routines from the software HEALPix333http://healpix.sourceforge.net package (Górski et al., 2005).
We adopt this overall approach to identify which OmegaWINGS clusters are nodes of filaments since it has proven useful in studying anisotropic infall around systems (Martínez et al., 2016; Salerno et al., 2019). We are interested in probing the outskirts of clusters and not in the study of filaments at larger scales, or their characteristics such as shape. The sample of systems of Lim et al. (2017) is one of the most complete covering the 6dFGRS, this enhances the chances of identifying filaments that link systems in the survey.
The sample of filaments comprises 808 filaments in the area covered by 6dFGRS, and in the redshift range . It is important to note that the 6dFRS was designed as a redshift survey with the main objective of studying the large-scale structure, and therefore it is ideal to identify the filaments that connect systems of galaxies. The OmegaWINGS survey, on the other hand, allows for a detailed characterisation of the star formation history of galaxies in a statistically complete sample of X-ray luminous clusters. We cross-matched OW clusters with the sample of filament nodes and found that 14 OW clusters are nodes of filaments. These 14 clusters constitute the subsample of OW clusters used in this paper.
| TOTAL | PAS | EML | PS | |||||||||||
|---|---|---|---|---|---|---|---|---|---|---|---|---|---|---|
| Field | 371 | 628 | 60 | 101 | 306 | 520 | 5 | 6 | 0.01† | |||||
| Iso. Infall | 107 | 143 | 41 | 52 | 68 | 84 | 5 | 6 | 0.04† | |||||
| Filaments | 258 | 318 | 174 | 215 | 71 | 86 | 13 | 19 | ||||||
| Clusters | 4604 | 6491 | 2572 | 3620 | 1683 | 2343 | 355 | 533 | ||||||
-
†
Due to the low number of galaxies, the boostrap technique could not be applied.
2.3 Galaxies in the outskirts of clusters
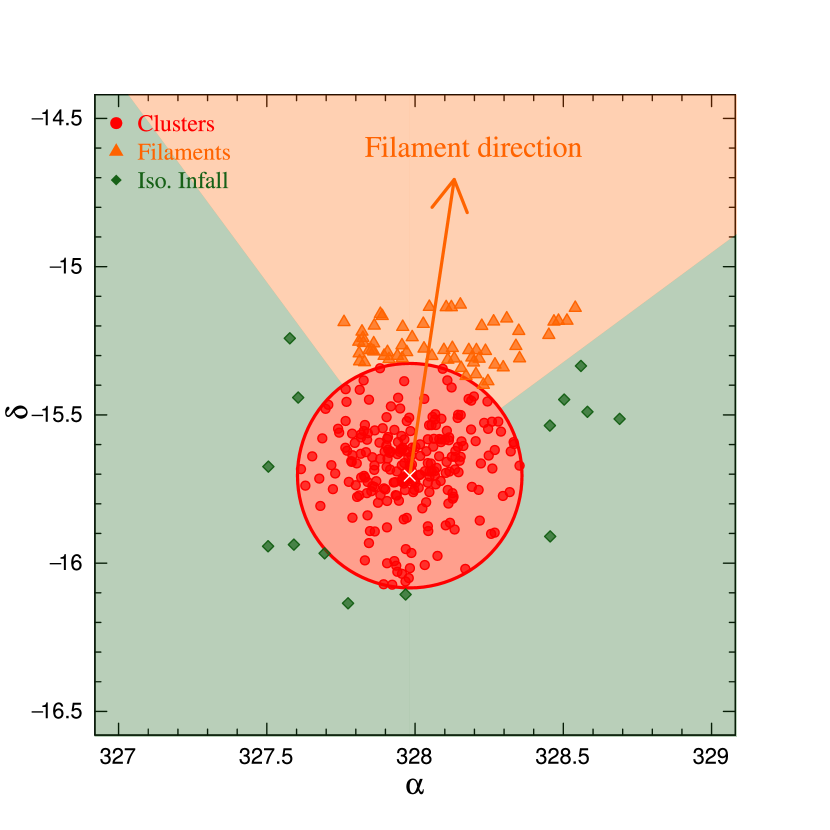
Since the outskirts of clusters are the main objective of this study, the assignment of galaxies to this environment was performed prioritizing completeness at the cost of losing purity (i.e. some contamination by field, and cluster galaxies is expected). Accordingly, we consider as the outskirt regions of clusters the projected volume defined by , and , where is the galaxy’s projected cluster-centric distance, is the projected radius within which the mean overdensity is 200 times the critical density of the universe, and are the line-of-sight velocity of the cluster and the galaxy’s, respectively, and is the radial velocity dispersion. The limit is due to the size of the field of view of the OmegaWINGS survey. Values of , and are taken from Moretti et al. (2017). The general results described in the following sections do not change if galaxies on the outskirts of clusters are selected in the range .
We classify galaxies that meet the criteria of the paragraph above into two categories: i) we consider to be galaxies infalling alonside filaments (hereafter FG) those that are located within from the (projected) direction from the cluster to the other node of the filament (hereafter filament direction), and, ii) isotropically infalling galaxies (hereafter IG) those that lie outside the filament direction. It should be mentioned that some clusters can be nodes of more than one filament. For an angle of and a clustocentric distance of , the projected average width of the filaments is 3 Mpc, which is the value proposed by Martínez et al. (2016) to select the filament’s members. We have tested different angles to select filament galaxies and found that the general results described in the following sections remain unchanged.
Filaments can vary greatly in shape, extension, width, and whether they end up in a system or in a galaxy. Filament properties depend on the method used to identify them, as does the galaxy population that the different methods find inhabiting them (see for instance Rost et al. 2019). Our approach probes filaments that are basically straight in shape, overdense, and have systems as their ending points. The number of filaments connected to a cluster scale with cluster mass (e.g. Codis et al. 2018; Sarron et al. 2019; Gouin et al. 2019), thus it may be the case that, in the outskirts of our clusters, we are missing some filaments because: 1) they are not dense enough to meet our overdensity criterion, 2) they do not have another system at the other end, or, 3) they do not fit in the cuboid-like regions between systems we use to search for overdensities. Therefore, our sample of galaxies in what we call isotropic infall region a:wround our clusters is expected to be contaminated by galaxies that actually reside in filaments. This must be kept in mind for the remaining of the paper, and all differences that we might find between galaxies in filaments and in the isotropic infall region, are to be considered as lower limits. Therefore, actual differences would be even more significant.
For comparison purposes, we also consider a sample of galaxies in clusters consisting in all OW galaxies with projected distance within of the cluster centre and line-of-sight velocity .
We show in Fig. 1 an example one of the OW clusters in our sample, and the corresponding galaxies in the three samples described before.
For a complete comparison, we also construct a sample of field galaxies, which includes all galaxies in the whole field of the OW clusters with . To avoid a bias in the redshift distribution, we apply a Monte Carlo algorithm that randomly selects galaxies with a redshift distribution similar to that of the other three samples of galaxies. The number of galaxies by environment and spectral type are shown in Table 1.
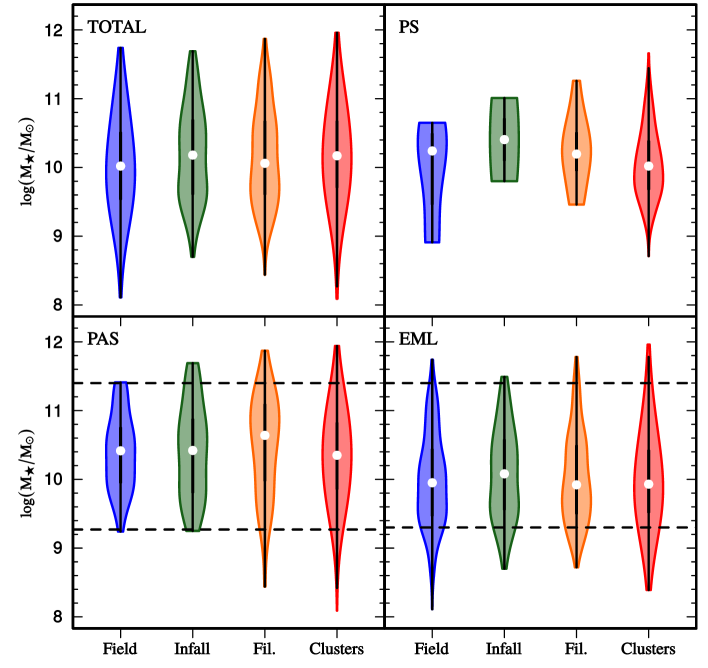
The weighted stellar mass distributions for the total sample and for each spectral type, in the four environments considered, are shown in Fig. 2. Median values of the total sample (inner white dots inside the violin plots) are , , and for the field, isotropic infall, filaments and clusters, respectively. As can be seen the median values of the stellar mass are similar in all environments. Passive galaxies in clusters and filaments have a wider mass range than galaxies in the field and the isotropic infall, however the median values across the environments are similar. The only possible exception are Post-starburst galaxies that show slightly different medians of stellar mass. It should be noted that this is the subsample of spectral types with the least number of galaxies. For a detailed analysis of the mass distributions and the fractions of galaxies as a function of the spectral type and the cluster-centric distance we refer the reader to Paccagnella et al. (2017).
3 RESULTS AND DISCUSSION
3.1 EML and PAS Galaxies
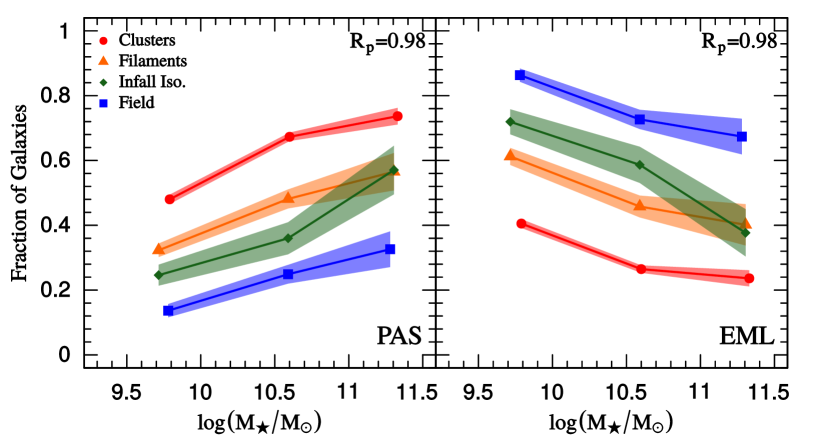
The fraction of EML and PAS galaxies as a function of the stellar mass and environment can be seen in Fig. 3. Error-bars in this figure are computed with the bootstrap resampling technique (the resampling was performed within each environment). We have considered three mass bins: , , . The lower and higher mass limits of the first and third mass bins are shown in the bottom panels of Fig. 2 and delimit the stellar mass completeness. These limits allow a fair comparison across environments. Fig. 3 clearly shows that the environment affects the relative abundance of passive and emission line galaxies. As expected, the fraction of PAS (EML) galaxies increases (decreases) with mass in all environments, however, environment makes a difference. In clusters, the fraction of PAS (EML) galaxies takes the highest (lowest) values, followed in decreasing (increasing) order by FG and IG, and the lowest (highest) fraction is seen in the field. For the lowest mass bin, the fraction of passive galaxies in the field is well under 0.2, an indication of the field environment inefficiency to quench these galaxies. In the high mass bin, all environments have fractions of EML greater than 0.24. The fraction of massive PAS galaxies in clusters is larger than 0.7, suggesting that, in addition to the internal processes, the cluster environment is very efficient in quenching these galaxies.
The two environments we explore in the outskirts of clusters show fractions of PAS and EML with values between those of the field and clusters. The comparison between IG and FG shows that, for the two lowest mass bins, the PAS (EML) fraction is higher (lower) for galaxies that are infalling along filaments than those that are being accreted isotropically. These results are in agreement with the findings of Martínez et al. (2016) and Salerno et al. (2019) on the outskirts of groups of galaxies at low and high redshift, respectively. We use the test proposed by Muriel & Coenda (2014) to evaluate whether the observed differences between the fractions determined for FG and IG are statistically significant. This test computes the bin-to-bin cumulative differences between the two samples along the stellar mass range, and checks whether the resulting quantity is consistent with the null hypothesis of the two samples drawn from the same population. This test was only applied to the comparison between galaxies in the isotropic infall and in filaments, since in the other two environments (field and clusters) the differences in the fractions are much larger than the quoted errors. Results of the test are shown in the upper right part of both panels in Fig. 3, in terms of the rejection probability of null hypothesis (). In both cases, the null hypothesis is overruled. i.e., galaxies infalling in the filament direction are statistically more quenched that those infalling isotropically. If the above analysis is repeated using a mass limited sample (, Vulcani et al. 2011) the results do not change, although they become noisier. Since our sample of galaxies in the outskirts of clusters was selected prioritizing completeness over purity, the reported differences between galaxies in the direction of filaments and in the isotropic infall, should be taken as a lower limit.
Our results indicate that the outskirts of clusters can pre-process galaxies, contributing significantly to the suppression of their star formation, and also that filaments are more effective in doing so than the isotropic infall region. Fig. 3 can provide a raw estimation of how effective to quench galaxies these two environments are. Let us consider the abundance of PAS galaxies as a function of the stellar mass (left panel of Fig. 3). Furthermore, let us also assume the field is inefficient to environmentally quench galaxies. Thus, mass quenching is the only responsible of the existence of PAS galaxies in the field, which means that up to a fraction and of the galaxies in the field (blue squares in the left panel of Fig. 3) have been mass quenched in our three mass bins (), respectively. This is a strong assumption since our field sample may include small groups of galaxies which, in turn, would introduce an environmental quenching factor that, however small, we can not quantify. Therefore these fractions should be better considered as upper limits to the mass quenching efficiency. These numbers reflect the mass quenching efficiency to the present time. The ‘reservoir’ of galaxies that have not been quenched by mass so far, and are therefore available to be quenched by the environment is measured by the fraction of EML galaxies in the field: and , respectively. Let us consider now an environment , which is denser than a reference environment. In our case we take the field as reference environment due to its inefficiency to environmentally quench galaxies. For galaxies of mass , the quenching efficiency of the environment , relative to the field, is measured as (Peng et al., 2010):
| (1) |
This ratio is the fraction of galaxies of mass that have been quenched in the environment , but would be star forming if they were inhabiting the field instead. The fraction of PAS galaxies in the isotropic infall region (filaments) is , and ( and ), and represent the fraction of galaxies in the mass bins that, at the present time, are quenched prior to their eventual entrance to the clusters. These numbers yield relative quenching efficiency for the isotropic infall region is , and . Likewise, the filaments have a relative quenching efficiency of and . Note that PS have not been taken into account in the computation of these fractions. Since they are already turning passive, they could have been considered as such. They are negligible in the field sample, and account only for 0.04, and 0.06, of the samples of isotropic infall and filament galaxies respectively, over the whole mass range. Their inclusion as passive galaxies would not change our rough numbers in a significant way.
These results suggest that high mass galaxies in the outskirts of clusters are more likely to be affected by both, mass and environmental quenching, than low mass galaxies. It is also interesting to note that, for the three mass bins, the fraction of galaxies affected by environmental quenching in the infall region is similar to the mass quenching, while it is higher in filaments (at least for the first two bins).
3.2 Post-starburst galaxies
A powerful way to study the influence of the environment on the evolution of galaxies is to study the presence of galaxies that are in transition from star-forming to quiescent. From the point of view of the spectroscopy, this can be done by studying the presence of E + A galaxies (Dressler & Gunn 1983) that are known as post-starburst galaxies (PS). Fritz et al. (2014b) use the spectral types k+a and a+k to classify PS galaxies. These are galaxies that are supposed to have stopped the star formation some years ago. Among the cluster members, Paccagnella et al. (2017) find that PSs in OmegaWINGS are a combination of galaxies with a mix of times since infall, including both, backsplash and virialized galaxies. They also find that the frequency of PS galaxies in clusters is much higher than in the field. Similar results are found by Paccagnella et al. (2019) who report a frequency of PS galaxies growing from isolated galaxies, to binary systems, groups and clusters, with a progressive increase in their fraction with the halo mass.
As can be seen in Table 1, the fraction of PS galaxies increases as we move from the field to denser environments. The percentage of PS in the isotropic infall is slightly smaller than in the filament region. However, the small number of PS galaxies in our samples of field and isotropic infall region prevent us from having a reliable estimation of the uncertainty involved, which does not allow us to assess the significance of the result. Our data indicate that the fraction of PS in filaments is smaller than in clusters.
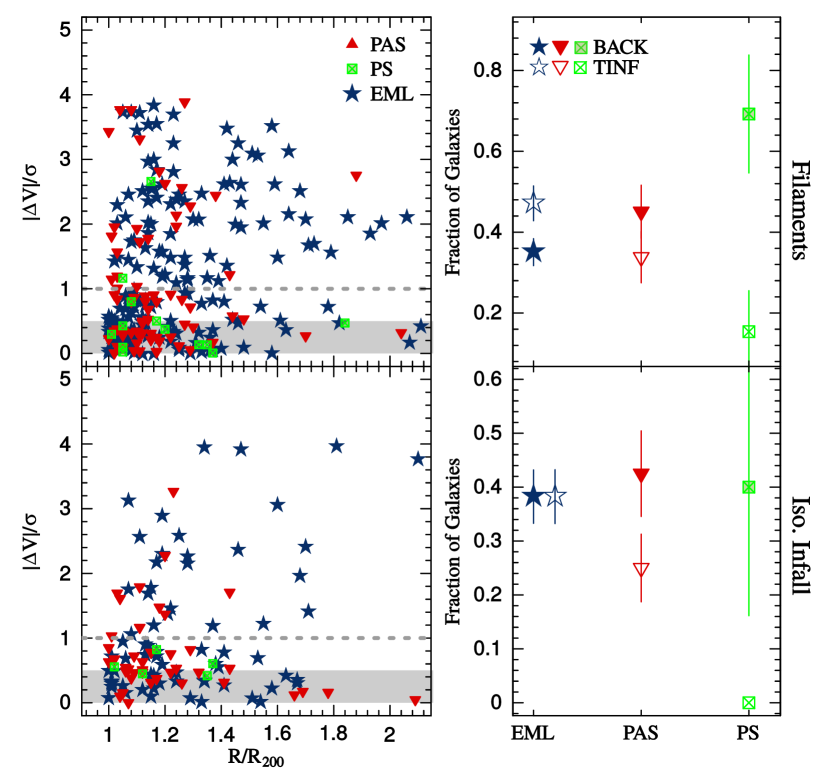
Several authors have suggested that the ram-pressure stripping is the most effective mechanism to create PS galaxies in clusters (Dressler & Gunn 1983; Couch & Sharples 1987; Dressler & Gunn 1992; Poggianti et al. 1999; Balogh et al. 2000; Tran et al. 2003; Tran et al. 2004; Tran et al. 2007; Poggianti et al. 2009; Fritz et al. 2014a; Paccagnella et al. 2017; Paccagnella et al. 2019). The star formation that was previously triggered during the infall into the cluster, is then abruptly extincted when the galaxy enters the innermost regions of the cluster. If this were the case, PS galaxies that are located on the outskirts of clusters should have previously orbited close to the cluster centre, becoming what are known as backsplash galaxies. This hypothesis may be valid if some galaxies can cross the cluster and go back to the outskirts in a time lesser than or equal to the duration of the PS stage (1-1.5 Gyrs). Martínez et al. (2020) use numerical simulations to analyse the galaxy orbits in clusters. The authors find that, on average, backsplash galaxies take 1.6 Gyrs since crossing the cluster’s virial radius on their way in until they cross it again on their way out. These results suggest that almost half of the galaxies that have been transformed into PS during the infall and have subsequently left the cluster as backsplash galaxies, would still show characteristics of PS galaxies. In order to test the hypothesis that some of the PS galaxies in outskirts of clusters are backsplash, we apply the criterion proposed by Muriel & Coenda (2014) to select both, backsplash and infaller galaxies. For these authors, galaxies in the outskirts of clusters () with have a high probability of being backsplash (hereafter BACK). On the contrary, galaxies in the outskirts with are considered as true infalling galaxies (hereafter TINF). Note that according to our selection in velocity, not all the galaxies in the outskirts are classified as BACK or TINF. The left panel of Fig. 4 shows the phase-space diagram for the galaxies in our samples. In Table 2 and in the right panel of Fig. 4 we present the fraction of BACK and TINF galaxies as a function of the spectral classification and environment in the outskirts of clusters. As can be seen in Table 2, the majority (69%) of PS galaxies in the filament region are BACK. Only 15% of the PS galaxies are TINF. For the same environment, 35% of the EML galaxies are BACK while 47% are TINF. PAS galaxies show intermediate behaviour, with 45% of BACK and 33% TINF. These numbers suggest that an important fraction of the PS galaxies in the filament region in the outskirts of clusters were previously at smaller clustocentric distances. In their raid through the cluster, galaxies could have been quenched by ram pressure stripping or any of the processes described in section 1. In the isotropic infall region the results show a similar tendency, however, the low number of PS galaxies in this region makes it very difficult to get conclusive results.
If most of the PS galaxies in the filament region are actually BACK, they are more likely to have been quenched in the clusters, regardless of their original infall direction. This could suggest that the filament region (and probably also the infall region) has been inefficient to produce a rapid quenching to star forming galaxies during the last Gyr. Therefore, many of the passive galaxies that we observe falling to clusters, may have been quenched by mechanisms that act over longer time scales, or these galaxies were quenched a long time before. Quenching in filaments as early as has been reported by Salerno et al. (2019). They present evidence that a significant fraction of the galaxies in filaments have already been pre-processed by that redshift.
| PAS | EML | PS | ||
|---|---|---|---|---|
| Filaments | BACK | |||
| TINF | ||||
| Iso. Infall | BACK | |||
| TINF |
4 Summary
In this work we study the effects of environment on galaxy quenching at using data from WINGS and OmegaWINGS cluster surveys. We focus our study in the outskirts of galaxy clusters, i.e. projected distances , and distinguish between two regions according to the clustocentric direction: filaments and the isotropic infall.
Firstly, we search for filamentary structures linking galaxy groups/clusters identified by Lim et al. (2017) over the 6dFGRS DR3 (Jones et al., 2009). We follow Martínez et al. (2016) in the filament identification process. We then cross-match groups/clusters that are nodes of filaments, with OW clusters. This matching results in 14 OW clusters that are linked to other groups/clusters by filaments.
We study the fraction of passive and emission-line galaxies in four different environments: clusters, filaments, the isotropic infall region of clusters and the field. We find a fraction of passive galaxies in the outskirts of clusters intermediate between that of the clusters and the field’s. Furthermore, we find evidence of a more effective quenching in the direction of the filaments. These results are in agreement with an scenario in which pre-processing of galaxies prior to their entrance to clusters is more effective in filaments (Martínez et al., 2016; Salerno et al., 2019).
We also analyse the abundance of post-starburst galaxies in the outskirts of clusters. Since post-starburst galaxies are believed to be the result of strong ram-pressure stripping in galaxies, and this effect is strongest in the innermost regions of clusters, we use the phase-space position of galaxies in the outskirts of clusters to focus our analysis in two sets of galaxies: backsplash and true infallers. This classification allows us to pick up galaxies that are likely to have passed by the inner regions of clusters and compare them with galaxies that are likely to never have been within one virial radii of the cluster centre. We find that up to of post-starburst galaxies in the direction of filaments are likely to be backsplash, this number drops to in the isotropic infall region.
The low fraction of galaxies in filaments that have been recently quenched (post starburst galaxies) and are falling into clusters for the first time, support the scenario in which an important fraction of filament galaxies have been quenched long time ago.
Acknowledgements
This paper has been partially supported with grants from Consejo Nacional de Investigaciones Científicas y Técnicas (PIP 11220130100365CO) Argentina, and Secretaría de Ciencia y Tecnología, Universidad Nacional de Córdoba, Argentina.
References
- Abadi et al. (1999) Abadi M. G., Moore B., Bower R. G., 1999, MNRAS, 308, 947
- Aguerri & Sánchez-Janssen (2010) Aguerri J. A. L., Sánchez-Janssen R., 2010, A&A, 521, A28
- Alpaslan et al. (2016) Alpaslan M., et al., 2016, MNRAS, 457, 2287
- Bahé et al. (2013) Bahé Y. M., McCarthy I. G., Balogh M. L., Font A. S., 2013, MNRAS, 430, 3017
- Balogh et al. (2000) Balogh M. L., Navarro J. F., Morris S. L., 2000, ApJ, 540, 113
- Bamford et al. (2009) Bamford S. P., et al., 2009, MNRAS, 393, 1324
- Bekki (2009) Bekki K., 2009, MNRAS, 399, 2221
- Bianconi et al. (2018) Bianconi M., Smith G. P., Haines C. P., McGee S. L., Finoguenov A., Egami E., 2018, MNRAS, 473, L79
- Blanton & Moustakas (2009) Blanton M. R., Moustakas J., 2009, ARA&A, 47, 159
- Blanton et al. (2005) Blanton M. R., Eisenstein D., Hogg D. W., Schlegel D. J., Brinkmann J., 2005, ApJ, 629, 143
- Bower et al. (2012) Bower R. G., Benson A. J., Crain R. A., 2012, MNRAS, 422, 2816
- Braglia et al. (2009) Braglia F. G., Pierini D., Biviano A., Böhringer H., 2009, A&A, 500, 947
- Cava et al. (2009) Cava A., et al., 2009, A&A, 495, 707
- Chen et al. (2017) Chen Y.-C., et al., 2017, MNRAS, 466, 1880
- Cimatti et al. (2013) Cimatti A., et al., 2013, ApJL, 779, L13
- Codis et al. (2018) Codis S., Pogosyan D., Pichon C., 2018, MNRAS, 479, 973
- Coenda et al. (2018) Coenda V., Martínez H. J., Muriel H., 2018, MNRAS, 473, 5617
- Coenda et al. (2019) Coenda V., Mast D., Martínez H. J., Muriel H., Merchán M. E., 2019, A&A, 621, A98
- Colberg et al. (1999) Colberg J. M., White S. D. M., Jenkins A., Pearce F. R., 1999, MNRAS, 308, 593
- Cole (2011) Cole S., 2011, MNRAS, 416, 739
- Cooper et al. (2010a) Cooper M. C., Gallazzi A., Newman J. A., Yan R., 2010a, MNRAS, 402, 1942
- Cooper et al. (2010b) Cooper M. C., et al., 2010b, MNRAS, 409, 337
- Couch & Sharples (1987) Couch W. J., Sharples R. M., 1987, MNRAS, 229, 423
- Couch et al. (1998) Couch W. J., Barger A. J., Smail I., Ellis R. S., Sharples R. M., 1998, ApJ, 497, 188
- Cowie & Songaila (1977) Cowie L. L., Songaila A., 1977, Nature, 266, 501
- Darvish et al. (2014) Darvish B., Sobral D., Mobasher B., Scoville N. Z., Best P., Sales L. V., Smail I., 2014, ApJ, 796, 51
- De Lucia et al. (2012) De Lucia G., Weinmann S., Poggianti B. M., Aragón-Salamanca A., Zaritsky D., 2012, MNRAS, 423, 1277
- Domínguez et al. (2001) Domínguez M., Muriel H., Lambas D. G., 2001, AJ, 121, 1266
- Dressler (1980) Dressler A., 1980, ApJ, 236, 351
- Dressler & Gunn (1983) Dressler A., Gunn J. E., 1983, ApJ, 270, 7
- Dressler & Gunn (1992) Dressler A., Gunn J. E., 1992, ApJS, 78, 1
- Dressler et al. (1999) Dressler A., Smail I., Poggianti B. M., Butcher H., Couch W. J., Ellis R. S., Oemler Augustus J., 1999, ApJS, 122, 51
- Driver et al. (2009) Driver S. P., et al., 2009, Astronomy and Geophysics, 50, 5.12
- Ebeling et al. (1996) Ebeling H., Voges W., Bohringer H., Edge A. C., Huchra J. P., Briel U. G., 1996, MNRAS, 283, 1103
- Ebeling et al. (2004) Ebeling H., Barrett E., Donovan D., 2004, ApJL, 609, L49
- Einasto et al. (2018) Einasto M., et al., 2018, A&A, 610, A82
- Fasano et al. (2006) Fasano G., et al., 2006, A&A, 445, 805
- Fritz et al. (2007) Fritz J., et al., 2007, A&A, 470, 137
- Fritz et al. (2014a) Fritz A., et al., 2014a, A&A, 563, A92
- Fritz et al. (2014b) Fritz J., et al., 2014b, A&A, 566, A32
- Fujita (2004) Fujita Y., 2004, PASJ, 56, 29
- Gill et al. (2005) Gill S. P. D., Knebe A., Gibson B. K., 2005, MNRAS, 356, 1327
- Gnedin (2003a) Gnedin O. Y., 2003a, ApJ, 582, 141
- Gnedin (2003b) Gnedin O. Y., 2003b, ApJ, 589, 752
- Gómez et al. (2003) Gómez P. L., et al., 2003, ApJ, 584, 210
- Górski et al. (2005) Górski K. M., Hivon E., Banday A. J., Wand elt B. D., Hansen F. K., Reinecke M., Bartelmann M., 2005, ApJ, 622, 759
- Gouin et al. (2019) Gouin C., Aghanim N., Bonjean V., Douspis M., 2019, arXiv e-prints, p. arXiv:1912.00655
- Gullieuszik et al. (2015) Gullieuszik M., et al., 2015, A&A, 581, A41
- Gunn & Gott (1972) Gunn J. E., Gott J. R. I., 1972, ApJ, 176, 1
- Guzzo et al. (2014) Guzzo L., et al., 2014, A&A, 566, A108
- Haines et al. (2015) Haines C. P., et al., 2015, ApJ, 806, 101
- Hansen et al. (2009) Hansen S. M., Sheldon E. S., Wechsler R. H., Koester B. P., 2009, ApJ, 699, 1333
- Hashimoto et al. (1998) Hashimoto Y., Oemler Augustus J., Lin H., Tucker D. L., 1998, ApJ, 499, 589
- Hasinger (2008) Hasinger G., 2008, A&A, 490, 905
- Hou et al. (2014) Hou A., Parker L. C., Harris W. E., 2014, MNRAS, 442, 406
- Jones et al. (2004) Jones D. H., et al., 2004, MNRAS, 355, 747
- Jones et al. (2009) Jones D. H., et al., 2009, MNRAS, 399, 683
- Just et al. (2015) Just D. W., et al., 2015, preprint, (arXiv:1506.02051)
- Kraljic et al. (2018) Kraljic K., et al., 2018, MNRAS, 474, 547
- Laigle et al. (2018) Laigle C., et al., 2018, MNRAS, 474, 5437
- Larson et al. (1980) Larson R. B., Tinsley B. M., Caldwell C. N., 1980, ApJ, 237, 692
- Lewis et al. (2002) Lewis I., et al., 2002, MNRAS, 334, 673
- Lim et al. (2017) Lim S. H., Mo H. J., Lu Y., Wang H., Yang X., 2017, MNRAS, 470, 2982
- Mahajan et al. (2011) Mahajan S., Mamon G. A., Raychaudhury S., 2011, MNRAS, 416, 2882
- Malavasi et al. (2017) Malavasi N., et al., 2017, MNRAS, 465, 3817
- Mamon et al. (2004) Mamon G. A., Sanchis T., Salvador-Solé E., Solanes J. M., 2004, A&A, 414, 445
- Marasco et al. (2012) Marasco A., Fraternali F., Binney J. J., 2012, MNRAS, 419, 1107
- Martínez & Muriel (2006) Martínez H. J., Muriel H., 2006, MNRAS, 370, 1003
- Martínez et al. (2008) Martínez H. J., Coenda V., Muriel H., 2008, MNRAS, 391, 585
- Martínez et al. (2010) Martínez H. J., Coenda V., Muriel H., 2010, MNRAS, 403, 748
- Martínez et al. (2016) Martínez H. J., Muriel H., Coenda V., 2016, MNRAS, 455, 127
- Martínez et al. (2020) Martínez H. J., de los Ríos M., Coenda V., Muriel H., Ruíz A. N., Vega C., Cora S., 2020, MNRAS, in preparation
- Masters et al. (2010) Masters K. L., et al., 2010, MNRAS, 405, 783
- Mateus & Sodré (2004) Mateus A., Sodré L., 2004, MNRAS, 349, 1251
- McCarthy et al. (2008) McCarthy I. G., Frenk C. S., Font A. S., Lacey C. G., Bower R. G., Mitchell N. L., Balogh M. L., Theuns T., 2008, MNRAS, 383, 593
- McGee et al. (2009) McGee S. L., Balogh M. L., Bower R. G., Font A. S., McCarthy I. G., 2009, MNRAS, 400, 937
- Mihos (2004) Mihos J. C., 2004, Cambridge: Cambridge Univ. Press, ed. J. S. Mulchaey, A. Dressler, & A. Oemler, p. 277
- Moore et al. (1996) Moore B., Katz N., Lake G., Dressler A., Oemler A., 1996, Nature, 379, 613
- Moore et al. (1999) Moore B., Lake G., Quinn T., Stadel J., 1999, MNRAS, 304, 465
- Moretti et al. (2014) Moretti A., et al., 2014, A&A, 564, A138
- Moretti et al. (2017) Moretti A., et al., 2017, A&A, 599, A81
- Muriel & Coenda (2014) Muriel H., Coenda V., 2014, A&A, 564, A85
- Nandra et al. (2007) Nandra K., et al., 2007, ApJL, 660, L11
- Paccagnella et al. (2017) Paccagnella A., et al., 2017, ApJ, 838, 148
- Paccagnella et al. (2019) Paccagnella A., Vulcani B., Poggianti B. M., Moretti A., Fritz J., Gullieuszik M., Fasano G., 2019, MNRAS, 482, 881
- Park & Hwang (2009) Park C., Hwang H. S., 2009, ApJ, 699, 1595
- Paulino-Afonso et al. (2019) Paulino-Afonso A., et al., 2019, A&A, 630, A57
- Peng et al. (2010) Peng Y.-j., et al., 2010, ApJ, 721, 193
- Pimbblet et al. (2006) Pimbblet K. A., Smail I., Edge A. C., O’Hely E., Couch W. J., Zabludoff A. I., 2006, MNRAS, 366, 645
- Poggianti et al. (1999) Poggianti B. M., Smail I., Dressler A., Couch W. J., Barger A. J., Butcher H., Ellis R. S., Oemler Augustus J., 1999, ApJ, 518, 576
- Poggianti et al. (2009) Poggianti B. M., et al., 2009, ApJ, 693, 112
- Rhee et al. (2017) Rhee J., Smith R., Choi H., Yi S. K., Jaffé Y., Candlish G., Sánchez-Jánssen R., 2017, ApJ, 843, 128
- Rines & Diaferio (2005) Rines K., Diaferio A., 2005, in American Astronomical Society Meeting Abstracts. p. 101.03
- Rost et al. (2019) Rost A., Stasyszyn F., Pereyra L., Martínez H. J., 2019, MNRAS submitted, p. arXiv:1911.08545
- Salerno et al. (2019) Salerno J. M., Martínez H. J., Muriel H., 2019, MNRAS, 484, 2
- Salpeter (1955) Salpeter E. E., 1955, ApJ, 121, 161
- Sarron et al. (2019) Sarron F., Adami C., Durret F., Laigle C., 2019, A&A, 632, A49
- Schaefer et al. (2017) Schaefer A. L., et al., 2017, MNRAS, 464, 121
- Schawinski et al. (2007) Schawinski K., et al., 2007, ApJS, 173, 512
- Schawinski et al. (2009) Schawinski K., et al., 2009, MNRAS, 396, 818
- Silverman et al. (2008) Silverman J. D., et al., 2008, ApJ, 675, 1025
- Solanes et al. (2002) Solanes J. M., Sanchis T., Salvador-Solé E., Giovanelli R., Haynes M. P., 2002, AJ, 124, 2440
- Stringer et al. (2012) Stringer M. J., Bower R. G., Cole S., Frenk C. S., Theuns T., 2012, MNRAS, 423, 1596
- Takamiya et al. (1995) Takamiya M., Kron R. G., Kron G. E., 1995, AJ, 110, 1083
- Thomas et al. (2005) Thomas D., Maraston C., Bender R., Mendes de Oliveira C., 2005, ApJ, 621, 673
- Tran et al. (2003) Tran K.-V. H., Franx M., Illingworth G., Kelson D. D., van Dokkum P., 2003, ApJ, 599, 865
- Tran et al. (2004) Tran K.-V. H., Franx M., Illingworth G. D., van Dokkum P., Kelson D. D., Magee D., 2004, ApJ, 609, 683
- Tran et al. (2007) Tran K.-V. H., Franx M., Illingworth G. D., van Dokkum P., Kelson D. D., Blakeslee J. P., Postman M., 2007, ApJ, 661, 750
- Vijayaraghavan & Ricker (2015) Vijayaraghavan R., Ricker P. M., 2015, MNRAS, 449, 2312
- Villalobos et al. (2014) Villalobos Á., De Lucia G., Murante G., 2014, MNRAS, 444, 313
- Vulcani et al. (2011) Vulcani B., et al., 2011, MNRAS, 412, 246
- Vulcani et al. (2019) Vulcani B., et al., 2019, MNRAS, 487, 2278
- Welikala et al. (2008) Welikala N., Connolly A. J., Hopkins A. M., Scranton R., Conti A., 2008, ApJ, 677, 970
- Wetzel et al. (2013) Wetzel A. R., Tinker J. L., Conroy C., van den Bosch F. C., 2013, MNRAS, 432, 336
- White et al. (2005) White S. D. M., et al., 2005, VizieR Online Data Catalog, pp J/A+A/444/365
- Whitmore et al. (1993) Whitmore B. C., Gilmore D. M., Jones C., 1993, ApJ, 407, 489
- York et al. (2000) York D. G., et al., 2000, AJ, 120, 1579
- Zandivarez et al. (2003) Zandivarez A., Merchán M. E., Padilla N. D., 2003, MNRAS, 344, 247
- Zhang et al. (2013) Zhang Y., Dietrich J. P., McKay T. A., Sheldon E. S., Nguyen A. T. Q., 2013, ApJ, 773, 115
- Zheng et al. (2017) Zheng Z., et al., 2017, MNRAS, 465, 4572
- Zinger et al. (2018) Zinger E., Dekel A., Kravtsov A. V., Nagai D., 2018, MNRAS, 475, 3654
- Zwicky (1951) Zwicky F., 1951, PASP, 63, 17
- von der Linden et al. (2010) von der Linden A., Wild V., Kauffmann G., White S. D. M., Weinmann S., 2010, MNRAS, 404, 1231