Profile-Guided, Multi-Version Binary Rewriting
Abstract.
The static instrumentation of machine code, also known as binary rewriting, is a power technique, but suffers from high runtime overhead compared to compiler-level instrumentation. Recent research has shown that tools can achieve near-to-zero overhead when rewriting binaries (excluding the overhead from the application specific instrumentation). However, the users of binary rewriting tools often have difficulties in understanding why their instrumentation is slow and how to optimize their instrumentation.
We are inspired by a traditional program optimization workflow, where one can profile the program execution to identify performance hot spots, modify the source code or apply suitable compiler optimizations, and even apply profile-guided optimization. We present profile-guided, Multi-Version Binary Rewriting to enable this optimization workflow for static binary instrumentation. Our new techniques include three components. First, we augment existing binary rewriting to support call path profiling; one can interactively view instrumentation costs and understand the calling contexts where the costs incur. Second, we present Versioned Structure Binary Editing, which is a general binary transformation technique. Third, we use call path profiles to guide the application of binary transformation.
We apply our new techniques to shadow stack and basic block code coverage. Our instrumentation optimization workflow helps us identify several opportunities with regard to code transformation and instrumentation data layout. Our evaluation on SPEC CPU 2017 shows that the geometric overhead of shadow stack and block coverage is reduced from 7.6% and 161.3% to 1.4% and 4.0%, respectively. We also achieve promising results on Apache HTTP Server, where the shadow stack overhead is reduced from about 20% to 3.5%.
1. Introduction
Binary rewriting is a powerful technique that statically instruments the machine code of an application to monitor and collect data from its execution. It can be used to add security checks (Dang et al., 2015; Zhang and Sekar, 2013; v. d. Veen et al., 2016; van der Veen et al., 2015), insert performance measurements code to analyze performance (Williams-King and Yang, 2019; Welton and Miller, 2019, 2020), and assess software correctness (Gu and Mellor-Crummey, 2018; Ben Khadra et al., 2020).
While powerful, binary rewriting suffers from high runtime overhead compared to compiler-level instrumentation. We classify the runtime overhead incurred by binary rewriting into two types: tool overhead, which refers to overhead incurred by binary rewriting tools to support instrumentation, and application overhead, which refers to the overhead incurred by application specific instrumentation. Recent research on binary rewriting focuses on reducing tool overhead and has achieved near-to-zero tool overhead in many cases (Dinesh et al., 2020; Williams-King et al., 2020; Meng and Liu, 2021).
On the other hand, application overhead is optimized by binary rewriting application researchers, who design drastically different optimization strategies tailored to their own applications (Gu and Mellor-Crummey, 2018; Ben Khadra et al., 2020). These optimization strategies are often the results of numerous, trial-and-error attempts. We believe it is valuable to have a systematic approach for optimizing binary rewriting applications.
A traditional optimization approach for software programs is to profile the program to identify performance hot spots and transform the hot spots either through manual source code modification or tailored compiler optimizations. In addition, profile-guided optimizations have been shown to be effective for general program optimization (Panchenko et al., 2019) and even for compiler-level instrumentation (Duta et al., 2021).
Unfortunately, users of binary rewriting tools do not have aforementioned powerful weapons at their disposal. First, rewritten binaries generated by existing binary rewriting tools are not suitable for call path profiling (Hall, 1992). Profiling tools such as HPCToolkit (Adhianto et al., 2010) use call path profiling to attribute performance metrics, including running time, cache misses, and page faults, to program calling contexts. Users can know the specific functions, loops or statements that incur the most costs. Without call path profiling, users may know the overall inefficiency in their instrumentation, but cannot pinpoint the specific program contexts to design optimization strategies.
Second, existing binary rewriting tools are unable to perform necessary binary transformation to support instrumentation optimization. Compilers can drastically change program structures to perform a variety of optimizations, including function inlining and loop unrolling. While we should not expect a binary rewriting tool to have the strength of a compiler with regard to program transformations, we believe there is a middle ground where useful optimizations can be achieved at the binary level.
In this paper, we present multi-version binary rewriting (MVBR) to fill this void. The basic idea of MVBR is to create multiple copies of a piece of code and support arbitrary control flow redirection among copied code, original code, and instrumentation. We can instrument these different copies in different ways (including not instrumenting some copies). “a piece of code” can refer to any programming language code constructs available at the binary level, including functions, loops, and basic blocks. This capability enables us to drastically transform the binary and customize instrumentation according to its invoking contexts.
We design Versioned Structure Binary Editing (VSBE) to support the binary transformations used by MVBR. VSBE provides a set of primitive binary transformation operations, including cloning a basic block, redirecting a control flow edge, and splitting a basic block. The composition of these operations can lead to power binary transformation.
MVBR also generates rewritten binaries that are suitable for call path profiling. Application researchers can interactively view performance metrics attributed to source code, investigate the conditions where the instrumentation incurs high overhead, and design new instrumentation strategies accordingly. In addition, we leverage profiles to guide where to apply MVBR, as making copies of code blindly will cause negative effects on the instruction cache. Profiled-guided MVBR makes it possible to perform familiar, powerful optimizations, such as function inlining, at the binary level. For profiled-guided MVBR, we directly use performance metrics collected at the binary level, so debug information or symbol tables is not needed.
To demonstrate the effectiveness of our new techniques, we apply MVBR to two typical binary rewriting applications and show how instrumentation profiling can reveal optimization opportunities and how profile-guided MVBR can materialize these opportunities.
The first one is shadow stack (Dang et al., 2015), which is a software security policy to mitigate return based attacks. It works by creating a thread-local shadow stack and inserting instrumentation that saves return addresses to the shadow stack at a function entry, and validating the actual return address on the original stack with the one from the shadow stack before function exits. The second one is basic block code coverage, which is a building block for software correctness assessment and fuzzing. The instrumentation allocates a new region of memory, where each byte of the memory represents whether an instrumented block has been executed or not, and inserts code that instrumented blocks to write the execution information. We choose these two applications because (1) they instrument at different code granularity (function vs basic block), and (2) they are from different application domains.
For both applications, we take the same optimization workflow: (1) implement a baseline instrumentation, (2) profile it to observe its performance characteristics and identify optimization opportunities, and (3) use profile-guided MVBR to realize the optimizations.
For shadow stack, among several optimizations, we highlight binary function inlining. An inlined callee does not need instrumentation as there is no return address any more. The original callee remains instrumented as we do not necessarily want to inline all calls to function. Existing work on function inlining (Scheifler, 1977; Chang and Hwu, 1989; Ayers et al., 1997; Arnold et al., 2000) focuses on when to inline a function and operates at the compiler level. We will present a new algorithm based on VSBE to inline functions at the binary level, which has to address several additional challenging regarding stack pointer adjustment and tail calls.
For block coverage, we identify performance issues caused by false sharing when running with multiple threads, hot instrumentation inside loops, and instrumentation data allocation that causes inefficient data cache utilization. We design a new instrumentation instruction sequence, profile-guided loop transformation, and profile-guided instrumentation data allocation to address these problems.
We evaluate our work using SPEC CPU 2017. For shadow stack, our optimizations reduced the maximal overhead from 31.0% to 10.0% and the (geometric) mean overhead from 7.6% to 1.4%. For block coverage, our optimizations reduced the overhead from over 100% to 12.1% maximal and 4.0% mean overhead. We also our optimizations to two real world software, including Apache HTTP Server, where the shadow stack overhead is reduced from over 20% to about 3%.
In summary, this work makes the following contributions:
-
•
Multi-Version Binary Rewriting, a new binary-rewriting instrumentation technique that supports customizing instrumentation by transforming binaries,
-
•
Versioned Structure Binary Editing, a new binary transformation technique as the foundation of multi-version binary rewriting,
-
•
support for call path profiling in rewritten binaries, which enables interactive instrumentation performance analysis and profile-guided multi-version binary rewriting,
-
•
instrumentation profiling analysis and new optimizations to improve shadow stack and basic block code coverage.
2. Related Work
We put our work in context by surveying related work of binary rewriting tools, profile-guided optimizations, and application specific research that uses binary rewriting.
2.1. Binary Rewriting Tools
Binary rewriting tools support inserting arbitrary code at arbitrary locations in the original binary. There are two main approaches to achieve this goal.
The first approach is code patching, which patches original code with trampolines (typically branch instructions) to redirect control flow from original code to a new area of code where instrumentation is inserted. Tools using this approach include Dyninst (Bernat and Miller, 2011; Bernat et al., 2011; Meng and Liu, 2021) and E9Patch (Duck et al., 2020).
E9Patch (Duck et al., 2020) uses instruction patching, which modifies individual instrumented instructions to branch to the new area of code. The new area of code contains only the instrumentation, the modified instruction, and a branch back to the original code. Instruction patching does not require any binary analysis and thus enjoys high generality. However, it incurs high tool overhead as the control flow may frequently bounce between original and instrumented code.
Incremental CFG Patching (Meng and Liu, 2021), implemented as an extension to the mainstream Dyninst, significantly reduces tool overhead by relocating all instrumented functions to the new area of code, modifying direct control flow to stay in relocated code area, and opportunistically modifying indirect control flow including jump tables and function pointers. Incremental CFG patching can achieve near-to-zero tool overhead and provides a failure mode analysis when the underlying binary analysis failed.
The second approach is IR lowering, which first lifts the binary to a low-level IR and then re-generate the rewritten binary. Tools in this category lift binaries to either tool specific IR (Williams-King et al., 2020; Hawkins et al., 2017) or the assembly language (Wang et al., 2017; Flores-Montoya and Schulte, 2020; Dinesh et al., 2020). Recent IR lowering tools enjoy near-to-zero tool overhead. However, this approach relies on complete binary analysis to be able to fully lift a binary. Tools either rely on runtime relocation entries (Williams-King et al., 2020; Dinesh et al., 2020) or binary analysis heuristics without clear failure mode analysis (Hawkins et al., 2017; Flores-Montoya and Schulte, 2020).
We observe that neither approaches can leverage optimization passes implemented in modern compilers. Such optimization passes in compilers typically work at a higher-level IR (such as LLVM IR). Our work is orthogonal to the research of binary rewriting tools.
2.2. Profile-Guided Optimization
Profile-Guided Optimization (PGO) has been successful in improving program performance (Cohn et al., 1998; Ottoni and Maher, 2017; Chen et al., 2016; Chen et al., 2013). Representative PGO tools include Facebook BOLT (Panchenko et al., 2019, 2021) and Google Propeller (Google, 2021).
Our work leverages profiles to optimize instrumentation and differs from existing PGO research on the following two aspects. First, we work fully at the binary level, requiring no recompilation or relinking. While BOLT also performs optimization at binary level, BOLT requires link-time relocations to be present in the binary. Users of BOLT often have to recompile the program with flag -Wl,-q to instruct the linker to retain link time relocation entries. Google Propeller also requires recompilation to perform PGO.
Second, existing PGO focuses on improving code and data layout to improve instruction and data cache efficiency. In contrast, our work uses profiles to guide binary transformation to elide instrumentation. In other words, our work uses PGO to improve instrumentation policies, while existing PGO research focuses on improve general program execution efficiency. Orthogonally, we can leverage existing code layout PGO policies to further improve overall performance.
Duta et al. (Duta et al., 2021) uses profiles to elide instrumentation to reduce the overhead of the defenses for transient execution attacks at the compiler level. Compared to this work, we work at the binary level and provides a general instrumentation optimization strategy
2.3. Binary Rewriting Applications
We discuss the state-of-the-art implementations of shadow stack and block coverage at the binary level, which will serve as the baselines in this work.
2.3.1. Shadow Stack
Shadow stacks prevent control flow hijacking attacks which are based on modifying a return address on the call stack. Shadow stacks maintain a copy of the regular stack in a tamper-proof region, and check that both copies match on all function returns. This scheme is effective against code reuse attacks like Return-oriented programming (ROP) (Roemer et al., 2012) and return-to-libc (Wojtczuk, 2001).
The basic implementation of shadow stack instruments every function entry and exits. Naturally, one can skip instrumenting a function if the function will never overwrite any return address. The idea of using program analysis to reduce instrumentation is often leveraged by compiler level instrumentation. For example, gcc’s -fstack-protector flag will insert stack guard for functions that call alloca, and functions with buffers larger than 8 bytes.
We find that there is no existing work that utilize static binary analysis to improve shadow stack done at the binary level. Therefore, for shadow stack, the baseline used in this work instruments every function.
2.3.2. Block Coverage
Code coverage determines how much and which piece of code is executed for a given input. We use block coverage as the example. Our optimization strategies can be extended to edge coverage.
A naive implementation is to instrument every basic block. Previous research showed that we can reduce instrumentation by performing dominator analysis on the control flow graph of a function (Agrawal, 1994). This optimization has been shown to be also effective at binary level (Ben Khadra et al., 2020), which will be the baseline for block coverage in our work.
3. Versioned Structure Binary Editing
VSBE improves the seminal work of Structure Binary Editing (SBE), presented by Bernat and Miller (Bernat and Miller, 2012). SBE defines a set of binary transformation operations, including block cloning, control flow edge redirection, and function cloning. However, SBE does not support redirecting indirect control flow that uses jump tables, which are often used by compilers to generate switch statements in C/C++. In addition, transformation operations provided by SBE do not always compose, which limits its capability to design complex binary transformations. In this section, we describe how VSBE to address these weaknesses.
3.1. Definitions
We build upon the definitions used by SBE.
Control Flow Graph: We start with a standard CFG definition, , where is a set of basic blocks, is a set of control flow edges between the basic blocks, and is a set of entry blocks of functions.
Basic Block: A basic block, , represents a sequence of machine instrumentations that have incoming control flow only at its entry and outgoing control flow only at its exit. and represent the start and end address of a basic block.
We add a version number to the definition of a basic block. Given an original block starting at address , all clones of this block will have the same starting address . Therefore, it is necessary to have a distinct version number for each of them. Conventionally, the version number for all original blocks are . The version numbers of cloned blocks should be set based on certain semantic grouping. For example, when we clone a loop, all basic blocks inside the loop should have the same version number. In Section 4, we will present examples of setting version numbers.
We also add to represent a potential jump table used by a basic block. If a basic block does not use a jump table to compute indirect jump targets, is empty. Otherwise, , where is the start address of the jump table; is the end address; is the size of a jump table entry; is a backward slice from the indirect jump that includes all instructions needed for computing the control flow target. The values for each element in can be calculated during CFG construction, which is a capability provided by many modern binary analysis tools (Shoshitaishvili et al., 2016; Meng and Miller, 2016; Di Federico et al., 2017).
Control Flow Edge: A control flow edge, , represents control flow transfer from a source block to a target block , annotated with a transfer type . In SBE, edge types include direct, conditional-taken, condition-not-taken, fall-through. We reduce conditional-not-taken, fall-through all to direct. The reason for this change is that after making multiple copies of a code, copies of a fall-through edge will not be fall-through any more.
Function: A function is defined as a set of basic blocks that is reached by traversing only intra-procedural edges from the entry block. This definition for a function can cope with challenging cases where functions share basic blocks and functions have non-contiguous basic blocks.
3.2. Primitive CFG Transformation Operations
SBE defined several primitive CFG transformation operations as the foundation for performing binary transformation. We discuss how we improve these operations in VSBE.
Figure 1 shows an example of cloning a functions. The steps of cloning a loop are similar. Figure 1(a) shows the original CFG of the example function. This function has four basic blocks. The entry block A has an indirect jump, whose targets include block B, C, and D. Block B, C, and D are return blocks. The subscripts after the block name represents its version number. Blocks with version number 0 are original code. Blocks with version number 1 are copied code.

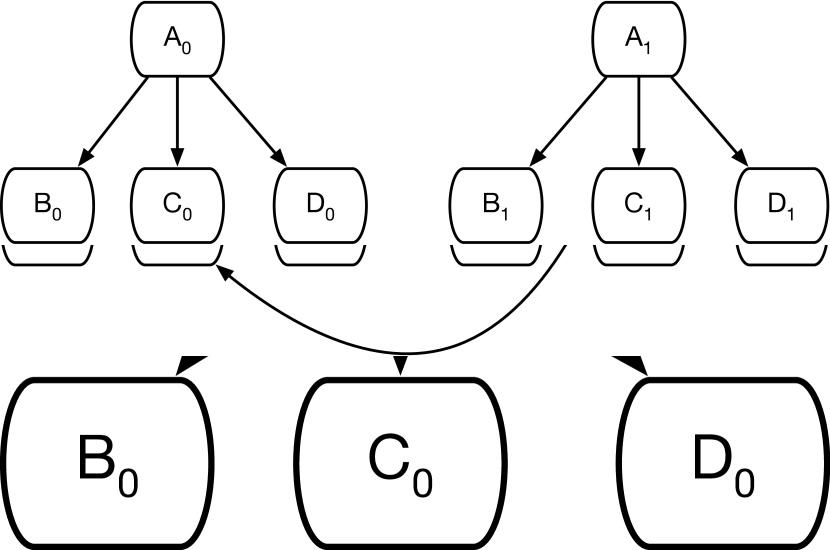

Block Clone: In SBE, cloning a basic block includes cloning the block itself and also cloning the outgoing edges of the block. The cloned block does not have any incoming edges. Users of SBE must perform edge redirection to create incoming control flow to the new block. As shown in Figure 1(b), we clone all blocks in the function. Outgoing edges of block remain targeting , , and .
Edge Redirection: Conceptually, edge redirection is simple to do as we only need to update the target block of an edge. However, SBE does not support redirecting indirect edges. The targets of indirect edges are determined through runtime computation. To redirect indirect edges, we must modify the computation of the indirect edge targets. VSBE support redirecting indirect edges by cloning jump tables and modifying jump target calculation. As shown in Figure 1(c), we redirect the targets of the new edges from , , and , to , , and , respectively.
Block Split: SBE defines that we can split a block by choosing an address inside the block range. The result of block split is that the original block is shrunk, a new block is created at the split address, and a new edge is created from the shrunk block pointing to the new block.
The newly created edge can then be redirected to other blocks, which makes the second half of the block dead code. This achieves the goal of removing instructions.
3.3. Code and Data Generation
For a basic block , we copy the instructions in the address range from the original binary and update every instruction that uses PC-relative addressing to the same global data is referenced. During this step, if is not empty, we do not emit new a jump table as the addresses of the indirect jump targets in the rewritten binary may have not been set.
When generating a control flow edge, for direct edges and condition-taken edges, we generate a direct branch and a conditional branch, respectively. In addition, we need to compute the PC-relative displacement based on the start address of the target block.
Finally, we emit new jump tables and update the instructions that reference them. Suppose we need to update a block and to use a new jump table. The new jump table is allocated with the following property. First, will be the first available virtual address to hold the new table and is aligned based on the table stride to avoid access violation. can be computed by adding the table size to . The contents of the jump table are determined by target blocks, which may have been redirected and are different from the original targets. If the entry of a target block is instrumented, the target address should be the beginning of instrumentation. Otherwise, instrumentation may be skipped. We also need to update the instruction that computes the location of the jump table to reference the new table. From , we can determine the original instruction and its belonging basic block that performs the computation. Finally, we use the version number to lookup the correct clone that contains the instruction to update.
4. Multi-Version Instrumentation
We show how to compose primitive binary transformation operations provided by VSBE to optimize static binary instrumentation.
4.1. Binary Function Inlining
Function inlining is a common compiler optimization that removes the costs of function calls and returns. In the context of binary instrumentation, binary function inlining can bring additional benefits. First, for shadow stack, an inlined call no longer needs instrumentation as there is no return address. Second, function inlining naturally extends intra-procedural static binary analysis to be context-sensitive and inter-procedural for the inlined call sites, and thus increases the utility of static binary analysis for eliding instrumentation. If we create a copy of the callee, inline it into the caller, instrument the original copy of the callee in the original way, we guarantee that the optimization is done only for the inlined call site, and it will not impact other call sites.
Next, we describe the algorithm for inlining binary functions. As shown in Algorithm 1, it takes a call block as input. Here, we assume that makes a direct function call. For an indirect call, we first do indirect call promotion (Duta et al., 2021) that transforms an indirect call site to directly call a subset of the call targets, and then apply direct call inlining to the promoted calls.
Line 2 - 4 identify and clone the callee for inlining. At line 5, we utilize procedure SplitAndRedirect to split the input call block before its last instruction (i.e. the call instruction), and redirect the outgoing edge to the cloned function entry block. At line 6, procedure RedirectReturns will iterate every cloned return block and use SplitAndRedirect to remove its last instruction (i.e. the return instruction), and redirect outgoing control Flow to the call fall-through block in the caller.
SplitAndRedirect is shown at line 9 - 18. If the block to split only has one instruction, we do not need to split block. Instead, we need to redirect every incoming control flow edge to the new target, as shown at Line 11 - 13. Otherwise, we split the block at its last instruction and redirect outgoing edge to the new target.
Setting Version Number: For each original function, we prepare a version number counter. When we make a copy of a basic block during inlining, we increment and use the counter of the original function where the cloned block belongs to. This strategy can support the case where an original function is inlined multiple times to another function.
Stack Pointer Adjustment: The removal of call and return instructions means that the inlined callee will be executed with a offset for the stack pointer compared to without inlining. This can cause access violation when the callee stores or loads a 16-byte (or larger) data element using the stack, as these memory accesses must be aligned at 16-byte (or larger) boundary. Note that function inlining at the compiler level does not need to worry this problem as the compiler will adjust these memory references accordingly. We address this issue by emitting a “lea %rsp, -8” instruction before the inlined code and a “lea %rsp, 8” instruction after the inlined code to ensure our inlining does not change the stack pointer.
Tail Calls: Suppose we have function calls , tail calls , and we want to inline into . Without inlining, will return to ’s call site to . After performing inlining into , cannot return to anymore as there is no return address. To handle this issue, we put the address of ’s call site to the stack before the tail call in . In this way, will correctly return. Note that is still instrumented.
4.2. Multi-Version Loop Instrumentation
For idempotent instrumentation, executing it once is equivalent to executing it multiple times with regard to its semantics. We observe that such idempotent instrumentation often incurs unnecessary overhead when it is inside loop. We present multi-version loop instrumentation to optimize this case. Without loss of generality, we use block coverage, which is idempotent, as an example in this section.
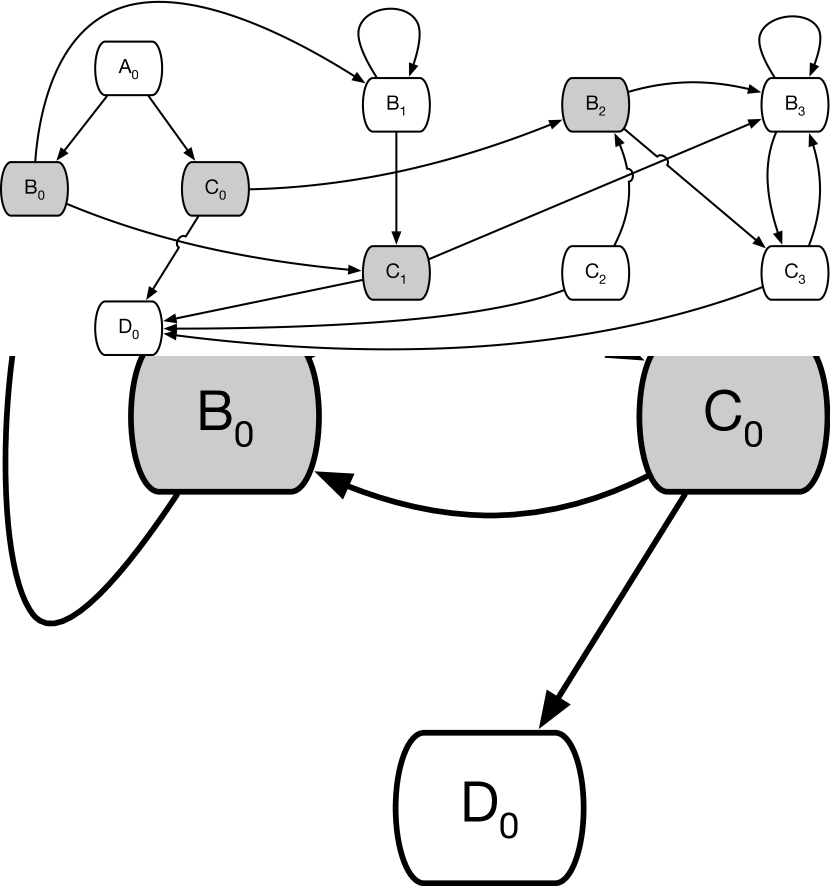
We start with an example shown in Figure 2 to illustrate the basic idea of multi-version loop instrumentation, and then describe an algorithm for it. Figure 2(a) shows the baseline instrumentation for block coverage. In this example, we have a function with four basic blocks, denoted as , , , and respectively. Instrumented blocks are shaded. and are inside a loop and are instrumented. In this baseline instrumentation, if the loop is executed many times, instrumentation in and will incur unnecessary overhead, without increasing any coverage information.
Figure 2(b) shows the results of applying multi-loop instrumentation. First, we the loop three times, so we have block and with version number from to . Different loop versions are instrumented differently: for version , only is instrumented, while is not; for version , only is instrumented, while is not; for version , neither nor is instrumented.
To understand why loop clones are instrumented in the aforementioned way, we denote a bit vector , where () is if and only if the instrumentation for ()has been executed. Instrumentation for loop version represents state . Since instrumentation for has been executed before, does not need to be instrumented. And since instrumentation for has not been executed, is instrumented. The same reasoning applies to loop version and . In addition, if we convert the state bit vector to the corresponding decimal value, it matches the version number of the loop.
Next, we redirect control flow edges among loop clones. The principle is still based on the state bit vector. For example, for version whose state vector is , if is executed, it means the state has transitioned to ; therefore, the outgoing edges of should be redirected to the loop representing state , which is loop version . Similar, if is executed, it means the state has transitioned to ; therefore, the outgoing edges of should be redirected to loop version . For targets outside the loop, we do not need to redirect edges. For example, ’s outgoing edge to is not redirected.
For blocks inside a cloned loop that are not instrumented, executing such blocks do not change the instrumentation state. Therefore, we should not redirect their outgoing edges. For example, as , , , are not instrumented, their outgoing edges are not changed.
Then, we consider a sample execution trace of the function to compare multi-version loop instrumentation with the baseline. Suppose we have a block execution trace
| (T1) |
where the superscript means the number of iteration. In the baseline, instrumentation for will be executed times, and instrumentation for will be executed times. In the multi-version loop instrumentation, the execution trace is converted to
| (T2) |
Trace T2 and Trace T1 are semantically equivalent. However, as only and contain instrumentation for , instrumentation for is executed only once in Trace T2. Similarly, as only and contains instrumentation for , instrumentation for is also only executed once in Trace T2.

Now we describe the algorithm for performing multi-version loop instrumentation. Given a loop and a subset of instrumented blocks , Algorithm 2 shows the steps for multi-version loop instrumentation.
At Line 2, we calculate the number of copies needed, which is exponential to the size of . Obviously, this will not scale to large loop where we may need to instrument thousands of blocks. In Section 5, we will show how to use profiles to identify the top hot blocks, and only make loop clones for these hot blocks.
At Line 3 - 5, we clone the loop and set the version number for each clone accordingly. At this point, the control flow of each clone loop stay in the same version. The main part of the algorithm is devoted to redirect control flow among copies of loops. We enumerate every version of loop (Line 6), and for each version of loop, we enumerate every instrumented block with an index (Line 7) and denote the corresponding cloned block with (Line 8), where is the version number and is the assigned index of the block.
If the th bit of is set, it means that the corresponding block does not need instrumentation as the instrumentation has been executed already. If not set, we instrument the block (Line 10), and handle transitions between loop clones by using procedure LoopCloneTransition (Line 11).
LoopCloneTransition computes the new version number (Line 18), and enumerate every outgoing edge of the current block to determine if we need to redirect this edge (Line 19 - 24). At Line 20, BlockLookup(b, v) returns the block that has version number and has the same start address as input . It is used to lookup a transition target.
5. Instrumentation Performance Analysis
We augment binary rewriting to support call path profiling and integrate the support in HPCToolkit (Adhianto et al., 2010).
HPCToolkit uses call path profiling. It interrupts program execution either periodically (using timer interrupts) or when the event buffer of the Performance Monitoring Unit (PMU) is full. It then processes corresponding performance events and performs a stack unwind to associate a sample with the current calling context.
Stack unwinding is often based on frame information encoded in .eh_frame sections. Existing binary rewriting tools do not update .eh_frame sections when generating rewritten binaries. In addition, there is no corresponding frame information for the inserted instrumentation. These two factors may cause stack unwind to fail for rewritten binaries.
5.1. Address Mapping Table
We augment RA Address Mapping introduced by Incremental CFG patching (Meng and Liu, 2021) to call path profiling. RA address mapping instruments the stack unwinding code in language runtime to translates the return address on stack back to original return address, which enables rewriting C++ exceptions and Go binaries. However, RA address mapping only captures return addresses of call sites in a binary. During call path profiling, a software interrupt can happen at any address, not just at return addresses. We augment this mapping to cover all the code.
Each entry in our address mapping table represents a contiguous interval in the rewritten binary. It includes three fields: the start of the address in the rewritten binary, the length of the interval, and the start of the address in the corresponding original binary. For instrumentation code, there is no original corresponding address, so the third field is set to -1.
We then modify HPCToolkit to load this mapping address table during profiling and change its code to translate the PC values.
Our address mapping table is only needed if we want to do instrumentation performance analysis or perform profile-guided instrumentation. It is not needed in production runs.
5.2. Alternative Stacks
Traditionally, instrumentation shares the same stack with the original program. This leads to several issues that requires additional instructions, which not only cause runtime overhead but also make it more difficult to perform stack unwinding. We present a new instrumentation scheme, which uses segment register gs to hold a pointer to a memory region allocated at program and thread startup time.
System V ABI specifies a 128-byte red zone space beyond stack pointer. Program can directly save temporary values in the red zone without allocating a stack frame. For this reason, to guard against overwriting red-zone, original stack instrumentation first needs to move down the stack pointer. Under alternative stack instrumentation, we do not need to worry about the red-zone space on the original stack.
If the instrumentation includes a function call, it must conform to the stack pointer alignment requirement specified by the ABI. While stack pointer can be aligned with a simple and instruction, it causes other implications that must be addressed.
First, an and instruction overwrites flags; we may have to save and restore flags if the flag register is live at the instrumentation point. Second, the effect of stack pointer alignment cannot be easily reversed. This is contrary to moving down stack pointer with a constant offset, where we can move up the stack pointer with the same constant to reverse its affect. For this reason, we save %rsp to a scratch register, align the stack pointer, and save the original stack pointer to the current stack top. In this way, after instrumentation, we can recover the original stack pointer through a pop.
In contrary, instrumentation using alternative stacks only needs to two instructions. We save %rsp to the scratch space so that later we can restore it, and we change %rsp to the start of the alternative stack. Here, we do not need to align stack as we can pre-align the alternative stack when we allocate it.
Under our new alternative stack design, unwinding in instrumentation code is the same as unwinding from the first instruction after the instrumentation. In addition, instrumentation does not need to compensate the side effects caused by using the original stack.
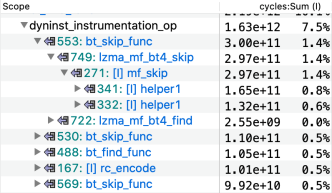
5.3. Viewing Instrumentation Costs
Figure 3 shows using HPCViewer from the HPCToolkit to view instrumentation costs. The scope column represents individual functions. The dyninst_instrumentation_op represents a summary placeholder for instrumentation. In this example, we can see that instrumentation costs 7.5% of the total cycles.
Underneath the instrumentation placeholder, there are instrumentation costs attributed to different call paths. Source line 553 in function bt_skip_func incurs 1.4% instrumentation overhead, while source line 530 incurs 0.5% instrumentation overhead.
Binary rewriting application researchers can pinpoint the source of costs and design optimizations.
6. Optimizing Binary Rewriting Applications
We show to how use instrumentation profiling, static binary analysis, and multi-version instrumentation to improve shadow stack and block coverage.
6.1. Shadow Stack
For shadow stack, our instrumentation requires a slot for the shadow stack pointer (%gs:0x0), and at most two slows for two scratch registers (%gs:0x8 and %gs:0x10). Memory locations after %gs:0x10 are used for the shadow stack.
The push and pop operations mirror regular call stack operations. To support C++ exceptions and setjmp/longjmp, we repeatedly pop the values from the stack until a match or an under-flow occurs. Figure 4 shows the instruction sequence for push. The pop is similar (though with the loop).
As per Figure 4 the instruction sequence for a push consists of 9 instructions and 6 memory accesses. The pop operation incurs a similar overhead leading to about 20 instructions and 12 memory accesses per function call from shadow stack instrumentation. We use this instrumentation sequence as the baseline for shadow stack.
6.1.1. Safe Function Elision
We use static binary analysis to determine whether a function is “safe” regarding return addresses and elide instrumentation for safe functions. Memory writes to global variables and stack variables within the current function frame (such as stack writes for spilling registers) are safe. If a function and all of its callees contain only safe memory writes, we do not instrument such function. For indirect calls, as we cannot statically determine its targets; we conservatively treat any function that may reach an indirect call as unsafe.
6.1.2. Dead Register Chasing
The basic shadow stack push and pop each need two GPRs as scratch space. It is a well-known strategy to leverage register liveness analysis to identify dead registers. We can avoid register save and restore if the scratch register is dead.
We observe that we can move our instrumentation to realize more dead registers compared to fixing our instrumentation at function entry and exit. For example, in Figure 5 if we instrument at the function entry, %rbx and %r10 are live because their values are then pushed to the stack. If we move our shadow stack push operation after the push instruction sequence, we have two dead registers. In this scenario, we need to adjust the offset for retrieving return address from the stack as we have pushed two GPRs to the stack. We call this technique dead register chasing. Currently, we only move instrumentation within the same basic block and we cannot move instrumentation beyond unsafe memory writes or unsafe function calls.
6.1.3. Leaf Function Optimization
Our profiling shows that in many cases, top hot functions are leaf functions. Instead of storing the return address to the shadow stack, we use a free register to implement a register stack frame. Figure 6 shows an example of a register frame push operation. Compared to the basic stack push operation shown in Figure 4, a register frame push operation contains only 2 instructions.
We make two observations for the first instruction in Figure 6. We perform a register usage analysis of the leaf function to identify a free general purpose register (GPR). Note that we still need to save and restore the value of the chosen GPR because the compiler may not always emit ABI-compliant code (due to hand coded assembly etc.). So, the unused register in the leaf function may carry live data for its caller.
6.1.4. Profile-Guided Inlining
We use call path profiles to guide binary function inlining. We mainly attribute instrumentation costs to a pair of the call site and the corresponding callee, and perform inlining from the most expensive call sites until we cover 99% of the instrumentation costs.
We handle two special cases. First, call site attribution is not sufficient to determine whether cascaded inlined should be done. Suppose we have three functions A, B, and C, where A calls B and B calls C. In addition, the call site data tells us to inline C into B and inline B into A. When we inline B into A, should we just inline the original B (without C) or inline the modified B (including C)? If the call paths associated with costs of B calling C do not include A, then there is not need to inline C into A as the the cost of B calling C is not incurred when A calls B; otherwise, we should also inline C into A.
Second, it is possible that a call site and callee pair does not match. Suppose A calls B, and B tail calls C. When we take a sample in C, as B performs tail calls into C, there is no stack frame or return addresses in B. So, the call paths will look like that A directly calls C. For such unmatched call sites and callees, we skip them.
6.2. Block Coverage
We use the block coverage implementation described by Khadra et al. (Ben Khadra et al., 2020) as the baseline. We re-implement their approach with Dyninst to avoid overhead differences caused by the binary rewriting tool.
6.2.1. Thread Local Instrumentation Data
The baseline implementation allocates static global memory to store coverage information. The advantage is that instrumentation can be achieved with a single instruction using PC-relative addressing: movb 1, %rip:off. This instruction pattern is also used for other instrumentation tasks, such as counting execution frequency of functions (Williams-King et al., 2020). We find that this instrumentation strategy will cause prohibitively overhead when running multi-threaded programs, and the overhead will deteriorate with more threads. We observed over 10X slowdown when using 8 threads.
The root cause was quickly revealed when we profile it. We observed that instrumented code incurred a few times more last level cache misses than the uninstrumented code. This points to the false sharing of the cache lines for the global memory used to store coverage information, where different hardware threads may constantly write to the same cache line, causing this cache line to be invalidated on other cores.
To mitigate this problem, we store coverage information in the alternative stack region described in Section 5.2, though we do not treat the memory region as a stack in this case. A single instruction, movb 1, %gs:off, can write coverage information to the alternative stack region. We union the coverage information at the end of the execution to derive the coverage information for the process.
6.2.2. Profile-Guided Instrumentation Data Allocation
We then observed a performance problem with regard to the order of coverage data allocation. In Figure 7, we have two functions, whose function entries are instrumented. We call the instrumentation at the entry of A (B) as ().
Our profile shows that is a hot spot, which takes cycles. In addition, the call stacks of the samples for show that all the cost by come from the call site at address 0xb6effd inside B. Therefore, A should have the same execution frequency as B. However, our profile shows that only takes cycles, which is half of what takes.
Since and executed similar amount of time and both have the similar instruction (a memory write), we concluded that is suffering from cache related problems. It turned out that when we allocate which byte in the instrumentation data region to store coverage information for which basic block, we (and existing work) just allocate one byte at time sequentially based on the processing order of the code, which is typically in increasing order of the starting address of basic blocks.
In this case, writes coverage information for basic block at 0x416290 while writes coverage information for basic block at 0xb64ff0. So, the and are writing to memory location separated by many cache lines. Each time when B calls A, we will first access to one cache line for and then immediately access to another cache line for . So, there is no cache line reuse between and .
To address this issue, we design a profile-guided coverage data allocation scheme. We rank all function call pairs X and Y based on the costs attributed to function X calling Y. From the highest pair, we try to allocate coverage data for X and Y as close as possible. This way, high overhead pairs will enjoy better data locality.
6.2.3. Profile-Guided Loop Cloning
As described in Section 4.2, idempotent instrumentation such as block coverage can benefit from loop cloning to elide instrumentation. We attribute instrumentation costs to the basic blocks and rank them in decreasing order of their costs. We go through the ranked list and add a block to perform clone if its belonging loop still contains fewer than blocks to clone. Empirically, we set , so we make at most copies for a loop. We skip basic blocks that are not in any loop.
6.2.4. Sampling Skid
As each instrumentation point contains only one memory write instruction, the sampling skid of performance events may seriously distort where the instrumentation costs come from. Sampling skid refers to the delay between where a performance event happens the signal delivery to the performance tool. For code coverage instrumentation, the skid can cause instrumentation costs to be attributed to original code. In some cases, we have seen all costs incurred by instrumentation are attributed to original code, which defeats the purpose of profiling analysis of instrumentation and profile-guided instrumentation.
Vendors provide hardware support to mitigate sampling skid, including Intel’s precise event-based sampling (PEBS) and AMD’s instruction-based sampling (IBS). However, recent studies have shown that these “precise” sampling technologies may still be imprecise (Xu et al., 2019b; Yi et al., 2020).
In our case, profiles collected using Intel’s PEBS for block coverage enabled us to identify the data allocation problem described above, and are effective for performing profile-guided instrumentation. It is an interesting future research topic to see whether a sophisticated handling of sampling skid can yield better results.
7. Evaluation
We evaluate our implementation with SPEC CPU 2017 and two real world software.
7.1. SPEC CPU 2017
We are able to compile and run 19 of the 20 available benchmarks. 627.cam4_s does not compile on any of the systems, so is excluded. 8 of the 19 benchmarks are written in Fortran or have Fortran components. The other benchmarks are in C/C++.
All profile-guided versions utilize the training workloads in SPEC CPU 2017, which are different from the reference workloads that are used for reporting the results. Some benchmarks provide multiple training workloads. For these benchmarks, the final profiles are the aggregation of the individual profiles.
We run all instrumentation versions 10 times using 8 hardware threads and use the selected runs by SPEC CPU 2017 to compute overhead. Table 1 shows the result summary. The empty shows the overhead of instrumenting every basic block with empty instrumentation and represents the tool overhead caused by incremental CFG patching (Meng and Liu, 2021).
| Time overhead | Size increase | |||
| max | mean | max | mean | |
| empty | 1.0% | 0.20% | 101.53% | 64.27% |
| SS-base | 31.0% | 7.6% | 141.4% | 81.0% |
| SS-static | 13.3% | 3.1% | 119.0% | 73.8% |
| SS-inline | 10.0% | 1.4% | 126.2% | 78.5% |
| BC-base | 1495.4% | 161.3% | 114.6% | 76.4% |
| BC-thread | 51.1% | 9.8% | 126.5% | 77.7% |
| BC-loop | 14.0% | 5.9% | 1813.8% | 145.0% |
| BC-data | 12.1% | 4.0% | 1813.8% | 145.0% |
7.1.1. Shadow Stack
We compare three versions: SS-base represents a baseline binary level shadow stack implementation, where we instrument every function entry and exit with the baseline instrumentation sequence shown in Figure 4; SS-static represents an improved shadow stack implementation using static binary analysis to elide instrumentation of safe functions, leaf function frame optimization, and dead register chasing; SS-inline is SS-static with profile-guided binary function inlining. The experiments for shadow stack are done on an AMD EPYC 7402 server, which has 512GB memory and runs Red Hat 8.3. We use the system default compiler gcc-8.3.1. Profile data is collected with CPU timers.
Overall, we can see that SS-static significantly reduces runtime overhead compared to SS-base, showing that static binary analysis and careful instrumentation instruction sequence designs are two power weapons to optimize binary instrumentation applications. Equipped with call path profiling, users can identify to where to pay attention. SS-inline cut the average overhead by half compared to SS-static, showing that profile-guided inlining is a useful for optimizing binary instrumentation.
Next, we dive into the results of three benchmarks to better understand the capability of profile-guided inlining. One of the most successful benchmark for SS-inline is 620.omnetpp_s, which is written in C++. Our profile shows that an indirect function call, which implements a virtual function call, incurred the most costs. And almost all costs of this indirect call site goes to a single function. The combination of indirect call promotion and function inlining can eliminate most of the costs. It is often challenging for static binary analysis to analyze indirect calls. SS-static incurred 10.6% overhead for this benchmark and its overhead was reduced to 3.9% with SS-inline.
SS-inline incurred the highest overhead with 600.perlbench_s. Its overhead is centered around an indirect call that serves as a dispatcher to call different interpreter operations. This indirect call can go to over 60 different functions. It returns the next operation to invoke and is executed inside a small loop repeatedly that fits in a single cache line. We observed that when attempting to promote more than 5 indirect call targets for this indirect call, instruction cache pressure will make performance worse than without any inlining.
The call site profile for 602.gcc_s exhibits a long-tail distribution, which means that we have to inline much more code for this benchmark to cover instruction We find that the net effect of binary function inlining is negligible compared without inlining.
7.1.2. Block Coverage
For block coverage, we compare four versions: BC-base represents a baseline of binary-level block coverage implementation (Ben Khadra et al., 2020); BC-thread represents the version that store coverage information in thread local memory; BC-loop represents BC-thread with profile-guided multi-version loop instrumentation; BC-data is BC-thread with profile-guided coverage data allocation. The experiments are done on an Intel(R) Xeon(R) CPU E5-2695 server, which has 128GB memory and runs Red Hat 7.9. We use a gcc-7.3.0 built by the system admin as the system compiler for Red Hat 7.9 is gcc-4.8.5, which is too old. Profile data is collected with the PEBS cycle counter to mitigate the sampling skid.
BC-base suffers from false sharing, incurring over 100% overhead on average. BC-thread stores coverage information in thread local memory regions, thus avoiding false sharing. BC-base and BC-thread have similar overhead numbers for benchmarks that do not use multi-threading. BC-thread incurs slightly higher size overhead as the instruction that writes a memory location related to %gs is two-byte longer than the instruction that is PC-relative.
BC-thread incurred highest overhead, 51.1%, with 644.nab_s. BC-loop and BC-data reduced the overhead to 10.0% and 3.7%, respectively.
BC-loop and BC-data have the same size overhead as BC-data only reorders instrumentation data allocation. Both incurred over 18X binary size increase for 648.exchange2_s. This dramatic size increase is caused by making copies of loops that are over a few KB in size. The net effect is that BC-loop does not reduce overhead for this benchmark compared to BC-thread
7.2. Real World Software
We also evaluated shadow stack and block coverage instrumentation using two real world software: Apache HTTP Server and Firefox. The experiments were done on the Intel system mentioned above.
7.2.1. Apache HTTP Server
We compiled httpd-2.4.43 and instrumented the server executable httpd. We used the provided benchmarking program ab to measure instrumentation overhead by transferring a 595KB HTML file 100,000 times. We collect call path profiles by transferring the same file, but only 10,000 times. The experiments were repeated 20 times.
For shadow stack instrumentation, SS-base caused 18.4% throughput reduction and 22.3% latency increase; SS-static improved these numbers to 10.7% throughput reduction and 12.0% latency increase; SS-inline performed the best, causing 3.3% throughput reduction and 3.6% latency increase.
For block coverage instrumentation, all versions incurred negligible overhead.
7.2.2. Firefox
We used the Firefox shipped with Red Hat 7.9, which is 78.4.0. We instrument the libxul.so library in Firefox. This library is the main component of Firefox and its .text section is over 100MB in size.
To our surprise, none of our profile-guided instrumentation for shadow stack or block coverage can reduce instrumentation overhead, even when we collected profiles using the same benchmarks for testing.
The idea of multi-version binary rewriting centers on creating multiple copies of code to elide instrumentation, which increase the code size. If the root cause of binary instrumentation overhead are data accesses, multi-version binary rewriting can be beneficial. However, if the root cause of instrumentation overhead is related to instruction fetching, multi-version binary rewriting will not be helpful.
For Firefox, when we replaced the actual instrumentation with nops in the same length, we found that the nop instrumentation incurred similar overhead as the actual instrumentation. The nop instrumentation causes no additional data accesses but has the effect on instruction cache as the original instrumentation. This confirms that the instrumentation overhead for Firefox is instruction fetching related.
We also found that for libxu.so, even after dominator analysis, we need to instrument over 2 million basic blocks. Each memory write instruction in BC-thread is 9-byte long. So the instrumentation increased the code size by over 18MB! The profiles for Firefox also exhibited long-tail distributions. These two factors together explains why instrumentation overhead for Firefox is mainly caused by instruction fetching.
While it is disappointing, we believe this “negative” result and our analysis above are beneficial for understanding the scenarios where our new techniques can be useful.
8. Discussion
Last Branch Record: Recent studies on PGO (Panchenko et al., 2019, 2021; Duta et al., 2021) utilize the last branch records (LBR) provided by Intel to extract execution counts of control flow edges. LBR has very limited availability on non-Intel hardware. Our work enables call path profiling for binary instrumentation, which can collect performance information utilizing timer interrupts and hardware performance counters, thus has a wider applicability. We note that our approach can also be improved by incorporating LBR when available. We mentioned that call path profiling will miss functions performing tail calls, which can potentially be captured by LBR.
Application Specific Issues: From binary rewriting application researchers’ perspectives, there are other application specific issues to consider besides the instrumentation overhead. For shadow stack, the shadow memory region must be isolated from the original program, which is an important but orthogonal research area (Sehr et al., 2010; Burow et al., 2018). There are also concerns on cross-thread attacks (Xu et al., 2019a). For code coverage, edge coverage may reveal more information compared to block coverage (Zhu et al., 2020). Our message is that by showing we can improve two typical binary rewriting applications in conventional settings, our can benefit binary rewriting application researchers in other scenarios.
9. Conclusion
We have presented multi-version binary rewriting, a new technique for optimizing static binary instrumentation. We enabled call path profiling for static binary instrumentation, designed primitive binary transformation operations to support complex binary transformation, and applied instrumentation performance analysis and profile-guided binary transformation to optimize shadow stack and block coverage, two typical binary rewriting applications. Our results of SPEC CPU 2017 benchmarks, Apache HTTPD Server, and Firefox show that our techniques work well on programs where the root cause of instrumentation overhead is data accesses, and point out future research direction for designing optimization strategies to reduce instrumentation overhead caused by instruction fetching issues.
References
- (1)
- Adhianto et al. (2010) L. Adhianto, S. Banerjee, M. Fagan, M. Krentel, G. Marin, J. Mellor-Crummey, and N. R. Tallent. 2010. HPCTOOLKIT: Tools for Performance Analysis of Optimized Parallel Programs Http://Hpctoolkit.Org. Concurrency and Computation: Practice & Experience 22, 6 (Apr. 2010), 685–701.
- Agrawal (1994) Hiralal Agrawal. 1994. Dominators, Super Blocks, and Program Coverage. In Proceedings of the 21st ACM SIGPLAN-SIGACT Symposium on Principles of Programming Languages (POPL ’94). Portland, Oregon, USA, 25–34. https://doi.org/10.1145/174675.175935
- Arnold et al. (2000) Matthew Arnold, Stephen Fink, Vivek Sarkar, and Peter F. Sweeney. 2000. A Comparative Study of Static and Profile-Based Heuristics for Inlining. In Proceedings of the ACM SIGPLAN Workshop on Dynamic and Adaptive Compilation and Optimization (DYNAMO ’00). 52–64. https://doi.org/10.1145/351397.351416
- Ayers et al. (1997) Andrew Ayers, Richard Schooler, and Robert Gottlieb. 1997. Aggressive Inlining. In Proceedings of the ACM SIGPLAN 1997 Conference on Programming Language Design and Implementation (Las Vegas, Nevada, USA) (PLDI ’97). 134–145. https://doi.org/10.1145/258915.258928
- Ben Khadra et al. (2020) M. Ammar Ben Khadra, Dominik Stoffel, and Wolfgang Kunz. 2020. Efficient Binary-Level Coverage Analysis. In Proceedings of the 28th ACM Joint Meeting on European Software Engineering Conference and Symposium on the Foundations of Software Engineering (ESEC/FSE) (Virtual Event, USA). 1153–1164. https://doi.org/10.1145/3368089.3409694
- Bernat and Miller (2011) Andrew R. Bernat and Barton P. Miller. 2011. Anywhere, Any-Time Binary Instrumentation. In 10th ACM SIGPLAN-SIGSOFT Workshop on Program Analysis for Software Tools (PASTE’11). Szeged, Hungary, 9–16.
- Bernat and Miller (2012) Andrew R. Bernat and Barton P. Miller. 2012. Structured Binary Editing with a CFG Transformation Algebra. In 2012 19th Working Conference on Reverse Engineering (WCRE). Kingston, ON, Canada, 9–18.
- Bernat et al. (2011) Andrew R. Bernat, Kevin A. Roundy, and Barton P. Miller. 2011. Efficient, Sensitivity Resistant Binary Instrumentation. In The International Symposium on Software Testing and Analysis (ISSTA). Toronto, Canada.
- Burow et al. (2018) Nathan Burow, Derrick McKee, Scott A. Carr, and Mathias Payer. 2018. CFIXX: Object Type Integrity for C++. In NDSS.
- Chang and Hwu (1989) P. P. Chang and W.-W. Hwu. 1989. Inline Function Expansion for Compiling C Programs. ACM SIGPLAN Notice 24, 7 (June 1989), 246–257. https://doi.org/10.1145/74818.74840
- Chen et al. (2016) Dehao Chen, David Xinliang Li, and Tipp Moseley. 2016. AutoFDO: Automatic Feedback-directed Optimization for Warehouse-scale Applications. In 2016 International Symposium on Code Generation and Optimization (CGO). Barcelona, Spain.
- Chen et al. (2013) D. Chen, N. Vachharajani, R. Hundt, X. Li, S. Eranian, W. Chen, and W. Zheng. 2013. Taming Hardware Event Samples for Precise and Versatile Feedback Directed Optimizations. IEEE Trans. Comput. 62, 2 (2013), 376–389. https://doi.org/10.1109/TC.2011.233
- Cohn et al. (1998) Robert S. Cohn, David W. Goodwin, and P. Geoffrey Lowney. 1998. Optimizing Alpha Executables on Windows NT with Spike. Digital Technical Journal 9, 4 (April 1998), 3–20.
- Dang et al. (2015) Thurston HY Dang, Petros Maniatis, and David Wagner. 2015. The performance cost of shadow stacks and stack canaries. In Proceedings of the 10th ACM Symposium on Information, Computer and Communications Security. ACM, 555–566.
- Di Federico et al. (2017) Alessandro Di Federico, Mathias Payer, and Giovanni Agosta. 2017. Rev.Ng: A Unified Binary Analysis Framework to Recover CFGs and Function Boundaries. In 26th International Conference on Compiler Construction (CC). Austin, TX, USA.
- Dinesh et al. (2020) Sushant Dinesh, Nathan Burow, Dongyan Xu, and Mathias Payer. 2020. RetroWrite: Statically Instrumenting COTS Binaries for Fuzzing and Sanitization. In 41st IEEE Symposium on Security and Privacy (Oakland).
- Duck et al. (2020) Gregory J. Duck, Xiang Gao, and Abhik Roychoudhury. 2020. Binary Rewriting without Control Flow Recovery. In 41st ACM SIGPLAN Conference on Programming Language Design and Implementation (PLDI). London, UK.
- Duta et al. (2021) Victor Duta, Cristiano Giuffrida, Herbert Bos, and Erik van der Kouwe. 2021. PIBE: Practical Kernel Control-Flow Hardening with Profile-Guided Indirect Branch Elimination. In Proceedings of the 26th ACM International Conference on Architectural Support for Programming Languages and Operating Systems (Virtual, USA) (ASPLOS 2021). 743–757. https://doi.org/10.1145/3445814.3446740
- Flores-Montoya and Schulte (2020) Antonio Flores-Montoya and Eric Schulte. 2020. Datalog Disassembly. In 29th USENIX Security Symposium (USENIX Security 20). 1075–1092. https://www.usenix.org/conference/usenixsecurity20/presentation/flores-montoya
- Google (2021) Google. accessed April 24, 2021. PROPELLER: Profile Guided Optimizing Large Scale LLVM-based Relinker, https://github.com/google/llvm-propeller.
- Gu and Mellor-Crummey (2018) Yizi Gu and John Mellor-Crummey. 2018. Dynamic Data Race Detection for OpenMP Programs. In International Conference for High Performance Computing, Networking, Storage, and Analysis (SC). Dallas, Texas.
- Hall (1992) Robert J. Hall. 1992. Call Path Profiling. In Proceedings of the 14th International Conference on Software Engineering (Melbourne, Australia) (ICSE ’92). 296–306. https://doi.org/10.1145/143062.143147
- Hawkins et al. (2017) William H. Hawkins, Jason D. Hiser, Michele Co, Anh Nguyen-Tuong, and Jack W. Davidson. 2017. Zipr: Efficient Static Binary Rewriting for Security. In 2017 47th Annual IEEE/IFIP International Conference on Dependable Systems and Networks (DSN). Denver, CO, USA, 559–566. https://doi.org/10.1109/DSN.2017.27
- Meng and Liu (2021) Xiaozhu Meng and Weijie Liu. 2021. Incremental CFG Patching for Binary Rewriting. In Proceedings of the 26th ACM International Conference on Architectural Support for Programming Languages and Operating Systems (ASPLOS) (Virtual Event).
- Meng and Miller (2016) Xiaozhu Meng and Barton P. Miller. 2016. Binary Code Is Not Easy. In The International Symposium on Software Testing and Analysis (ISSTA). Saarbrücken, Germany.
- Ottoni and Maher (2017) Guilherme Ottoni and Bertrand Maher. 2017. Optimizing Function Placement for Large-Scale Data-Center Applications. In Proceedings of the 2017 International Symposium on Code Generation and Optimization (CGO). Austin, USA.
- Panchenko et al. (2019) Maksim Panchenko, Rafael Auler, Bill Nell, and Guilherme Ottoni. 2019. BOLT: A Practical Binary Optimizer for Data Centers and Beyond. In Proceedings of the 2019 IEEE/ACM International Symposium on Code Generation and Optimization (CGO). Washington, DC, USA, 2–14.
- Panchenko et al. (2021) Maksim Panchenko, Rafael Auler, Laith Sakka, and Guilherme Ottoni. 2021. Lightning BOLT: Powerful, Fast, and Scalable Binary Optimization. In Proceedings of the 30th ACM SIGPLAN International Conference on Compiler Construction (Virtual, Republic of Korea) (CC 2021). 119–130. https://doi.org/10.1145/3446804.3446843
- Roemer et al. (2012) Ryan Roemer, Erik Buchanan, Hovav Shacham, and Stefan Savage. 2012. Return-oriented programming: Systems, languages, and applications. ACM Transactions on Information and System Security (TISSEC) 15, 1 (2012), 2.
- Scheifler (1977) Robert W. Scheifler. 1977. An Analysis of Inline Substitution for a Structured Programming Language. Commun. ACM 20, 9 (Sep. 1977), 647–654. https://doi.org/10.1145/359810.359830
- Sehr et al. (2010) David Sehr, Robert Muth, Cliff Biffle, Victor Khimenko, Egor Pasko, Karl Schimpf, Bennet Yee, and Brad Chen. 2010. Adapting Software Fault Isolation to Contemporary CPU Architectures. In 19th USENIX Conference on Security (USENIX). Washington, DC.
- Shoshitaishvili et al. (2016) Y. Shoshitaishvili, R. Wang, C. Salls, N. Stephens, M. Polino, A. Dutcher, J. Grosen, S. Feng, C. Hauser, C. Kruegel, and G. Vigna. 2016. SOK: (State of) The Art of War: Offensive Techniques in Binary Analysis. In 2016 IEEE Symposium on Security and Privacy (SP). San Jose, CA, USA.
- v. d. Veen et al. (2016) V. v. d. Veen, E. Göktas, M. Contag, A. Pawoloski, X. Chen, S. Rawat, H. Bos, T. Holz, E. Athanasopoulos, and C. Giuffrida. 2016. A Tough Call: Mitigating Advanced Code-Reuse Attacks at the Binary Level. In 2016 IEEE Symposium on Security and Privacy (SP). San Jose, CA, USA.
- van der Veen et al. (2015) Victor van der Veen, Dennis Andriesse, Enes Göktaş, Ben Gras, Lionel Sambuc, Asia Slowinska, Herbert Bos, and Cristiano Giuffrida. 2015. Practical Context-Sensitive CFI. In 22nd ACM SIGSAC Conference on Computer and Communications Security (CCS). Denver, Colorado, USA.
- Wang et al. (2017) Ruoyu Wang, Yan Shoshitaishvili, Antonio Bianchi, Aravind Machiry, John Grosen, Paul Grosen, Christopher Kruegel, and Giovanni Vigna. 2017. Ramblr: Making reassembly great again. In 24th Annual Symposium on Network and Distributed System Security (NDSS). San Diego, CA, USA.
- Welton and Miller (2019) Benjamin Welton and Barton P. Miller. 2019. Diogenes: Looking for an Honest CPU/GPU Performance Measurement Tool. In Proceedings of the International Conference for High Performance Computing, Networking, Storage and Analysis (Denver, Colorado) (SC’19).
- Welton and Miller (2020) Benjamin Welton and Barton P. Miller. 2020. Identifying and (Automatically) Remedying Performance Problems in CPU/GPU Applications. In 34th ACM International Conference on Supercomputing (ICS). Barcelona, Spain, Article 27, 13 pages.
- Williams-King et al. (2020) David Williams-King, Hidenori Kobayashi, Kent Williams-King, Graham Patterson, Frank Spano, Yu Jian Wu, Junfeng Yang, and Vasileios P. Kemerlis. 2020. Egalito: Layout-Agnostic Binary Recompilation. In Twenty-Fifth International Conference on Architectural Support for Programming Languages and Operating Systems (ASPLOS). Lausanne, Switzerland.
- Williams-King and Yang (2019) David Williams-King and Junfeng Yang. 2019. CodeMason: Binary-Level Profile-Guided Optimization. In 3rd ACM Workshop on Forming an Ecosystem Around Software Transformation (London, United Kingdom) (FEAST’19).
- Wojtczuk (2001) Rafal Wojtczuk. 2001. The advanced return-into-lib (c) exploits: PaX case study. Phrack Magazine, Volume 0x0b, Issue 0x3a, Phile# 0x04 of 0x0e (2001).
- Xu et al. (2019b) Hao Xu, Qingsen Wang, Shuang Song, Lizy Kurian John, and Xu Liu. 2019b. Can We Trust Profiling Results? Understanding and Fixing the Inaccuracy in Modern Profilers. In Proceedings of the ACM International Conference on Supercomputing (Phoenix, Arizona, USA) (ICS ’19). 284–295. https://doi.org/10.1145/3330345.3330371
- Xu et al. (2019a) Xiaoyang Xu, Masoud Ghaffarinia, Wenhao Wang, Kevin W. Hamlen, and Zhiqiang Lin. 2019a. CONFIRM: Evaluating Compatibility and Relevance of Control-flow Integrity Protections for Modern Software. In 28th USENIX Security Symposium (USENIX Security) (Santa Clara, CA).
- Yi et al. (2020) Jifei Yi, Benchao Dong, Mingkai Dong, and Haibo Chen. 2020. On the Precision of Precise Event Based Sampling. In Proceedings of the 11th ACM SIGOPS Asia-Pacific Workshop on Systems (Tsukuba, Japan) (APSys ’20). 98–105. https://doi.org/10.1145/3409963.3410490
- Zhang and Sekar (2013) Mingwei Zhang and R. Sekar. 2013. Control Flow Integrity for COTS Binaries. In Presented as part of the 22nd USENIX Security Symposium (USENIX Security 13) (Washington, D.C.).
- Zhu et al. (2020) Xiaogang Zhu, Xiaotao Feng, Xiaozhu Meng, Sheng Wen, Seyit Camtepe, Yang Xiang, and Kui Ren. 2020. CSI-Fuzz: Full-speed Edge Tracing Using Coverage Sensitive Instrumentation. IEEE Transactions on Dependable and Secure Computing (2020), 1–1. https://doi.org/10.1109/TDSC.2020.3008826