Hunting distant BL Lacs with the photometric technique using Swift and SARA
Abstract
BL Lacertae objects (BL Lacs) represent a large fraction (22%) of -ray sources in the Third Fermi Large Area Telescope catalog (3FGL). Nearly half of the BL Lac population remains without a redshift because of their featureless optical spectra. We aim to increase the number of BL Lacs with a redshift measurement by using the photometric technique. For this work, we have used 6 Swift-UVOT filters and SDSS optical filters mounted on the 0.65 m SARA-CTIO located in Chile and the 1.0 m SARA-ORM in Canary Islands. A sample of 45 sources was selected from the 3FGL catalog for which photometry was performed in 10 optical and UV filters to obtain redshift measurements. We found 3 sources with while reliable upper limits have been provided for 17 sources. The results presented here bring the total number of high- () BL Lacs to 29.
1 Introduction
The Third Fermi Large Area Telescope (LAT) source catalog (Acero et al., 2015, 3FGL) detected over 1500 sources in the 100 MeV300 GeV range, that belong to the blazar class. Blazars are an extreme class of active galaxies that have their relativistic jets aligned by a very small angle with our line of sight. Their spectral energy distribution (SED) displays two characteristic bumps, with one at lower energies (infrared to X-rays) attributed to synchrotron emission, while the high-energy one (X-ray to -rays) is ascribed to synchrotron self-Compton emission (Maraschi et al., 1994) or inverse Compton scattering on external photon fields (Sikora et al., 1994; Ghisellini et al., 1996; Ghisellini & Madau, 1996; Dermer et al., 1997).
Blazars are also classified based on their optical spectra into flat spectrum radio quasars (FSRQs) and BL Lacertae objects (BL Lacs). FSRQs are known for the presence of broad emission lines (equivalent width 5Å) in their spectra while BL Lacs have no or very weak emission lines (Urry & Padovani, 1995).
They dominate the 3FGL catalog with 484 FSRQs and 660 BL Lac objects.
Padovani & Giommi (1995) introduced another classification scheme of blazars based on the position of the synchrotron peak frequency, . Abdo et al. (2010) subsequently identified the ranges of peak frequency for each category. They divided the blazar population into three different classes: Low Synchrotron Peaked blazars (LSP) where Hz; High Synchrotron Peaked blazars (HSP) with Hz and Intermediate Synchrotron Peaked blazars (ISP) for Hz Hz. BL Lacs span the three classes (LSP, ISP and HSP; Ackermann et al., 2015) while FSRQs mainly belong to the LSP category.
Because of their hard GeV spectra, HSP BL Lacs are valuable in the study of extragalactic background light (EBL), which constitutes the integrated radiation from all stars, galaxies, and other objects in the universe since the re-ionization epoch (Domínguez & Ajello, 2015; The Fermi-LAT Collaboration, 2018).
Measuring the EBL directly is a challenge due to the presence of the zodiacal light as well as the emission from our Galaxy (Hauser & Dwek, 2001). Therefore, an indirect method employed to measure the EBL makes use of distant -ray emitters. Photons from -ray sources interact with the EBL photons and cause production of electron-positron pairs, which imprints a characteristic absorption signature in the spectra of these -ray sources (Stecker et al., 1992; Ackermann et al., 2012). This attenuation in their spectra can be used to study the EBL evolution with redshift (Aharonian et al., 2006) and other cosmological properties (Domínguez & Prada, 2013; Domínguez et al., 2019). Furthermore, the higher the redshift of the source, the stronger will be the attenuation, hence providing a better EBL constraint. Thus, the requirement for redshift measurements of -ray sources and particularly of HSP BL Lacs is imperative.
The photometric technique introduced for BL Lacs by Rau et al. (2012) proves to be well-suited for measuring the redshifts of BL Lacs that otherwise lack a spectroscopic redshift. The photometric method is based on the following principle: UV photons from a -ray source (BL Lac) are absorbed by the neutral Hydrogen along our line of sight causing a clear attenuation in the flux at the Lyman limit (912 Å). The position of this dropout in the SED is modeled to measure the redshift of the BL Lac.
Applying this method to a sample of 103 BL Lacs (with no redshift measurements) from Fermi’s Second Catalog of Active Galactic Nuclei (2LAC) (Ackermann et al., 2011), Rau et al. (2012) found 9 BL Lacs at high redshifts (; out of which 6 were newly detected). Furthermore, Kaur et al. (2017) found 5 more BL Lacs from a sample of 40 sources and 2 more were found from a sample of 15 sources in Kaur et al. (2018), bringing the number of confirmed high- BL Lacs to a total of 26 (19 being already reported in Fermi’s 3LAC, Ackermann et al. (2015), catalog).
In this work we employ the photometric technique to provide new BL Lac redshifts using a sample of 45 sources. We use a flat CDM cosmological model with km s-1 Mpc-1, and for all calculations. All errors have been given at 1 confidence unless stated otherwise.
The organization of this paper is as follows: Section 2 and 3 describe the observations and data analysis, respectively.
The details of the SED fitting technique are reported in Section 4, while the discovered high- BL Lacs are presented in Section 5. Finally, Section 6 summarizes our results.
2 OBSERVATIONS
2.1 Sample Selection and Observations
Our sample includes 45 BL Lacs without a measured redshift selected from the 3FGL catalog. An approved cycle 13 program222Proposal: 1316180, PI: Dr. A. Kaur with the Neil Gehrels Swift Observatory (Gehrels et al., 2004) allowed us to gather UVOT (UV/Optical Telescope; Roming et al., 2005) data for 8 sources. The rest of the sample has been observed by Swift as Targets of Opportunity (ToO).
All the sources were observed with the SARA (Southeastern Association for Research in Astronomy) consortium’s 0.65 m and 1.0 m telescopes located in Cerro Tololo, Chile (SARA-CT) and the Roque de los Muchachos Observatory in Canary Islands (SARA-ORM), respectively (Keel et al., 2017). The data from the two aforementioned facilities were collected using SDSS , , , and filters. Each source was observed with an exposure time ranging from 30-60 minutes (per filter). The sources were also observed with Swift-UVOT in 6 UV-Optical filters (uvw2, uvm2, uvw1, u, b, v) for 2000 seconds. The combined data from the Swift-UVOT and SARA telescopes provided us 10 filter flux measurements for each source. Details of the observations have been presented in Table 1.
3 Data Analysis
3.1 SARA and Swift-UVOT
Data from the SARA telescopes were obtained using the SDSS filters () and analyzed using the aperture photometry technique with IRAF v2.16 (Tody, 1986). Calibrations for the four optical filters were performed using standard star data in the SDSS Data Release 13 (Albareti et al., 2017) or Landolt Equatorial Standards (Landolt, 2009). Correction for foreground Galactic extinction was performed using E(B-V) from Schlafly & Finkbeiner (2011).
For Swift-UVOT data reduction, we used the standard UVOT pipeline procedure provided by Poole et al. (2008). This process removes bad pixels, flat-fields and corrects for the system response. The UVOT tasks, UVOTIMSUM and UVOTSOURCE using HEASoft (within HEASoft v.6.21333https://heasarc.nasa.gov/lheasoft/) were employed to combine images from multiple observations and extract the magnitude of the sources, respectively. To this end, a circular region of radius (3.5 - 5) was used for source extraction for each object in order to maximize the signal-to-noise ratio. For background subtraction, an annulus of inner radius 8 - 10 and outer radius 20 - 25 was used for each source. The magnitudes obtained were then corrected for Galactic foreground extinction using Table 5 in Kataoka et al. (2008).
3.2 Cross-Calibration and Variability Correction
We follow a similar approach utilized by Rau et al. (2012) in order to calibrate between SARA and Swift-UVOT filter bands. The spectral overlap between SDSS filter (on SARA) and UVOT b filter is used to cross-calibrate the two instruments. This was achieved by assuming that the SED remains unchanged and can be approximated by a power law. We obtained theoretical magnitudes for all filters using the power law templates with spectral indices () between 0.3 and 3.0. The colors obtained by subtracting the magnitudes and b were plotted and fit with a quadratic curve. This provided us with the relationship reported in Eq. 1. The offsets resulting from this equation in the b band were applied to the UVOT filter magnitudes.
| (1) |
Furthermore, blazars are known to be highly variable throughout the electromagnetic spectrum on timescales that can vary from a few minutes to years. This variability can significantly contribute to the uncertainties of the SED constructed using multi-wavelength and non-simultaneous observations from multiple instruments. Both SARA telescopes and Swift-UVOT gather data sequentially in 4 optical and 6 UV-Optical filters, respectively. A systematic uncertainty of mag was applied for each UVOT filter, following Rau et al. (2012), to account for the variability between the exposures of each UVOT filter. We further include an uncertainty of mag for each SARA filter to account for the same. The corrected magnitudes for all the sources were converted to the AB system and have been reported in Table 2.
4 SED Fitting
We have employed the use of the publicly available software LePhare v.2.2 (Arnouts et al., 1999; Ilbert et al., 2006) for measuring photometric redshifts for our sources. This FORTRAN based code performs SED fitting by evaluating the differences between observational data and theoretical models based on the statistic. A set of libraries for stars, galaxies and quasars, provided in the LePhare package were used to fit the data. We employed 60 power-law templates of the form where the value of was chosen to be in the range 0 to 3, in steps of 0.05. This was done under the assumption that the UV-Optical-Near-Infrared regime for BL Lacs can be approximated by a power-law model. A library of galaxies and galaxy/AGN hybrid templates (Salvato et al., 2009, 2011) was also used for the fitting procedure in order to distinguish between a low-redshift galaxy/AGN hybrid and a high- blazar in the photometric redshift solutions. The final library containing stellar templates was also employed for the fitting to check for any false associations (Bohlin et al., 1995; Pickles, 1998; Chabrier et al., 2000).
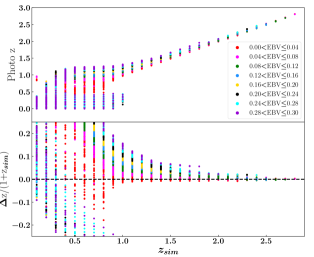
To assess the accuracy of the photometric redshift estimates, we performed simulations using the LePhare package to test power law SEDs with from 0 to 3, for redshifts ranging from to and for reddening, E(B-V), values up to 0.30. For each source, the input magnitudes were extracted from a Gaussian distribution of the model magnitudes taking into account statistical and systematic uncertainties arising from the calibration and variability. The resulting SEDs were fit using LePhare to derive the measured photometric redshifts () with the input values.
As shown in Fig. 1, we found good agreement between the simulated and photo- values for , provided reddening values, E(B-V) within an accuracy of . For all other sources, except those with E(B-V), we can provide a reliable redshift upper limit.
The integral of the probability distribution function, (that describes the probability that the redshift of a source is within of the best fit value) is another criterion employed to estimate the accuracy of this technique. For this work, results with were chosen as reliable photometric redshifts.
5 Results
The results from the SED fits performed for all 45 sources are listed in Table 3. We report here the photometric redshifts, the values, values and the best-fit models for power law and galaxy templates. None of the sources in our sample required a stellar template.
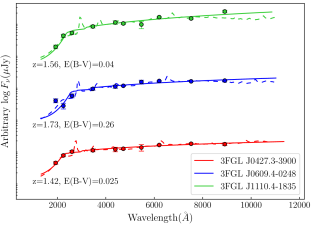
Based on the criteria mentioned in the previous section (, and E(B-V)), we found 3 sources: 3FGL J0427.33900, 3FGL J0609.40248 and 3FGL J1110.41835, at redshifts greater than 1.3, which is consistent with the success rate of 10% for this technique observed in Rau et al. (2012) and Kaur et al. (2017, 2018). The photometric redshifts for these 3 sources were found to be , and , respectively, using the power-law templates. The galaxy library which assumes hybrid QSO templates from Salvato et al. (2009, 2011) yielded values of , and , respectively. But since these sources have been identified as BCU II (3FGL J0427.33900) and BL Lacs (3FGL J0609.40248 and 3FGL J1110.41835) in the 3LAC, the redshifts determined by the galaxy templates with dominant broad emission lines are unlikely. Hence, we base our analysis on the values derived from the power law templates.
In Figure 2, SARA and Swift-UVOT SEDs for these 3 sources are shown. For 17 sources from our sample, 90% photometric redshift upper limits have been provided, while for 9 sources with E(B-V), only the photometry results have been reported. For the remaining 16 sources, no is given as no satisfactory fit () was obtained.
Shaw et al. (2013) reported the optical spectra of the 2 high- BL Lacs found here including the upper limits in their spectroscopic redshift measurements. Both sources exhibit featureless optical spectra typically observed for BL Lacs. The source 3FGL J0609.40248 is reported to have a spectroscopic upper limit of while 3FGL J1110.41835 has an upper limit of , both consistent with our photometric findings.
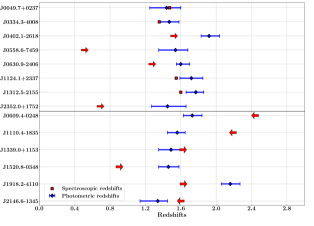
In Figure 3, the redshifts for BL Lacs obtained using the photometric technique have been compared to the available spectroscopic data. In most cases, spectroscopy is only able to place a lower or an upper limit for the redshift. As shown, redshifts obtained by the photometric technique are generally in good agreement with spectroscopic measurements. For 3FGL J1312.5-2155, the authors (Shaw et al., 2013) used a plausible Mg II feature to perform a single line identification in a small allowed redshift range (z 1.6). These data highlight the efficacy of the photometric method for determining the redshifts of high- BL Lacs.
6 Discussion and Conclusions
We report 3 sources with , bringing the total number of high- BL Lac sources to 29. Of these, 16 (55%) were discovered using the photometric dropout technique reported here. Thus, the photometric technique has successfully identified more than of the overall 29 high- BL Lacs known to date.
6.1 Cosmic -ray Horizon
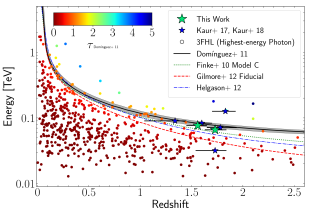
The cosmic -ray horizon (CGRH) provides us an estimate of the redshift at which the Universe becomes opaque to very high energy (VHE) -ray photons due to - pair production with the EBL (Domínguez et al., 2013). Quantifying constraints on the EBL requires sources with photons near or beyond the CGRH. In Figure 4, the CGRH has been plotted as a function of redshift for all the sources from the 3FHL catalog (colored circles; Ajello et al., 2017). The two high- sources we have found here (green stars) have also been included444The highest-energy photon for the source 3FGL J0427.33900 has not been reported in 2FHL/3FHL catalogs. in the plot. The highest-energy photons of the two new sources are at 65.8 GeV (3FGL J0609.40248; =1.73) and 76.6 GeV (3FGL J1110.41835; =1.56), placing them right at the horizon. Thus, with this technique, we are able to locate sources that can be used to constrain the CGRH since they lie at a region where the optical depth, , is between , making them extremely valuable in these studies where redshift data are scarce. Providing a redshift for these sources will enable better and more accurate measurement of the EBL.
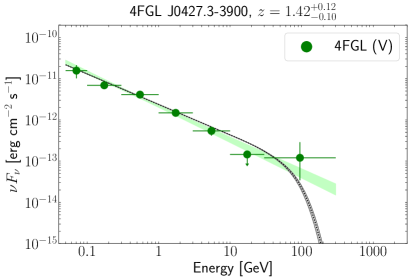
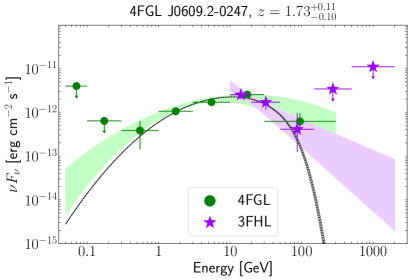
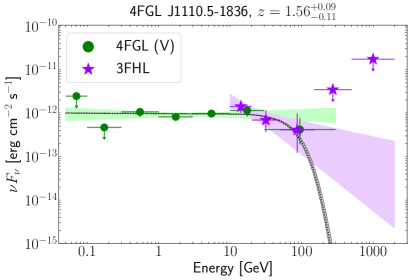
In Figure 5, the -ray SEDs of the 3 high- sources are shown, constructed using data from the 3FHL and 4FGL catalogs (Ajello et al., 2017; The Fermi-LAT collaboration, 2019). Two of these sources were fitted with power law models and one with a log parabola model to improve fit quality. EBL absorption was applied to all the sources by multiplying the spectral model by , where is the optical depth due to the EBL as provided by Domínguez et al. (2011) model. Attenuation due to the EBL is apparent for all sources in the plot. Also apparent is the uncertainty due to the uncertain redshifts on the location of the EBL cutoff.
6.2 The Blazar Sequence and The Fermi Blazar Divide
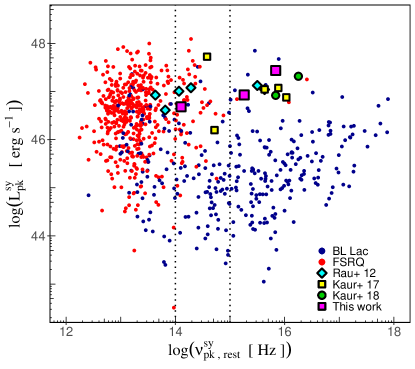
The “blazar sequence”, introduced by Fossati et al. (1998) (and later improved upon by Ghisellini et al., 2017), suggests the existence of an anti-correlation between the synchrotron peak frequency () and the bolometric luminosity in order to provide a unified model for all blazar classes (an alternate view by Giommi et al. (2002); Padovani et al. (2002) suggests this could be a result of a selection effect). It was reported that blazars became redder (shifting towards lower frequencies) with increasing luminosity and at the same time, the Compton Dominance (CD, the ratio between the luminosities of the inverse Compton and synchrotron peaks) also increases.
FSRQs have been typically observed to have high luminosities, low synchrotron peak frequencies (Hz) and CD , whereas BL Lacs are generally less luminous with high synchrotron peak frequencies and CD 1. These BL Lacs were also found to be less luminous in -rays ( erg s-1) and to possess harder spectra () than their FSRQ counterparts on the plane by Ghisellini et al. (2009). This “Fermi Blazar Divide” was inferred as being due to FSRQs having higher accretion rates than BL Lacs. Therefore, according to this sequence, high- BL Lacs that are highly luminous (as FSRQs) and have Hz should not exist.
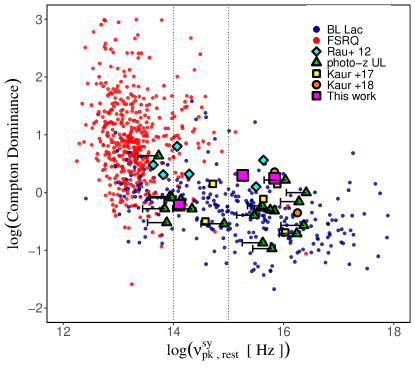
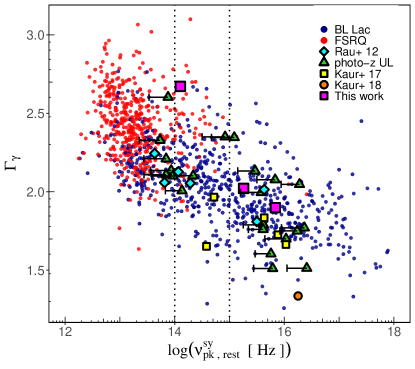
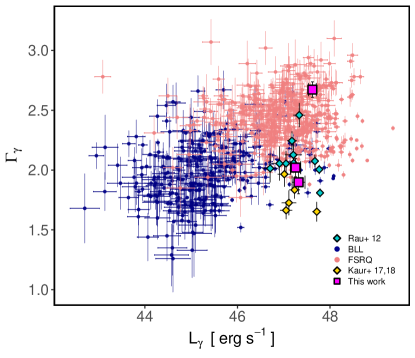
We plot these correlations using blazars from the 3LAC catalog and all the high- sources found so far using the photometric technique. The values for , and the -ray photon index were extracted from the 3LAC catalog and Compton Dominance values were calculated with the help of the online SED tool555https://tools.ssdc.asi.it/. These plots are represented in Figures 6 - 9.
Figure 6 shows that majority of our sources lie in the region where both and are relatively high, in direct contradiction with the blazar sequence. The sources discussed here confirm the previously established anti-correlation of CD with (where CD 1) and have hard -ray spectra, typical of BL Lacs (Figures 7, 8). Two of the three high- BL Lacs detected in this work have hard spectra () and -ray luminosities, erg s-1 (see Figure 9). Even though the of these sources are similar to those seen for FSRQs, the spectral indices are in agreement with those of BL Lacs.
Division based on the mass accretion rates for blazars has been extensively argued by various authors (Ghisellini et al., 2012; Padovani et al., 2012) who propose these candidates to be “masquerading BL Lacs”, i.e. FSRQs whose broad emission lines have been swamped by the relativistic non-thermal continuum and are therefore hidden by the bright synchrotron emission peaking in the UV region. The high synchrotron peak frequencies ( Hz) in these sources imply that the emission region lies further out and suffers less cooling via the external Compton process.
However, this scenario is still being debated since identifying such objects is extremely difficult (Rajagopal et al., 2020). Recently, TXS 0506+056, the first cosmic non-stellar neutrino source reported by the IceCube Collaboration (2018) has been found to be a masquerading BL Lac instead of a BL Lac (see e.g. Padovani et al., 2019).
The average mass for Fermi-LAT detected FSRQs was found to be by Sbarrato et al. (2012) and an average mass of was obtained by Paliya et al. (2017) for radio-loud CGrabs objects (Healey et al., 2008). Considering these as the black hole mass limits for our high- sources, we can obtain the BLR luminosity, , using the relation given by Sbarrato et al. (2012):
| (2) |
yielding erg s-1. Assuming that 10% of the disk luminosity () is reprocessed by the BLR, we obtain erg s-1. Using these values, the ratio between the disk luminosity and the Eddington luminosity (the maximum possible luminosity of a body that can be achieved when there is a balance between radiation force and gravitational force), can be obtained. Found to be in the range , these values are typically observed in case of powerful FSRQs with highly efficient accretion disks. Since the synchrotron peak frequencies of these sources are also observed to be bluer ( Hz), these objects could belong to the elusive class of masquerading BL Lacs.
This and the previous studies employing the photometric technique significantly enlarged the blazar sample in the high , high part of the phase diagram (Figure 6), which provides a powerful diagnostic for this class of blazars. Thus, a small but non-negligible population of high , high sources is starting to emerge. However, the sample size remains small and further studies need to be undertaken in order to draw concrete conclusions.
\startlongtable
| 3FGL | Counterpart | RA J2000 | Dec J2000 | Swift Datea | SARA Datea | |
|---|---|---|---|---|---|---|
| (Name) | (Name) | (hh:mm:ss) | () | (UT) | (UT) | (mag) |
| J0009.10630 | GB6 J00090625 | 00:09:17 | 06:25:54 | 20181222 | 20181208 | 0.17 |
| J0013.23954 | PKS 0010401 | 00:13:00 | 39:54:26 | 20190105 | 20181215 | 0.03 |
| J0019.42021 | PKS0017200 | 00:19:38 | 20:21:45 | 20180920 | 20180930 | 0.16 |
| J0026.74603 | 1RXS J002636.3460101 | 00:26:35 | 46:01:10 | 20181218 | 20181129 | 0.03 |
| J0041.93639 | RX J0042.03641 | 00:42:08 | 36:41:12 | 20190304 | 20181125 | 0.12 |
| J0116.36153 | SUMSS J011619615343 | 01:16:19 | 61:53:43 | 20190124 | 20181129 | 0.05 |
| J0125.42548 | PKS 0122260 | 01:25:19 | 25:49:04 | 20190117 | 20181215 | 0.04 |
| J0133.04413 | SUMSS J013306441422 | 01:33:06 | 44:14:21 | 20181229 | 20181207 | 0.05 |
| J0143.75845 | SUMSS J014347584550 | 01:43:47 | 58:45:51 | 20181207 | 20181125 | 0.05 |
| J0152.87517 | 1RXS J015308.4751756 | 01:53:07 | 75:17:44 | 20190307 | 20181125 | 1.27 |
| J0204.07234 | S5 0159723666The presence of a 4th magnitude star in the field of this AGN prevented UVOT observations. | 02:03:33 | 72:32:53 | 20181125 | 1.79 | |
| J0253.00125 | FBQS J02530124 | 02:53:15 | 01:24:05 | 20190113 | 20181215 | 0.16 |
| J0304.32836 | RBS 0385 | 03:04:16 | 28:32:18 | 20181121 | 20181117 | 0.04 |
| J0316.26436 | SUMSS J031614643732 | 03:16:14 | 64:37:31 | 20190202 | 20181229 | 0.08 |
| J0335.34459 | 1RXS J033514.5445929 | 03:35:14 | 44:59:39 | 20190215 | 20181215 | 0.03 |
| J0359.32612 | PKS 0357264 | 03:59:33 | 26:15:31 | 20181228 | 20181129 | 0.08 |
| J0409.80358 | NVSS J040946040003 | 04:09:46 | 04:00:00 | 20181212 | 20181125 | 0.20 |
| J0427.33900 | PMN J04273900 | 04:27:21 | 39:01:00 | 20171123 | 20181125 | 0.08 |
| J0505.96114 | NVSS J050558611336 | 05:05:58 | 61:13:36 | 20190321 | 20181201 | 1.65 |
| J0529.25917 | 1RXS J052846.9592000 | 05:28:47 | 59:20:00 | 20180328 | 20180401 | 0.06 |
| J0556.04353 | SUMSS J055618435146 | 05:56:18 | 43:51:46 | 20180404 | 20181129 | 0.16 |
| J0609.40248 | NVSS J060915024754 | 06:09:15 | 02:47:54 | 20180411 | 20181125 | 0.80 |
| J0627.91517 | NVSS J062753152003 | 06:27:53 | 15:20:03 | 20171220 | 20171222 | 0.53 |
| J0807.10541 | PKS 080405 | 08:07:09 | 05:41:13 | 20180509 | 20181201 | 0.10 |
| J0958.30318 | 1RXS J095806.4031729 | 09:58:06 | 03:17:38 | 20190407 | 20190327 | 0.09 |
| J1104.30730 | MG1 J1104240730 | 11:04:24 | 07:30:53 | 20180606 | 20180617 | 0.11 |
| J1110.41835 | CRATES J111027.78183552.6 | 11:10:27 | 18:35:52 | 20180419 | 20181229 | 0.12 |
| J1224.68312 | PKS 122182 | 12:24:54 | 83:13:10 | 20180101 | 20180412 | 0.68 |
| J1304.35535 | PMN J13035540 | 13:03:49 | 55:40:31 | 20180215 | 20180320 | 1.13 |
| J1326.65256 | PMN J13265256 | 13:26:49 | 52:56:23 | 20180622 | 20180617 | 1.07 |
| J1353.56640 | 1RXS J135341.1664002 | 13:53:35 | 66:40:06 | 20180622 | 20180828 | 1.48 |
| J1427.63305 | PKS B1424328 | 14:27:41 | 33:05:31 | 20180911 | 20190327 | 0.17 |
| J1440.43845 | 1RXS J144037.4384658 | 14:40:37 | 38:46:53 | 20180518 | 20190327 | 0.25 |
| J1508.74956 | ICRF J150838.9495302 | 15:08:39 | 49:53:02 | 20180201 | 20180412 | 1.00 |
| J1509.92951 | TXS 1507296 | 15:10:09 | 29:51:34 | 20180311 | 20180320 | 0.56 |
| J1525.25905 | PMN J15245903 | 15:24:51 | 59:03:39 | 20180311 | 20180401 | 5.77 |
| J1645.25747 | AT20G J164513575122 | 16:45:13 | 57:51:22 | 20180315 | 20180320 | 0.76 |
| J1745.40754 | TXS 1742078 | 17:42:44 | 07:51:54 | 20180711 | 20180828 | 2.42 |
| J2200.22139 | TXS 2157213 | 22:00:14 | 21:37:57 | 20190408 | 20181125 | 0.27 |
| J2227.80040 | PMN J22270037 | 22:27:57 | 00:37:03 | 20180717 | 20181129 | 0.16 |
| J2247.84413 | NVSS J224753441317 | 22:47:53 | 44:13:15 | 20190223 | 20181125 | 0.65 |
| J2307.41208 | 1RXS J230722.5120520 | 23:07:22 | 12:05:18 | 20181129 | 20181201 | 0.09 |
| J2319.24207 | PKS 2316423 | 23:19:06 | 42:06:48 | 20181104 | 20181129 | 0.05 |
| J2324.70801 | PMN J23240801 | 23:24:45 | 08:02:06 | 20181111 | 20181125 | 0.24 |
| J2357.41716 | RBS 2066 | 23:57:30 | 17:18:03 | 20180708 | 20181115 | 0.06 |
| 3FGL Name | ||||||||||
|---|---|---|---|---|---|---|---|---|---|---|
| J0009.10630 | 20.470.13 | 19.690.05 | 19.810.09 | 19.910.26 | 22.110.24 | 21.660.24 | 21.4 | 21.050.28 | 20.370.31 | 19.4 |
| J0013.23954 | 19.590.10 | 18.730.03 | 18.590.05 | 18.560.10 | 20.680.14 | 20.270.27 | 20.150.18 | 19.440.14 | 19.740.32 | 18.360.26 |
| J0019.42021 | 19.930.03 | 19.070.02 | 18.650.02 | 18.880.04 | 22.1 | 21.7 | 21.3 | 20.8 | 20.1 | 19.2 |
| J0026.74603 | 18.060.03 | 17.520.02 | 17.300.03 | 17.570.07 | 18.430.07 | 18.250.09 | 18.360.11 | 18.120.11 | 18.150.16 | 17.880.23 |
| J0041.93639 | 18.870.02 | 18.450.01 | 18.310.01 | 18.440.02 | 19.670.11 | 19.530.12 | 19.180.15 | 19.400.30 | 18.9 | 18.2 |
| J0116.36153 | 18.830.05 | 18.240.03 | 18.000.04 | 17.710.06 | 19.680.13 | 19.500.15 | 19.330.22 | 19.130.25 | 18.930.26 | 18.3 |
| J0125.42548 | 21.990.57 | 21.240.31 | 19.580.22 | 19.760.28 | 24.4 | 23.9 | 23.3 | 22.8 | 22.1 | 21.4 |
| J0133.04413 | 19.370.05 | 18.410.02 | 17.940.03 | 17.610.05 | 20.550.13 | 20.390.18 | 20.350.19 | 20.320.27 | 19.480.23 | 19.2 |
| J0143.75845 | 17.280.02 | 16.940.01 | 16.870.01 | 16.630.03 | 17.260.07 | 17.250.08 | 17.140.08 | 17.020.08 | 17.340.15 | 16.660.14 |
| J0152.87517 | 17.210.02 | 16.920.01 | 16.860.01 | 17.120.02 | 17.770.30 | 18.060.36 | 17.360.28 | 17.8 | 17.250.29 | 16.710.25 |
| J0204.07234 | 20.460.20 | 18.90.07 | 18.230.05 | 21.572.18 | ||||||
| J0253.00125 | 19.890.13 | 18.870.04 | 17.250.07 | 19.090.25 | 20.650.17 | 20.260.16 | 20.110.19 | 19.720.19 | 19.8 | 18.9 |
| J0304.32836 | 20.310.05 | 18.880.03 | 18.500.04 | 18.470.08 | 21.340.13 | 21.270.16 | 21.270.19 | 20.970.20 | 20.580.24 | 20.2 |
| J0316.26436 | 18.310.31 | 17.800.02 | 17.600.02 | 17.460.05 | 18.470.06 | 18.520.08 | 18.320.07 | 18.340.08 | 18.290.10 | 18.040.16 |
| J0335.34459 | 18.270.03 | 17.620.01 | 15.750.2 | 17.120.04 | 19.100.05 | 18.860.07 | 18.650.07 | 18.440.06 | 18.340.08 | 17.730.09 |
| J0359.32612 | 19.890.20 | 19.810.16 | 19.360.18 | 19.310.37 | 21.9 | 21.4 | 21.1 | 20.7 | 20.0 | 19.1 |
| J0409.80358 | 16.810.02 | 16.170.01 | 16.040.01 | 15.920.02 | 18.110.08 | 17.930.10 | 17.590.09 | 17.430.09 | 16.920.09 | 16.560.12 |
| J0427.33900 | 18.760.07 | 18.460.04 | 18.370.05 | 18.400.11 | 19.860.10 | 19.280.10 | 19.980.10 | 18.880.11 | 18.800.19 | 18.660.28 |
| J0505.96114 | 17.890.03 | 17.480.01 | 17.330.01 | 17.640.03 | 18.1 | 18.3 | 17.9 | 18.2 | 17.9 | 17.7 |
| J0529.25917 | 19.260.08 | 18.770.04 | 18.540.04 | 17.930.05 | 21.4 | 20.5 | 19.9 | 19.6 | 19.3 | 18.8 |
| J0556.04353 | 19.210.13 | 18.870.08 | 18.530.08 | 18.330.14 | 20.510.13 | 20.100.13 | 19.980.17 | 19.830.22 | 19.270.22 | 19.310.34 |
| J0609.40248 | 16.620.04 | 16.240.02 | 16.270.02 | 16.210.03 | 17.780.17 | 18.190.25 | 17.400.16 | 16.860.11 | 16.680.13 | 13.320.16 |
| J0627.91517 | 19.830.12 | 15.070.01 | 18.160.03 | 18.090.06 | 21.890.28 | 21.740.28 | 21.9 | 21.8 | 21.2 | 20.5 |
| J0807.10541 | 17.510.01 | 17.140.01 | 16.930.01 | 16.900.01 | 18.970.07 | 18.990.10 | 18.580.08 | 18.110.09 | 17.570.09 | 17.770.17 |
| J0958.30318 | 19.500.06 | 19.320.05 | 18.780.06 | 18.140.09 | 19.790.10 | 19.640.14 | 19.530.13 | 19.630.17 | 19.390.25 | 19.0 |
| J1104.30730 | 19.180.04 | 18.700.03 | 18.280.04 | 18.080.07 | 19.990.17 | 19.740.16 | 19.850.19 | |||
| J1110.41835 | 18.910.08 | 18.410.04 | 18.520.06 | 17.970.10 | 20.730.15 | 19.860.13 | 19.640.12 | 19.140.12 | 18.820.15 | 18.980.33 |
| J1224.68312 | 22.761.08 | 21.260.23 | 20.230.13 | 19.590.21 | 23.3 | 22.9 | 22.9 | 22.7 | 22.1 | 21.5 |
| J1304.35535 | 18.760.10 | 18.400.06 | 18.100.06 | 17.720.06 | 19.7 | 19.6 | 19.6 | 19.7 | 18.820.23 | 18.570.29 |
| J1326.65256 | 16.010.01 | 15.430.01 | 14.650.01 | 14.660.01 | 15.720.20 | 16.110.17 | 16.790.21 | 17.030.27 | 16.3 | 17.670.36 |
| J1353.56640 | 17.660.14 | 17.180.06 | 16.830.06 | 16.310.13 | 19.0 | 19.2 | 18.620.27 | 18.220.14 | 17.740.13 | 17.690.17 |
| J1427.63305 | 16.70.01 | 16.260.01 | 15.880.01 | 15.430.01 | 18.090.15 | 17.720.15 | 17.440.16 | 17.290.21 | 16.540.21 | 16.3 |
| J1440.43845 | 17.330.04 | 17.020.03 | 16.650.07 | 16.400.14 | 17.760.07 | 17.690.09 | 17.550.09 | 17.450.09 | 17.050.10 | 16.830.16 |
| J1508.74956 | 19.520.06 | 17.380.03 | 18.640.05 | 18.390.09 | 19.7 | 19.4 | 19.5 | 19.4 | 18.620.27 | 18.2 |
| J1509.92951 | 20.070.18 | 19.830.12 | 19.930.17 | 19.100.22 | 21.3 | 20.9 | 21.0 | 20.7 | 20.1 | 19.5 |
| J1525.25905 | 15.880.19 | 16.130.15 | 15.710.10 | |||||||
| J1645.25747 | 15.030.07 | 14.630.04 | 14.590.05 | 14.750.11 | 18.710.29 | 18.8 | 17.690.18 | 18.470.16 | 15.100.05 | 16.270.07 |
| J1745.40754 | 20.763.56 | 18.440.19 | 17.970.14 | 17.640.27 | 20.2 | 20.6 | 20.7 | 21.1 | 21.3 | 21.4 |
| J2200.22139 | 17.560.01 | 17.070.01 | 16.830.01 | 16.930.01 | 19.350.17 | 19.080.19 | 18.580.16 | 18.390.19 | 17.640.19 | 17.220.28 |
| J2227.80040 | 18.970.07 | 18.250.03 | 17.820.04 | 17.800.08 | 21.050.29 | 20.450.28 | 20.060.25 | 18.6 | 19.100.28 | 19.390.21 |
| J2247.84413 | 17.500.01 | 16.800.01 | 16.690.01 | 16.900.01 | 18.550.05 | 18.940.12 | 18.240.09 | 17.990.08 | 17.620.09 | 17.420.15 |
| J2307.41208 | 19.420.01 | 19.120.01 | 18.880.02 | 18.930.04 | 19.960.09 | 19.970.13 | 19.850.16 | 19.880.21 | 19.460.26 | 19.1 |
| J2319.24207 | 16.160.01 | 15.050.01 | 14.590.01 | 14.600.01 | 18.960.08 | 18.990.12 | 18.350.09 | 15.420.05 | 16.360.05 | 17.660.07 |
| J2324.70801 | 17.960.04 | 17.290.02 | 17.020.02 | 16.870.04 | 19.100.10 | 19.200.14 | 18.900.10 | 17.900.20 | 18.080.12 | 18.430.10 |
| J2357.41716 | 17.800.01 | 17.290.01 | 16.990.01 | 17.190.03 | 18.280.07 | 18.270.10 | 18.200.08 | 17.820.18 | 17.880.10 | 18.020.02 |
| 3FGL Name | Power Law Template | Galaxy Template | |||||||
|---|---|---|---|---|---|---|---|---|---|
| P | P | Model | |||||||
| Sources with confirmed photometric redshifts | |||||||||
| J0427.33900 | 2.7 | 95.0 | 0.50 | 2.1 | 89.6 | pl_I22491_20_TQSO1_80.sed | |||
| J0609.40248 | 10.2 | 95.1 | 0.60 | 7.5 | 99.3 | pl_QSOH_template_norm.sed | |||
| J1110.41835 | 9.0 | 95.8 | 0.90 | 14.2 | 97.4 | pl_QSOH_template_norm.sed | |||
| Sources with photometric redshift upper limits | |||||||||
| J0009.10630 | 1.53 | 11.0 | 41.0 | 1.35 | 8.3 | 83.4 | CB1_0_LOIII4.sed | ||
| J0013.23954 | 1.29 | 17.1 | 32.7 | 1.25 | 21.5 | 79.5 | I22491_90_TQSO1_10.sed | ||
| J0019.42021 | 4.00 | 3.6 | 88.7 | 2.45 | 24.4 | 93.5 | S0_90_QSO2_10.sed | ||
| J0026.74603 | 0.96 | 14.8 | 24.8 | 0.65 | 9.17 | 27.2 | pl_TQSO1_template_norm.sed | ||
| J0041.93639 | 0.83 | 10.1 | 16.5 | 0.90 | 6.9 | 58.2 | pl_I22491_20_TQSO1_80.sed | ||
| J0116.36153 | 1.23 | 5.2 | 24.1 | 1.20 | 2.56 | 79.4 | I22491_80_TQSO1_20.sed | ||
| J0125.42548 | 4.00 | 6.1 | 100.0 | 2.00 | 3.6 | 37.7 | S0_30_QSO2_70.sed | ||
| J0133.04413 | 126.6 | 57.5 | 0.85 | 20.2 | 100.0 | M82_template_norm.sed | |||
| J0143.75845 | 1.18 | 16.9 | 25.8 | 0.30 | 14.3 | 58.7 | pl_QSO_DR2_029_t0.spec | ||
| J0253.00125 | 100.6 | 27.5 | 0.40 | 61.0 | 63.0 | CB1_0_LOIII4.sed | |||
| J0304.32836 | 154.4 | 39.0 | 0.75 | 51.6 | 100.0 | CB1_0_LOIII4.sed | |||
| J0316.26436 | 1.10 | 17.2 | 28.0 | 0.65 | 16.9 | 73.4 | pl_QSO_DR2_029_t0.spec | ||
| J0335.34459 | 84.0 | 26.0 | 1.20 | 79.6 | 75.3 | I22491_70_TQSO1_30.sed | |||
| J0359.32612 | 3.08 | 0.79 | 27.2 | 1.15 | 0.31 | 12.3 | CB1_0_LOIII4.sed | ||
| J0409.80358 | 75.6 | 26.1 | 1.40 | 8.8 | 87.8 | I22491_80_TQSO1_20.sed | |||
| J0529.25917 | 1.55 | 6.6 | 61.9 | 1.55 | 8.5 | 96.4 | Spi4_template_norm.sed | ||
| J0556.04353 | 1.25 | 2.9 | 31.4 | 1.20 | 5.2 | 73.4 | I22491_70_TQSO1_30.sed | ||
| J0627.91517 | 173.1 | 82.5 | S0_template_norm.sed | ||||||
| J0807.10541 | 1.24 | 15.3 | 32.3 | 1.35 | 15.6 | 99.6 | I22491_80_TQSO1_20.sed | ||
| J0958.30318 | 27.1 | 23.0 | 0.60 | 8.4 | 91.3 | I22491_70_TQSO1_30.sed | |||
| J1104.30730 | |||||||||
| J1224.68312 | 4.00 | 3.1 | 98.5 | 2.0 | 0.01 | 26.2 | S0_30_QSO2_70.sed | ||
| J1427.63305 | 1.15 | 5.5 | 25.3 | 1.55 | 11.8 | 78.0 | I22491_90_TQSO1_10.sed | ||
| J1440.43845 | 0.98 | 9.4 | 22.2 | 0.70 | 6.2 | 37.9 | pl_I22491_20_TQSO1_80.sed | ||
| J1509.92951 | 3.45 | 1.9 | 40.7 | 0.30 | 0.6 | 43.7 | M82_template_norm.sed | ||
| J1645.25747 | 417.7 | 98.4 | 3.00 | 390.1 | 95.2 | S0_template_norm.sed | |||
| J2200.22139 | 1.64 | 14.1 | 71.2 | 1.20 | 11.6 | 97.8 | Spi4_template_norm.sed | ||
| J2227.80040 | 1.55 | 5.2 | 51.4 | 1.75 | 23.0 | 67.5 | Mrk231_template_norm.sed | ||
| J2247.84413 | 31.2 | 32.4 | 1.25 | 28.2 | 92.6 | I22491_70_TQSO1_30.sed | |||
| J2307.41208 | 0.99 | 4.0 | 9.8 | 0.75 | 3.1 | 22.4 | pl_I22491_10_TQSO1_90.sed | ||
| J2319.24207 | 172.0 | 99.9 | 3.00 | 16.1 | 100.0 | Sey2_template_norm.sed | |||
| J2324.70801 | 0.97 | 8.4 | 14.5 | 1.50 | 11.6 | 64.6 | I22491_80_TQSO1_20.sed | ||
| J2357.41716 | 0.89 | 15.2 | 26.6 | 0.80 | 8.7 | 20.2 | pl_I22491_20_TQSO1_80.sed | ||
References
- Abdo et al. (2010) Abdo, A. A., Ackermann, M., Ajello, M., et al. 2010, ApJ, 723, 1082
- Acero et al. (2015) Acero, F., Ackermann, M., Ajello, M., et al. 2015, ApJS, 218, 23
- Ackermann et al. (2011) Ackermann, M., Ajello, M., Allafort, A., et al. 2011, ApJ, 743, 171
- Ackermann et al. (2012) Ackermann, M., Ajello, M., Allafort, A., et al. 2012, Science, 338, 1190
- Ackermann et al. (2015) Ackermann, M., Ajello, M., Atwood, W. B., et al. 2015, ApJ, 810, 14
- Aharonian et al. (2006) Aharonian, F., Akhperjanian, A. G., Bazer-Bachi, A. R., et al. 2006, Nature, 440, 1018
- Ajello et al. (2017) Ajello, M., Atwood, W. B., Baldini, L., et al. 2017, ApJS, 232, 18
- Albareti et al. (2017) Albareti, F. D., Allende Prieto, C., Almeida, A., et al. 2017, ApJS, 233, 25
- Arnouts et al. (1999) Arnouts, S., Cristiani, S., Moscardini, L., et al. 1999, MNRAS, 310, 540
- Bohlin et al. (1995) Bohlin, R. C., Colina, L., & Finley, D. S. 1995, The Astronomical Journal, 110, 1316
- Chabrier et al. (2000) Chabrier, G., Baraffe, I., Allard, F., & Hauschildt, P. 2000, ApJ, 542, 464
- Dermer et al. (1997) Dermer, C. D., Sturner, S. J., & Schlickeiser, R. 1997, ApJS, 109, 103
- Domínguez & Ajello (2015) Domínguez, A., & Ajello, M. 2015, ApJ, 813, L34
- Domínguez et al. (2013) Domínguez, A., Finke, J. D., Prada, F., et al. 2013, ApJ, 770, 77
- Domínguez & Prada (2013) Domínguez, A., & Prada, F. 2013, ApJ, 771, L34
- Domínguez et al. (2011) Domínguez, A., Primack, J. R., Rosario, D. J., et al. 2011, MNRAS, 410, 2556
- Domínguez et al. (2019) Domínguez, A., Wojtak, R., Finke, J., et al. 2019, ApJ, 885, 137
- Finke et al. (2010) Finke, J. D., Razzaque, S., & Dermer, C. D. 2010, ApJ, 712, 238
- Fossati et al. (1998) Fossati, G., Celotti, A., Ghisellini, G., Maraschi, L., & Comastri, A. 1998, MNRAS, 299, 433
- Gehrels et al. (2004) Gehrels, N., Chincarini, G., Giommi, P., et al. 2004, The Astrophysical Journal, 611, 1005
- Ghisellini & Madau (1996) Ghisellini, G., & Madau, P. 1996, MNRAS, 280, 67
- Ghisellini et al. (1996) Ghisellini, G., Maraschi, L., & Dondi, L. 1996, Astronomy and Astrophysics Supplement Series, 120, 503
- Ghisellini et al. (2009) Ghisellini, G., Maraschi, L., & Tavecchio, F. 2009, Monthly Notices of the Royal Astronomical Society: Letters, 396, L105
- Ghisellini et al. (2017) Ghisellini, G., Righi, C., Costamante, L., & Tavecchio, F. 2017, MNRAS, 469, 255
- Ghisellini et al. (2012) Ghisellini, G., Tavecchio, F., Foschini, L., et al. 2012, MNRAS, 425, 1371
- Gilmore et al. (2012) Gilmore, R. C., Somerville, R. S., Primack, J. R., & Domínguez, A. 2012, MNRAS, 422, 3189
- Giommi et al. (2002) Giommi, P., Padovani, P., Perri, M., Landt, H., & Perlman, E. 2002, arXiv:astro-ph/0209621
- Hauser & Dwek (2001) Hauser, M. G., & Dwek, E. 2001, ARA&A, 39, 249
- Healey et al. (2008) Healey, S. E., Romani, R. W., Cotter, G., et al. 2008, ApJS, 175, 97
- Helgason & Kashlinsky (2012) Helgason, K., & Kashlinsky, A. 2012, The Astrophysical Journal Letters, Volume 758, Issue 1, article id. L13, 6 pp. (2012)., 758, arXiv:1208.4364
- IceCube Collaboration (2018) IceCube Collaboration. 2018, Science, 361, 147
- Ilbert et al. (2006) Ilbert, O., Arnouts, S., McCracken, H. J., et al. 2006, A&A, 457, 841
- Kataoka et al. (2008) Kataoka, J., Madejski, G., Sikora, M., et al. 2008, ApJ, 672, 787
- Kaur et al. (2018) Kaur, A., Rau, A., Ajello, M., et al. 2018, ApJ, 859, 80
- Kaur et al. (2017) —. 2017, ApJ, 834, 41
- Keel et al. (2017) Keel, W. C., Oswalt, T., Mack, P., et al. 2017, PASP, 129, 015002
- Landolt (2009) Landolt, A. U. 2009, The Astronomical Journal, 137, 4186
- Maraschi et al. (1994) Maraschi, L., Ghisellini, G., & Celotti, A. 1994, IAU Symposium No. 159: Multi-wavelength continuum emission of AGN
- Padovani et al. (2002) Padovani, P., Costamante, L., Ghisellini, G., Giommi, P., & Perlman, E. 2002, ApJ, 581, 895
- Padovani & Giommi (1995) Padovani, P., & Giommi, P. 1995, ApJ, 444, 567
- Padovani et al. (2012) Padovani, P., Giommi, P., & Rau, A. 2012, Monthly Notices of the Royal Astronomical Society: Letters, 422, L48
- Padovani et al. (2019) Padovani, P., Oikonomou, F., Petropoulou, M., Giommi, P., & Resconi, E. 2019, Monthly Notices of the Royal Astronomical Society: Letters, 484, L104
- Paliya et al. (2017) Paliya, V. S., Marcotulli, L., Ajello, M., et al. 2017, ApJ, 851, 33
- Pickles (1998) Pickles, A. J. 1998, Publications of the Astronomical Society of the Pacific, 110, 863
- Poole et al. (2008) Poole, T. S., Breeveld, A. A., Page, M. J., et al. 2008, MNRAS, 383, 627
- Rajagopal et al. (2020) Rajagopal, M., Marcotulli, L., Ajello, M., et al. 2020, The Astrophysical Journal, 889, 102
- Rau et al. (2012) Rau, A., Schady, P., Greiner, J., et al. 2012, A&A, 538, A26
- Roming et al. (2005) Roming, P. W. A., Kennedy, T. E., Mason, K. O., et al. 2005, SSRv, 120, 95
- Salvato et al. (2009) Salvato, M., Hasinger, G., Ilbert, O., et al. 2009, ApJ, 690, 1250
- Salvato et al. (2011) Salvato, M., Ilbert, O., Hasinger, G., et al. 2011, ApJ, 742, 61
- Sbarrato et al. (2012) Sbarrato, T., Ghisellini, G., Maraschi, L., & Colpi, M. 2012, Monthly Notices of the Royal Astronomical Society, 421, 1764
- Schlafly & Finkbeiner (2011) Schlafly, E. F., & Finkbeiner, D. P. 2011, ApJ, 737, 103
- Shaw et al. (2013) Shaw, M. S., Romani, R. W., Cotter, G., et al. 2013, The Astrophysical Journal, 764, 135
- Sikora et al. (1994) Sikora, M., Begelman, M. C., & Rees, M. J. 1994, ApJ, 421, 153
- Stecker et al. (1992) Stecker, F. W., de Jager, O. C., & Salamon, M. H. 1992, ApJ, 390, L49
- The Fermi-LAT Collaboration (2018) The Fermi-LAT Collaboration. 2018, Science, 362, 1031
- The Fermi-LAT collaboration (2019) The Fermi-LAT collaboration. 2019, arXiv e-prints, arXiv:1902.10045
- Tody (1986) Tody, D. 1986, Proc. SPIE, 0627, 733
- Urry & Padovani (1995) Urry, C. M., & Padovani, P. 1995, PASP, 107, 803