Magnetic phase diagram and magneto-elastic coupling of NiTiO3
Abstract
We report high-resolution dilatometry on high-quality single crystals of NiTiO3 grown by means of the optical floating-zone technique. The anisotropic magnetic phase diagram is constructed from thermal expansion and magnetostriction studies up to T and magnetisation studies in static (15 T) and pulsed (60 T) magnetic fields. Our data allow to quantitatively study magneto-elastic coupling and to determine uniaxial pressure dependencies. While the entropy changes are found to be of magnetic nature, Grüneisen analysis implies only one relevant energy scale in the whole low temperature regime. Thereby, our data suggest that the observed structural changes due to magneto-elastic coupling and previously reported magnetodielectric coupling Harada et al. (2016) are driven by the same degrees of freedom that lead to long-range magnetic order in NiTiO3, which, in turn, establishes a linear magnetodielectric coupling in this compound.
I Introduction
The search for new multiferroics, i.e., materials concomitantly exhibiting various ferroic orders such as magnetic and electric order coupled to each other Spaldin and Fiebig (2005), has revived interest in the family of ilmenite-structured compounds. There are various titanates TiO3 ( = Mn, Fe, Co, Ni) which crystallize in the ilmenite structure within the space group -3. The crystal structure consists of alternate layers of corner sharing TiO6 and O6 octahedra stacked along the -axis Barth and E. (1934). Previous magnetic Stickler et al. (1967); Watanabe et al. (1980); Heller et al. (1963) and powder neutron diffraction studies Shirane et al. (1959); Newnham et al. (1964); Y. et al. (1986); Charilaou et al. (2012) report that long range antiferromagnetic (AFM) order evolving at low temperatures is of the G-type for MnTiO3, and of the A-type for FeTiO3, CoTiO3 and NiTiO3. In the ordered phase, the magnetic moments associated with -ions are collinearly arranged along the -axis in MnTiO3 and with a slight spin tilting of 1.6 ° away from the -axis in FeTiO3. The easy-plane-type AFM order in CoTiO3 and NiTiO3 is characterised by spins lying in the ferromagnetic -layers which are aligned antiferromagnetically along . In FeTiO3, the onset of long range magnetic order, at , is associated with significant changes of the lattice parameters indicating magneto-elastic coupling Charilaou et al. (2012). Magnetodielectric and polarization measurements on MnTiO3 show an anomaly in the dielectric permittivity, , at , while finite polarisation is found in applied external magnetic fields indicating that it may realise a linear magnetoelectric material Mufti et al. (2011). Both in CoTiO3 and NiTiO3, anomalies in at and a strong field dependant magnetocapacitance in the ordered state indicate the presence of large magneto-dielectric coupling Harada et al. (2016).
Despite clear evidence of pronounced magneto-dielectric coupling in all known TiO3, its origin and mechanism have not yet been elucidated. In order to address this question, we have grown sizeable, high-quality single crystals of NiTiO3 by means of the optical floating-zone technique under various atmospheres and at different pressure. The single crystals were used for high-resolution studies of thermal expansion and magnetostriction along the crystallographic - and -axis, respectively. In addition, comparing the magnetic length and entropy changes as detected by thermal expansion coefficients and specific heat allow determining the uniaxial pressure dependencies by means of Grüneisen scaling. Moreover, these results as well as magnetisation studies in static (15 T) and pulsed (60 T) magnetic fields give access to the anisotropic phase diagram in NiTiO3.
II Experimental methods
NiTiO3 powder was prepared via standard solid-state reaction of stoichiometric amounts of NiO and TiO2 between 1150 and 1350 °C with several intermediate grinding steps. The powder was made into rods of length 10 cm and 5 mm in diameter by hydrostatically pressing the powders at 700 bar and annealing them for 24 h at 1350 °C. Single crystals of NiTiO3 were grown in a four-mirror optical floating-zone furnace (Crystal system corporation, Japan) equipped with W halogen lamps at IISER Pune and in a two mirror high-pressure optical floating-zone furnace (HKZ, SciDre) equipped with a 3500 W Xe arc lamp at Heidelberg University. Macroscopic single crystals were grown at 3 mm/h under various atmospheres and up to 5 bar pressure. Phase purity of the powder and the ground single crystals was studied by means of powder X-ray diffraction measurements on a Bruker D8 Advance ECO diffractometer with Cu-K source. Laue diffraction in back scattering geometry was performed to study the crystallinity and to orient the single crystals. Structural Rietveld refinements were carried out using the Full Prof suite 2.0Rodríguez-Carvajal (1993).
Static magnetisation was studied in magnetic fields up to 15 T applied along the principal crystallographic axes by means of a home-built vibrating sample magnetometer Klingeler et al. (2006) (VSM) and in fields up to 5 T in a Quantum Design MPMS-XL5 SQUID magnetometer. Pulsed-magnetic-field magnetization was studied up to 60 T at Helmholtz Zentrum Dresden Rossendorf by an induction method using a coaxial pick-up coil system Skourski et al. (2011). The pulse raising time was 7 ms. The pulsed-field magnetization data were calibrated using static magnetic field measurements. Specific heat measurements at 0 T and 9 T has been done in a Quantum Design PPMS using a relaxation method. The relative length changes were studied on a cuboid shaped single crystal of dimensions mm3. The measurements were done by means of a three-terminal high-resolution capacitance dilatometer Küchler et al. (2012). In order to investigate the effect of magnetic fields, the linear thermal expansion coefficient was studied in magnetic fields up to 15 T. In addition, the field induced length changes were measured at various fixed temperatures in magnetic fields up to 15 T and the longitudinal magnetostriction coefficient was derived. The magnetic field was applied along the direction of the measured length changes.
III NiTiO3 single crystal growth
Single crystals of NiTiO3 were grown by the optical floating-zone method using polycrstalline feed and seed rods as starting material. The phase purity of the NiTiO3 powders used for making the feed and seed rods has been studied by means of powder XRD after each sintering step. Rietveld refinement of these data indicates the presence of ilmenite phase (-3) as well as an additional (1%) TiO2 (rutile) phase. In order to achieve phase pure high-quality single crystals, a variety of crystal growth experiments were performed under different atmosphere and pressure and by means of both the four-mirror (CSC, horizontal configuration) and two-mirror (HKZ, vertical configuration) Hergett et al. (2019); Neef et al. (2017); Wizent et al. (2009, 2011, 2014) high-pressure optical floating-zone furnaces. The optimized growth parameters employed during crystal growth are listed in Table 1.
| furnace | CSC | CSC | HKZ |
|---|---|---|---|
| atmosphere | O2 | air | Ar |
| pressure | ambient | ambient | 5 bar |
| growth rate (rpm) | 3 | 3 | 4-6 |
| rotation speed (mm/h) | 20 | 10 | 15 |
| latt. parameter (Å) | 5.0304 | 5.0304 | 5.0304 |
| latt. parameter (Å) | 13.7881 | 13.7845 | 13.7862 |
| crystal size | cm | cm | mm |
| secondary phase (appr.) | 1% TiO2+NiO | 1% TiO2 | 1% NiO |
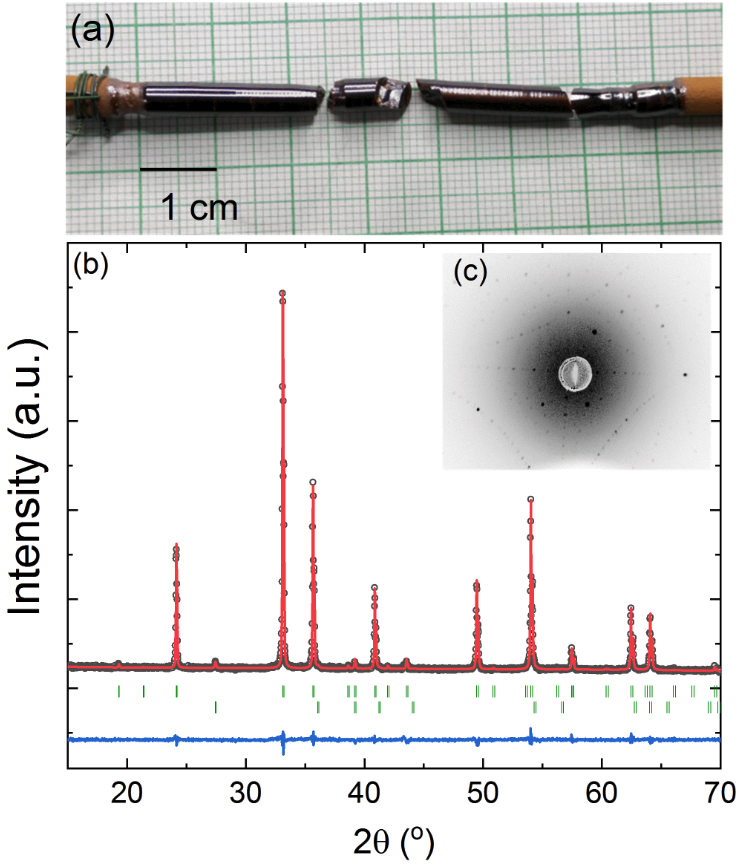
Depending on the growth parameters, the processes summarized in Table 1 yield mm- to cm-sized single crystals. Fig. 1a shows a representative NiTiO3 boule grown in air at ambient pressure. The shiny surface of the grown boule indicating the presence of single crystal of several cm in length. Rietveld refinement of powder XRD data of the ground and pulverized single crystalline pieces extracted from the boules (see Fig. 1b and Table 1) implies the main ilmenite phase as well as an impurity TiO2 phase of about 1 %. When grown in O2 atmosphere, there is also an additional NiO phase. In order to further investigate the growth process of NiTiO3 and to reduce the secondary phase content, NiTiO3 was also grown under 5 bar pressure in Ar atmosphere. In this case, the resulting boule is mostly of polycrystalline nature with only mm-sized shiny single crystalline regions towards the end of the boule. Phase analysis of a single crystalline piece extracted from this region shows the presence of about 1 % NiO secondary phase while the TiO2 phase is absent. We conclude that inert atmosphere does not support optical floating-zone-growth of NiTiO3 single crystals. For the magnetic studies presented below, we employ crystals grown in air as they exhibit only a small non-magnetic impurity phase. Laue diffraction performed at several spots along the length of grown boules confirm the presence of macroscopic cm-sized single crystalline grains with high crystallinity (see Fig. 1c). For the measurements reported below, a cuboid shaped single crystal of dimensions mm3 has been extracted from the boule grown in air and oriented along three principal crystallographic directions.
IV Experimental results
IV.1 Magneto-elastic coupling
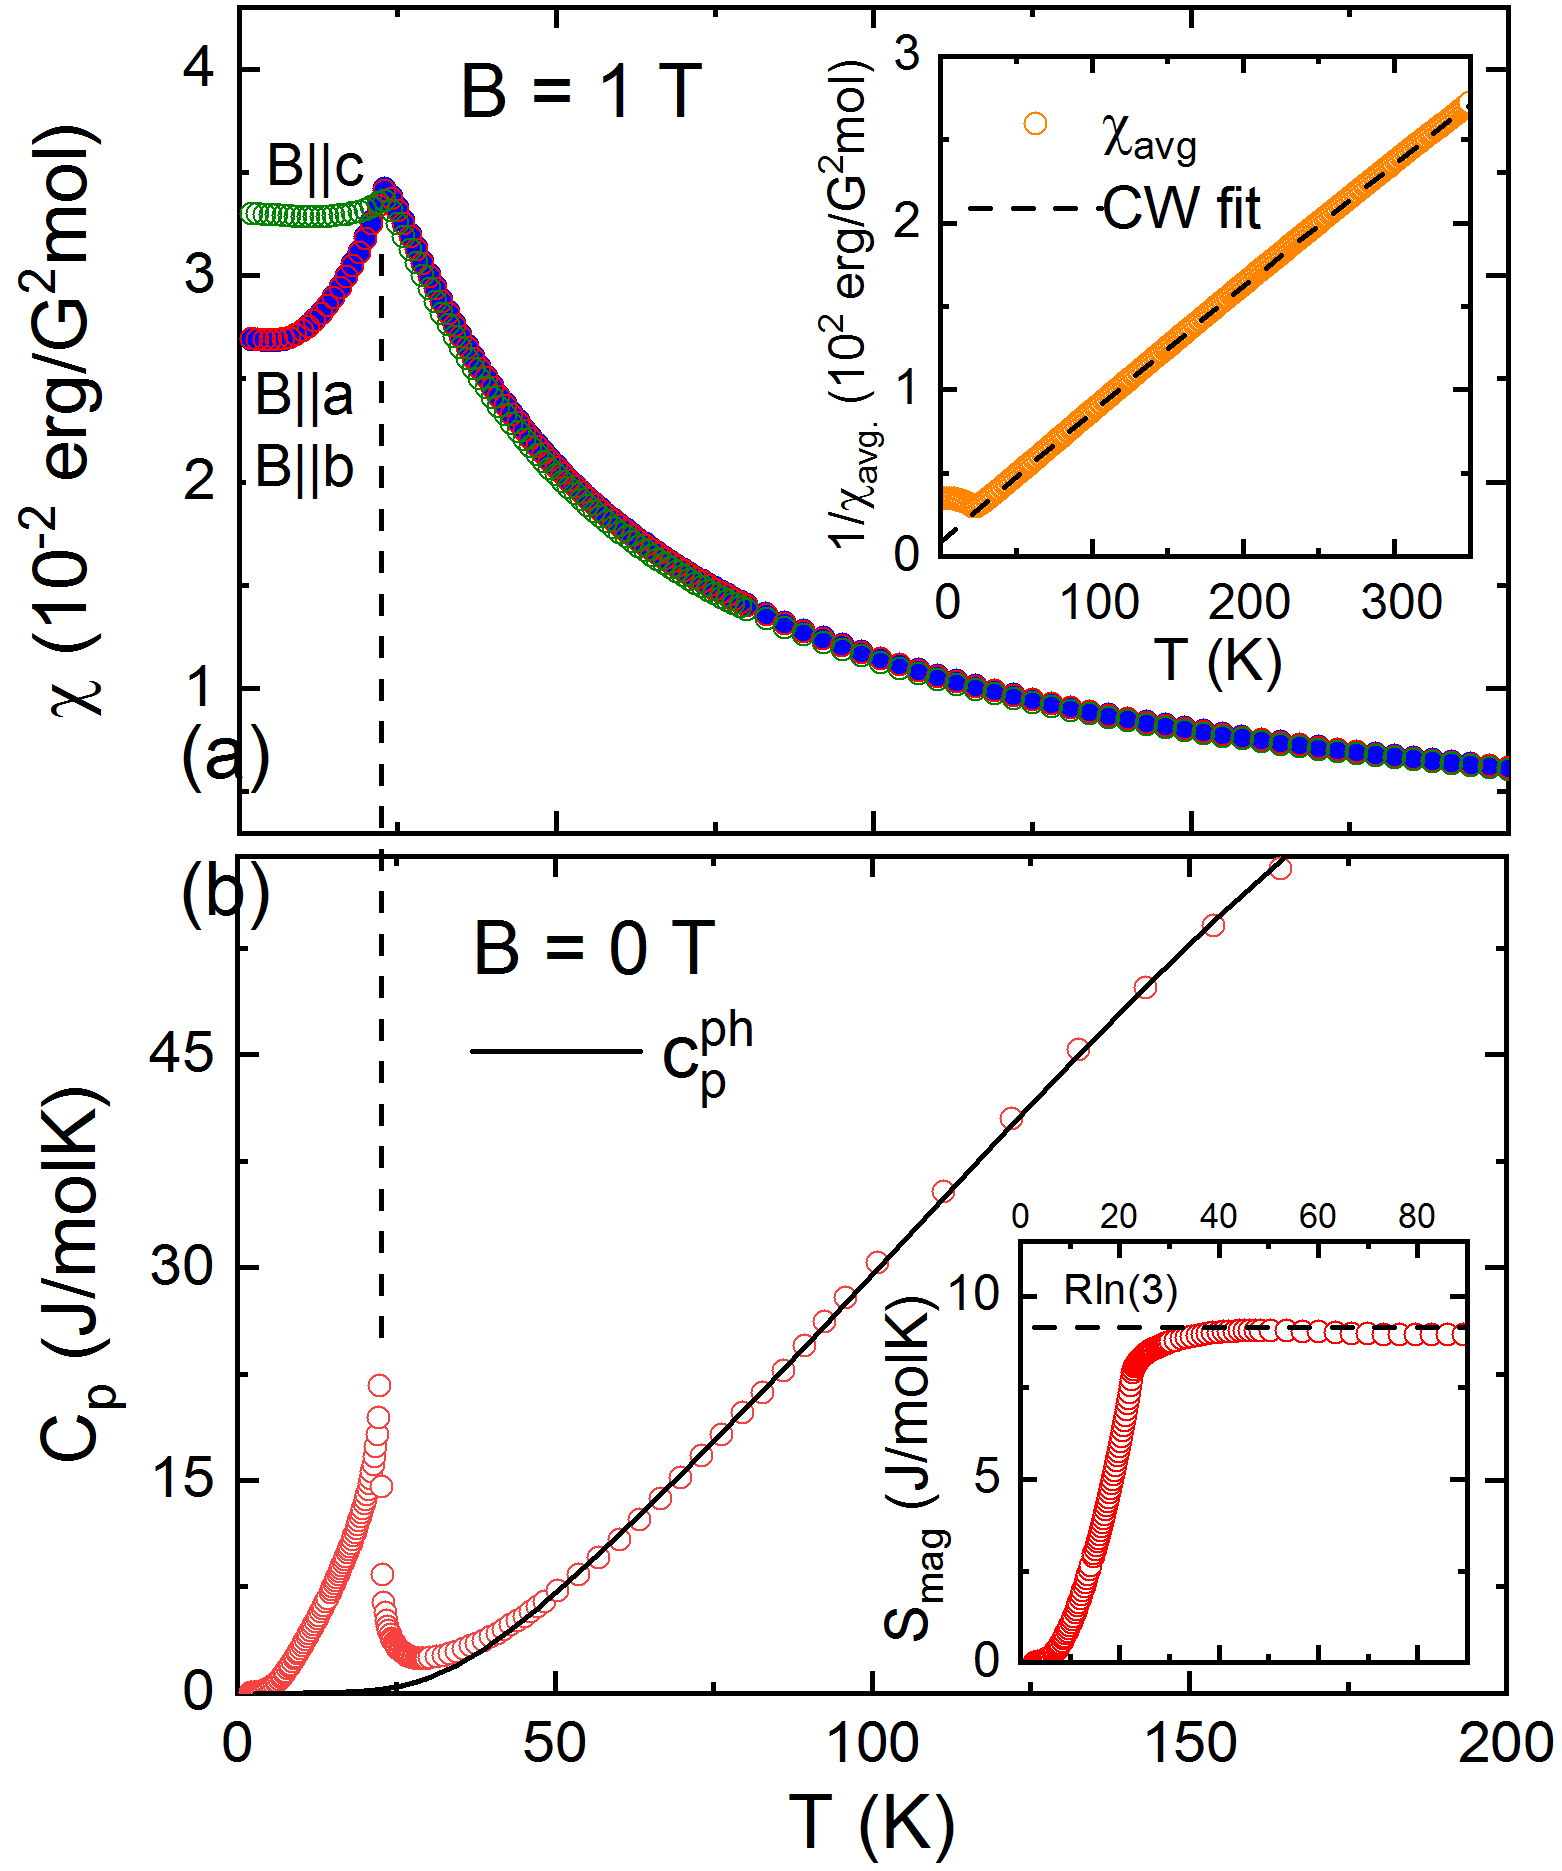
The onset of long range antiferromagnetic order in NiTiO3 at = 22.5(5) K is associated with pronounced anomalies in magnetic susceptibility and specific heat (Fig. 2). For , the susceptibility is anisotropic with a decrease for magnetic fields applied in the -plane and attaining a constant value for -axis suggesting an easy-plane-type antiferromagnet. This is in accordance with the previous studies Shirane et al. (1959); Watanabe et al. (1980). At high temperatures, the susceptibility is isotropic and obeys a Curie-Weiss behaviour. Fitting the averaged susceptibility (inset to Fig. 2a) at K by means of a Curie-Weiss-like law yields , the effective magnetic moment and the Weiss temperature K. Using the spin-only value for Ni2+, implies an effective -factor of . Note, that our measurements yield a smaller value than = previously reported for a single crystal Watanabe et al. (1980) but is similar to the values reported for polycrystalline samples Stickler et al. (1967); Harada et al. (2016).
The sharp -shaped anomaly in the specific heat (Fig. 2b) confirms the onset of long-range magnetic order at and also indicates high crystallinity of the single crystal. Furthermore, the anomaly presents a continuous nature of the phase transition. The phonon contribution to the specific heat () has been estimated by fitting the data at temperatures well above by an extended Debye-model which includes both Debye- and Einstein-terms Aschcroft and Mermin (1976). The model fits very well for temperatures above about 50 K and yields characteristic Debye- and Einstein-temperatures of K and K, respectively. The sum of the obtained coefficients of the individual terms and reasonably agrees to the expected value of 5 which reflects the number of phonon modes given by the number of atoms per formula unit. Integrating the magnetic specific heat (-)/ yields a total magnetic entropy change J/(mol K) which agrees to the theoretically expected value for Ni2+ spins of J/(mol K). We conclude that the entropy changes are of magnetic nature. The measured entropy changes imply that nearly 20% of magnetic entropy is consumed between and 50 K, suggesting the presence of short-range magnetic correlation persisting up to temperatures as high as twice the ordering temperature.
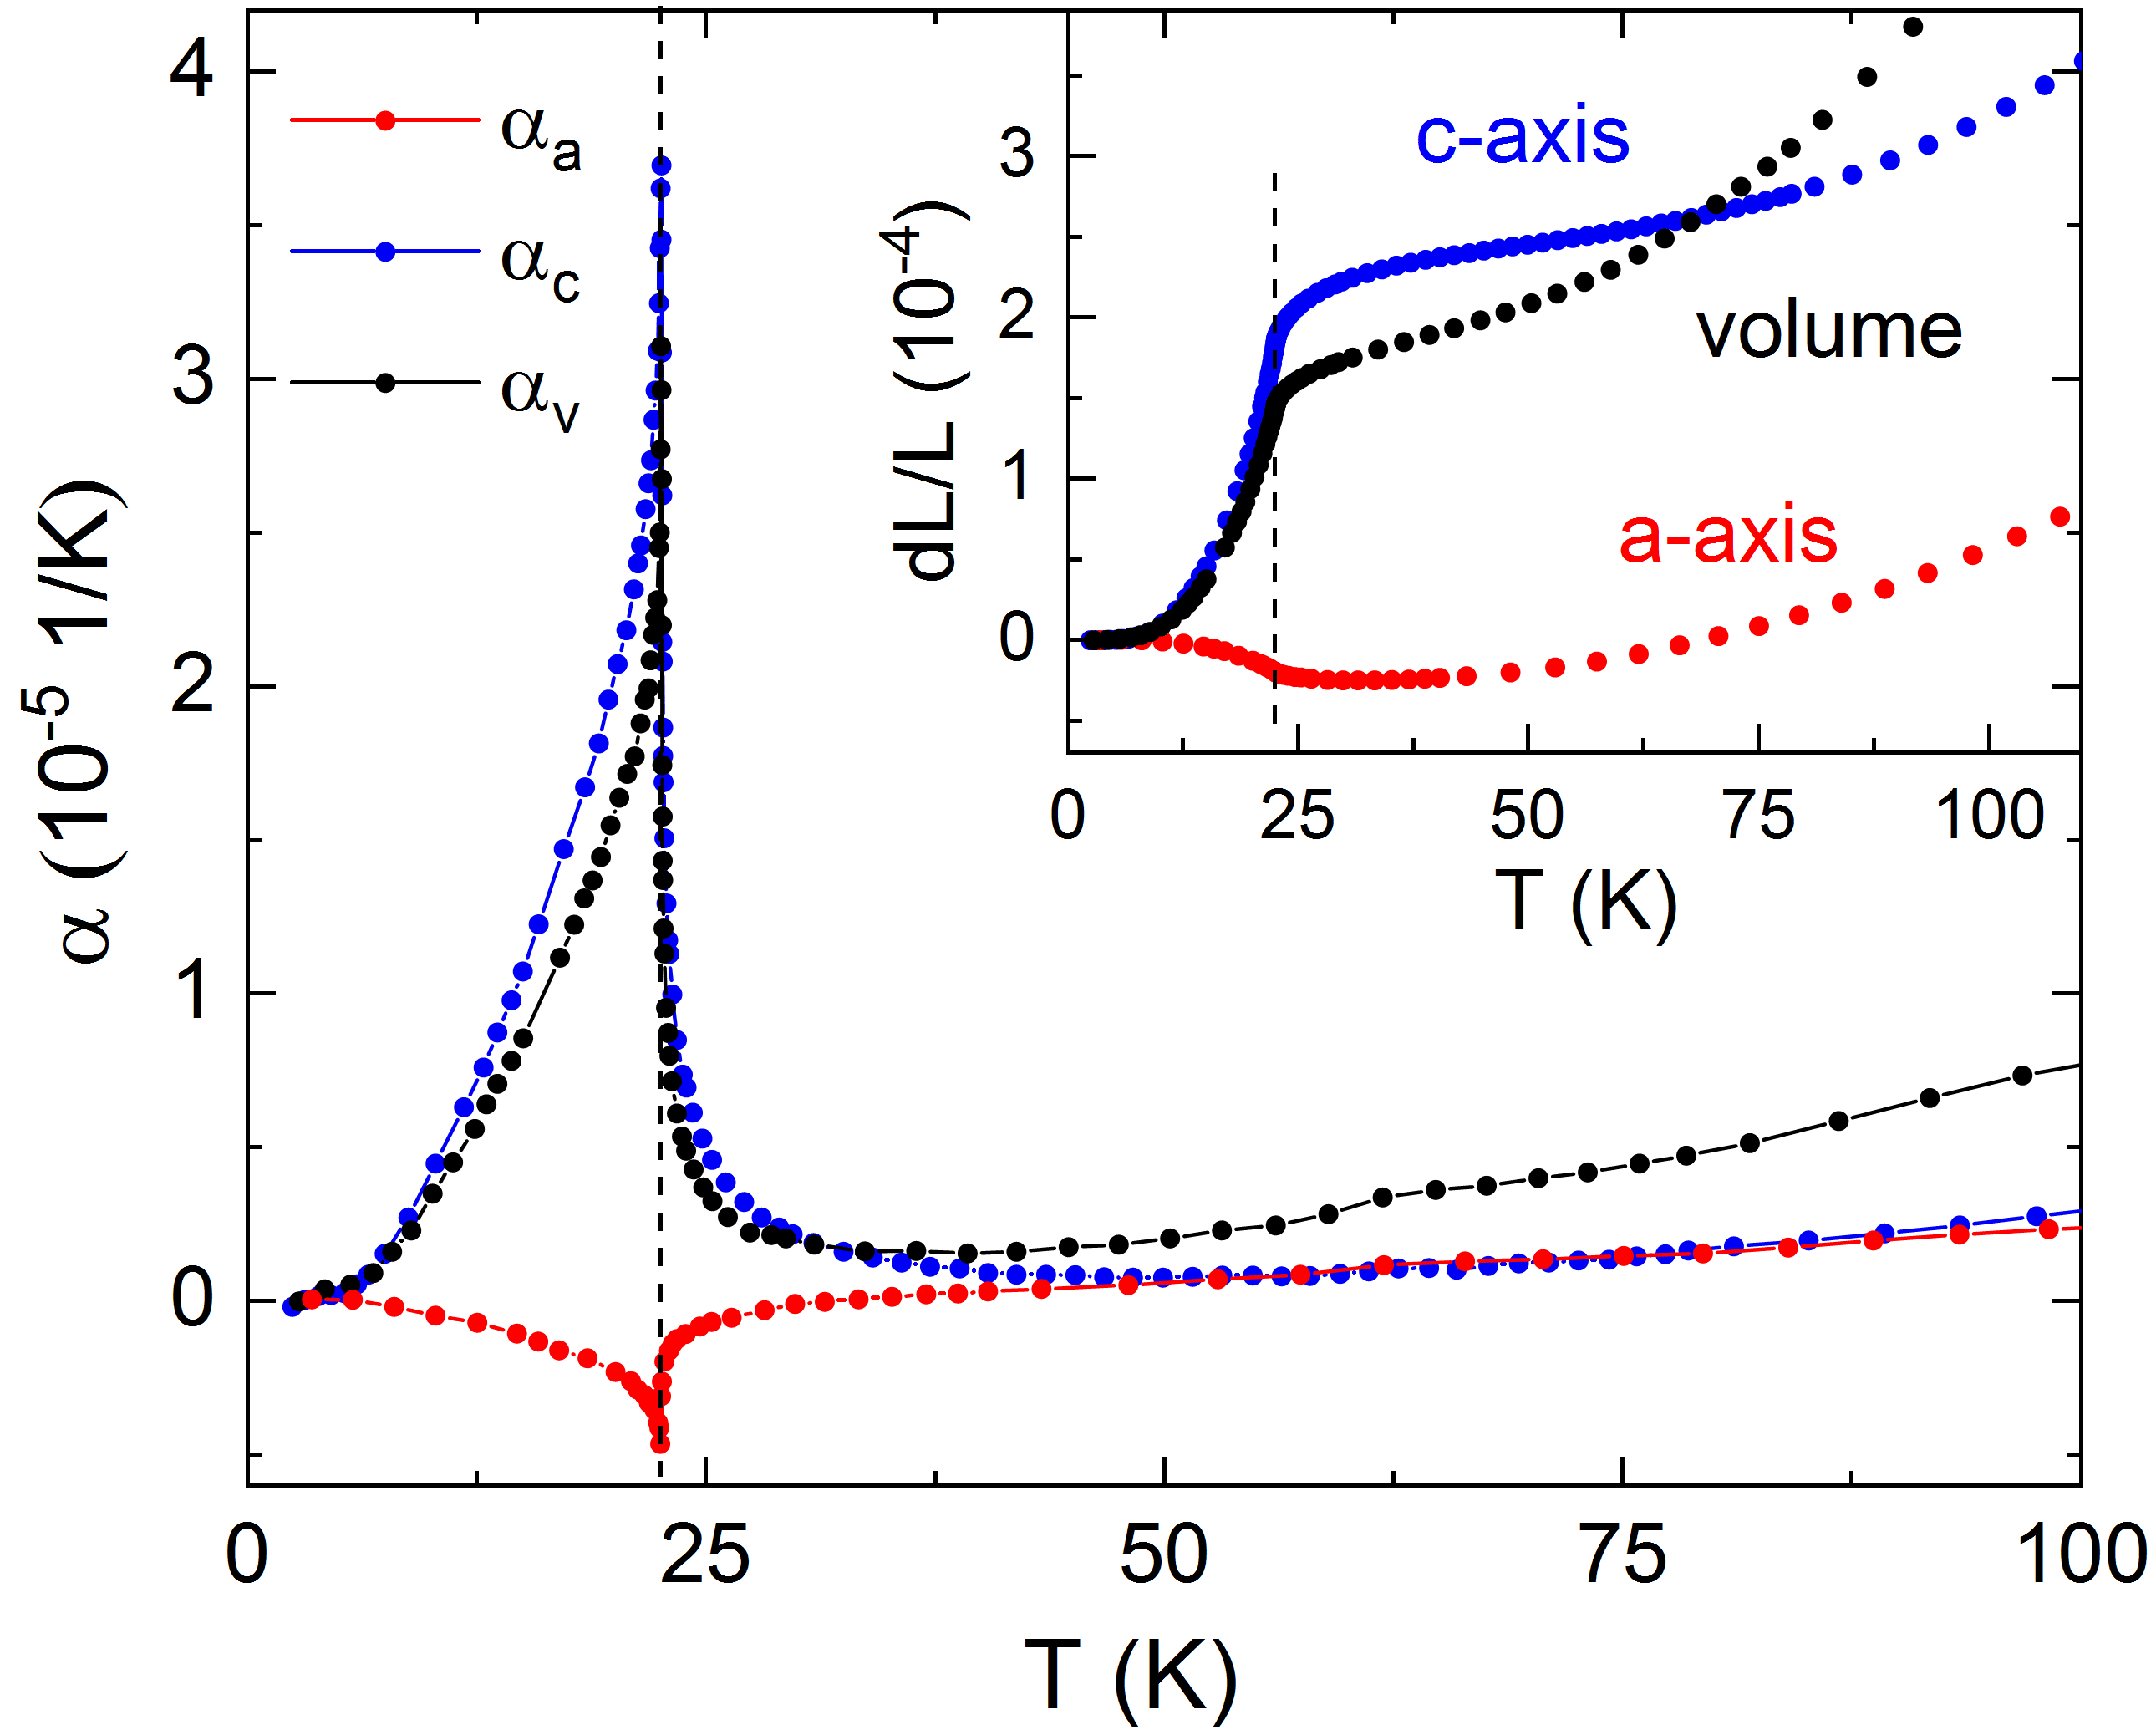
The evolution of long range magnetic order is associated with pronounced length changes as illustrated by strong anomalies in the uniaxial thermal expansion coefficients () and in the relative length changes (Fig. 3). The anomalies demonstrate the presence of significant magneto-elastic coupling in NiTiO3. The measured relative length changes shown in the inset of Fig. 3 signal shrinking of the -axis and increase of the -axis upon evolution of magnetic order at . Thus, the signs of the anomalies indicate positive uniaxial pressure dependence of for pressure along -axis, i.e , whereas the anomaly in indicates being negative and considerably smaller. The anomaly in the volume thermal expansion coefficient implies a significant positive pressure dependency of . In addition, opposite sign of the anomalies in and allows to conclude that effects in the thermal expansion associated with magnetic order extend up to about 50 K which agrees to the temperature regime where magnetic entropy changes mark the onset of short-range magnetic correlations.
IV.2 Magnetic phase diagram
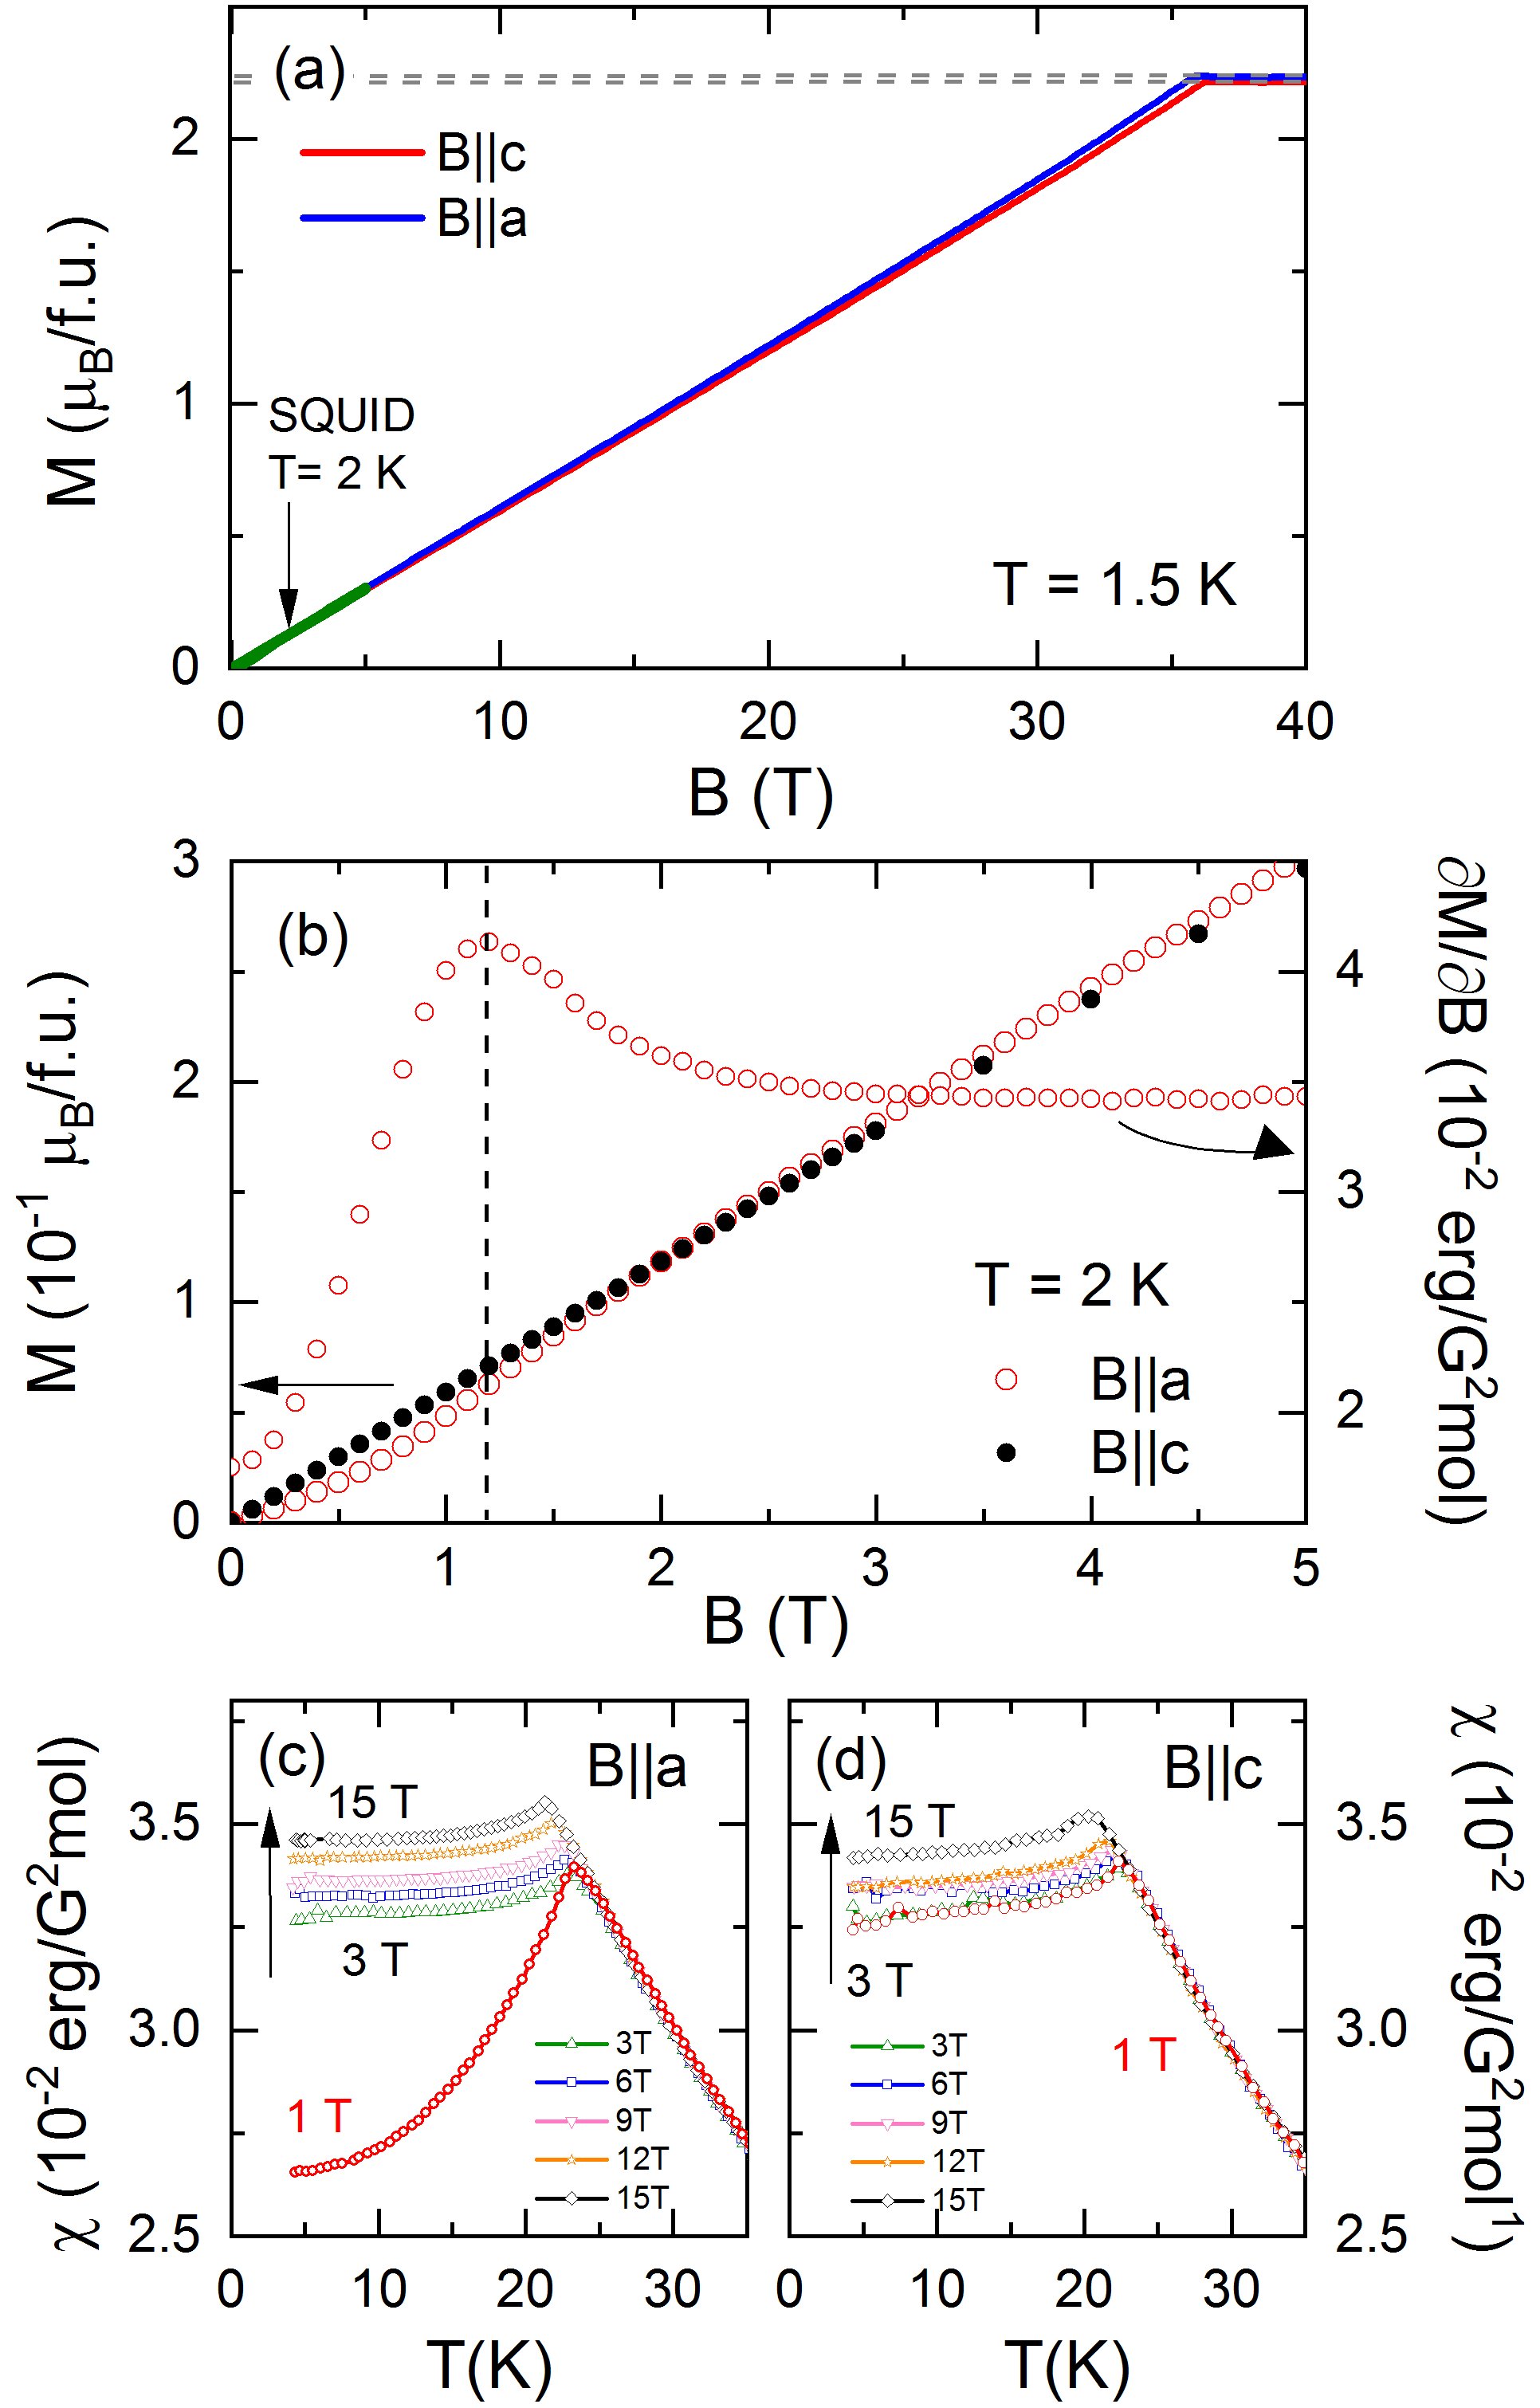
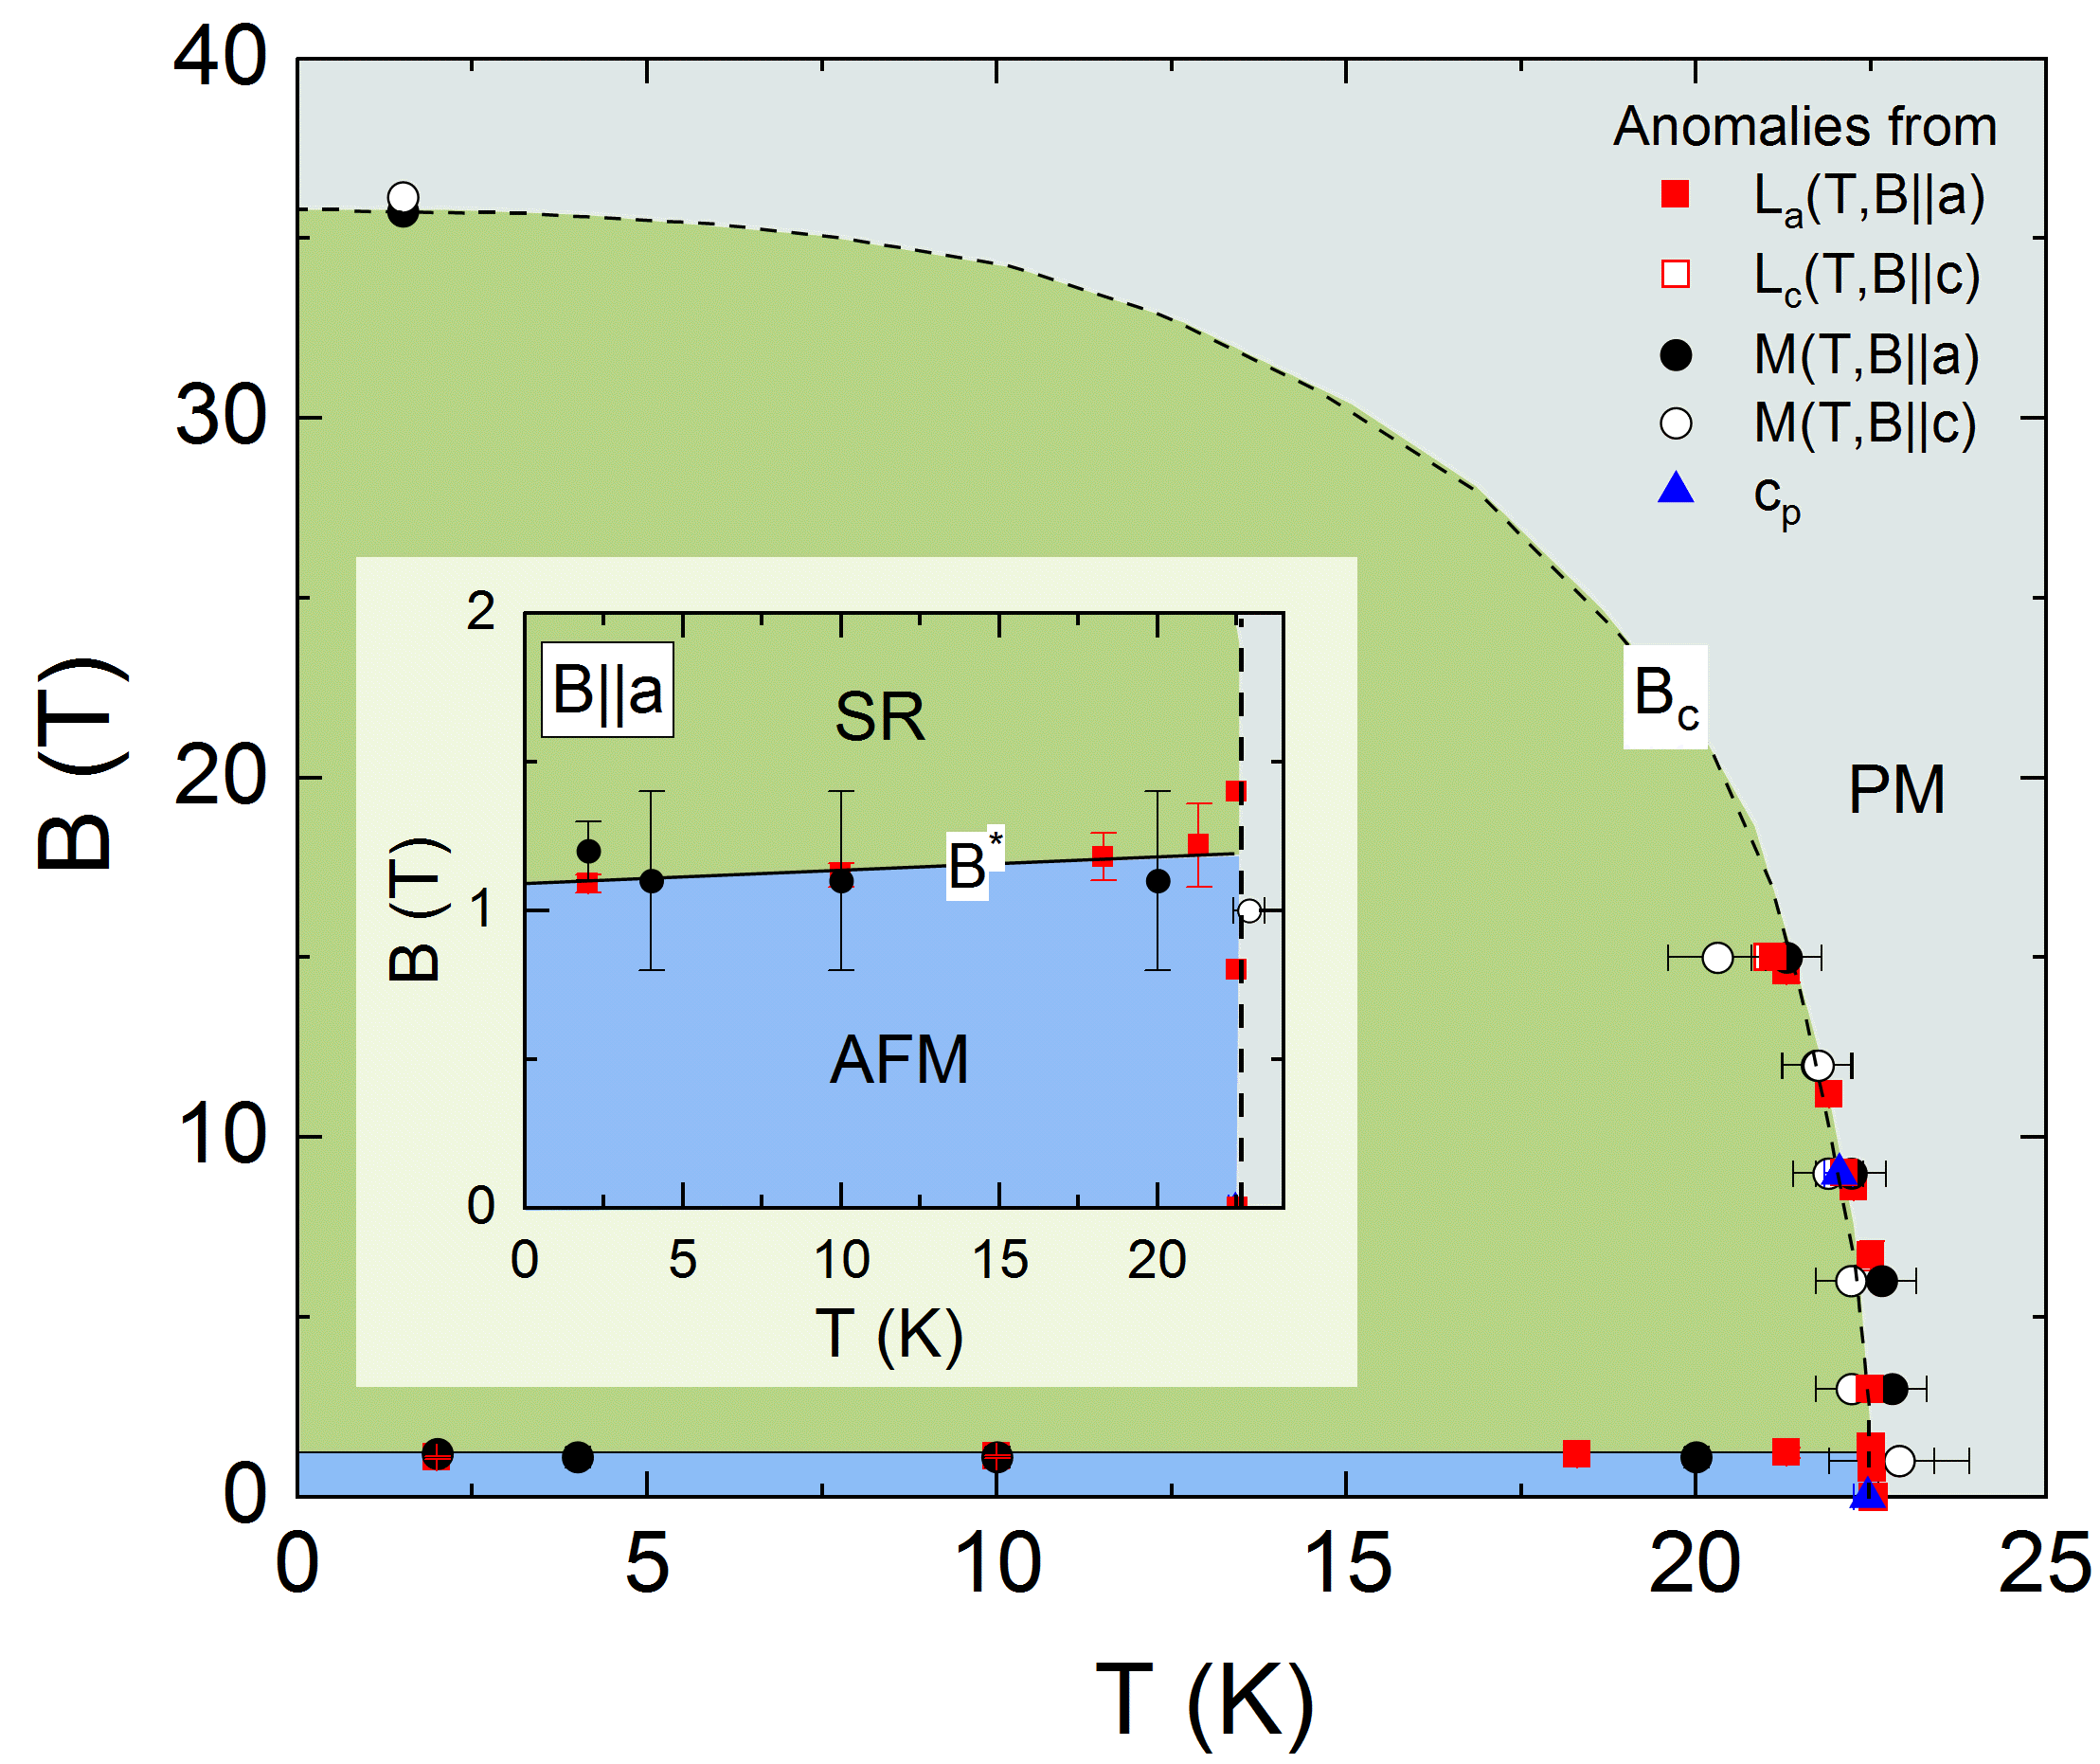
The saturation fields and moments at are deduced from pulsed-field magnetisation studies up to 60 T which are shown in Fig. 4a. For both field directions and , the magnetisation shows a linear behaviour in a wide range of applied fields. The saturation fields nearly coincide and amount to T. Also the saturation magnetisations as indicated by the dashed horizontal lines in Fig. 4a agree within error bars at . Assuming the spin-only momentum yields a -factor of which agrees well with the value of derived from the Curie-Weiss fit to the static magnetic susceptibility presented in Fig. 2. A more detailed look at the low-field behaviour in Fig. 4b, at K, confirms that linearity of vs. extends to zero magnetic field while non-linear behaviour is observed when the magnetic field is applied along the -axis. To be specific, the derivative of the magnetization with respect to magnetic field shows a broad peak centered at T and subsequently a constant behaviour (see Fig. 4b). The data suggest spin reorientation which we attribute to finite anisotropy in the -plane. At K, the magnetisation jump at is estimated to /f.u. Remaining slight non-linearity above is indicated by the static magnetic susceptibility measured in magnetic fields up to 15 T (Fig. 4c and d). While there is no significant field effect for , the data exhibit a monotonous change for at applied fields T as compared to T. Overall, the data confirm spin-reorientation behaviour as for T (i.e., above ) the susceptibility attains an almost constant value below whereas it decreases sharply for T. In addition, the phase boundary () marked as peak in the static susceptibility is determined.
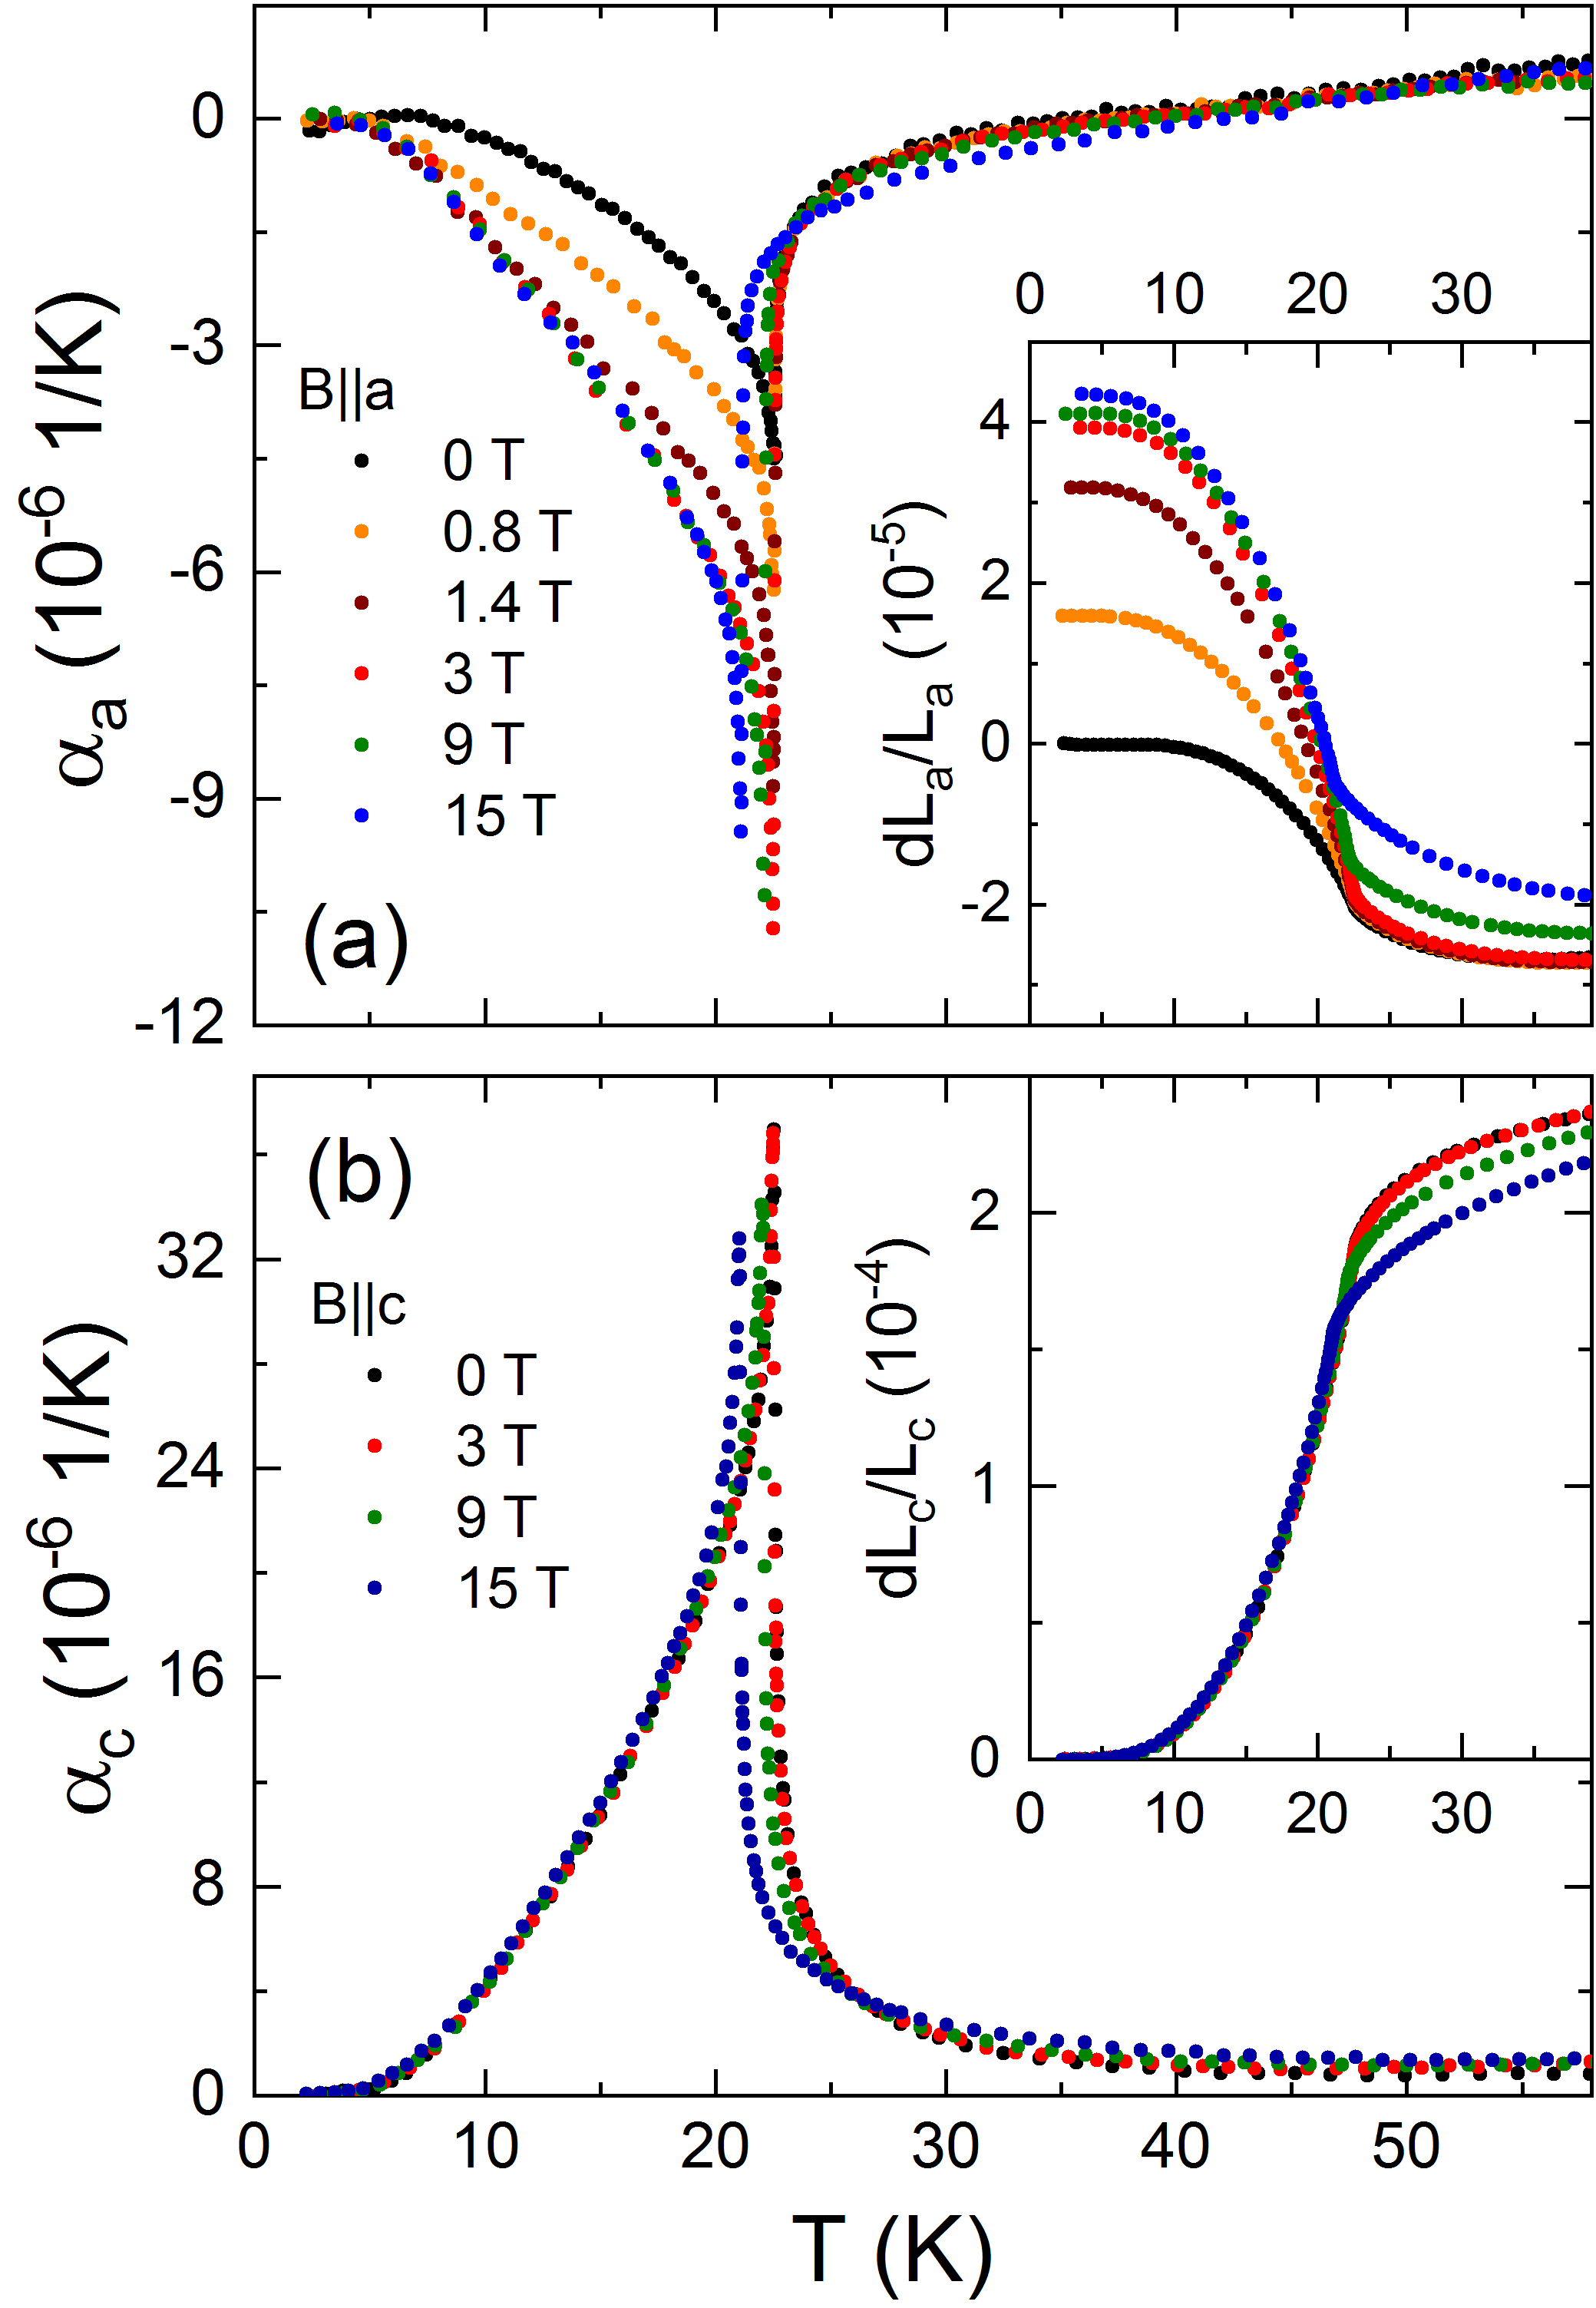
Sharp lambda-shaped anomalies observed in () in external magnetic fields (Fig. 5) enable to further determine the phase boundaries and to study the magnetic field effect on the lattice parameters. While the shape of the anomalies is not significantly affected by magnetic fields, expectedly shifts to lower temperatures upon application of external magnetic fields. For both field directions, a similar shift of K is observed when applying T. This corroborates well with the magnetization data in Fig. 4c,d and signals overlying phase boundaries for applied along the - and -axis, respectively (see Fig. 6). Corresponding anomalies signalling () (or synonymously the temperature dependence of the critical field which signals melting of magnetic order, too) appear in the relative length changes versus magnetic field (Fig. 7, see below) and in the magnetostriction coefficients (see supplement Fig. S1) and enable constructing the magnetic phase diagram displayed in Fig. 6. Up to 15 T, () obeys a square-root behaviour.
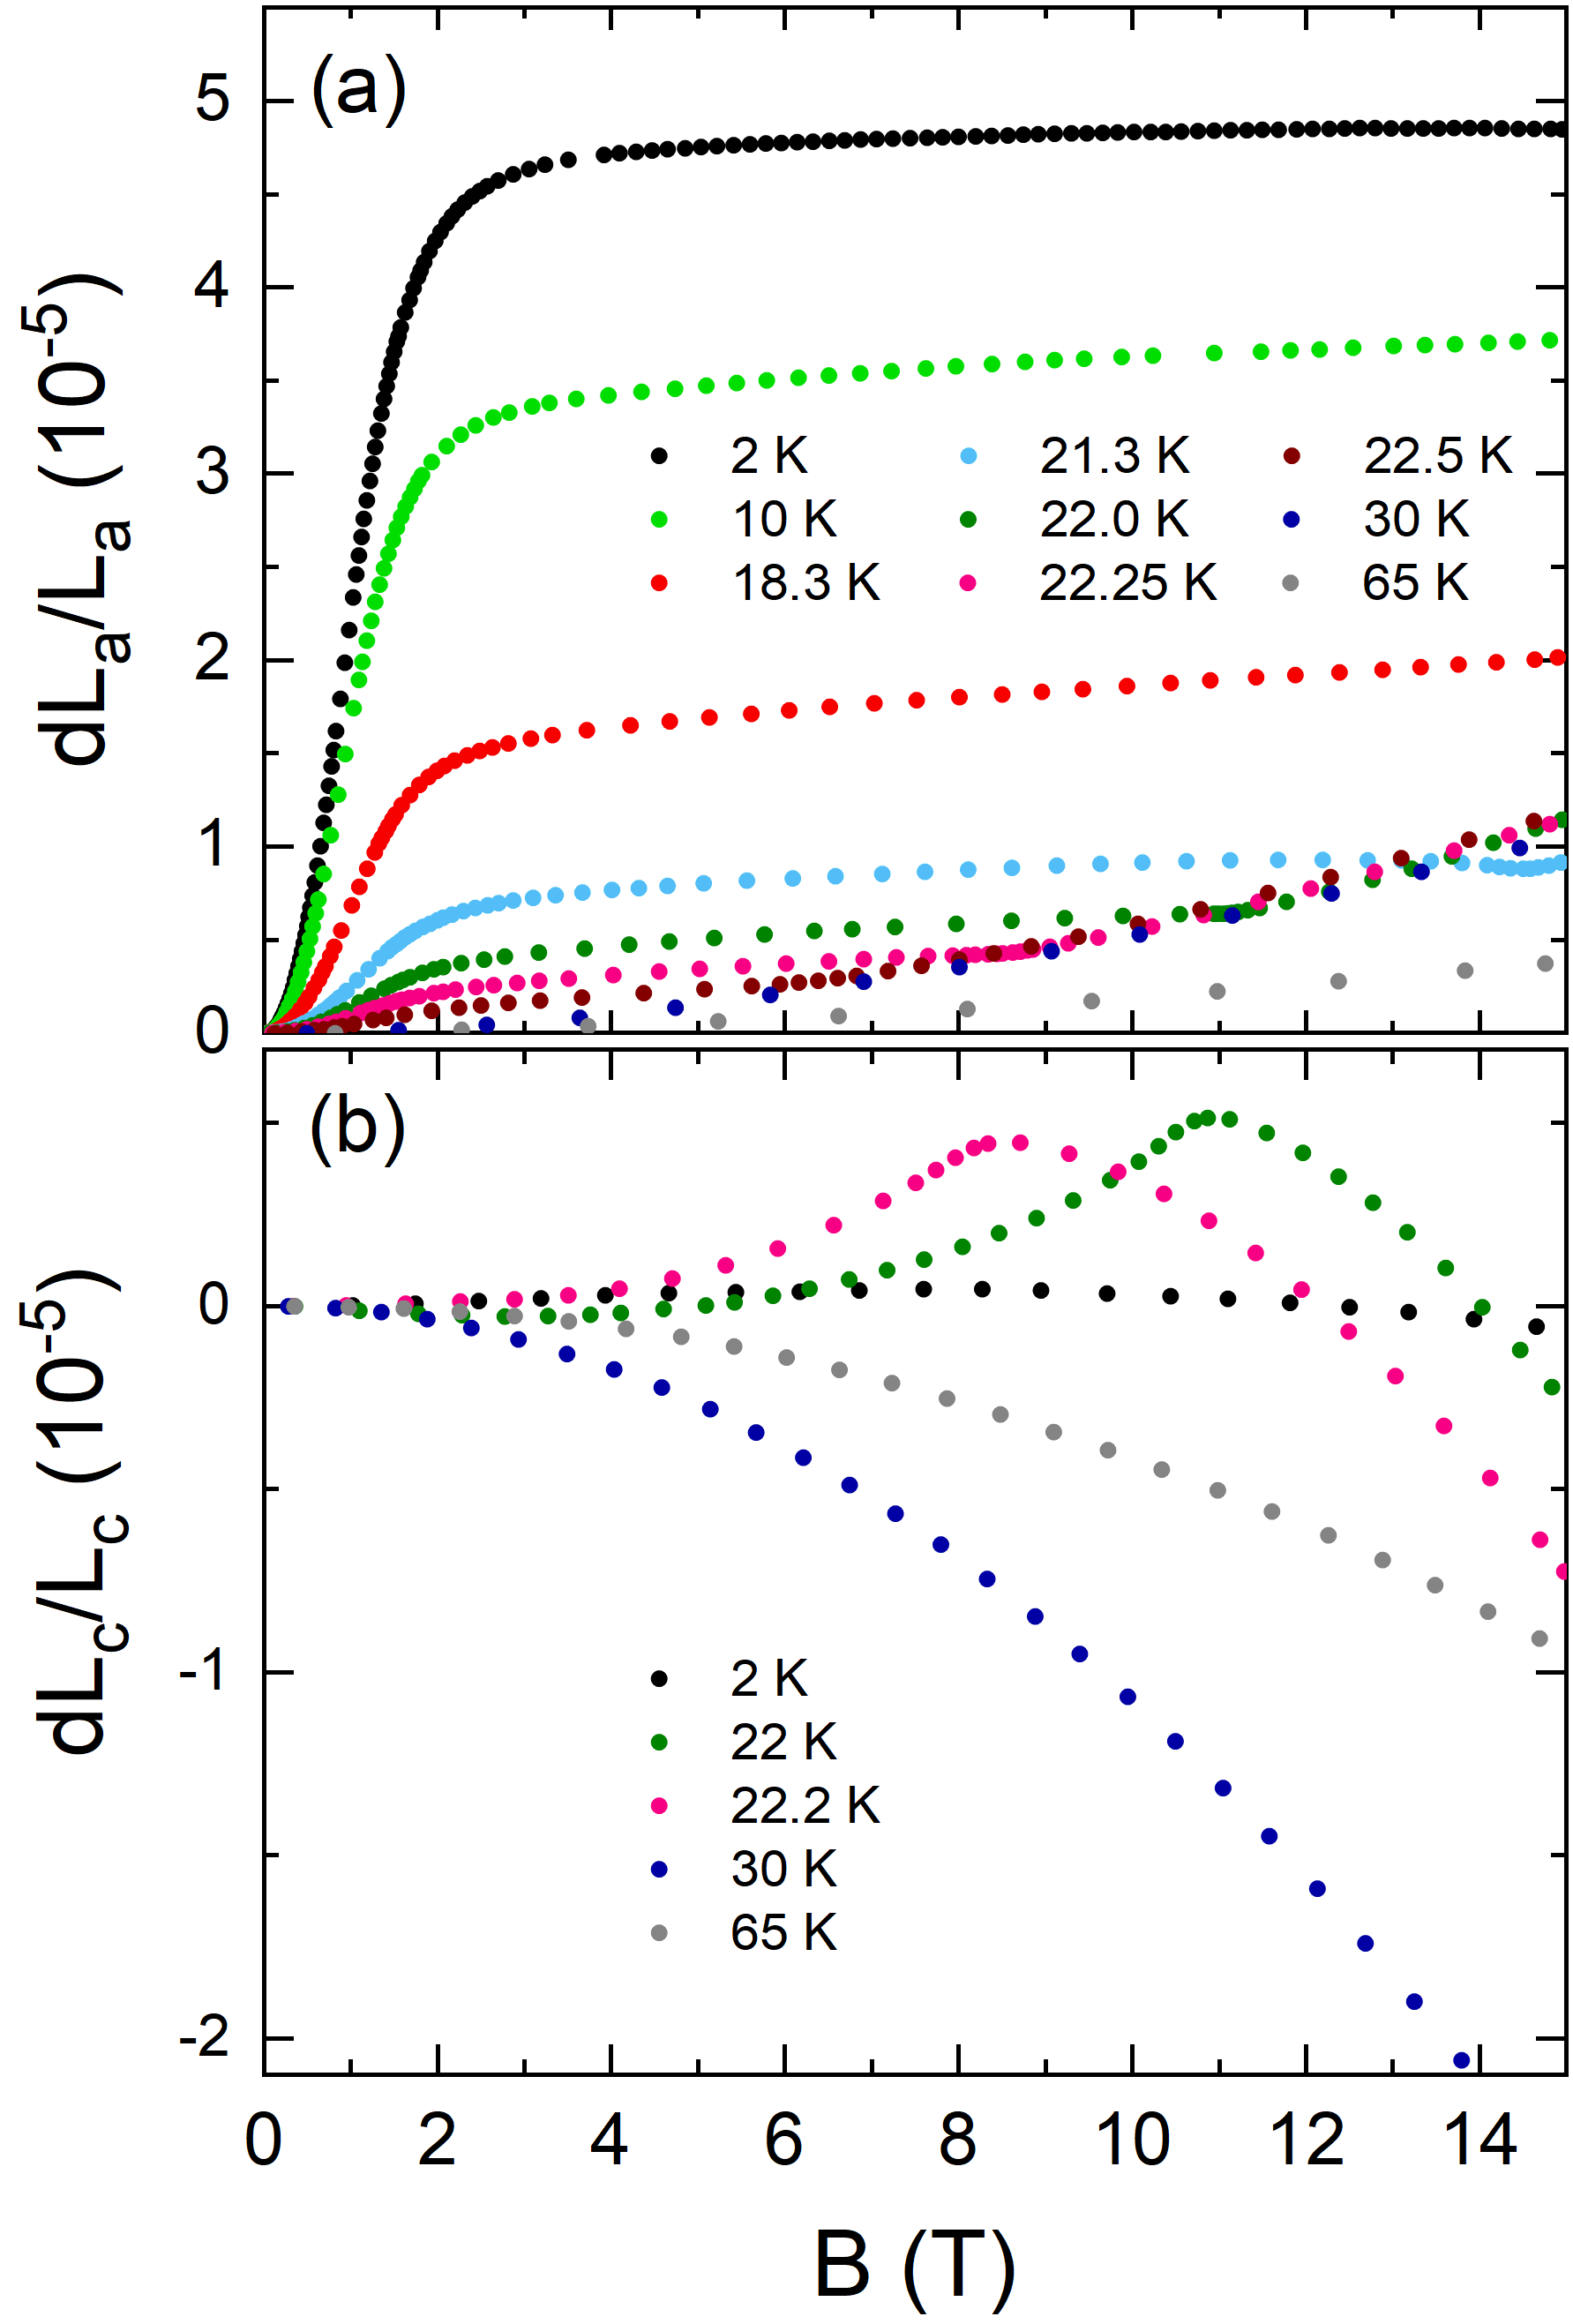
The thermal expansion in magnetic field and the magnetostriction data in Figs. 5 and 7, respectively, show small increase of the -axis and decrease of the -axis in magnetic fields applied in the respective directions. Interestingly, except for effects associated with suppression of , there are no large length changes driven by T. Correspondingly, the magnetostriction , at 2 K (see supplement Fig. S1), is small and amounts to a few 10-7 T-1 only. While a similar behaviour is found for at T, there are pronounced length changes at low fields which we associate with spin-reorientation. The corresponding half height of these jump-like anomalies in is at consistent fields as the peak in and yields (see Fig. 6). Notably, these field-induced changes imply that the total thermal expansion changes in the magnetically ordered phase become considerably larger in applied magnetic fields (see the inset of Fig. 5a). Quantitatively, spin-reorientation at 2 K is associated with length changes of . Upon heating, the size of magnetostriction decreases but, nonetheless, significantly exceeds length changes observed at .
IV.3 Discussion
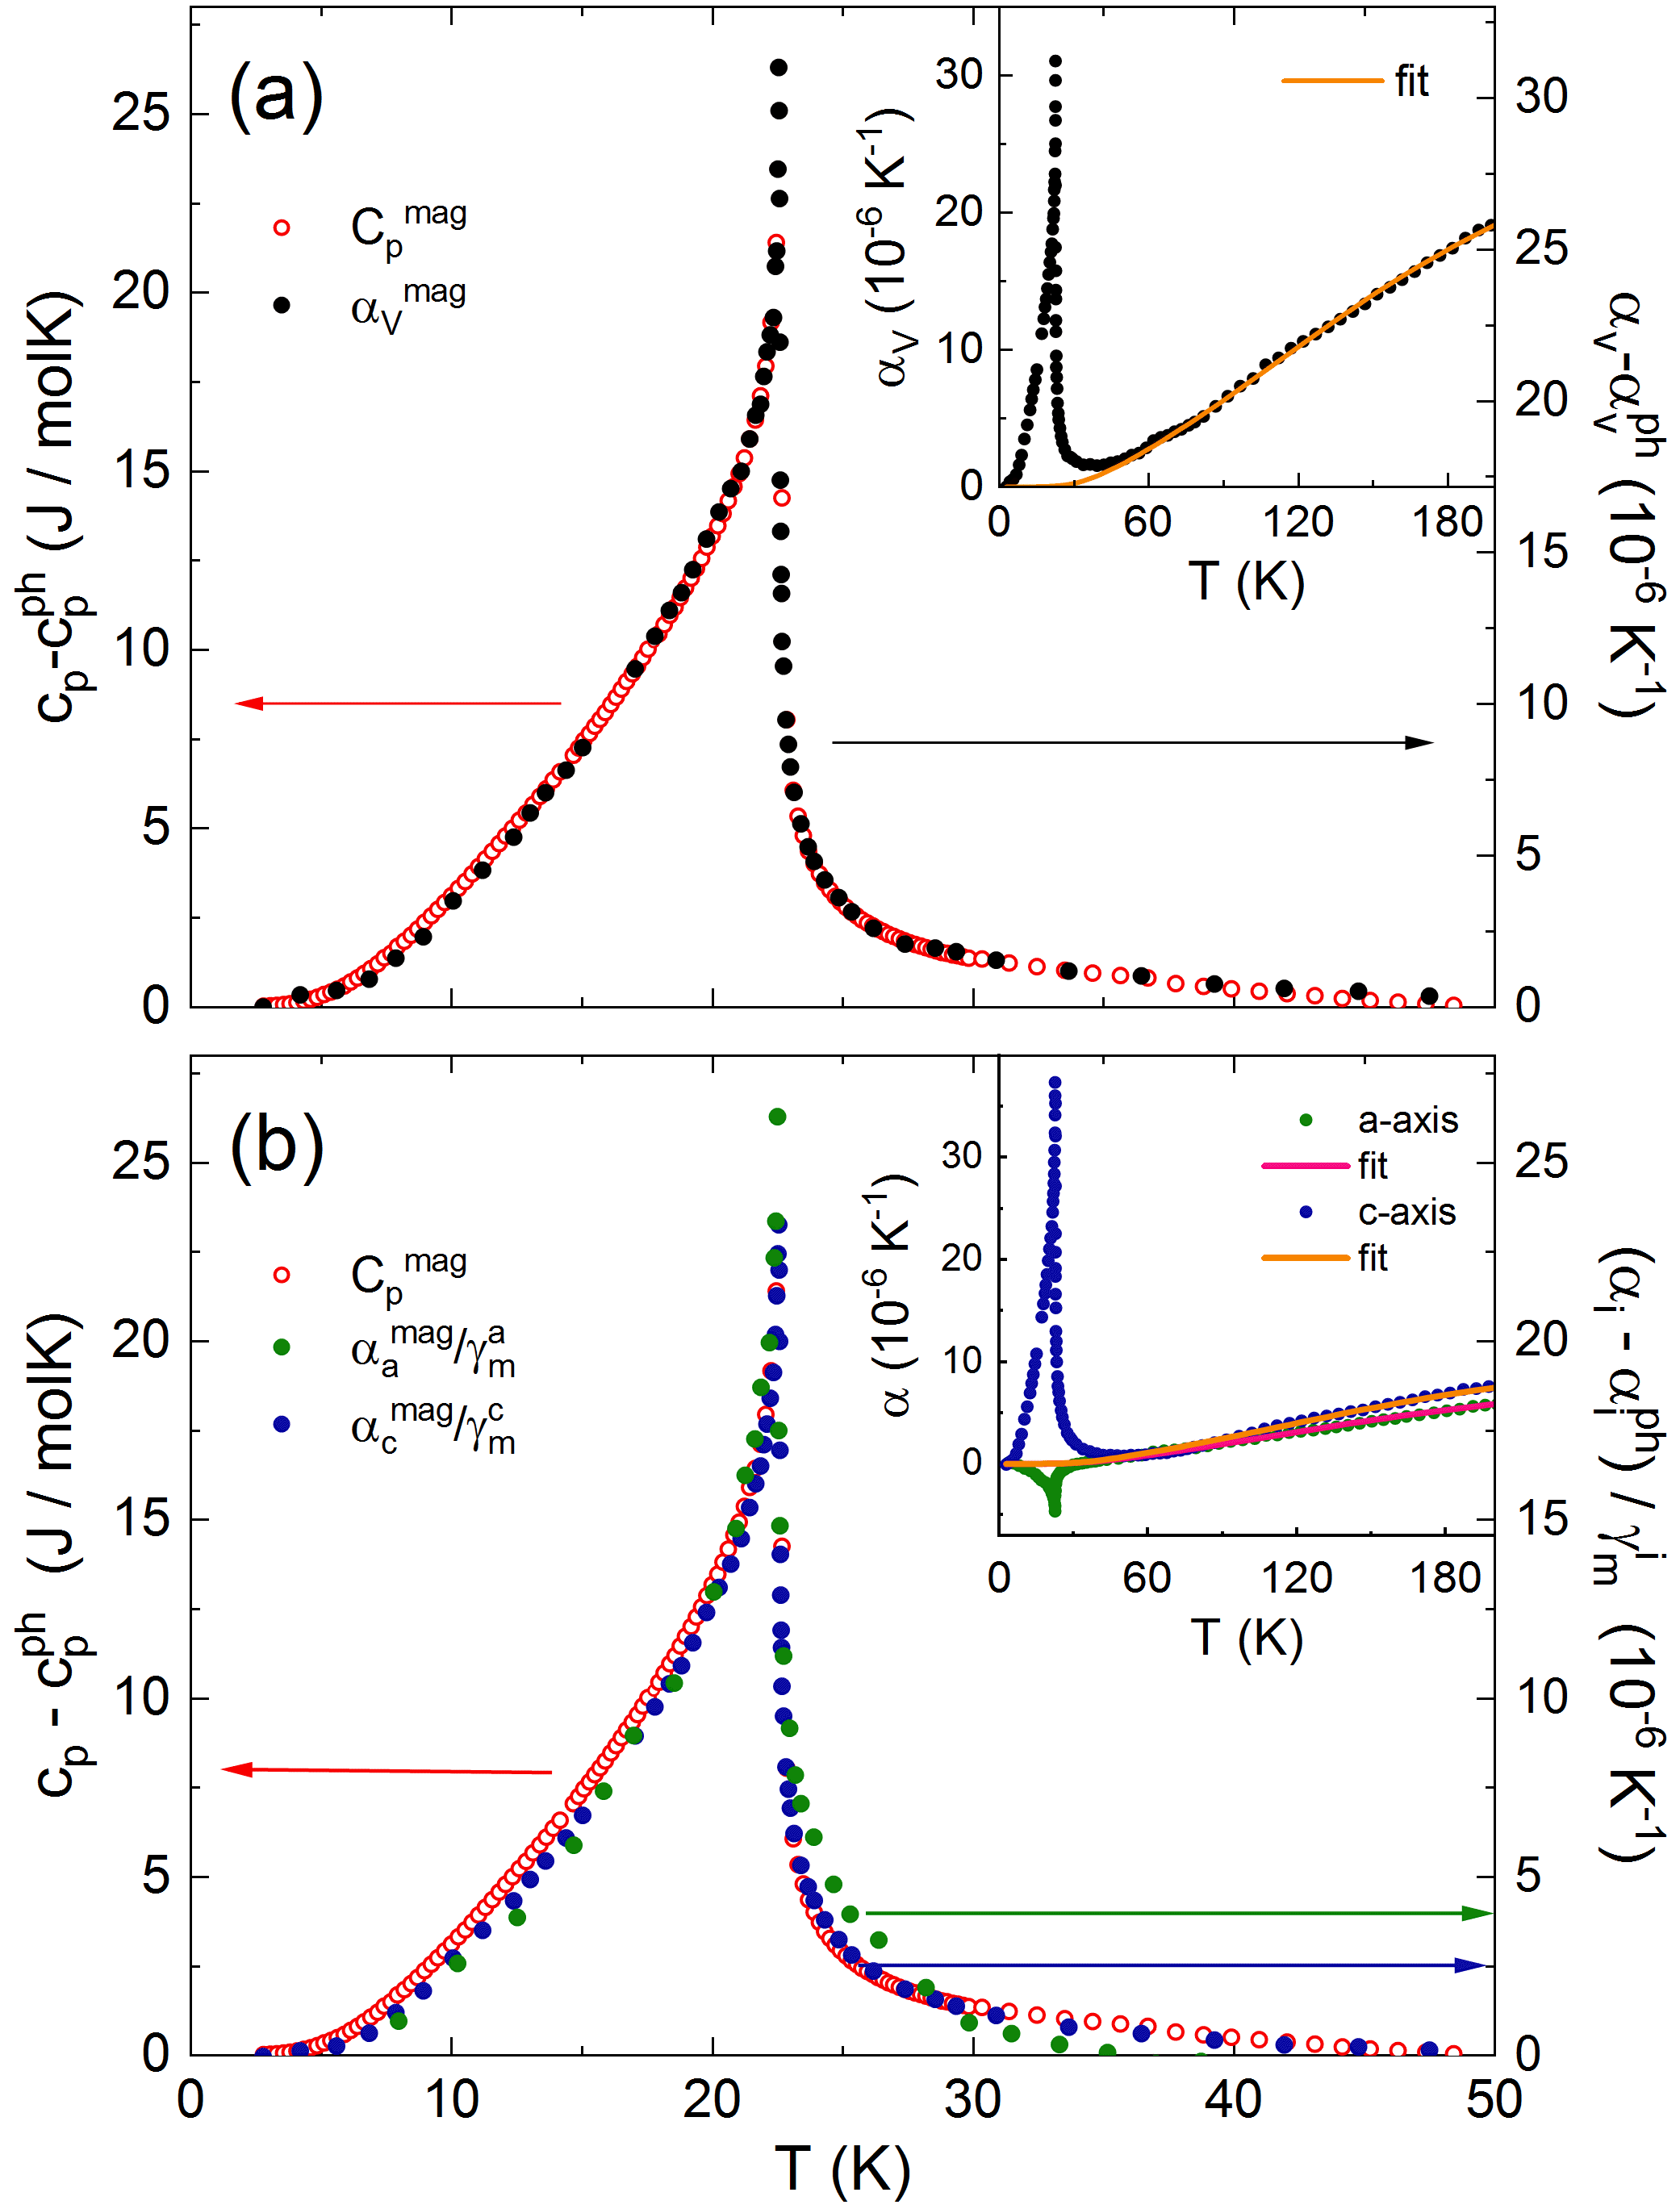
Comparing the non-phononic contributions to the thermal expansion coefficient and to the specific heat enables further conclusions on the nature of the associated (i.e., magnetic) entropy changes and on the hydrostatic pressure dependencies. In order to assess the magnetic contribution to the volume thermal expansion coefficient, , we have approximated the phonon contribution, , by scaling the background specific heat (cf. Fig. 2) appropriately. For that purpose, a Debye-Einstein model with fixed and of the fit to the specific heat data has been fitted to the high-temperature data of leaving only the two associated lattice Grüneisen parameters and as scaling factors. Similar to the specific heat, at K, is well described by the phonon background with mol/J and mol/J as shown in the inset of Fig. 8.
The resulting non-phonon contribution to the thermal expansion coefficient is shown in Fig. 8a (right ordinate) together with the respective magnetic specific heat data (left ordinate). Both quantities are proportional to each other in the entire temperature range. In the sense of a Grüneisen analysis, such behaviour implies the presence of a single dominant degree of freedom from which we conclude that a single magnetic degree of freedom drives the observed non-phonon length and entropy changes. The corresponding scaling parameter obtained is the magnetic Grüneisen parameter / mol/J. Using the Ehrenfest relation, the obtained value of enables to determine the hydrostatic pressure dependence K/GPa which is deduced using the molar volume of cm3/mol. Elaborating Grüneisen scaling for the uniaxial thermal expansion coefficients individually, good proportionality is confirmed between and and as well (Fig. 8b). This yields the uniaxial pressure dependencies of K/GPa and K/GPa for pressure applied along the - and -axis, respectively. These values are fully consistent with the obtained hydrostatic pressure dependence.
Magnetostriction measurements in the paramagnetic regime, i.e., where , enable to extract the uniaxial pressure dependence of magnetic susceptibility by exploiting the relation Johannsen et al. (2005). Plotting the data accordingly (see supplement Fig. S2) allows to read off % GPa-1 and % GPa-1 at 30 and 65 K, respectively, as well as % GPa-1 and % GPa-1 at respective temperatures. Qualitatively, this suggests AFM exchange interactions to be strengthened and FM ones to be weakened by uniaxial pressure along the -axis. While, uniaxial pressure along the -axis is found to result in opposite effects. Considering the results of Grüneisen analysis presented above, i.e., predominance of only one energy scale as well as and , suggests that the value of is mostly affected by the (in-plane) FM exchange interactions. This is also reflected in the increase of and Weiss temperature when substituting Ni over Co to Fe in TiO3 whereby even is observed for FeTiO3 Stickler et al. (1967).
The phase boundary of spin-reorientation features a very small slope T/K. Considering the magnetisation jump at and exploiting the Clausius-Clapeyron relation, we estimate associated entropy changes J/(mol K) Stockert et al. (2012). This implies only insignificant entropy changes associated with spin reorientation. On the other hand, in applied magnetic fields , our data show that the total thermal expansion changes in the magnetically ordered phase become significantly larger (see the inset of Fig. 5). This suggests that Grüneisen scaling which is valid at T as evidenced by Fig. 8 is broken in magnetic fields . Somehow correspondingly, uniaxial pressure dependence of is very large. Using the measured jumps in relative length changes () and magnetization () at and 2 K and exploiting the Clausius-Clapeyron relation yields T/GPa. This is a huge value similar to what has been observed, i.e., in TlCuCl3 Johannsen et al. (2005). It implies strong effects of uniaxial pressure along the -axis so that applying would strongly enhance the spin reorientation field while it would vanish for tiny hypothetical negative pressure.
Above the , i.e., in the absence of long-range spin order where short-range correlations are still present as, e.g., indicated by the specific heat data, magnetostriction is relatively large in NiTiO3. This observation agrees to the fact that both and become significantly larger when exceeds which appears at 21 K 22.2 K in the accessible field range (see Fig. 7 and supplement Fig. S1). We conclude that, in a paramagnetic but yet correlated regime, magnetic fields along the - and the -axis, respectively, yield reorientation of spins which are short-range ordered in this temperature and field ranges.
Recently, anomalies in the electrical permittivity at and strongly field-dependant magnetocapacitance close to have been observed in polycrystalline NiTiO3 indicating the presence of significant magneto-dielectric coupling Harada et al. (2016). The shape of the reported Harada et al. (2016) temperature dependence of is very similar to the length and volume changes observed by our thermal expansion measurements (see supplement Fig. S3) indicating an almost linear relation between electrical permittivity and structural distortion below . Conclusively, and reported magneto-dielectric coupling are directly related to the length changes and the magneto-elastic coupling. Furthermore, driving entropy changes of the low-temperature effects are purely of magnetic nature as evidenced by Grüneisen analysis presented above. We conclude that magneto-dielectric coupling is secondarily mediated via structural changes and that magnetic degrees of freedom constitute a single common origin for the dielectric, structural and magnetic changes evolving at and below in NiTiO3. Note, however, that magnetocapacitance data on polycrystals (at K) do not show anomalies at though spin-reorientation is associated with significant length changes. One might speculate that the polycrystalline nature of samples studied in Ref. Harada et al., 2016 masks such effects.
V Summary
In summary, we report growth and characterization of large and high quality NiTiO3 single crystals by means of the optical floating-zone technique. The anisotropic phase diagram is constructed by means of pulsed and static magnetization, specific heat, thermal expansion, and magnetostriction data. It features a spin-reorientation transition at T which is accompanied by pronounced length changes. In addition, high-resolution thermal expansion data are used for detailed analysis of pronounced magneto-elastic coupling in NiTiO3. Grüneisen scaling of the magnetic contributions to and implies a single magnetic degree of freedom driving the observed length and entropy changes at . Our analysis suggests in-plane ferromagnetic interactions mainly determine the value of . Relating our findings to recently reported strong magnetodielectric effects in NiTiO3 implies the essential role of structural changes for magneto-dielectric coupling and suggests a single magnetic origin of low-temperature dielectric, structural and magnetic changes in NiTiO3.
Acknowledgements.
Partial support by Deutsche Forschungsgemeinschaft (DFG) via Project KL 1824/13-1 is gratefully acknowledged. KD acknowledges fellowship by the IMPRS-QD. SS acknowledges financial support from the Science and Engineering Research Board (SERB) under grant no. EMR/2016/003792. We acknowledge the support of the HLD at HZDR, member of the European Magnetic Field Laboratory (EMFL).References
- Harada et al. (2016) J. K. Harada, L. Balhorn, J. Hazi, M. C. Kemei, and R. Seshadri, Phys. Rev. B 93, 104404 (2016).
- Spaldin and Fiebig (2005) N. A. Spaldin and M. Fiebig, Science 309, 391 (2005).
- Barth and E. (1934) T. Barth and P. E., Zeit. für Krist. p. 265 (1934).
- Stickler et al. (1967) J. J. Stickler, S. Kern, A. Wold, and G. S. Heller, Phys. Rev. 164, 765 (1967).
- Watanabe et al. (1980) H. Watanabe, H. Yamauchi, and H. Takei, J.Magn. Magnetic Mat. 15-18, 549 (1980).
- Heller et al. (1963) G. S. Heller, J. J. Stickler, S. Kern, and A. Wold, J. Applied Phys. 34, 1033 (1963).
- Shirane et al. (1959) G. Shirane, S. J. Pickart, and Y. Ishikawa, J.Phys.Soc. Japan 14, 1352 (1959).
- Newnham et al. (1964) R. E. Newnham, J. H. Fang, and R. P. Santoro, Acta Crystallographica 17, 240 (1964).
- Y. et al. (1986) Y. Y., K. H., T. H., G. A.I., and S. G., Solid State Comm. 59, 865 (1986).
- Charilaou et al. (2012) M. Charilaou, D. Sheptyakov, J. F. Löffler, and A. U. Gehring, Phys. Rev. B 86, 024439 (2012).
- Mufti et al. (2011) N. Mufti, G. R. Blake, M. Mostovoy, S. Riyadi, A. A. Nugroho, and T. T. M. Palstra, Phys. Rev. B 83, 104416 (2011).
- Rodríguez-Carvajal (1993) J. Rodríguez-Carvajal, Physica B: Condens. Matt. 192, 55 (1993).
- Klingeler et al. (2006) R. Klingeler, B. Büchner, K.-Y. Choi, V. Kataev, U. Ammerahl, A. Revcolevschi, and J. Schnack, Phys. Rev. B 73, 014426 (2006).
- Skourski et al. (2011) Y. Skourski, M. D. Kuz’min, K. P. Skokov, A. V. Andreev, and J. Wosnitza, Phys. Rev. B 83, 214420 (2011).
- Küchler et al. (2012) R. Küchler, T. Bauer, M. Brando, and F. Steglich, Rev. of Sci. Instruments 83, 095102 (2012).
- Hergett et al. (2019) W. Hergett, C. Neef, H. Wadepohl, H.-P. Meyer, M. M. Abdel-Hafiez, C. Ritter, E. Thauer, and R. Klingeler, J.Cryst. Growth 515, 37 (2019).
- Neef et al. (2017) C. Neef, H. Wadepohl, H.-P. Meyer, and R. Klingeler, J. Cryst. Growth 462, 50 (2017).
- Wizent et al. (2009) N. Wizent, G. Behr, F. Lipps, I. Hellmann, R. Klingeler, V. Kataev, W. Löser, N. Sato, and B. Büchner, J. Cryst. Growth 311, 1273 (2009).
- Wizent et al. (2011) N. Wizent, G. Behr, W. Löser, B. Büchner, and R. Klingeler, J. Cryst. Growth 318, 995 (2011).
- Wizent et al. (2014) N. Wizent, N. Leps, G. Behr, R. Klingeler, B. Büchner, and W. Löser, J. Cryst. Growth 401, 596 (2014).
- Aschcroft and Mermin (1976) N. Aschcroft and N. Mermin, Solid State Physics (Cengage Learning, 1976).
- Johannsen et al. (2005) N. Johannsen, A. Vasiliev, A. Oosawa, H. Tanaka, and T. Lorenz, Phys. Rev. Lett. 95, 017205 (2005).
- Stockert et al. (2012) U. Stockert, N. Leps, L. Wang, G. Behr, S. Wurmehl, and B. Büchner, Phys. Rev. B 86, 144407 (2012).